Attached files
| file | filename |
|---|---|
| 8-K - 8-K - ARCH RESOURCES, INC. | a13-11716_18k.htm |
Exhibit 99.1
|
|
Arch Coal, Inc. Investor Presentation May 2013 |
|
|
Slide 2 Forward-Looking Information This presentation contains “forward-looking statements” – that is, statements related to future, not past, events. In this context, forward-looking statements often address our expected future business and financial performance, and often contain words such as “expects,” “anticipates,” “intends,” “plans,” “believes,” “seeks,” or “will.” Forward-looking statements by their nature address matters that are, to different degrees, uncertain. For us, particular uncertainties arise from changes in the demand for our coal by the domestic electric generation industry; from legislation and regulations relating to the Clean Air Act and other environmental initiatives; from operational, geological, permit, labor and weather-related factors; from fluctuations in the amount of cash we generate from operations; from future integration of acquired businesses; and from numerous other matters of national, regional and global scale, including those of a political, economic, business, competitive or regulatory nature. These uncertainties may cause our actual future results to be materially different than those expressed in our forward-looking statements. We do not undertake to update our forward-looking statements, whether as a result of new information, future events or otherwise, except as may be required by law. For a description of some of the risks and uncertainties that may affect our future results, you should see the risk factors described from time to time in the reports we file with the Securities and Exchange Commission. |
|
|
Arch is among the top coal producers and marketers in the world Slide 3 Sources: ACI, MSHA, Ventyx, company filings, press articles * Pro forma Top 10 Global Coal Producers (2012, in millions of metric tonnes) Government affiliated Arch is one of the largest coal producers globally, and is the third largest private-sector producer based on volume. |
|
|
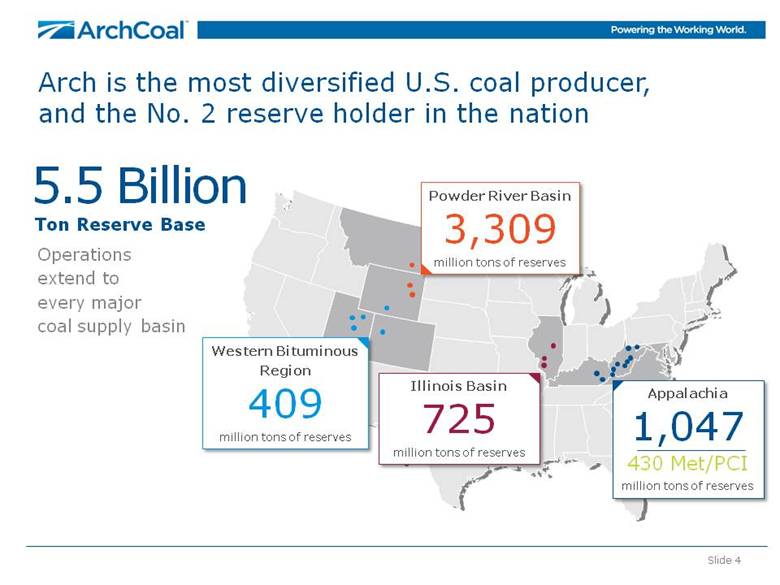
Arch is the most diversified U.S. coal producer, and the No. 2 reserve holder in the nation Operations extend to every major coal supply basin Slide 4 5.5 Billion Ton Reserve Base Western Bituminous Region 409 million tons of reserves Illinois Basin 725 million tons of reserves Powder River Basin 3,309 million tons of reserves Appalachia 1,047 430 Met/PCI million tons of reserves |
|
|
Arch maintains an industry-leading position in safety and environmental compliance Arch’s average safety performance is four times better than the U.S. coal industry average Deep commitment to a behavior-based process drives continuous improvements in workplace safety and environmental care across all sites Slide 5 Sources: ACI, MSHA, State environmental agencies ACI Environmental Compliance (SMCRA violations based on state reports) Lost-Time Safety Incident Rate (per 200,000 employee-hours worked) Arch 5-year avg. = 0.66 Industry 5-year avg. = 2.65 ICG Acquisition ICG Acquisition 15 |
|
|
Arch has a balanced and diversified mine portfolio While Arch’s sales volumes are weighted toward low-cost Powder River Basin coal, the company’s revenue stream is diversified between eastern (increasingly metallurgical) and western regions — and cash margins are well balanced among all core operating regions. Slide 6 Sales Volumes (2012, in percent) Coal Revenues (2012, in percent) Cash Margins (2012, in percent) Powder River Basin Appalachia Western Bituminous & other thermal 74% 44% 29% 33% 38% 39% |
|
|
Arch has a leading, low-cost western thermal portfolio with meaningful available capacity Arch has a strong position in the PRB, the nation’s largest coal supply basin High-Btu, low-sulfur product Available, excess capacity to bring back as demand returns Expect PRB to expand domestically Pursuing export growth off West Coast Arch is the leading producer in the Western Bituminous Region Supply to remain constrained in region Targeting exports via Gulf/West Coast Slide 7 Sources: ACI, MSHA Western Bituminous Region (2012 production, in millions of tons) Southern Powder River Basin (2012 production, in millions of tons) |
|
|
Arch’s thermal platform in the Illinois Basin provides future opportunities Viper Mine is low-cost and highly competitive Arch owns a 49% equity stake in Knight Hawk, which sold over 4 million tons in 2012 Arch has built a large portfolio of low-chlorine assets in the basin All required permits received for the Lost Prairie Reserves, setting the stage for potential development in the future Slide 8 Sources: ACI, Ventyx *49% equity interest Legacy Arch Assets Former ICG Assets River Docks ACI Headquarters Illinois Basin Viper Mine Lost Prairie Reserves Knight Hawk* Macoupin Reserves 725 Million tons of reserves |
|
|
Arch’s Appalachian portfolio is low in cost — and is geared toward higher-margin met assets Slide 9 Sources: Central App Production as % of Appalachia* (Based on 1Q13 tons sold) Metallurgical Production as % of Appalachia* (Based on 1Q13 tons sold) Appalachian Cash Costs (1Q13 reported costs, $/ton) *CAPP cash costs of ~$80/ton based on independent estimates Peer earnings and SEC filings, MSHA and ACI |
|
|
Slide 10 Arch’s metallurgical coal platform is expanding and shifting towards higher-quality coking coals Leer Mine Sentinel (operating) ^ N 2011 ~ 2015 High Vol B & PCI Low Vol & High Vol A Metallurgical Coal Production Mix 20% |

|
|
Slide 11 Arch continues to advance development of the Leer mine to build out its metallurgical coal franchise Preparation plant is online Continuous miners are in operation First train loaded in fall of 2012 Longwall expected to start-up by October 2013 Cash costs expected within Arch’s current cost range or lower High-vol A Leer mine should improve company margins Prep Plant & Train Loadout |
|
|
Slide 12 Arch expects to play a larger role in the expanding seaborne coal trade East Coast DTA port in VA Throughput options at other ports Arch’s capacity could approach 10 million tons by 2015 Sources: Wood Mackenzie, ACI 2020 ~2 billion tons 7+ million tons 1 billion tons 2011 ~30 million tons Seaborne coal trade Arch’s export volumes West Coast MBT port in WA Agreement with Ridley in BC, Canada Pursuing additional throughput options at ports along West Coast Gulf Coast River terminals in Illinois Agreement with Kinder Morgan in LA and TX Throughput options at other ports (plus mid-streaming) 13+ million tons 2012 |

|
|
Arch is containing costs even while running at reduced volume levels Controlling consumable costs (i.e. diesel, explosives) Reducing contractor and overtime labor costs Decreasing parts & supplies expense as well as carrying costs of inventory Working with alliance and strategic suppliers Right-sizing operations Slide 13 Growth $200 Powder River Basin Cost Per ton (cash costs per ton) $11.58 $10.65 $0.93 per ton reduction Appalachian Cost Per Ton (cash costs per ton) $70.23 $67.16 $3.07 per ton reduction |
|
|
Slide 14 Arch is reducing its capital allocation budget in line with evolving coal market conditions Total Capital Expenditures (in millions) 2013P Spending By Category (based on midpoint of 2013 guidance*) Maintenance *As given on 4/23/13 42% reduction since 2011 |
|
|
Total Liquidity (in millions) Arch has a strong liquidity position, primarily in cash, to weather current market downturn Slide 15 *As of 3/31/13 **2016 bonds are callable in August 2013 $ 691 Short-term debt Existing, unsecured bonds Term loan Available borrowings Cash & Investments Debt Maturity Profile (at 3/31/2013, in millions) Arch’s current strategy favors holding cash versus historically maintaining higher borrowing capacity Relaxed financial maintenance covenants until late 2015 Only a minimum liquidity and senior secured leverage ratio, net of cash, remain in interim No debt maturities until 2016 |
|
|
Arch is well-positioned to benefit as coal markets improve Arch’s diversified operations, competitive cost structure and enhanced liquidity position will allow it to emerge as an even stronger player as the market returns to a more balanced state Slide 16 Flexible Capital Structure Current Focus Manage capital Control costs Rationalize supply Continue met development Maximize value of asset base As Cycle Turns Reduce leverage Invest in the business via organic and strategic growth Return capital to stakeholders Maximize value of asset base |
|
|
U.S. Coal Market Outlook |
|
|
Slide 18 112 123 156 131 142 77 112 123 156 131 (in millions of tons) 2011 2012 change 2013P change Power generation use 928 (103) U.S. coal exports 106 +19 Industrial use 50 (5) Domestic metallurgical 21 (1) U.S. demand 1,105 ~(90) Domestic supply* 1,107 (77) Imports 13 (3) U.S. supply 1,120 ~(80) Year-end stockpiles ~175 +10 We are seeing improving trends in 2013, leading to a further correction in U.S. coal stockpiles Sources: EIA, IHS CERA and ACI *Includes waste coal In 2012, U.S. coal demand declined 90 million tons. Supply fell 80 million tons, leading to a build in U.S. generator coal stockpiles. Trends are reversing in 2013 (through March): Power demand up 3% U.S. coal consumption up 10% U.S. coal production down 10% |
|
|
U.S. coal stockpiles should further liquidate in 2013; could end the year at targeted levels Slide 19 Sources: EIA, EVA and ACI After a record build in May 2012, coal stockpiles at U.S. generators declined to 185 million tons by December. Despite the positive trend, stockpiles remained well above targeted levels. With higher natural gas prices, normalized weather, elevated exports and lower supply anticipated in 2013, we expect coal stockpiles to liquidate further and approach targeted levels by year end. Estimated Coal Stockpile Levels at U.S. Power Generators (in millions of tons, at December 31) 140-150 million ton customer target |
|
|
The economics of coal — particularly in the PRB — are compelling in today’s gas market Slide 20 Sources: ACI, EIA, Ventyx PRB Parity with Natural Gas* (coal = $ per ton; gas = $ per million Btu) *Assumes transportation charge of $20 to $25 per ton; incremental non-fuel costs; and appropriate heat rate differentials for NGCC plants and coal plants. Powder River Basin coal remains the most cost competitive fossil fuel source in the U.S. The PRB demand outlook is improving due to higher natural gas prices and normalized weather Natural Gas PRB 8800 |
|
|
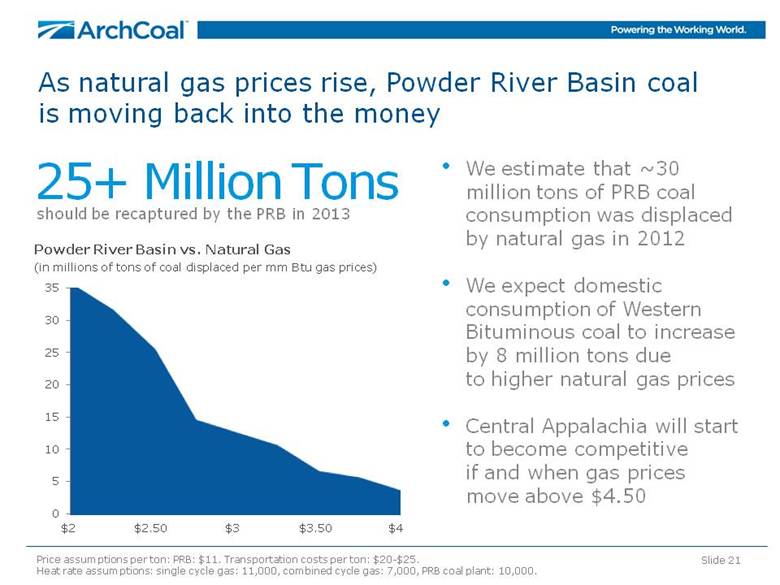
As natural gas prices rise, Powder River Basin coal is moving back into the money Slide 21 Powder River Basin vs. Natural Gas (in millions of tons of coal displaced per mm Btu gas prices) 25+ Million Tons should be recaptured by the PRB in 2013 We estimate that ~30 million tons of PRB coal consumption was displaced by natural gas in 2012 We expect domestic consumption of Western Bituminous coal to increase by 8 million tons due to higher natural gas prices Central Appalachia will start to become competitive if and when gas prices move above $4.50 $2 $4 Price assumptions per ton: PRB: $11. Transportation costs per ton: $20-$25. Heat rate assumptions: single cycle gas: 11,000, combined cycle gas: 7,000, PRB coal plant: 10,000. |
|
|
Slide 22 Arch expects 30% of U.S. coal-fueled units to retire by 2018, but the impact on consumption won’t be as great Source: Ventyx, ACI Likely to Continue Likely to Retire Retired Number of units Installed capacity Coal consumption in 2012 |
|
|
The coal fleet has run at much higher utilization rates in past Large plants retrofitted with modern control technologies should be able to operate at capacity factors well above the 2007 fleet average The units that we anticipate surviving the current shake-out operated at approximately 60% utilization in 2012, according to our estimates Slide 23 Sources: Wood Mackenzie and ACI Average Capacity Factor of U.S. Coal Fleet 112 123 156 131 142 77 73% 54% Coal units are operating at low capacity factors, which could provide offset to the impact of plant retirements |
|
|
Slide 24 Supply constraints will bring balance to coal markets Appalachian thermal coal is in long-term secular decline. Arch expects thermal output in the region to fall further in 2013. Sources: EIA and ACI 382 64 315 56 234 83 197 76 Appalachian* Output (in millions of tons) 185 million ton decline in thermal output since 1997 *Includes Northern and Central Appalachia |
|
|
International Market Update |
|
|
Global Coal Supply 8.2 billion tonnes* 1.2 billion tonnes seaborne market The coal market is global and diverse — with the U.S. continuing to expand its role Net coal importer Slide 26 Sources: IEA, IHS CERA and ACI Top Global Coal Consuming Regions (2012, in millions of metric tonnes) China Europe/Other U.S. India Russia 4,000 971 924 747 226 Net coal exporter Top Global Coal Exporting Regions (2012, in millions of metric tonnes) Indonesia Australia Russia U.S. Colombia 342 316 118 114 86 2012 Global Coal Supply * Includes brown coal (<4,200 kcal) |

|
|
Slide 27 The fall-off in global metallurgical coal prices is spurring a significant supply rationalization Benchmark Hard Coking Coal Price (in US $ per metric tonne) Sources: AME, CRV, and ACI 1Q12 2Q12 3Q12 4Q12 1Q13 2Q13 Supply cuts of up to 35 million tons annualized have been announced as benchmark prices fell At the 2Q13 benchmark of $172/tonne, public announcements of mine idlings and workforce reductions continue Earnings announcements suggest that leading global metallurgical producers are suffering operating losses at current prices Market observers project one-third of global metallurgical supply could be uneconomic at current prices |
|
|
Projected growth in global steel consumption will drive metallurgical coal demand through 2020 Slide 28 World steel consumption is projected to increase more than 35 percent from 2012 level of 1.4 billion tonnes World Steel Production (in billions of metric tonnes of crude steel) Sources: Consensus forecast of Wood Mackenzie, McKinsey, AME and CRU Global Metallurgical Coal Use (in billions of metric tonnes of coal) 2000 2020 2.0 0 .8 Demand for met coal will be driven by increased utilization at existing steel plants and the projected build-out of new steel capacity 1.4 2012 |

|
|
The U.S. already plays a sizable and increasingly essential role in global metallurgical markets Slide 29 Sources: Wood Mackenzie, T. Parker Host and ACI 2012 Metallurgical Export Coal Supply (in millions of metric tonnes) Low-Vol Mid-Vol High-Vol The U.S. is already an essential source of seaborne metallurgical coal — second only to Australia U.S. output of low-vol and mid-vol coals is comparable to Canada |
|
|
Slide 30 Nations around the world are building coal power plants to fuel electricity needs Africa Europe CIS Countries Middle East Other Asia 35 United States 4 Latin America 8 China 110 117 India 9 2 15 4 Under construction* 304 GW 900 mm tonnes Planned by 2017* 520 GW 1.5 bn tonnes New Coal-Fueled Generation Coming Online by 2017 Capacity under construction, in GW, from 2013-2017 Online in 2013 118 GW 340 mm tonnes Sources: ACI and Platts International *Includes capacity expected to come online in 2013 |
|
|
Slide 31 The trend of increased coal imports is unmistakable – and the growth is not confined to India and China Sources: ACI, McCloskey, India Coal Market Watch Data, Bloomberg, JP Morgan / Bangkok Post China net imports (in millions of metric tonnes) India net imports (in millions of metric tonnes) 20 133 (63) 223 Since 2007, South Korean imports have risen 45% to 141 million tonnes Vietnam plans to add more than 30 GWs of coal-based capacity this decade – and Taiwan, Indonesia, Malaysia and the Philippines are following a similar path Thailand’s energy agency expects power demand to double by 2030, and views coal as a lower cost and more secure option than LNG Thermal Met Thermal Met |
|
|
European coal consumption has risen measurably With natural gas prices at nearly three times the level prevailing in the U.S., Europe is consuming more coal Expiring natural gas contracts as well as an acrimonious history of natural gas purchases from Russia provide further incentives Declining indigenous production in Europe should translate into increased coal imports 6 GW of new coal-fueled capacity coming online on the continent in 2013 Slide 32 Sources: IEA, IHS CERA, McCloskey and ACI *Excludes consumption of brown coal Coal Burn in the European Union (in millions of tonnes of coal equivalent)* 2010 2011 2012 |
|
|
China is depleting reserves at an unprecedented (and accelerating) rate and production is migrating further from population centers. Imported coal often offers significant quality and environmental advantages. Australia will experience higher costs in new reserve areas. Government, regulatory and community impediments are on the rise. Supply Pressures Traditional supply sources are faced with rising costs, depleting resources and growing domestic demand, making U.S. coal increasingly competitive Slide 33 Source: Public sources India faces quality, land use, environmental and infrastructure challenges. Other Supply Regions South Africa is increasingly mature and infrastructure needs are great. Russia faces reserve depletion in the West and infrastructure needs in the East. Mongolia and Mozambique have coal but no roads, rail, ports or miners. Indonesia coal quality is declining and infrastructure is a huge challenge. Substantial capital is required to open new reserve areas, and growing domestic demand could ultimately constrain export growth. |

|
|
Planned U.S. port expansions will support a more than doubling of coal exports over the next five years or so NS/Lamberts 29 DTA 18 CNX Marine 14 Pier IX 13 PA 1 CSX/Curtis Bay 12 Ridley** 4 Westshore** 4 MBT 14 SSA Marine 14 Other Northwest 9 CA 2 Mobile 16 Other AL 5 Charleston 7 U.S. Exports (in millions of tonnes) Sources: ACI, NMA, Port Terminal Presentations *Includes overland shipments to Canada/Mexico **Capacity available for U.S. sourced volumes Slide 34 Deepwater 10 Other Texas 6 IMT 15 United 10 Burnside 9 Convent 7 Mid-streaming 22 Great Lakes 6 West Coast 47 Southwest 16 Gulf Coast 63 East Coast 87 Midwest 6 Southeast 28 Actual Projected Capacity |

|
|
Slide 35 While current market conditions are challenging, long-term prospects for coal demand are bright CURRENT MARKET Global macro uncertainty is impacting both thermal and met demand Emerging markets have slowed in the face of economic weakness in the developed world Utilization rates at global steel mills stand at 79 percent – off peak levels Thermal and met coal prices have slid to unsustainably low levels Sources: World Steel Association, Wood Mackenzie, ACI and other public sources LONG-TERM World steel consumption is projected to climb +40% by 2020 World population could top 8 billion by 2030 — with substantial urbanization and growth in middle class of emerging world The rapid build-out of the world’s coal-based power plant fleet shows no signs of abating Growing supply constraints should further support market conditions |

|
|
Arch Coal, Inc. Investor Presentation May 2013 |