Attached files
| file | filename |
|---|---|
| 8-K - 8-K - SunCoke Energy, Inc. | d526843d8k.htm |
| EX-99.1 - EX-99.1 - SunCoke Energy, Inc. | d526843dex991.htm |
 Q1 2013
Earnings Conference Call
April 25, 2013
Exhibit 99.2 |
 Forward-Looking Statements
1
This slide presentation should be reviewed in conjunction with the First Quarter 2013 earnings
releases of SunCoke Energy, Inc. (SunCoke) and SunCoke Energy Partners, L.P.
(Partnership) and the conference call held on April 25, 2013 at 10:00 a.m. ET.
Some of the information included in this presentation constitutes “forward-looking
statements” as defined in Section 27A of the Securities Act of 1933, as amended and
Section 21E of the Securities Exchange Act of 1934, as amended. All statements in this presentation that express
opinions, expectations, beliefs, plans, objectives, assumptions or projections with respect to
anticipated future performance of SunCoke or the Partnership, in contrast with
statements of historical facts, are forward-looking statements. Such forward-looking statements are based on
management’s beliefs and assumptions and on information currently available.
Forward-looking statements include information concerning possible or assumed
future results of operations, business strategies, financing plans, competitive position, potential growth opportunities,
potential operating performance improvements, the effects of competition and the effects of
future legislation or regulations. Forward-looking statements include all
statements that are not historical facts and may be identified by the use of forward-looking terminology such as the words
“believe,” “expect,” “plan,” “intend,”
“anticipate,” “estimate,” “predict,” “potential,” “continue,” “may,” “will,” “should” or the negative of these
terms or similar expressions. Although
management believes that its plans, intentions and expectations reflected in or suggested by the forward-looking statements made in
this presentation are reasonable, no assurance can be given that these plans, intentions or
expectations will be achieved when anticipated or at all. Moreover, such
statements are subject to a number of assumptions, risks and uncertainties. Many of these risks are beyond the control of
SunCoke and the Partnership, and may cause actual results to differ materially from those
implied or expressed by the forward-looking statements. Each of SunCoke and
the Partnership has included in its filings with the Securities and Exchange Commission cautionary language
identifying important factors (but not necessarily all the important factors) that could cause
actual results to differ materially from those expressed in any forward-looking
statement. For more information concerning these factors, see the Securities and Exchange Commission filings
of SunCoke and the Partnership. All forward-looking statements included in this
presentation are expressly qualified in their entirety by such cautionary
statements. Although forward-looking statements are based on current beliefs and expectations, caution should be taken not to
place undue reliance on any such forward-looking statements because such statements speak
only as of the date hereof. SunCoke and the Partnership do not have any intention
or obligation to update publicly any forward-looking statement (or its associated cautionary language)
whether as a result of new information or future events or after the date of this
presentation, except as required by applicable law.
This presentation includes certain non-GAAP financial measures intended to supplement, not
substitute for, comparable GAAP measures. Reconciliations of non-GAAP financial
measures to GAAP financial measures are provided in the Appendix at the end of the presentation.
Investors are urged to consider carefully the comparable GAAP measures and the reconciliations
to those measures provided in the Appendix. |
 SUNCOKE ENERGY,
INC. RESULTS |
 Q1 2013
Highlights 3
•
Executed SunCoke Energy Partners initial public offering
–
Declared
first
quarterly
cash
distribution
prorated
for
the
date
of
the
IPO
–
Currently
expect
to
increase
quarterly
distribution
by
~2.5%
for
next
quarter and anticipate an overall increase of ~7% for the Q4 2013
distribution to be paid in early 2014
•
Completed VISA SunCoke JV, marking our entry to India
–
Invested $67.7 million for a 49% stake
•
Delivered improved coke performance driven by Middletown
facility
•
Improved coal productivity and reduced cash costs
•
Ended quarter with substantial financial flexibility
–
~$200 million cash attributable to SXC at quarter-end after India
investment, and $106 million of cash at SXCP
Photo courtesy of VISA Steel |
 Q1 2013
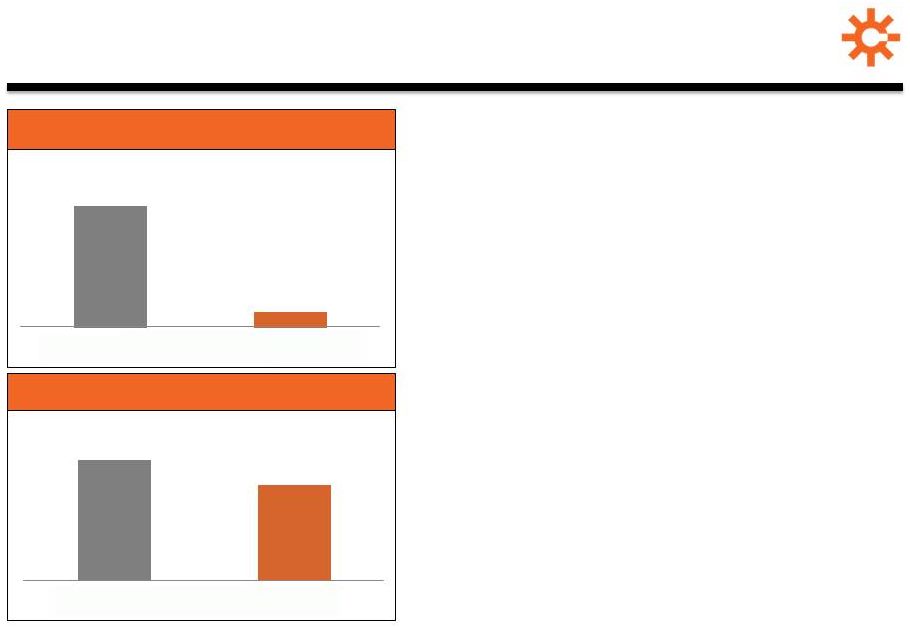
Earnings Overview Q1 2013 EPS of $0.03 reflects
•
Challenging coal price environment
•
Accelerated depreciation expense at
Indiana Harbor
•
($0.10) EPS impact related to debt
issuance costs and unfavorable tax items
•
Income attributable to SXCP public
holders ($0.07) in 2013
Adjusted EBITDA down on coal mining
segment performance, partially offset by
improved cokemaking results
Reaffirm 2013 consolidated Adjusted
EBITDA and EPS guidance of $205 million -
$230 million and $0.30 -
$0.55
(1)
For a definition and reconciliation of Adjusted EBITDA, please see appendix.
4
$0.24
$0.03
Q1 2012
Q1 2013
Earnings Per Share
(diluted)
$55.5
$52.3
Q1 2012
Q1 2013
Adjusted EBITDA
(1)
(in millions) |
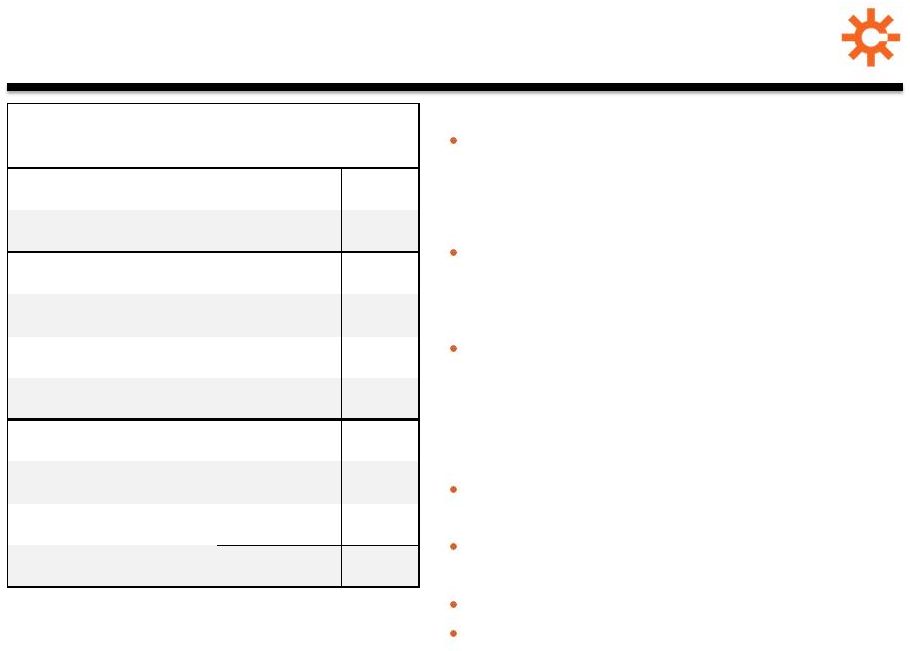  Q1 2013 Financial
Results (1) Coke Adjusted EBITDA includes Domestic Coke and International
segments. (2) For a definition and reconciliation of Adjusted EBITDA and Adjusted EBITDA
per ton, please see appendix.
($ in millions)
Q1'13
Q1'12
Q1'13
vs.
Q1'12
Domestic Coke Sales Volumes
1,058
1,078
(20)
Coal Sales Volumes
373
373
-
Revenue
$453.9
$481.3
($27.4)
Operating Income
$27.0
$33.9
($6.9)
Net Income Attributable to
Shareholders
$2.1
$16.9
($14.8)
Earnings Per Share
$0.03
$0.24
($0.21)
Coke Adjusted EBITDA
(1)
$62.7
$54.9
$7.8
Coal Adjusted EBITDA
(2)
($4.6)
$7.4
($12.0)
Corporate/Other
($5.8)
($6.8)
$1.0
Adjusted EBITDA
(2)
$52.3
$55.5
($3.2)
5
Reflects impact of lower coal prices in
coke and coal segments
Coke business performed well, led by
Middletown, which increased
$8.8 million
Coal weakness driven by $50/ton yr/yr
decline in prices, partially offset by
lower cash production costs
Accelerated depreciation at Indiana
Harbor ($0.06)
Write-off of unamortized debt issuance
costs and debt-related fees ($0.05)
Unfavorable tax items ($0.05)
Income attributable to SXCP public
holders in 2013 ($0.07)
Revenues lower by 5.7%
Adjusted EBITDA down 5.8%
EPS decline to $0.03 reflects |
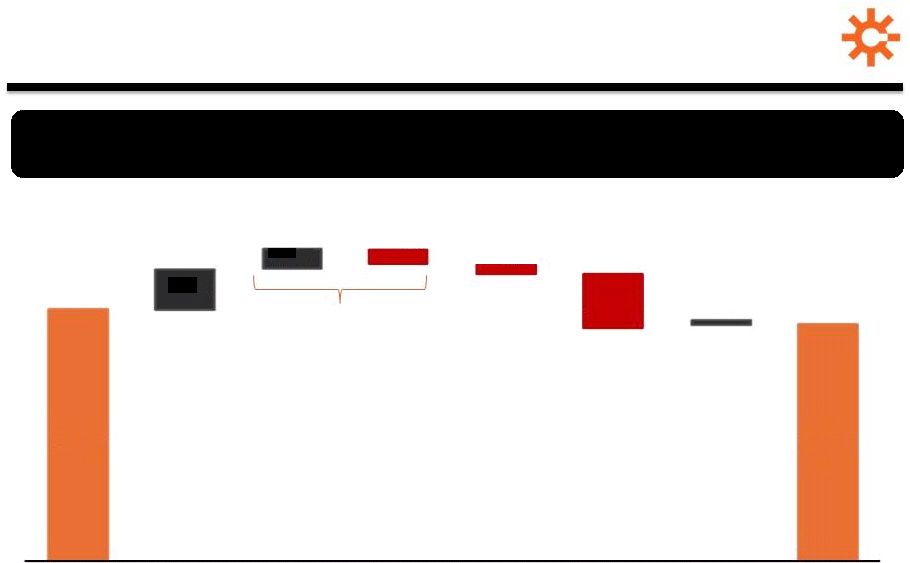 Adjusted
EBITDA (1)
Bridge –
Q1 ‘12 to Q1 ‘13
Weak coal mining segment results partially offset by
improved coke operations driven by Middletown
($ in millions)
(1)
For a definition and reconciliation of Adjusted EBITDA, please see the appendix
(2)
Includes a $2.8 million charge related to coke inventory reduction and a $1.5 million lower
cost or market adjustment on pad coal inventory at Indiana Harbor in 2012
•
$4.8M better
cost recovery
•
Favorable
comparison to
1Q12’s ($4.0M)
of start-up costs
and yield
performance
•Net
improvement of $1.2M 6
$55.5
$52.3
$8.8
$4.3
$1.0
($3.1)
($2.2)
($12.0)
Q1 2012
Adjusted
EBITDA (1)
Middletown
Indiana
Harbor (non-
recurring)(2)
Indiana
Harbor
Coke Business
(excl.
Middletown &
Indiana Harbor)
Coal Mining
Corporate
Costs
Q1 2013
Adjusted
EBITDA (1) |
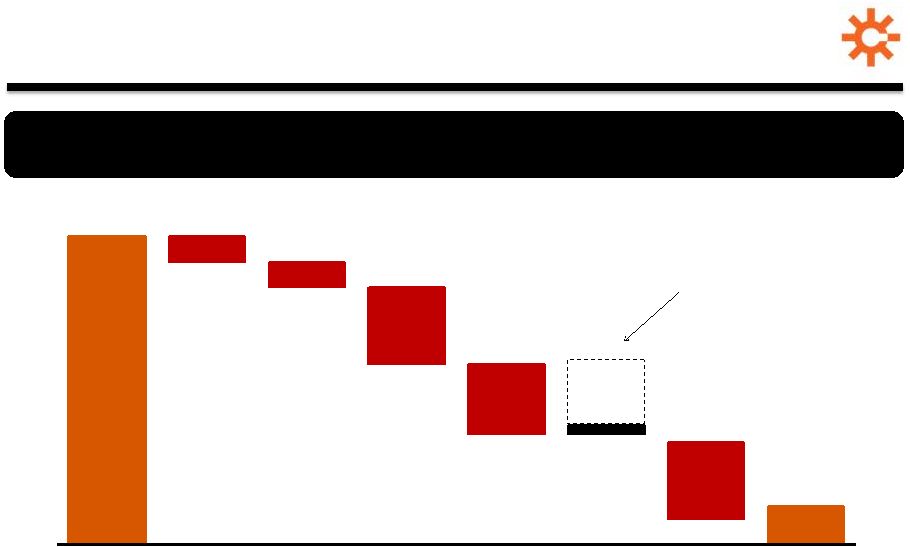 Diluted EPS
Bridge – Q1 ‘12 to Q1 ‘13
EPS impacted by higher depreciation costs due to Indiana Harbor
refurbishment and approximately ($0.10) of non-recurring items
(1)
For a definition and reconciliation of Adjusted EBITDA, please see the appendix
$0.24
$0.03
$0.01
($0.02)
($0.02)
($0.06)
($0.05)
($0.07)
Q1 2012 EPS
(Diluted)
EBITDA
Depreciation,
Depletion &
Amortization
Indiana
Harbor
Accelerated
Depreciation
Financing
Costs
Taxes
Net
Income/(Loss)
Attributable
to NCI
Q1 2013 EPS
(Diluted)
Attributable
to SXC
Reflects ($0.05) impact
of unfavorable tax items
7 |
 SXC Liquidity
Position Ended quarter with strong cash position and virtually undrawn revolver
even after making ~$68 million VISA SunCoke JV investment
($ in millions)
SXCP IPO transaction
Includes:
8
•
Includes
$16.2M for
Indiana
Harbor
(1)
Reflects timing of payment of a $24.5 million receivable due on the last day of quarter, but
paid first day of next (2)
Includes early payment on $11.8 million of accrued sales discounts
(3)
Excludes $6.5 million in offering expenses paid in 2012 and includes $0.7 million of
fees related to the amendment of SXC credit facility •
Accts
Receivable:
($27.0M)
(1)
•
Inventories: $18.9M
•
Accts Payable: $19.0M
•
Accrued
Liabilities:
($21.4M)
(2)
Q4 2012
Cash
Balance
Q1 2013
Net Income
Depreciation,
Depletion &
Amortization
Working
Capital, Deferred
Taxes & Other
Capital
Expenditures
VISA
SunCoke JV
SXCP Equity &
Debt
Offerings
(net of fees)(3)
SXC Debt
Paydown
Other Cash Used
In Financing
Activities
Q1 2013
Cash
Balance |
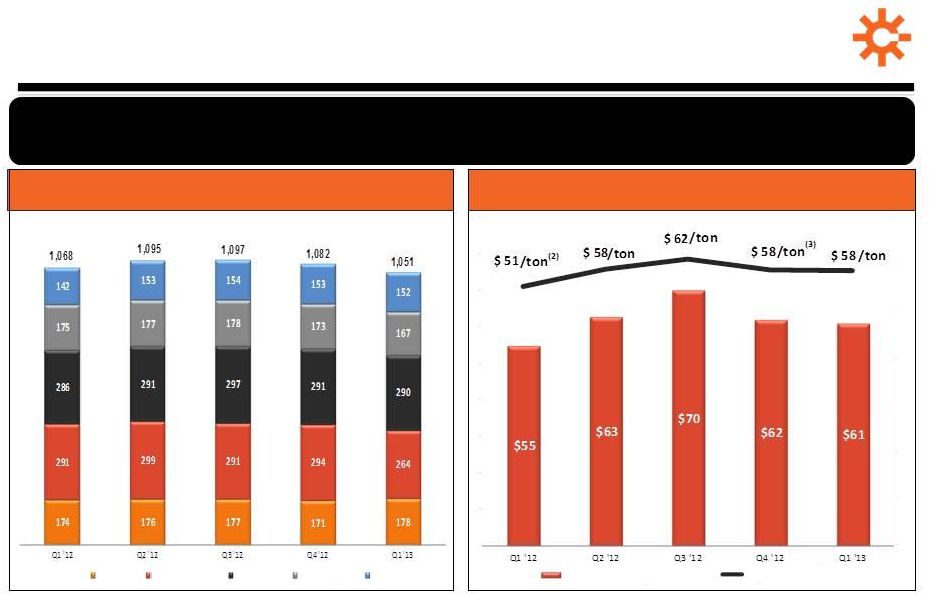 Domestic Coke
Business Summary 9
(1)
For a definition of Adjusted EBITDA and Adjusted EBITDA/Ton and reconciliations, see
appendix.
(2)
Includes a $2.8 million charge related to coke inventory reduction and a $1.5 million lower
cost or market adjustment on pad coal inventory at Indiana Harbor and $4.0 million of
non- recurring startup costs at Middletown.
(3)
Domestic
Coke
Production
Domestic Coke Adjusted EBITDA
(1)
Per Ton
Overall cokemaking business performed well, delivering
Adjusted EBITDA per ton of $58 in first quarter
(Tons in thousands)
($ in millions, except per ton amounts)
Includes $4.2 million favorable adjustment at Indiana Harbor due
to finalization of 2011 billing review. Jewell
Indiana Harbor
Haverhill
Granite City
Middletown
Domestic Coke Segment
Adjusted EBITDA/ton |
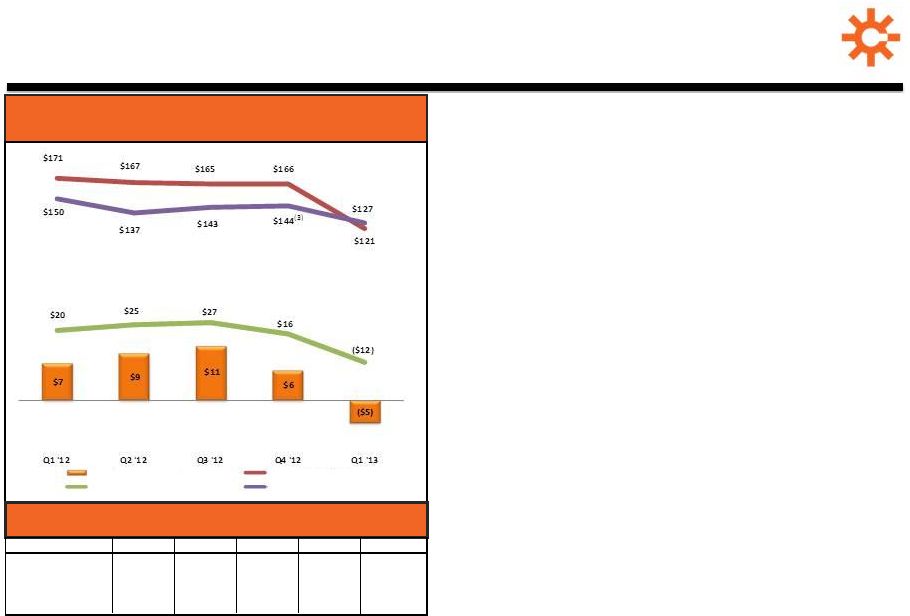  Coal Mining
Financial Summary Q1 2013 Adjusted EBITDA down
$12 million from Q1 2012
•
Driven by $50 decline in average sales price
•
Sales volume flat
Delivered significant improvement in
per ton cash production costs
•
Jewell underground costs down sequentially
and yr/yr
–
$129 in Q1 2013; $149
(3)
in Q4 2012;
$159 in Q1 2012
Coal action plan progress
•
Rationalized mining plans, idled mines and
reduced headcount
•
Upgraded equipment and training programs
•
Installed new cyclone system at prep plant
Expect Coal Mining segment to
deliver FY 2013 Adjusted EBITDA of
$0 –
($15) million; consistent with
guidance
Coal Mining Adjusted EBITDA
(1)
and Avg. Sales
Price/Ton
(2)
($ in millions, except per ton amounts)
(1)
(2)
(3)
Coal Sales, Production and Purchases
Q1 '12
Q2 '12
Q3 '12
Q4 '12
Q1 '13
Coal Sales
373
365
392
371
373
Coal Production
375
401
349
351
349
Purchased Coal
19
4
10
9
18
Reject Rate (%)
68
66
67
66
66
10
Coal Adjusted EBITDA
Average Sales Price
Coal Adj EBITDA / ton
Coal Cash Cost / ton
For a definition and a reconciliation of Adjusted EBITDA, please see the appendix. Avg.
Sales Price is weighted avg. price for all sales, including to affiliates and Jewell Coke.
Excludes Black Lung liability charge of $0.8 million and accrued potential fines and
penalties of $1.5 million. |
 SUNCOKE ENERGY
PARTNERS, LP RESULTS |
 SXCP Q1
2013 Financial Results Sustained solid results at Middletown and Haverhill
provide a strong platform for future growth
n/a -
Not applicable
* -
Proforma Jan 1-Mar 31, 2013 for offerings completed on January 24, 2013
12
Q1'13
Q1'12
Q1'13 vs Q1'12
($ in millions except where noted)
Actual
Actual
Change
Coke Production (in '000s of tons)
442
428
14
Coke Sales Volumes (in '000s of tons)
448
424
24
Financial Results:
Revenues
184.9
$
176.7
$
8.2
$
Operating Income
34.5
$
20.3
$
14.2
$
Net Income
(1)
23.9
$
12.4
$
11.5
$
Net Income attributable to SXCP
(1)
15.3
$
12.4
$
2.9
$
Profitability Measures:
Proforma* Adjusted EBITDA attributable to SXCP
(2)
26.5
$
n/a
-
Proforma* Adj. EBITDA per ton attributable to SXCP
(2)
91.19
$
n/a
-
Distributable Cash Flow
Proforma* Distributable Cash Flow
(2)
22.0
$
n/a
-
Minimum Quarterly Cash Distribution
13.2
$
n/a
-
Distribution Coverage Ratio
1.66x
n/a
-
(1)
Reflects impact of local income taxes
(2)
For a definition and related reconciliations of Adjusted EBITDA, Adjusted EBITDA/Ton and
Distributable Cash Flow, please see appendix |
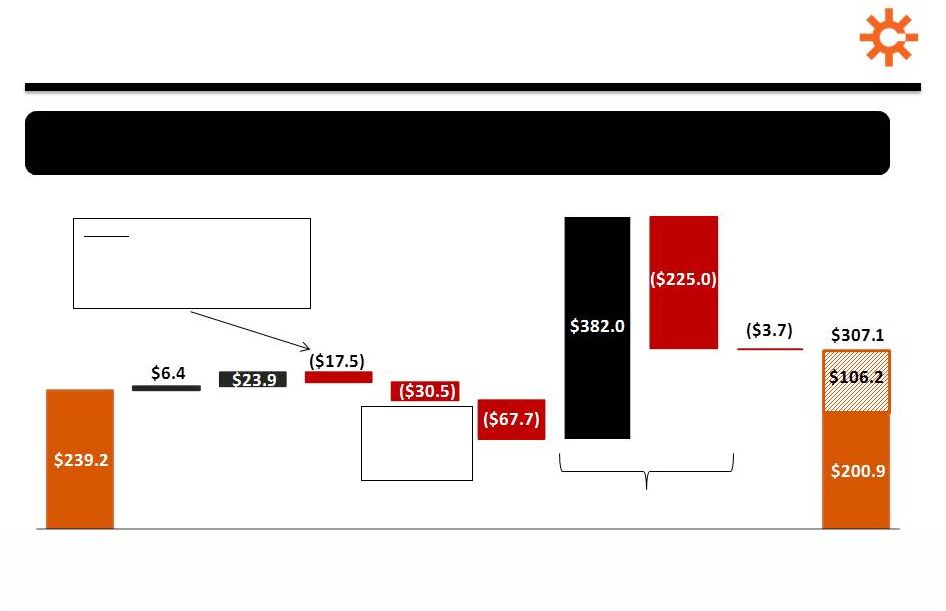
 SXCP Liquidity
Position Reserved for
environmental
remediation
A solid cash balance and undrawn $100 million revolver provide SXCP the
flexibility to seize potential new growth opportunities
•
Ongoing CapEx:
($1.2M)
•
Pre-funded
environmental
remediation:
($4.5M)
Includes
settlement of
accrued sales
discounts
($11.8M)
SXCP IPO transaction
13
$376.1
$23.9
$7.6
($225.0)
($33.1)
($25.8)
($5.7)
($11.8)
$43.7
SXCP Equity &
Debt Offering,
Net of Fees
Debt
Paydown
Distributions
to SXC from IPO
Q1 2013
Net Income
Depreciation,
Depletion &
Amortization
Working
Capital Changes
/ Other
Capital
Expenditures
Cash
Distribution to
SXC (for 35%
post-IPO)
Q1 2013
Cash
Balance
$106.2 |
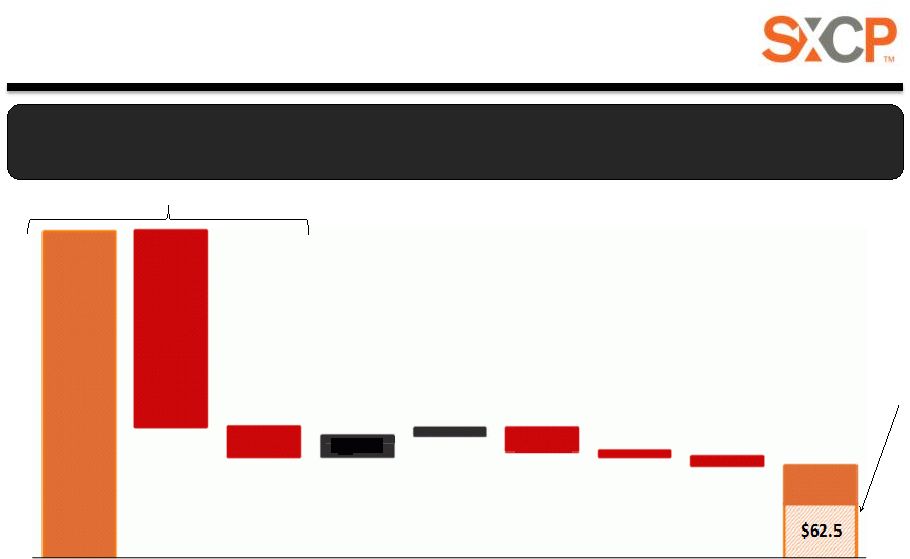
 SXCP Updated
2013 Outlook (1)
Adjusted EBITDA equals SXCP’s 65% interest in Haverhill and Middletown’s Adjusted
EBITDA (i.e., 65% net income attributable to the controlling and noncontrolling interests plus depreciation
expense, interest expense, incremental public partnership expenses, and incremental corporate
expenses allocated to the MLP). (2)
Total unit coverage ratio calculated as cash available for distribution divided by total
distributions at the minimum distribution rate of $52.9 million. 14
Based on solid operating performance and outlook, we have increased our
Adjusted EBITDA and cash distribution coverage expectations for 2013
Prospectus
Revised 2013 Outlook
($ and units in millions, except per unit data)
2013 Forecast
High
Low
Adjusted EBITDA attributable to SXCP
(1)
$88.3
$93.0
$88.3
Less:
Cash interest ($150 million senior notes @ 7.375% plus $0.5 million revolver commitment
fee) 11.6
11.6
11.6
Accrual for replacement capital expenditures
3.7
3.7
3.7
Ongoing capital expenditures (65% share of Haverhill and Middletown attributable to
SXCP) 9.1
9.1
9.1
Public partnership expense
2.5
2.5
2.5
Estimated Distributable Cash Flow
$61.4
$66.1
$61.4
Excess distributable cash flow available for distribution
8.5
13.2
8.5
Total estimated minimum annual distribution
$52.9
$52.9
$52.9
Minimum annual distribution per unit
$1.65
$1.65
$1.65
Total unit coverage ratio
(2)
1.16x
1.25x
1.16x |
 SXCP
Distribution Growth Outlook 15
•
Declared initial quarterly cash distribution of $0.3071
–
Reflects proration of the $0.4125 minimum quarterly distribution
rate for the January 24, 2013 closing of the IPO
•
Given confidence in current outlook, expect to increase
quarterly cash distribution rate
–
Currently expect to increase quarterly cash distribution by ~2.5% for
next quarter and anticipate an overall increase of ~7% for the Q4
2013 distribution to be paid in early 2014 |
 2013 OUTLOOK
& PRIORITIES |
 SXC: 2013
Guidance Summary Metric
Revised Guidance: 2013
Post SXCP IPO
Adjusted EBITDA
(1)
Consolidated
Attributable to SXC Shareholders
$205 –
$230 million
$165 –
$190 million
EPS Attributable to SXC Shareholders
(diluted)
$0.30 –
$0.55
Cash Flow from Operations
~$140 million
(3)
Capital Expenditures and Investments
(2)
~ $200 million
Effective Tax Rate
14% –
20%
Cash Tax Rate
12% –
20%
Domestic Coke Production
4.3+ million tons
Coal Production
~ 1.4 million tons
(1)
For a reconciliation of 2013E Adjusted EBITDA, please see reconciliation on slide 27
(2)
See appendix for details
(3)
Includes ~$38 million of sales discounts payable to customers of which ~$12million is
pre-funded at SXCP with IPO proceeds 17
Prior range
7-14% |
 2013
Priorities Operational Excellence
Operational Excellence
•
Sustain momentum at coke
facilities
•
Execute Indiana Harbor Plan
•
Execute refurbishment
•
Resolve NOV
•
Renew coke contract
with return on
refurbishment capital
•
Implement environmental
project at Haverhill and
Granite City
•
Execute coal mining action
plan to decrease cash cost
•
Maintain top quartile safety
performance
Grow The Coke
Grow The Coke
Business
Business
•
Domestic
•
Obtain permit for next
potential U.S. facility
•
Identify and pursue
strategic acquisition
opportunities in the U.S.
and Canada
•
Evaluate adjacent business
lines to extend growth
opportunities
•
International
•
Closed VISA SunCoke joint
venture transaction
•
Identify potential follow-on
opportunities in India
Strategically Optimize
Strategically Optimize
Assets
Assets
•
SXCP
•
Achieve smooth launch,
governance and operation
of SXCP
•
Coal
•
Reposition mining
operations for near-term
weakness and long-term
strategic flexibility
•
Efficient Capital Allocation
•
Put SXC and SXCP balance
sheets to work
18 |
 North America
M&A Growth Strategy FOCUS
Acquisition of existing
cokemaking facilities with long-
term off take agreements
FOCUS
Selective acquisition of met coal
related handling & processing
assets, with long-term off take
agreements and limited
commodity exposure
FOCUS
Investment in ferrous side of
steel value chain (concentrating,
pelletizing, transport/handling)
19
•
•
•
•
•
•
•
•
•
Cokemaking
Cokemaking
Coal Handling/
Coal Handling/
Processing
Processing
Iron Ore Processing
Iron Ore Processing
First priority for core
business
Opportunistic
acquisitions of
adjacent assets
Evaluation for future
value chain expansion
Customer concentration likely
to remain high
Degree of integration in steel
operations and environmental
issues will impact complexity
and timing of transaction
In active discussion with
owners of targeted assets
Potential to add value to core
business and diversify
customer base
Current opportunities available
and less complex assets implies
potentially shorter deal cycle
Initiated discussions with
potential parties
Potential to diversify customer
base and enhance value-add
to steel industry
Potential to deploy tolling/pass
through model
Researching qualifying income
status and market opportunity |
 QUESTIONS |
 www.suncoke.com
Investor Relations:
630-824-1907 |
 APPENDIX
|
 •
Adjusted
EBITDA
represents
earnings
before
interest,
taxes,
depreciation,
depletion
and
amortization
(“EBITDA”)
adjusted
for
sales
discounts
and
the
interest,
taxes,
depreciation,
depletion
and
amortization
attributable
to
equity
earnings
in
our
unconsolidated
affiliates.
EBITDA
reflects
sales
discounts
included
as
a
reduction
in
sales
and
other
operating
revenue.
The
sales
discounts represent the sharing with customers of a portion of nonconventional fuel
tax credits, which reduce our income tax expense.
However, we believe our Adjusted EBITDA would be inappropriately penalized if
these discounts were treated as a reduction
of
EBITDA
since
they
represent
sharing
of
a
tax
benefit
that
is
not
included
in
EBITDA.
Accordingly,
in
computing
Adjusted
EBITDA,
we
have
added
back
these
sales
discounts.
Our
Adjusted
EBITDA
also
includes
EBITDA
attributable
to
our
unconsolidated affiliates. EBITDA and Adjusted EBITDA do not represent and
should not be considered alternatives to net income or operating income
under GAAP and may not be comparable to other similarly titled measures in other businesses. Adjusted
EBITDA does not represent and should not be considered as an alternative to net
income as determined by GAAP, and calculations thereof may not be comparable
to those reported by other companies. We believe Adjusted EBITDA is an important measure of
operating performance and provides useful information to investors because it
highlights trends in our business that may not otherwise be apparent when
relying solely on GAAP measures and because it eliminates items that have less bearing on our
operating
performance.
Adjusted
EBITDA
is
a
measure
of
operating
performance
that
is
not
defined
by
GAAP
and
should
not
be
considered a substitute for net (loss) income as determined in accordance with
GAAP. •
Adjusted
EBITDA
attributable
to
SXC/SXCP
equals
Adjusted
EBITDA
less
Adjusted
EBITDA
attributable
to
noncontrolling
interests.
•
Adjusted
EBITDA/Ton
represents
Adjusted
EBITDA
divided
by
tons
sold.
When
applicable
to
Adjusted
EBITDA
attributable
to
SXC or SXCP, tons sold are prorated according to the respective ownership interest
of SXC or SXCP as applicable. Definitions
23 |
 •
Distributable
Cash
Flow
equals
Adjusted
EBITDA
less
net
cash
paid
for
interest
expense,
on-going
capital
expenditures,
accruals
for replacement capital expenditures, and cash distributions to noncontrolling
interests. Distributable Cash Flow is a non-GAAP supplemental
financial measure that management and external users of the Partnership's financial statements, such as industry
analysts, investors, lenders, and rating agencies, use to assess:
•
the Partnership's operating performance as compared to other publicly traded
partnerships, without regard to historical cost basis;
•
the ability of the Partnership's assets to generate sufficient cash flow to make
distributions to the Partnership's unitholders; •
the Partnership's ability to incur and service debt and fund capital expenditures;
and •
the viability of acquisitions and other capital expenditure projects and the
returns on investment of various investment opportunities.
The Partnership believes that Distributable Cash Flow provides useful information
to investors in assessing the Partnership's financial condition and results
of operations. Distributable Cash Flow should not be considered an alternative to net income, operating income,
cash flows from operating activities, or any other measure of financial performance
or liquidity presented in accordance with generally accepted accounting
principles (GAAP). Distributable Cash Flow has important limitations as an analytical tool because it excludes
some, but not all, items that affect net income and net cash provided by operating
activities and used in investing activities. Additionally, because
Distributable Cash Flow may be defined differently by other companies in the industry, the Partnership's
definition of Distributable Cash Flow may not be comparable to similarly titled
measures of other companies, thereby diminishing their utility.
Definitions
24 |
  Reconciliations
$ in millions
Q1 2013
FY 2012
Q4 2012
Q3 2012
Q2 2012
Q1 2012
FY 2011
Q4 2011
Q3 2011
Q2 2011
Q1 2011
Net Income
6.4
102.5
29.0
32.9
24.0
16.6
58.9
7.5
21.6
24.1
5.7
Subtract: Depreciation, depletion
and amortization
(23.9)
(80.8)
(23.3)
(18.9)
(20.2)
(18.4)
(58.4)
(16.0)
(14.7)
(14.7)
(13.0)
Subtract: Interest expense, net
(15.8)
(47.8)
(11.8)
(12.2)
(11.8)
(12.0)
(1.4)
(7.1)
(3.3)
4.5
4.5
Subtract: Income Tax
(4.8)
(23.4)
(3.5)
(7.6)
(7.0)
(5.3)
(7.2)
2.9
(5.1)
(1.9)
(3.1)
EBITDA
50.9
254.5
67.6
71.6
63.0
52.3
125.9
27.7
44.7
36.2
17.3
Add: Sales Discount
1.4
11.2
2.1
2.1
3.8
3.2
12.9
3.2
3.5
3.1
3.1
Add: Adjustment to
unconsolidated affiliate earnings
-
-
-
-
-
-
-
-
-
-
-
Adjusted EBITDA
52.3
265.7
69.7
73.7
66.8
55.5
138.8
30.9
48.2
39.3
20.4
Adjusted EBITDA attributable to
noncontrolling interests
(8.4)
(3.0)
(1.5)
(1.1)
(0.9)
0.5
4.0
0.8
(2.7)
(0.9)
6.8
Adjusted EBITDA attributable to
SXC
43.9
262.7
68.2
72.6
65.9
56.0
142.8
31.7
45.5
38.4
27.2
Reconciliations from Net Income to Adjusted EBITDA
25 |
  $ in millions, except
per ton data Domestic
Coke
International
Coke
Jewell
Coal
Corporate
Combined
Q1 2013
Adjusted EBITDA
61.1
1.6
(4.6)
(5.8)
52.3
Sales Volume (thousands of tons)
1,058
216
373
Adjusted EBITDA per Ton
57.8
7.41
(12.3)
FY 2012
Adjusted EBITDA
249.4
11.9
33.4
(29.0)
265.7
Sales Volume (thousands of tons)
4,345
1,209
1,500
Adjusted EBITDA per Ton
57.4
9.8
22.3
Q4 2012
Adjusted EBITDA
62.4
10.2
6.0
(8.9)
69.7
Sales Volume (thousands of tons)
1,077
239
370
Adjusted EBITDA per Ton
57.9
42.7
16.2
Q3 2012
Adjusted EBITDA
69.8
0.9
10.7
(7.7)
73.7
Sales Volume (thousands of tons)
1,116
310
392
Adjusted EBITDA per Ton
62.5
2.9
27.3
Q2 2012
Adjusted EBITDA
62.4
0.7
9.3
(5.6)
66.8
Sales Volume (thousands of tons)
1,074
302
365
Adjusted EBITDA per Ton
58.1
2.3
25.5
Q1 2012
Adjusted EBITDA
54.8
0.1
7.4
(6.8)
55.5
Sales Volume (thousands of tons)
1,078
358
373
Adjusted EBITDA per Ton
50.8
0.3
19.8
Reconciliations of Segment Adjusted EBITDA and Adjusted EBITDA Per Ton
Reconciliations
26 |
 2013E
Net
Income
to
Adjusted
EBITDA
Reconciliation
-
SXC
SXC –
Expected 2013E EBITDA Reconciliation
27
(1)
Represents SXC share of India JV interest, taxes and depreciation expense
(2)
Represents Adjusted EBITDA attributable to SXCP public unitholders and to DTE’s interest
in Indiana Harbor (in millions)
2013E
Low
2013E
High
Net Income
$40
$57
Depreciation, Depletion and Amortization
97
95
Total financing costs, net
55
55
Income tax expense
7
14
EBITDA
$199
$221
Sales discounts
6
6
Adjustment to unconsolidated affiliate earnings
(1)
–
3
Adjusted EBITDA
$205
$230
EBITDA attributable to noncontrolling interests
(2)
(40)
(40)
Adjusted EBITDA attributable to SXC
$165
$190 |
 28
2013E
Net
Income
to
Adjusted
EBITDA
Reconciliation
-
SXCP
SXCP –
Expected 2013E EBITDA Reconciliation
(1)
Represents Adjusted EBITDA attributable to SXC’s 35% interest in Haverhill and
Middletown facilities (in millions)
2013E
Low
2013E
High
Net Income
79.2
$
89.9
$
Depreciation, Depletion and Amortization
32.0
31.0
Total financing costs, net
17.0
15.0
Income tax expense
4.7
4.7
EBITDA
132.9
$
140.6
$
Sales discounts
(0.6)
(0.6)
Adjusted EBITDA
132.3
$
140.0
$
EBITDA attributable to noncontrolling interest
(1)
(44.0)
(47.0)
Adjusted EBITDA attributable to SXCP
88.3
$
93.0
$ |
   2013E Capital
Expenditures and Investments ($ in millions)
SXC
SXCP
Consolidated
On-Going
Approx.
$49
$9
$58
Environmental
Remediation
Approx.
-
$15
$15
Expansion
Approx.
60
-
60
Total CapEx
Approx.
$109
$24
$133
Investments
Approx.
$67
-
$67
Total CapEx &
Investments
Approx.
$176
$24
$200
For Year Ended December 31, 2013
•
Expansion includes approx.
$60m for Indiana Harbor
Refurbishment
•
SXCP expenditures prefunded
from IPO proceeds
•
To fund investment in
India JV (Visa SunCoke)
•
SXC includes approximately
$25m coke and $24m coal
•
SXCP includes 65% of $14m
expected at Haverhill and
Middletown
29 |
  Proforma for
period
1/1/2013 -
Proforma
($ in Millions)
Q1'13
1/23/2013
Q1'13
Net cash (used in) provided by operating activities
5.7
$
(0.2)
$
5.5
$
Depreciation
(7.6)
(7.6)
Changes in
working capital and other 25.8
25.8
Net income
23.9
$
23.7
$
Add:
Depreciation
7.6
7.6
Financing expense, net 6.7
6.7
Income tax expense 3.9
3.9
Sales discounts (0.6)
(0.6)
Adjusted EBITDA
41.5
$
41.3
$
Adjusted EBITDA attributable to
NCI (11.4)
(3.4)
(14.8)
Adjusted EBITDA attributable to
Predecessor/SXCP 30.1
$
26.5
$
Less:
On-going capex
(0.7)
(0.7)
Replacement
capex accrual (0.9)
(0.9)
Cash interest
accrual (2.9)
(2.9)
Distributable cash
flow 25.6
$
22.0
$
Minimum Quarterly Cash Distribution
13.2
13.2
Distribution Coverage Ratio
1.94x
1.66x
Adjusted EBITDA per ton reconciliation
Adjusted EBITDA attributable to SXCP
26.5
$
Sales tons attributable to
SXCP 291
Adjusted EBITDA/ton
91.1
$
SXCP –
Adjusted EBITDA and Distributable
Cash Flow Reconciliations
30
(1)
SG&A expense for the time period prior to the January 24, 2013 IPO date (January 1
-23, 2013) (2)
Represents Adjusted EBITDA attributable to SXC’s 35% interest in Haverhill and
Middletown facilities prior to the IPO date (2)
Includes 65% of the total sales tons of Haverhill and Middletown
(1)
(2)
(3) |