Attached files
| file | filename |
|---|---|
| 8-K - FORM 8-K - OUTERWALL INC | d524783d8k.htm |
| EX-99.1 - EX-99.1 - OUTERWALL INC | d524783dex991.htm |
Exhibit 99.2
Coinstar, Inc. 2013 First Quarter Earnings
Prepared Remarks from CEO J. Scott Di Valerio and CFO Galen C. Smith
April 25, 2013
Coinstar, Inc. issued a press release today, April 25, 2013, announcing financial results for the 2013 first quarter ended March 31, 2013. These prepared remarks provide additional information related to the company’s 2013 first quarter operating and financial performance and 2013 second quarter and full year guidance.
CEO J. Scott Di Valerio and CFO Galen C. Smith will host a conference call today at 2 p.m. PDT to answer questions related to the company’s business performance, financial results and guidance.
The Q1 press release, prepared remarks, and conference call webcast are available on the Investor Relations section of Coinstar’s website at www.coinstarinc.com.
Safe Harbor for Forward-Looking Statements
Certain statements in these prepared remarks are “forward-looking statements” within the meaning of the Private Securities Litigation Reform Act of 1995. The words “believe,” “estimate,” “expect,” “intend,” “anticipate,” “goals,” variations of such words, and similar expressions identify forward-looking statements, but their absence does not mean that the statement is not forward-looking. The forward-looking statements in this release include statements regarding Coinstar, Inc.’s anticipated growth and future operating results, including 2013 second quarter and 2013 full year results. Forward-looking statements are not guarantees of future performance and actual results may vary materially from the results expressed or implied in such statements. Differences may result from actions taken by Coinstar, Inc. and Redbox, as well as from risks and uncertainties beyond Coinstar, Inc.’s control. Such risks and uncertainties include, but are not limited to,
| • | competition from other digital entertainment providers, |
| • | the ability to achieve the strategic and financial objectives for our entry into a new business, |
| • | our limited ability to direct the management or policies of the new joint venture with Verizon Communications, |
| • | failure to receive the expected benefits of the NCR relationship, |
| • | the termination, non-renewal or renegotiation on materially adverse terms of our contracts with our significant retailers and suppliers, |
| • | payment of increased fees to retailers, suppliers and other third-party providers, including financial service providers, |
| • | the inability to receive delivery of DVDs on the date of their initial release to the general public, or shortly thereafter, or in sufficient quantity, for home entertainment viewing, |
| • | noteholders electing to convert our convertible notes, |
| • | the effective management of our content library, |
| • | the ability to attract new retailers, penetrate new markets and distribution channels and react to changing consumer demands, |
| • | the ability to achieve the strategic and financial objectives for our entry into or expansion of new businesses, |
| • | the ability to adequately protect our intellectual property, and |
| • | the application of substantial federal, state, local and foreign laws and regulations specific to our business. |
The foregoing list of risks and uncertainties is illustrative, but by no means exhaustive. For more information on factors that may affect future performance, please review “Risk Factors” described in our most recent Annual Report on Form 10-K and any subsequent Quarterly Reports on Form 10-Q filed with the Securities and Exchange Commission. These forward-looking statements reflect Coinstar, Inc.’s expectations as of the date of these prepared remarks. Coinstar, Inc. undertakes no obligation to update the information provided herein.
©2013 Coinstar, Inc. All Rights Reserved. These materials may not be reproduced, altered or distributed without the express written consent of Coinstar, Inc.
Coinstar, Inc. 2013 First Quarter Earnings
Prepared Remarks from CEO J. Scott Di Valerio and CFO Galen C. Smith
April 25, 2013
Use of Non-GAAP Financial Measures
Non-GAAP measures may be provided as a complement to results provided in accordance with United States generally accepted accounting principles (“GAAP”).
We use the following non-GAAP financial measures to evaluate our financial results:
| • | Core adjusted EBITDA; |
| • | Core diluted earnings per share (“EPS”); and |
| • | Free cash flow. |
These measures, the definitions of which are presented in Appendix A, are non-GAAP because they exclude certain amounts which are included in the most directly comparable measure calculated and presented in accordance with GAAP. Our non-GAAP financial measures are not meant to be considered in isolation or as a substitute for our GAAP financial measures and may not be comparable with similarly titled measures of other companies.
Core and Non-Core Results
We distinguish our core activities, those associated with our primary operations, from non-core activities. Non-core activities are primarily nonrecurring events or events we do not control. Our non-core adjustments include i) deal fees primarily related to the NCR Asset Acquisition, ii) income or loss from equity method investments, which represents our share of income or loss from entities we do not consolidate or control, and iii) a gain on the grant of a license to use certain Redbox trademarks to Redbox Instant™ by Verizon (“Non-Core Adjustments”). We believe investors should consider our core results because they are more indicative of our ongoing performance and trends and are more consistent with how management evaluates our operational results and trends.
Additional information and reconciliations of the non-GAAP financial measures are included in Appendix A.
©2013 Coinstar, Inc. All Rights Reserved. These materials may not be reproduced, altered or distributed without the express written consent of Coinstar, Inc.
Page 2
Coinstar, Inc. 2013 First Quarter Earnings
Prepared Remarks from CEO J. Scott Di Valerio and CFO Galen C. Smith
April 25, 2013
Continuing to Drive Profitable Growth
Q1 Key Achievements
| • | Generated Redbox revenue and rents per kiosk in line with our expectations; in the second half of the year, revenue and rents per kiosk are expected to be up year over year |
| • | Exceeded 40 million unique credit and debit cards used for Redbox rentals for the first time during a quarter |
| • | Experienced 6 of the 10 best rental days ever, including Redbox’s first 4 million rental day |
| • | Extended our licensing agreement with Universal through the end of 2014 |
| • | Signed an agreement with TD Canada Trust (TDCT) to install 350 TDCT branded coin-counting kiosks and completed the installations during the first week of April |
| • | Raised $350 million in offering of senior unsecured notes, with proceeds intended for general corporate purposes, including repayment of outstanding debt |
| • | Repurchased $46.5 million of our common stock |
A summary of Coinstar, Inc.’s consolidated results1 for the first quarter ended March 31, 2013, follows:
| Consolidated revenue |
$ | 574.7 million | ||
| Net income |
$ | 22.6 million | ||
| Core adjusted EBITDA2 |
$ | 104.2 million | ||
| Diluted EPS |
$ | 0.78 | ||
| Core diluted EPS2 |
$ | 0.93 | ||
| Net cash provided by operating activities |
$ | 41.1 million | ||
| Free cash flow2 |
$ | 7.9 million |
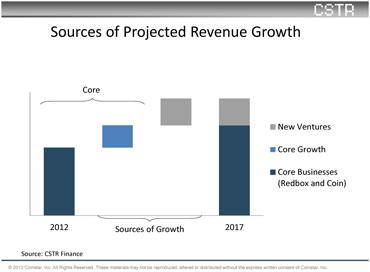
We continue to be focused on creating long-term value for our shareholders through a disciplined approach to profitable growth in the automated retail space. This space represents over $16 billion in potential market opportunity among six distinct targeted sectors (entertainment, money, food & beverage, electronics, beauty & consumer packaged goods, and health), anchored by our two core businesses, Redbox and Coinstar, which both continue to represent opportunities for top and bottom-line growth. As we discussed at our Analyst Day in February, we believe we have a path to profitably double the company’s revenue over the next five years with half of the growth coming from our core businesses and the other half anticipated from our new business ventures – which include our New Ventures segment, as well as strategic external investments and acquisitions – as shown in the slide below.
| 1 | In discussing financial results, the comparisons we make will be Q1 of 2013 versus Q1 of 2012, unless we state otherwise |
| 2 | Refer to Appendix A for a discussion of non-GAAP financial measures |
©2013 Coinstar, Inc. All Rights Reserved. These materials may not be reproduced, altered or distributed without the express written consent of Coinstar, Inc.
Page 3
Coinstar, Inc. 2013 First Quarter Earnings
Prepared Remarks from CEO J. Scott Di Valerio and CFO Galen C. Smith
April 25, 2013
We are focused on investing in our future automated retail concepts in a very thoughtful and methodical way to ensure we generate the proper return on these investments.
Today we proposed a corporate name change that reflects our focus on our future in automated retail. We have evolved from a single coin-counting kiosk business into multiple automated retail businesses. We selected Outerwall as an umbrella corporate brand that encompasses our current operations and provides a platform for future innovations and opportunities. We will ask our stockholders to approve the change to Outerwall Inc. at our Annual Meeting in June. In conjunction with the preliminary proxy filed today, we also filed a Form 10-K/A.
Additional Q1 consolidated metrics
Beginning in Q1 2013, we are discussing our capital expenditures (CAPEX) on an accrual basis rather than a cash basis as we believe this better aligns the reported CAPEX to activities during the quarter driving the expenditures. Our investments in CAPEX in Q1 reflect our focus on deploying capital to drive returns, and in Q1 total CAPEX was $40.5 million.
©2013 Coinstar, Inc. All Rights Reserved. These materials may not be reproduced, altered or distributed without the express written consent of Coinstar, Inc.
Page 4
Coinstar, Inc. 2013 First Quarter Earnings
Prepared Remarks from CEO J. Scott Di Valerio and CFO Galen C. Smith
April 25, 2013
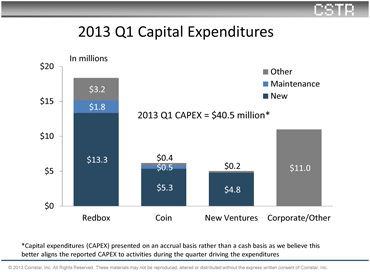
We are planning fewer new installations at Redbox in 2013 while we optimize our existing footprint following a significant deployment of kiosks in the second half of 2012. In Q1 we installed approximately 420 gross new kiosks, including 100 kiosks that replaced NCR kiosks. We removed 390 kiosks, resulting in 30 net new kiosks. We believe we can drive incremental performance and productivity by strategically redeploying select kiosks as needed to maximize rentals and productivity across the network. Redbox also invested in facilities, office equipment and internal software projects (“Other” in the table above). The kiosk CAPEX number for Redbox includes Canadian kiosks purchased during the quarter that will be installed in Q2 and beyond.
At Coin, we had 320 net new installations in Q1, the majority related to the TD Canada Trust agreement. “Other” includes vehicle leases.
A component of the New Ventures “New” CAPEX includes approximately 70 net new kiosk installs, the majority related to our Rubi™ coffee business, plus related parts in support of continued expansion of Rubi installs in Q2.
Corporate CAPEX primarily includes investments in software and hardware to support our businesses, data centers, and our Enterprise Resource Planning (ERP) system.
Total net interest expense for Q1 was $5.5 million including $1.8 million of non-cash interest expense and approximately $1.9 million related to the loss from early extinguishment of 4% Convertible Senior Notes (the “Convertible Notes”). We had $1.1 million in incremental interest expense, or approximately $0.02 per diluted share, from our new 6.000% Senior Unsecured Notes (the “Notes”) offering, which we completed late in the quarter.
©2013 Coinstar, Inc. All Rights Reserved. These materials may not be reproduced, altered or distributed without the express written consent of Coinstar, Inc.
Page 5
Coinstar, Inc. 2013 First Quarter Earnings
Prepared Remarks from CEO J. Scott Di Valerio and CFO Galen C. Smith
April 25, 2013
The effective tax rate was 36.1% for Q1 compared with 39.9% in Q1 2012. The decrease reflects federal research and general business tax credits for 2012 that were recorded in Q1 2013 when the American Taxpayer Relief Act of 2012 was passed on January 2, 2013. This was built into our full year rate when we provided guidance in February, and subsequently contributed $0.02 to EPS in Q1.
In Q1 the company generated $7.9 million in free cash flow (FCF), which was impacted by timing related items, including changes in working capital as well as a reduced benefit from deferred taxes, lowering FCF for the quarter.
Our balance sheet continues to be strong with $506.5 million of cash and cash equivalents, and short term investments, including $82.2 million, which is cash owed to our retail partners in relation to our Coin kiosks, and $343.8 million in net proceeds related to the Notes offering.
We ended the quarter with $646.8 million in total outstanding debt, a gross debt to core adjusted EBITDA ratio of 1.5x, and a net debt to core adjusted EBITDA ratio of 0.4x, without adjustments.
Share repurchase
In Q1 we repurchased $46.5 million of Coinstar common stock on the open market representing over 937,000 shares at an average price of $49.58. On January 31, 2013, the Board approved an additional authorization of $250 million and, at the end of Q1, there was $341.8 million remaining under the Board’s aggregate stock repurchase authorization.
We are targeting the repurchase of $100 million annually and will evaluate the level based on our financial performance and overall free cash flow generation. We consider stock buybacks an important component of our capital allocation strategy and intend to continue to be opportunistic in purchasing our shares at attractive price levels going forward.
Convertible debt
During Q1 we repurchased $44.6 million in face value of our Convertible Notes for $62.5 million, excluding accrued interest, in cash. The loss from early extinguishment of these notes was approximately $1.9 million, or approximately $0.04 of EPS, for the quarter. At the end of the quarter the aggregate outstanding principle of our Convertible Notes was $140.4 million.
©2013 Coinstar, Inc. All Rights Reserved. These materials may not be reproduced, altered or distributed without the express written consent of Coinstar, Inc.
Page 6
Coinstar, Inc. 2013 First Quarter Earnings
Prepared Remarks from CEO J. Scott Di Valerio and CFO Galen C. Smith
April 25, 2013
Coinstar common stock traded above $52.38, 130% of the conversion price of $40.29, for at least 20 trading days during the 30 consecutive days prior to the end of Q1. As a result our Convertible Notes are convertible in Q2. If noteholders elect to convert, we will be required to pay them the full face value of the Convertible Note in cash and deliver shares to cover any excess conversion value. Given that the notes are convertible, they are classified as a current liability and the debt conversion feature is classified as temporary equity on our balance sheet.
Since the end of Q1 through April 22, 2013, we have received conversion requests from noteholders representing $36.8 million face value of our Convertible Notes, which will settle in Q2, leaving $103.6 million notional outstanding. As we have the past two quarters, we will continue to opportunistically repurchase the Convertible Notes.
Senior Unsecured Notes offering
During Q1 we completed a private offering of $350 million in aggregate principal amount of 6.000% Senior Unsecured Notes due 2019 (the “Notes”), which was upsized from our original target amount of $300 million. We were pleased by the response to the offering and intend to use the proceeds for general corporate purposes, including repayment of outstanding debt.
Redbox
Strong start to the year
Building on the momentum coming out of Q4 2012, we posted a strong start to 2013 with record customer numbers, improved rental frequency among our most valuable customers, and continued growth in our Blu-ray business.
As we discussed when we provided guidance for Q1, the year over year comparisons for Redbox revenue were challenging due to the extraordinary performance at Redbox in Q1 2012 when 20 of the top 25 rental days of all time occurred. A strong release schedule in January 2012, including 22 titles with box office greater than or equal to $5 million, drove momentum through the quarter. By comparison, the release schedule in Q1 2013 began slower with only 12 new releases in January and 30% lower January box office than 2012. However, we had 6 of our top 10 rental days of all time in Q1 2013, including our first rental day to exceed 4 million rents.
©2013 Coinstar, Inc. All Rights Reserved. These materials may not be reproduced, altered or distributed without the express written consent of Coinstar, Inc.
Page 7
Coinstar, Inc. 2013 First Quarter Earnings
Prepared Remarks from CEO J. Scott Di Valerio and CFO Galen C. Smith
April 25, 2013
We ended the quarter strong, with March rental performance above March 2012 levels and in line with December 2012.
Redbox Q1 operating results
In Q1, including the NCR kiosks, Redbox revenue and rentals were both up 1% compared with Q1 2012, to $507.9 million and 198.4 million, respectively.
For the same period, Redbox U.S. rental revenue, excluding the NCR kiosks, was $503.9 million, an increase of $1.0 million compared with $502.9 million in Q1 2012, reflecting total rentals of 197.1 million, up 0.9 million year over year.
Net revenue per rental, or average check, was $2.56, slightly lower than expected due to a higher percentage of one-day rentals and a strong consumer response to promotion activity. At the same time, we continued to grow customers, and exceeded 40 million unique credit and debit cards in a quarter for the first time in our history. Total cards renting was up 5.6% year over year and up 2.7% compared with Q4 2012.
In Q1 we replaced 100 NCR kiosks with Redbox kiosks and removed 1,500 additional kiosks without replacing them. At the end of the quarter, we had approximately 300 NCR kiosks in service, which have now all been removed.
The NCR kiosks active and operating during Q1 generated $2.7 million in revenue from approximately 840,000 rentals and an operating loss of $6.9 million, or approximately $0.15 per diluted share.
Redbox segment operating income, which includes the NCR kiosk operating loss of $6.9 million, was $92.2 million and segment operating margin was 18.1%, down from 21.6% in Q1 2012, when better than expected revenue and incremental turns from a number of titles drove strong margins and bottom line. The primary factors impacting operating results were higher content costs related to growth in the installed base; increased purchases under our new Warner agreement, compared with the workaround in 2012; and increases in copy depth to drive rentals; as well as higher payment card processing fees and kiosk field operation costs directly attributable to the growth in the installed base, and support function costs as we focus on initiatives to increase our revenue by improving consumer insight and data capabilities to offer a better consumer experience.
©2013 Coinstar, Inc. All Rights Reserved. These materials may not be reproduced, altered or distributed without the express written consent of Coinstar, Inc.
Page 8
Coinstar, Inc. 2013 First Quarter Earnings
Prepared Remarks from CEO J. Scott Di Valerio and CFO Galen C. Smith
April 25, 2013
Product margin for Q1 was 56.0%, compared with 56.9% in Q1 2012.
Q1 same store sales were in line with our expectations and down 11.8% compared with Q1 last year. The key contributor is the cannibalization related to 2012 second half installs, particularly from the Redbox kiosks that replaced NCR kiosks. In markets where we had larger install growth in 2012, we are seeing a noticeably sharper decline in same store sales, although we are still growing total rentals in those markets.
We expect our same store sales rate to improve to positive territory as the year progresses and the kiosks installed last year enter the same store sales base.
Improved rental frequency among our most valuable customers
As we focus on growing revenue per customer in 2013, we are especially focused on our high frequency customers. These are the customers who make 4 or more visits per quarter, representing approximately 25% of our customer mix and approximately 60% of our total revenue. In the difficult market environment of Q3 2012, our total performance was impacted by a decline in frequency from this segment. However, the rebound we started to see in their frequency in Q4 2012 continued in Q1. This segment’s share of our total customer mix and share of total revenue were both up in Q1 compared with the second half of 2012 and were comparable to Q1 2012 levels.
New marketing strategies launching in the second half of the year, including Customer Relationship Management (CRM) and loyalty programs, will be focused on growing revenue per customer in this high frequency segment. We believe there is also an opportunity to increase rentals among the occasional renters who make 2 or less visits per quarter. We will be leveraging these strategies to build frequency and grow our share of wallet in that segment as well.
Strong market share growth extends Redbox leadership in physical rental
NPD reports that Redbox continues to gain share of the physical rental market in Q1, reaching 47.8% in Q1, up 7.2 share points compared with Q1 last year and 2.5 share points compared with Q4 2012. Our Q1 share growth came largely at the expense of B&M stores and By Mail providers, and we believe there is opportunity for meaningful share growth through 2013 and beyond.
©2013 Coinstar, Inc. All Rights Reserved. These materials may not be reproduced, altered or distributed without the express written consent of Coinstar, Inc.
Page 9
Coinstar, Inc. 2013 First Quarter Earnings
Prepared Remarks from CEO J. Scott Di Valerio and CFO Galen C. Smith
April 25, 2013
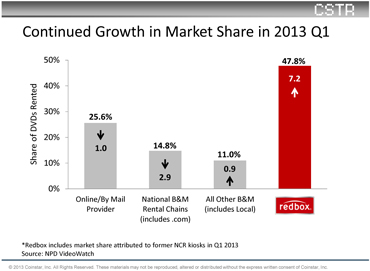
NPD’s Q1 2013 data also suggests that the decline in total physical rental is beginning to slow. In Q1 of 2012 NPD reported that total physical rental was showing a double digit decline in unit volume compared with the prior year, but that rate slowed considerably in Q1 2013. This suggests that the physical market is stabilizing following further Blockbuster store closings and Netflix’s continued efforts to shift their disc customers to streaming. We believe there is an opportunity for Redbox to continue to acquire physical rental customers and increase the revenue per customer in our existing customer base.
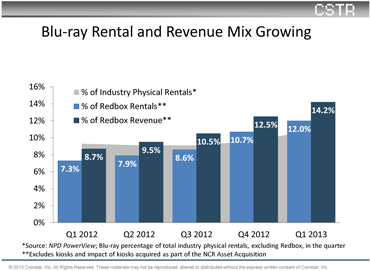
Blu-ray performance and segment growth exceeded our expectations
Blu-ray continued its strong performance in Q1, representing 14.2% of Redbox revenue. Blu-ray rentals exceeded our expectations as rental volume reached 12.0% of total rentals, up from 10.7% in Q4 2012 and up 65% compared with a year ago. We were pleased to see strong Blu-ray performance across all genres and on delay titles as well as day and date. Top performing titles included Flight, Ted, and Here Comes the Boom. We have also seen strong early performance from late Q1 releases including Argo and Zero Dark Thirty, highlighting customer demand for Blu-ray beyond the action genre.
Blu-ray remains a key focus for future growth as we continue to increase the rental mix of Blu-ray in 2013, shifting rentals to this higher revenue and higher margin dollar format.
©2013 Coinstar, Inc. All Rights Reserved. These materials may not be reproduced, altered or distributed without the express written consent of Coinstar, Inc.
Page 10
Coinstar, Inc. 2013 First Quarter Earnings
Prepared Remarks from CEO J. Scott Di Valerio and CFO Galen C. Smith
April 25, 2013
We expect to see a continued interest in the Blu-ray format as consumers continue to incorporate Blu-ray players for their home entertainment viewing. According to DEG, the number of households in 2012 with Blu-ray compatible devices grew 7% to 51 million households.
Video games performance momentum continues
Video games continued to perform well in Q1 and represented 5.1% of revenue and 2.2% of rentals, with rental volume up 16% compared with last year. In addition to the top line growth, a change in our buying strategy implemented in 2012 drove significant improvements in our product margin compared with Q1 2012. We had strong performance on big Q1 releases including: The Walking Dead: A Telltale Game, Tomb Raider, Bioshock: Infinite, and MLB 13: The Show. We were also pleased to see continued strong performance from Q4 2012 titles, underscoring the strong legs on these bigger titles.
Update on Redbox 2013 initiatives
Customer Strategy: As we have discussed, we believe that a key to our continued growth will be growing customer engagement and increasing revenue per customer, and we are particularly focused on the high frequency renters. We have made significant investments to support our customer strategy including marketing campaign management, improved consumer data, and expanded consumer insights capabilities. We expect to see a measurable impact from this strategy in the second half of 2013 as we improve effectiveness across our marketing touch-points, increase online engagement, and drive improved customer frequency and retention.
©2013 Coinstar, Inc. All Rights Reserved. These materials may not be reproduced, altered or distributed without the express written consent of Coinstar, Inc.
Page 11
Coinstar, Inc. 2013 First Quarter Earnings
Prepared Remarks from CEO J. Scott Di Valerio and CFO Galen C. Smith
April 25, 2013
Redbox Instant by Verizon: Redbox Instant™ by Verizon (RBI) reached a major milestone in mid-March as the Beta service was made publicly available to all U.S. consumers. In preparing for this milestone, RBI continuously enhanced the customer experience based on user feedback throughout the Beta, and they will continue to improve the consumer experience going forward. As RBI expanded the Beta we have seen an increase in customer acquisition levels and strong customer response to national promotions with partners including Xbox Live and Samsung.
Canada: In Canada we are focused on expanding our retail footprint and growing performance per location; we are making progress on both of these objectives. We expect to install 200 to 300 locations in Q2 with new partners, including Loblaws Supermarkets, Petro Canada, and Giant Tiger Stores, in addition to our continued expansion with Walmart Canada. As we continue to have dialog with other high profile retailers, we expect to announce additional retailer partners soon. In our existing network, we have made adjustments in merchandising and product allocation, which are starting to improve performance at the kiosk.
Redbox Tickets: Redbox Tickets™ was expanded to the Los Angeles market as we continue to gather more learnings about this new business. We are focused on adding more live events to our customer offering.
Vertical Merchandising Zone Enhancement (VMZ): In the second half of 2012, we introduced VMZ, a kiosk enhancement on new installations that increases our capacity per kiosk by more than 80 slots, allowing us to provide a greater selection of titles to customers. We have also begun converting our existing kiosks and expect to convert a significant portion of our network throughout 2013. From an inventory management perspective, we often remove discs from kiosks that are still renting to make room for newer movies. VMZ enables us to extend the life of content in the kiosk and ultimately should increase kiosk rental performance and margin dollars. Initial kiosks with this conversion have shown promising performance.
Coin
Coin operating results
In Q1 Coin revenue was $65.4 million, an increase of just under 1%, reflecting a $1.22 increase in the average transaction size to $39.22, offset by approximately 2% fewer transactions. Lower total transactions were due in part to the calendar: first, last year was a leap year, adding an extra day to Q1 2012; and this year Q1 included Good Friday and Easter, when volumes historically are lower.
©2013 Coinstar, Inc. All Rights Reserved. These materials may not be reproduced, altered or distributed without the express written consent of Coinstar, Inc.
Page 12
Coinstar, Inc. 2013 First Quarter Earnings
Prepared Remarks from CEO J. Scott Di Valerio and CFO Galen C. Smith
April 25, 2013
Coin added approximately 400 net new installations year over year; however, approximately 300 were installed in March 2013 as part of the TD Canada Trust agreement, and therefore were just beginning to ramp at the end of the quarter.
Same store sales increased 0.2%, reflecting primarily improved performance of the kiosks installed in 2011, which were still ramping up in Q1 2012. Kiosks in Canada performed well, driven by an increase in the conversion of the Canadian penny related to the Royal Canadian Mint’s decision to retire the penny.
Coin segment operating income was $18.6 million, compared with $19.3 million a year ago, and segment operating margin was 28.5%, down 1.3 percentage points from a year ago, primarily due to increased direct operating expenses, reflecting higher revenue share rates related to certain contract renewals and higher direct field costs. G&A expenses also increased as a percentage of revenue, reflecting higher expenses related to human resource programs and the continued expansion of our enterprise resource planning (ERP) system.
Coin growth initiatives
In Q1 the Coin business made important progress on initiatives that provide a foundation for growth in 2013 and beyond.
TD Canada Trust (TDCT): Coin began deploying kiosks at TDCT locations as part of an agreement to install and service over 350 TDCT-branded coin-counting kiosks and the installations were completed by the first week of April. We are pleased with the partnership, which provides coin processing to TDCT personal banking customers at no fee and to business customers and the general public at competitive rates. The agreement comes after a successful three-year pilot with TDCT in 13 locations.
We consider the financial institution channel an expansion opportunity as our automated retail solution allows financial institutions to enhance the consumer experience.
PayPal: Coin launched an offering with PayPal that allows consumers three unique opportunities to take advantage of their PayPal accounts: first, they can load coin or cash onto PayPal accounts; second, they can deposit those funds into another person’s account, such as a child away at college; and third, consumers can withdraw money from their PayPal accounts. We believe this offering allows us to leverage our existing coin network to give consumers access to e-payment alternatives. At the end of Q1, over 1,800 kiosks were activated with PayPal services.
©2013 Coinstar, Inc. All Rights Reserved. These materials may not be reproduced, altered or distributed without the express written consent of Coinstar, Inc.
Page 13
Coinstar, Inc. 2013 First Quarter Earnings
Prepared Remarks from CEO J. Scott Di Valerio and CFO Galen C. Smith
April 25, 2013
Blackhawk: Coin also announced an agreement with Blackhawk, the largest provider of consumer financial products and gift cards in the U.S., which will enable the business, over time, to expand the fee free card offering and additional prepaid products available to Coin consumers at the kiosks.
Gift Card Exchange: In early Q1 we moved the gift card exchange business from our New Ventures segment to the Coin business – a strategic shift based on the overlap in technology and retailer footprint of these two businesses. While we have just over 50 dedicated kiosks deployed today, consumer interest is strong and we think the opportunity to tap into the large category of unused gift cards is attractive.
New Ventures
New Ventures operating results
For Q1 our New Ventures segment reported $1.4 million in revenue, compared with $0.4 million in 2012, and a segment operating loss of $8.3 million, compared with $5.6 million a year ago. Revenue growth reflects an increase of approximately 160 kiosks in the marketplace compared with Q1 2012, which includes the growth of our Rubi coffee concept. The increased segment operating loss primarily reflects increases in two categories: First, direct operating expenses were up approximately $2.0 million due to additional product costs, field team expenses, and warehouse expenses to support the ventures, and Rubi in particular, as well as $0.5 million relating to the write-down of certain Orango inventory; and second, G&A expenses increased approximately $0.9 million due to increased headcount and travel to support the launch of Rubi, as well as increased headcount and travel expenses to support expanded pilots in our food, beauty sampling and photo businesses.
At our Analyst Day in February, we said that we were evaluating Orango, our kiosk concept that offers refurbished electronics, and in Q1 we began exploring strategic alternatives for that business. We determined that certain Orango assets would be sold or otherwise disposed of before the end of the previously established useful lives and, as a result, recorded an impairment charge of $2.5 million in additional depreciation expense and $0.5 million in direct operating expense in Q1.
We have consistently said that we expect some concepts to hit a point where they do not meet their required milestones. We believe this is the right time to explore alternatives for the concept and continue directing our investments to developing and scaling other businesses, particularly Rubi.
©2013 Coinstar, Inc. All Rights Reserved. These materials may not be reproduced, altered or distributed without the express written consent of Coinstar, Inc.
Page 14
Coinstar, Inc. 2013 First Quarter Earnings
Prepared Remarks from CEO J. Scott Di Valerio and CFO Galen C. Smith
April 25, 2013
Rubi update
We consider our Rubi business a key growth driver for the company and are very pleased with the progress we made in Q1, including receiving UL certification, which was an important step as we move toward accelerating the rollout of Rubi kiosks beginning in Q2. Both consumers and retailers love the product and the value proposition. We had over 100 kiosks in 6 markets at the end of Q1, including Boston, which we launched at the end of March. In addition, we recently added the Philadelphia market. We remain focused on expanding to 15 markets in the grocery channel as we move through 2013 installing between 1,000 and 2,000 kiosks.
Non-Core Results
During Q1 we contributed an additional $14.0 million to Redbox Instant by Verizon, our joint venture with Verizon, and our share of the total start-up losses was $6.4 million for the joint venture and $0.6 million for our other equity method investments.
Consolidated Guidance
We have provided a number of initiatives that we believe will drive growth later in 2013 and beyond.
At Redbox we are focused on growing the business system-wide since we are substantially reducing the number of new kiosk installs. Our results will continue to be strongly influenced by the availability of new release content in our kiosks. We are focused on driving incremental frequency among consumers by developing deeper relationships that we expect will enable us to capture a higher percentage of their entertainment spend.
At Coin, 2013 growth will be driven by the continued expansion of the PayPal product and the ramping of the recently installed kiosks at TDCT. We will continue to develop the gift card exchange business, laying the foundation for further growth.
2013 Q2 Consolidated Guidance
The release schedule and strength of titles continue to be key factors impacting our revenue expectations for Redbox and in turn for the company.
©2013 Coinstar, Inc. All Rights Reserved. These materials may not be reproduced, altered or distributed without the express written consent of Coinstar, Inc.
Page 15
Coinstar, Inc. 2013 First Quarter Earnings
Prepared Remarks from CEO J. Scott Di Valerio and CFO Galen C. Smith
April 25, 2013
Q2 2013 currently has an estimated total box office of $2.1 billion, including 35 titles with a box office greater than or equal to $5 million, which is in line with our release schedule in Q2 2012. In contrast to 2012, when Q2 box office was distributed relatively evenly throughout the quarter, we expect April and June to account for the majority of Q2 2013 box office, with approximately 15% of the quarter’s box office releasing in May. The Q2 2013 schedule includes 6 titles over $100 million, 5 of which release in April.
The Q2 box office breakdown, including titles with a box greater than or equal to $5 million, for Redbox kiosks by month is:
| • | 12 theatrical titles in April with total box office of approximately $1.1 billion, including 5 titles with box office over $100 million – Life of Pi, Django Unchained, The Hobbit: An Unexpected Journey, Les Miserables, and Silver Linings Playbook; |
| • | 10 theatrical titles in May with total box office of approximately $279 million. Though no titles in May have box office over $100 million, we expect Jack Reacher and Gangster Squad to be strong rental titles; and |
| • | 13 theatrical titles in June with total box office of approximately $759 million, consisting of a wide array of box office titles spanning multiple genres, which should provide a good mix for our customers. |
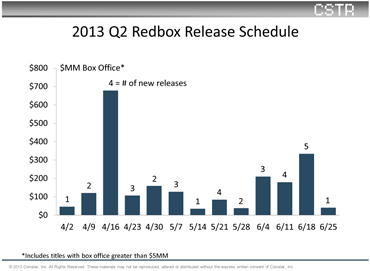
Though we typically see lower demand in April and May due to seasonality relative to other months, the strong June release slate should allow us to capitalize on the increasing rental demand we typically see in June as summer begins and school lets out.
©2013 Coinstar, Inc. All Rights Reserved. These materials may not be reproduced, altered or distributed without the express written consent of Coinstar, Inc.
Page 16
Coinstar, Inc. 2013 First Quarter Earnings
Prepared Remarks from CEO J. Scott Di Valerio and CFO Galen C. Smith
April 25, 2013
We expect Blu-ray rentals to represent approximately 14% to 16% of Redbox revenue in Q2.
We are expecting 11 new video game releases in Q2, one less than Q2 last year. We expect video game rentals will represent approximately 4% to 6% of Redbox revenue in Q2, which is up from 3.7% in Q2 2012.
We expect same store sales to improve from Q1 2013 to negative, single-digit same store sales in Q2 due to the large number of installs in the second half of 2012.
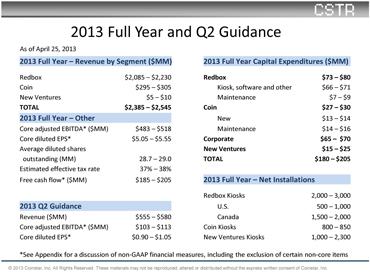
The second quarter of 2013 consolidated guidance includes:
| • | Consolidated revenues between $555 and $580 million |
| • | Core adjusted EBITDA between $103 and $113 million |
| • | Core diluted EPS between $0.90 and $1.05 |
Core diluted EPS will be impacted by approximately $1.8 million, or $0.04 per diluted share, in operating losses due to the closure of the remaining NCR kiosks and the amortization of intangibles, which did not impact Q2 2012. Core diluted EPS is further impacted by $5.4 million, or $0.12 per diluted share, of incremental interest expense related to the new Notes. The two items represent approximately $0.16 of core diluted EPS impact in Q2.
2013 Q2 Non-Core Guidance
For Q2 we expect our share of the start-up losses of Redbox Instant by Verizon along with our other equity method investments to be in the range of approximately $9 million to $11 million. We do not expect to make additional capital contributions to Redbox Instant by Verizon in Q2.
2013 Full Year Consolidated Guidance
On a consolidated basis, we continue to expect revenue and profitability to grow throughout the year.
Our expectations for Redbox have not changed and we expect:
| • | Revenue growth of 9% to 17% for the full year, with most of the growth coming in the second half of the year; |
| • | Revenue per kiosk to be in line with 2011 levels in the first half of the year; |
| • | Revenue per kiosk to exceed 2012 levels in the second half of the year; |
| • | Blu-ray and the ramping of the kiosks we installed in 2012 will be important drivers in our growth; and |
| • | We also expect to benefit from the VMZ enhancement and CRM as those initiatives come online over the year. |
©2013 Coinstar, Inc. All Rights Reserved. These materials may not be reproduced, altered or distributed without the express written consent of Coinstar, Inc.
Page 17
Coinstar, Inc. 2013 First Quarter Earnings
Prepared Remarks from CEO J. Scott Di Valerio and CFO Galen C. Smith
April 25, 2013
In our Coin segment, we expect single digit revenue growth for the year driven by the initiatives previously discussed.
For 2013 full year consolidated guidance, we expect:
| • | Consolidated revenue between $2.385 and $2.545 billion, which is $10 million higher on the bottom end due to an increase in Redbox expectations and $10 million lower for our expectations for New Ventures, primarily due to the new plans for Orango; |
| • | Core adjusted EBITDA of $483 to $518 million, up $10 million on the bottom of the range and $5 million on the top of the range; and |
| • | Core diluted EPS between $5.05 and $5.55 due to the earnings beat in Q1. This also includes $0.37 of incremental interest expense from the new Notes issued in March. |
For the full year, core diluted EPS will be impacted by approximately $11.3 million, or $0.24 per diluted share, in operating losses due to the closure of the remaining NCR kiosks and the amortization of intangibles. Core diluted EPS is further impacted by $17.1 million, or $0.37 per diluted share, of incremental interest expense related to the new Notes. The two items represent approximately $0.61 of core diluted EPS impact for the full year.
For 2013, we expect capital expenditures of $180 million to $205 million which is down on the top end from our expectations last quarter:
| • | Redbox – $73 to $80 million |
| • | Kiosk – $66 to $71 million for planned installs in the U.S. and Canada as well as software |
| • | Maintenance – $7 to $9 million |
| • | Coin – $27 to $30 million |
| • | New – $13 to $14 million for planned installs as well as software |
| • | Maintenance – $14 to $16 million |
| • | New Ventures – $15 to $25 million |
| • | New – $15 to $25 million for new installs, primarily Rubi |
| • | Corporate – $65 to $70 million |
| • | LOB/Corporate growth – $15 to $17 million |
| • | Infrastructure – $30 to $31 million |
| • | Maintenance – $20 to $22 million |
©2013 Coinstar, Inc. All Rights Reserved. These materials may not be reproduced, altered or distributed without the express written consent of Coinstar, Inc.
Page 18
Coinstar, Inc. 2013 First Quarter Earnings
Prepared Remarks from CEO J. Scott Di Valerio and CFO Galen C. Smith
April 25, 2013
We have slightly increased our view on free cash flow for the year now expecting free cash flow in the range of $185 million to $205 million. As we have previously said, 2013 represents the first year in which we will pay federal cash taxes after exhausting the majority of NOLs that have provided a benefit to free cash flow the past few years. Our current estimate for 2013 cash taxes remains in the range of $90 million to $105 million, including federal, state and foreign. We will continue to look for opportunities to further reduce our cash taxes.
For the year, we expect average diluted shares in the range of 28.7 million and 29.0 million, which does not include the impact of any additional share repurchases we might execute in 2013 but does include shares we expect to issue this quarter as Convertible Notes are settled.
2013 Non-Core Guidance
For 2013, non-core adjustments net of tax, including our share of the start-up losses of Redbox Instant by Verizon along with our other equity method investments, are expected to be in the range of approximately $12 million to $16 million.
The following table includes a summary of 2013 full year and Q2 guidance:
©2013 Coinstar, Inc. All Rights Reserved. These materials may not be reproduced, altered or distributed without the express written consent of Coinstar, Inc.
Page 19
Coinstar, Inc. 2013 First Quarter Earnings
Prepared Remarks from CEO J. Scott Di Valerio and CFO Galen C. Smith
April 25, 2013
Summary
We had a solid start to 2013 in the first quarter as we continued to deliver long-term value to our shareholders. Redbox expanded its lead in rentals in the physical market and marked a milestone with over 40 million unique credit cards used in the quarter. Coin expanded in a new channel with the installation of 350 TD of Canada Trust branded kiosks. We are excited about the growth initiatives we have in place and the opportunities we have to develop new concepts in automated retail. Our strong financial position along with our commitment to operational excellence, thoughtful investing and timely execution position us to deliver revenue, profit, cash flow, and returns to our shareholders as we drive existing and new automated retail concepts.
©2013 Coinstar, Inc. All Rights Reserved. These materials may not be reproduced, altered or distributed without the express written consent of Coinstar, Inc.
Page 20
Coinstar, Inc. 2013 First Quarter Earnings
Prepared Remarks from CEO J. Scott Di Valerio and CFO Galen C. Smith
April 25, 2013
APPENDIX A
Use of Non-GAAP Financial Measures
Non-GAAP measures may be provided as a complement to results provided in accordance with United States generally accepted accounting principles (“GAAP”).
We use the following non-GAAP financial measures to evaluate our financial results:
| • | Core adjusted EBITDA; |
| • | Core diluted earnings per share (“EPS”); and |
| • | Free cash flow. |
These measures, the definitions of which are presented below, are non-GAAP because they exclude certain amounts which are included in the most directly comparable measure calculated and presented in accordance with GAAP. Our non-GAAP financial measures are not meant to be considered in isolation or as a substitute for our GAAP financial measures and may not be comparable with similarly titled measures of other companies.
Core and Non-Core Results
We distinguish our core activities, those associated with our primary operations, from non-core activities. Non-core activities are primarily nonrecurring events or events we do not control. Our non-core adjustments include i) deal fees primarily related to the NCR Asset Acquisition, ii) income or loss from equity method investments, which represents our share of income or loss from entities we do not consolidate or control, and iii) a gain on the grant of a license to use certain Redbox trademarks to Redbox Instant™ by Verizon (“Non-Core Adjustments”). We believe investors should consider our core results because they are more indicative of our ongoing performance and trends and are more consistent with how management evaluates our operational results and trends.
Core Adjusted EBITDA
Our non-GAAP financial measure core adjusted EBITDA is defined as earnings before depreciation, amortization and other; interest expense, net; income taxes; share-based payments expense; and Non-Core Adjustments.
A reconciliation of core adjusted EBITDA to net income, the most comparable GAAP financial measure, is presented in the following table:
| Three Months Ended | ||||||||
| March 31, | ||||||||
| Dollars in thousands |
2013 | 2012 | ||||||
| Net income |
$ | 22,604 | $ | 53,696 | ||||
| Depreciation, amortization and other |
51,455 | 40,791 | ||||||
| Interest expense, net |
5,533 | 4,114 | ||||||
| Income taxes |
12,759 | 35,672 | ||||||
| Share-based payments expense(1) |
4,837 | 8,792 | ||||||
|
|
|
|
|
|||||
| Adjusted EBITDA |
97,188 | 143,065 | ||||||
| Non-Core Adjustments: |
||||||||
| Deal fees |
— | 1,203 | ||||||
| Loss from equity method investments |
7,025 | 4,341 | ||||||
| Gain on formation of Redbox Instant by Verizon |
— | (19,500 | ) | |||||
|
|
|
|
|
|||||
| Core adjusted EBITDA |
$ | 104,213 | $ | 129,109 | ||||
|
|
|
|
|
|||||
| (1) | Includes both non-cash share-based compensation for executives, non-employee directors and employees as well as share-based payments for content arrangements. |
©2013 Coinstar, Inc. All Rights Reserved. These materials may not be reproduced, altered or distributed without the express written consent of Coinstar, Inc.
Page 21
Coinstar, Inc. 2013 First Quarter Earnings
Prepared Remarks from CEO J. Scott Di Valerio and CFO Galen C. Smith
April 25, 2013
Core Diluted EPS
Our non-GAAP financial measure core diluted EPS is defined as diluted earnings per share excluding Non-Core Adjustments, net of applicable taxes.
A reconciliation of core diluted EPS to diluted EPS, the most comparable GAAP financial measure, is presented in the following table:
| Three Months Ended | ||||||||
| March 31, | ||||||||
| 2013 | 2012 | |||||||
| Diluted EPS |
$ | 0.78 | $ | 1.65 | ||||
| Non-Core Adjustments, net of tax:(1) |
||||||||
| Deal fees |
— | 0.02 | ||||||
| Loss from equity method investments |
0.15 | 0.08 | ||||||
| Gain on formation of the Joint Venture |
— | (0.36 | ) | |||||
|
|
|
|
|
|||||
| Core diluted EPS |
$ | 0.93 | $ | 1.39 | ||||
|
|
|
|
|
|||||
| (1) | Non-Core Adjustments are presented after-tax using the applicable effective tax rate for the respective periods. |
Free Cash Flow
Our non-GAAP financial measure free cash flow is defined as net cash provided by operating activities after capital expenditures. We believe free cash flow is an important non-GAAP measure as it provides additional information to users of the financial statements regarding our ability to service, incur or pay down indebtedness and repurchase our common stock.
A reconciliation of free cash flow to net cash provided by operating activities, the most comparable GAAP financial measure, is presented in the following table:
| Three Months Ended | ||||||||
| March 31, | ||||||||
| Dollars in thousands |
2013 | 2012 | ||||||
| Net cash provided by operating activities |
$ | 41,102 | $ | 54,918 | ||||
| Purchase of property and equipment |
(33,231 | ) | (38,007 | ) | ||||
|
|
|
|
|
|||||
| Free cash flow |
$ | 7,871 | $ | 16,911 | ||||
|
|
|
|
|
|||||
©2013 Coinstar, Inc. All Rights Reserved. These materials may not be reproduced, altered or distributed without the express written consent of Coinstar, Inc.
Page 22