Attached files
| file | filename |
|---|---|
| 8-K - FORM 8-K - AVNET INC | d526502d8k.htm |
| EX-99.1 - EX-99.1 - AVNET INC | d526502dex991.htm |
Exhibit 99.2
| Avnet, Inc. Q3 Fiscal Year 2013 | ||
| $ in millions - except per share data April 25, 2013 |
CFO Review of Fiscal 2013 Third Quarter Results
| 3Q’ FY12 | 2Q’ FY13 | 3Q’ FY13 | Y/Y Chg | Seq. Chg | ||||||||||||||||
| Sales |
$ | 6,280.6 | $ | 6,699.5 | $ | 6,298.7 | $ | 18.1 | ($ | 400.8 | ) | |||||||||
| Gross Profit |
$ | 753.8 | $ | 768.5 | $ | 756.0 | $ | 2.2 | ($ | 12.4 | ) | |||||||||
| GP Margin |
12.0 | % | 11.5 | % | 12.0 | % | 0 bps | 53 bps | ||||||||||||
| SG&A Expenses |
$ | 518.4 | $ | 548.0 | $ | 561.1 | $ | 42.7 | $ | 13.1 | ||||||||||
| SG&A as % of Sales |
8.3 | % | 8.2 | % | 8.9 | % | 66 bps | 73 bps | ||||||||||||
| SG&A as % of GP |
68.8 | % | 71.3 | % | 74.2 | % | 544 bps | 290 bps | ||||||||||||
| GAAP Operating Income |
$ | 216.8 | $ | 195.6 | $ | 167.6 | ($ | 49.2 | ) | ($ | 28.0 | ) | ||||||||
| Adjusted Operating Income (1) |
$ | 235.4 | $ | 220.5 | $ | 195.0 | ($ | 40.4 | ) | ($ | 25.5 | ) | ||||||||
| Adjusted Operating Income Margin (1) |
3.8 | % | 3.3 | % | 3.1 | % | (65 | ) bps | (19 | ) bps | ||||||||||
| GAAP Net Income (Loss) |
$ | 147.6 | $ | 137.5 | $ | 86.2 | ($ | 61.4 | ) | ($ | 51.3 | ) | ||||||||
| Adjusted Net Income (1) |
$ | 151.6 | $ | 140.0 | $ | 125.4 | ($ | 26.3 | ) | ($ | 14.6 | ) | ||||||||
| GAAP Diluted EPS |
$ | 1.00 | $ | 0.99 | $ | 0.62 | -38.0 | % | -37.4 | % | ||||||||||
| Adjusted EPS (1) |
$ | 1.03 | $ | 1.01 | $ | 0.90 | -12.6 | % | -10.9 | % | ||||||||||
| Return on Working Capital (ROWC) (1) |
24.1 | % | 22.1 | % | 20.0 | % | (409 | ) bps | (213 | ) bps | ||||||||||
| Return on Capital Employed (ROCE) (1) |
12.8 | % | 11.9 | % | 10.5 | % | (229 | ) bps | (132 | ) bps | ||||||||||
| Working Capital Velocity |
6.43 | 6.72 | 6.46 | 0.03 | (0.26 | ) | ||||||||||||||
| (1) | A reconcilliation of non-GAAP financial measures is presented in the Non-GAAP Financial Information section at the end of this document. |
K e y H i g h l i g h t s
| • | Sales declined 6.0% sequentially to $6.3 billion, which is within the normal seasonal range of -4% to -7%. |
| • | Gross profit margin improved 53 basis points sequentially to 12.0% with both operating groups contributing to the improvement. |
| • | Adjusted operating income decreased 11.6% sequentially to $195 million and operating income margin declined 19 basis points as an improvement in EM was more than offset by a decline in TS, which is in line with typical seasonality. |
| • | Adjusted diluted earnings per share declined 12.6% year over year and 10.9% sequentially to $0.90 due to the decline in operating income. |
| • | Cash from operations was $22 million in the March 2013 quarter and $689 million over the trailing twelve months. |
1
| Avnet, Inc. Q3 Fiscal Year 2013 | ||
| $ in millions - except per share data April 25, 2013 |
R e v e n u e
| Year-over-Year Growth Rates | ||||||||||||||||||||||||||||
| 3Q’ FY12 | 4Q’ FY12 | 1Q’ FY13 | 2Q’ FY13 | 3Q’ FY13 | Reported (1) | Pro forma (2) | ||||||||||||||||||||||
| Avnet, Inc. |
6,280.6 | 6,307.4 | 5,870.1 | 6,699.5 | 6,298.7 | 0.29 | % | -4.75 | % | |||||||||||||||||||
| Excluding FX (1) |
0.63 | % | -4.42 | % | ||||||||||||||||||||||||
| Electronics Marketing (EM) Total |
3,756.9 | 3,764.4 | 3,653.2 | 3,673.5 | 3,797.2 | 1.07 | % | -2.20 | % | |||||||||||||||||||
| Excluding FX (1) |
1.60 | % | -1.69 | % | ||||||||||||||||||||||||
| Americas |
1,458.4 | 1,435.4 | 1,287.8 | 1,264.9 | 1,320.1 | -9.48 | % | -12.26 | % | |||||||||||||||||||
| EMEA |
1,091.7 | 1,044.5 | 958.5 | 914.3 | 1,100.1 | 0.77 | % | -0.68 | % | |||||||||||||||||||
| Excluding FX (1) |
0.01 | % | -1.43 | % | ||||||||||||||||||||||||
| Asia |
1,206.8 | 1,284.6 | 1,406.9 | 1,494.3 | 1,377.0 | 14.11 | % | 8.40 | % | |||||||||||||||||||
| Technology Solutions (TS) Total |
2,523.7 | 2,543.0 | 2,216.9 | 3,026.0 | 2,501.5 | -0.88 | % | -8.37 | % | |||||||||||||||||||
| Excluding FX (1) |
-0.81 | % | -8.30 | % | ||||||||||||||||||||||||
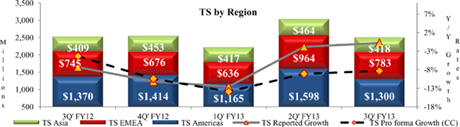
| Americas |
1,369.6 | 1,414.4 | 1,164.6 | 1,598.3 | 1,300.1 | -5.07 | % | -7.63 | % | |||||||||||||||||||
| EMEA |
744.8 | 676.1 | 635.5 | 963.8 | 783.0 | 5.11 | % | -14.56 | % | |||||||||||||||||||
| Excluding FX (1) |
5.10 | % | -14.57 | % | ||||||||||||||||||||||||
| Asia |
409.3 | 452.5 | 416.8 | 463.9 | 418.4 | 2.23 | % | 3.05 | % | |||||||||||||||||||
| (1) | Year-over-year revenue growth rate excluding the impact of changes in foreign currency exchange rates. |
| (2) | Pro forma revenues as defined in this document. |
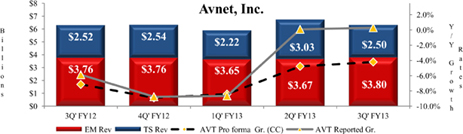
| • | Avnet, Inc. quarterly revenue of $6.3 billion was in line with expectations and represented a second straight quarter of modest year-over-year growth increasing 0.6% when excluding the translation impact of changes in foreign currency exchange rates (also referred to as “constant dollars” or “constant currency” and referenced as “CC” in the graphs that follow). |
| • | Year-over-year pro forma sales (defined later in this document) decreased 4.8% (down 4.4% in constant dollars), primarily due to the slower recovery in the western regions. |
| • | On a sequential basis, pro forma sales decreased 6.3%, which is near the high end of normal seasonality of |
-4% to -7%.
2
| Avnet, Inc. Q3 Fiscal Year 2013 | ||
| $ in millions - except per share data April 25, 2013 |
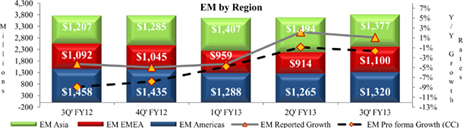
| • | Electronics Marketing (EM) quarterly revenue of $3.8 billion increased 1.1% year over year (up 1.6% in constant dollars) and decreased 2.2% on a pro forma basis (down 1.7% in constant currency). |
| • | EM’s revenue increased 3.4% sequentially in reported dollars and pro forma sequential growth was 2.9%, below normal seasonality of +4% to +7% due to weaker demand in the Americas region. |
| • | America’s pro forma revenue declined 12.3% year over year primarily due to the decision to exit the lower margin commercial components business in the Latin America region, pro forma revenue increased 2.9% sequentially. |
| • | EMEA’s pro forma revenue declined 1.4% year over year in constant dollars and increased 18.2% sequentially in constant dollars, which was in line with expectations. |
| • | Asia’s pro forma revenue increased 8.4% year over year due to the stronger recovery relative to the western regions, pro forma revenue declined 7.9% sequentially, which is in line with typical seasonality. |
| • | Technology Solutions revenue decreased 0.9% year over year to $2.5 billion and on a pro forma basis revenue declined 8.4% primarily due to slower growth in the western regions. |
| • | TS’ revenue decreased 17.3% sequentially (pro forma revenue declined 17.5% in constant dollars), which was near the high end of the normal seasonal range of -16% to -20%. |
| • | America’s pro forma revenue declined 7.6% year over year and 18.9% sequentially. |
| • | EMEA’s pro forma revenue declined 14.6% year over year and 18.8% sequentially. |
| • | Asia’s pro forma revenue increased 3.1% year over year and declined 9.5% sequentially. |
| • | Storage, services, and networking and security grew year over year partially offset by declines in servers and computing components. |
3
| Avnet, Inc. Q3 Fiscal Year 2013 | ||
| $ in millions - except per share data April 25, 2013 |
G r o s s P r o f i t
| 3Q’ FY12 | 4Q’ FY12 | 1Q’ FY13 | 2Q’ FY13 | 3Q’ FY13 | Y/Y Change | |||||||||||||||||||
| Gross Profit |
$ | 753.8 | $ | 759.0 | $ | 684.4 | $ | 768.5 | $ | 756.0 | $ | 2.2 | ||||||||||||
| Gross Profit Margin |
12.0 | % | 12.0 | % | 11.7 | % | 11.5 | % | 12.0 | % | 0 bps | |||||||||||||
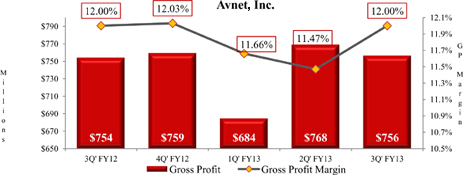
| • | Gross profit dollars were $756 million, up 0.3% year over year and down 1.6% sequentially. |
| • | Gross profit margin of 12.0% was flat with the year ago quarter and up 53 basis points sequentially with both operating groups contributing to the improvement. |
| • | EM gross profit margin increased 44 basis points sequentially due to the seasonal mix shift to the higher-margin western regions and declined 38 basis points year over year primarily due to a decline in the EMEA region as a result of increased competitive pressure, partially offset by an increase in the Americas region. In addition, the geographic mix shift to the lower-margin Asia region contributed to the year-over-year decline as Asia grew from 32% of EM revenue in the year ago quarter to 36% in the current quarter. |
| • | TS gross profit margin increased 25 basis points sequentially and 54 basis points year over year, primarily due to an increase in the Americas and EMEA region driven by a revenue mix shift to higher-margin products and services. |
4
| Avnet, Inc. Q3 Fiscal Year 2013 | ||
| $ in millions - except per share data April 25, 2013 |
O p e r a t i n g E x p e n s e s
| 3Q’ FY12 | 4Q’ FY12 | 1Q’ FY13 | 2Q’ FY13 | 3Q’ FY13 | Y/Y Change | |||||||||||||||||||
| Selling, General and Adminstrative Expenses |
$ | 518.4 | $ | 525.1 | $ | 547.0 | $ | 548.0 | $ | 561.1 | $ | 42.7 | ||||||||||||
| SG&A Expenses as a % of Gross Profit |
68.8 | % | 69.2 | % | 79.9 | % | 71.3 | % | 74.2 | % | 544 bps | |||||||||||||
| EM SG&A Expense as a % of Gross Profit |
62.3 | % | 62.6 | % | 69.4 | % | 70.4 | % | 68.0 | % | 568 bps | |||||||||||||
| TS SG&A Expense as a % of Gross Profit |
71.6 | % | 72.7 | % | 83.3 | % | 63.4 | % | 74.9 | % | 333 bps | |||||||||||||
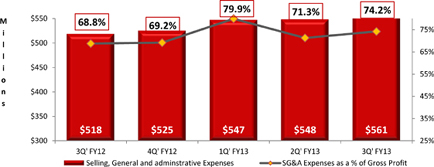
| • | Selling, general and administrative expenses (“SG&A expenses”) increased 8.2% year over year and 2.4% sequentially to $561 million. |
| • | The $42.7 million year-over-year increase consisted of an increase of approximately $52 million due to operating expenses of acquired businesses, partially offset by an organic decrease of approximately $7.1 million related to cost reduction actions, net of other items, and a decrease of approximately $2.2 million due to the translation impact of changes in foreign currency exchange rates. |
| • | During the third quarter of fiscal 2013, the Company initiated annualized expense reductions of approximately $40 million that will be completed by the end of the fourth fiscal quarter. These cost reductions, when combined with the actions taken in prior quarters, brings cumulative announced cost reductions in fiscal 2013 to approximately $140 million. |
5
| Avnet, Inc. Q3 Fiscal Year 2013 | ||
| $ in millions - except per share data April 25, 2013 |
O p e r a t i n g I n c o m e
| 3Q’ FY12 | 4Q’ FY12 | 1Q’ FY13 | 2Q’ FY13 | 3Q’ FY13 | Y/Y Chg | |||||||||||||||||||
| Avnet, Inc. GAAP Operating Income |
$ | 216.8 | $ | 213.4 | $ | 100.0 | $ | 195.6 | $ | 167.6 | ($ | 49.2 | ) | |||||||||||
| Adjusted Operating Income (1) |
$ | 235.4 | $ | 233.9 | $ | 137.4 | $ | 220.5 | $ | 195.0 | ($ | 40.4 | ) | |||||||||||
| Adjusted Operating Margin (1) |
3.75 | % | 3.71 | % | 2.34 | % | 3.29 | % | 3.10 | % | (65 | )bps | ||||||||||||
| Electronics Marketing (EM) Total |
||||||||||||||||||||||||
| Operating Income |
$ | 194.3 | $ | 191.1 | $ | 146.3 | $ | 140.1 | $ | 162.1 | ($ | 32.2 | ) | |||||||||||
| Operating Income Margin |
5.17 | % | 5.08 | % | 4.00 | % | 3.81 | % | 4.27 | % | (90 | )bps | ||||||||||||
| Technology Solutions (TS) Total |
||||||||||||||||||||||||
| Operating Income |
$ | 67.9 | $ | 67.5 | $ | 34.4 | $ | 108.0 | $ | 62.8 | ($ | 5.1 | ) | |||||||||||
| Operating Income Margin |
2.69 | % | 2.65 | % | 1.55 | % | 3.57 | % | 2.51 | % | (18 | )bps | ||||||||||||
| (1) | A reconciliation of GAAP to non-GAAP financial measures is presented in the Non-GAAP Financial Information section at the end of this document. |
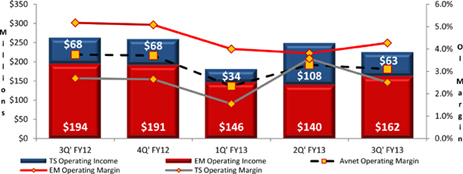
| • | Adjusted enterprise operating income of $195.0 million declined 17.2% year over year primarily due to impact of lower profitability in the western regions. |
| • | Adjusted operating income margin of 3.1% declined 65 basis points year over year and 19 basis points sequentially as a sequential increase at EM was more than offset by the typical decline at TS coming off its seasonally strong December quarter. |
| • | EM operating income margin decreased 90 basis points year over year primarily due to a decline in the western regions driven by the slower recovery; operating income margin increased 46 basis points sequentially with all three regions contributing to the improvement. |
| • | TS operating income margin declined 18 basis points year over year primarily due to the EMEA region where the positive impacts of an improvement in gross profit margin and cost reductions have been offset by negative organic growth and the impact of recent acquisitions as the related cost synergies have not yet been fully realized; operating income margin declined 106 basis points sequentially due to the seasonal decline coming off the strong December quarter. |
6
| Avnet, Inc. Q3 Fiscal Year 2013 | ||
| $ in millions - except per share data April 25, 2013 |
I n t e r e s t E x p e n s e , O t h e r I n c o m e a n d I n c o m e T a x e s
| 3Q’ FY12 | 4Q’ FY12 | 1Q’ FY13 | 2Q’ FY13 | 3Q’ FY13 | Y/Y Change | |||||||||||||||||||
| Interest Expense |
($ | 23.6 | ) | ($ | 23.2 | ) | ($ | 23.9 | ) | ($ | 27.8 | ) | ($ | 27.3 | ) | ($ | 3.8 | ) | ||||||
| Other Income (Expense) |
$ | 3.2 | ($ | 4.1 | ) | $ | 1.5 | $ | 1.1 | $ | 4.1 | ($ | 0.9 | ) | ||||||||||
| GAAP Income Taxes |
$ | 53.4 | $ | 52.6 | $ | 8.6 | $ | 31.4 | $ | 58.2 | $ | 4.8 | ||||||||||||
| Adjusted Income Taxes (1) |
$ | 63.4 | $ | 61.4 | $ | 31.0 | $ | 53.8 | $ | 46.4 | ($ | 17.1 | ) | |||||||||||
| GAAP Effective Tax Rate |
26.56 | % | 28.28 | % | 7.86 | % | 18.60 | % | 40.30 | % | 1,374 bps | |||||||||||||
| Adjusted Effective Tax Rate (1) |
29.50 | % | 29.69 | % | 27.00 | % | 27.75 | % | 27.00 | % | (250 | ) bps | ||||||||||||
| (1) | A reconciliation of GAAP to non-GAAP financial measures is presented in the Non-GAAP Financial Information section at the end of this document. |
| • | Interest expense for the March 2013 quarter was $27.3 million, up $3.8 million over the prior year quarter due to higher average debt outstanding and the impact of the November 2012 issuance of long-term senior notes that have a higher interest rate than the short-term debt they replaced. |
| • | The Company recognized $4.1 million of other income in the March quarter, as compared with other income of $3.2 million in the prior year. |
| • | The GAAP effective tax rate of 40.3% in the third quarter was significantly higher than the year ago quarter primarily due to the unfavorable impact of increases to valuation allowances and reserves. |
7
| Avnet, Inc. Q3 Fiscal Year 2013 | ||
| $ in millions - except per share data April 25, 2013 |
N e t I n c o m e a n d E P S
| 3Q’ FY12 | 4Q’ FY12 | 1Q’ FY13 | 2Q’ FY13 | 3Q’ FY13 | Y/Y Change | |||||||||||||||||||
| GAAP Net Income |
$ | 147.6 | $ | 133.4 | $ | 100.3 | $ | 137.5 | $ | 86.2 | -41.6 | % | ||||||||||||
| Adjusted Net Income (1) |
$ | 151.6 | $ | 145.3 | $ | 83.9 | $ | 140.0 | $ | 125.4 | -17.3 | % | ||||||||||||
| GAAP EPS |
$ | 1.00 | $ | 0.91 | $ | 0.70 | $ | 0.99 | $ | 0.62 | -38.0 | % | ||||||||||||
| Adjusted EPS (1) |
$ | 1.03 | $ | 0.99 | $ | 0.59 | $ | 1.01 | $ | 0.90 | -12.6 | % | ||||||||||||
| (1) | A reconciliation of GAAP to non-GAAP financial measures is presented in the Non-GAAP Financial Information section at the end of this document. |
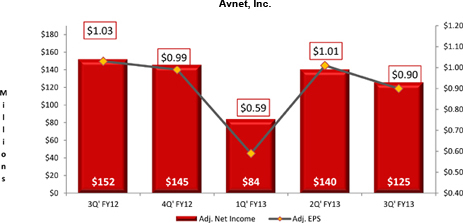
| • | GAAP net income for the third quarter of fiscal 2013 was $86.2 million, or $0.62 per share on a diluted basis, which declined sequentially by 37.3% and 37.4%, respectively, primarily due to the impact of restructuring, integration and other charges and to a lesser extent the decline in profitability discussed above. |
| • | Adjusted net income for the third quarter of fiscal 2013 was $125.4 million, or $0.90 per share on a diluted basis. |
| • | On an adjusted basis, sequential net income and diluted earnings per share declined 10.4% and 10.9%, respectively, due to lower profitability at TS related to the seasonal decline coming off the strong December quarter partially offset by an increase at EM. |
| • | Adjusted earnings per share of $0.90 declined $0.13 or 12.6% from the year ago quarter due to the factors noted above. |
8
| Avnet, Inc. Q3 Fiscal Year 2013 | ||
| $ in millions - except per share data April 25, 2013 |
W o r k i n g C a p i t a l
| 3Q’ FY12 | 4Q’ FY12 | 1Q’ FY13 | 2Q’ FY13 | 3Q’ FY13 | Y/Y Change | |||||||||||||||||||
| Account Receivable |
$ | 4,658.8 | $ | 4,607.3 | $ | 4,477.9 | $ | 5,161.5 | $ | 4,778.1 | $ | 119.3 | ||||||||||||
| Inventory |
$ | 2,490.3 | $ | 2,388.7 | $ | 2,360.5 | $ | 2,223.8 | $ | 2,284.7 | ($ | 205.6 | ) | |||||||||||
| Accounts Payable |
($ | 3,237.5 | ) | ($ | 3,230.8 | ) | ($ | 2,920.6 | ) | ($ | 3,565.4 | ) | ($ | 3,175.5 | ) | $ | 62.0 | |||||||
|
|
|
|
|
|
|
|
|
|
|
|||||||||||||||
| Working Capital |
$ | 3,911.6 | $ | 3,765.2 | $ | 3,917.8 | $ | 3,819.9 | $ | 3,887.3 | ($ | 24.3 | ) | |||||||||||
|
|
|
|
|
|
|
|
|
|
|
|||||||||||||||
| Working Capital Velocity |
6.43 | 6.40 | 6.20 | 6.72 | 6.46 | 0.03 | ||||||||||||||||||
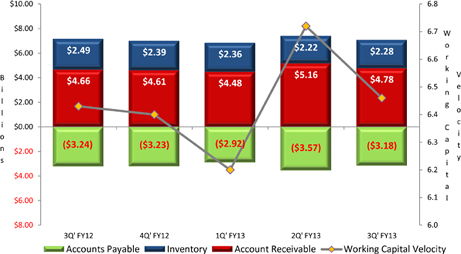
| • | Working capital (receivables plus inventory less accounts payable) declined $24.3 million year over year and decreased 3.1% when adjusted for acquisitions and the translation impact of changes in foreign currency exchange rates. |
| • | Working capital velocity was roughly flat with the year ago quarter and declined 0.3 turns sequentially due to the seasonal business mix shift as the higher working capital velocity TS business declined from 45% of enterprise revenue in the December quarter to 40% in the March quarter. |
| • | EM improved working capital velocity both sequentially and year over year primarily due to a decrease in days of inventory of 5.3 days year over year and 2.8 days sequentially. |
| • | Inventory declined $205.6 million year over year and decreased 10.2% when adjusted for acquisitions and the translation impact of changes in foreign currency exchange rates primarily due to a reduction at EM. |
9
| Avnet, Inc. Q3 Fiscal Year 2013 | ||
| $ in millions - except per share data April 25, 2013 |
R e t u r n s
| 3Q’ FY12 | 4Q’ FY12 | 1Q’ FY13 | 2Q’ FY13 | 3Q’ FY13 | Y/Y Change | |||||||||||||||||||
| Return on Working Capital (ROWC) (1) |
24.08 | % | 23.72 | % | 14.51 | % | 22.12 | % | 19.99 | % | (409 | ) bps | ||||||||||||
| Return on Capital Employed (ROCE) (1) |
12.83 | % | 12.54 | % | 7.82 | % | 11.86 | % | 10.54 | % | (229 | ) bps | ||||||||||||
| (1) | A reconciliation of non-GAAP financial measures to GAAP financial measures is presented in the Non-GAAP Financial Information section at the end of this document. |
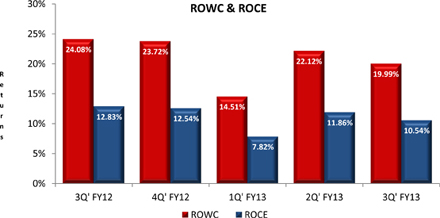
| • | ROWC for the quarter was 20.0%, a decrease of 409 basis points year over year and 213 basis points sequentially. |
| • | The year-over–year decrease was primarily due to lower profitability in the western regions. |
| • | The sequential decline was primarily due to the typical decline at TS after its seasonally strong December quarter that was partially offset by a 362 basis point improvement at EM, which realized both operating income margin and working capital velocity improvement sequentially. |
| • | ROCE of 10.5% declined 229 basis points year over year and 132 basis points sequentially. |
10
| Avnet, Inc. Q3 Fiscal Year 2013 | ||
| $ in millions - except per share data April 25, 2013 |
C a s h F l o w
| 3Q’ FY12 | 4Q’ FY12 | 1Q’ FY13 | 2Q’ FY13 | 3Q’ FY13 | Y/Y Change | |||||||||||||||||||
| Net Income |
$ | 147.6 | $ | 133.4 | $ | 100.3 | $ | 137.5 | $ | 86.2 | ($ | 61.4 | ) | |||||||||||
| Non-Cash Items |
$ | 60.7 | $ | 39.8 | $ | 27.9 | $ | 57.6 | $ | 75.0 | $ | 14.3 | ||||||||||||
| Working Capital |
($ | 184.7 | ) | $ | 86.1 | ($ | 47.2 | ) | $ | 131.3 | ($ | 139.2 | ) | $ | 45.5 | |||||||||
|
|
|
|
|
|
|
|
|
|
|
|||||||||||||||
| Cash Flow from Operations |
$ | 23.6 | $ | 259.3 | $ | 81.0 | $ | 326.4 | $ | 22.0 | ($ | 1.6 | ) | |||||||||||
|
|
|
|
|
|
|
|
|
|
|
|||||||||||||||
| TTM CF from Operations |
$ | 550.9 | $ | 528.7 | $ | 813.8 | $ | 690.3 | $ | 688.7 | $ | 137.8 | ||||||||||||
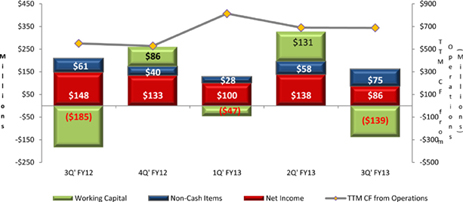
| • | During the third quarter of fiscal 2013, cash flow from operations was $22.0 million and over the trailing twelve months was $688.7 million. |
| • | Cash flow from operations was $22.0 million for the quarter as net income adjusted for non-cash items was partially offset by the seasonal increase in working capital at TS. |
| • | The Company did not purchase any shares under the $750 million stock repurchase program during the March quarter. As of the end of the quarter, the Company has approximately $225 million remaining in the program. |
| • | Cash and cash equivalents at the end of the quarter were $821 million; net debt (total debt less cash and cash equivalents) was $1.26 billion. |
11
| Avnet, Inc. Q3 Fiscal Year 2013 | ||
| $ in millions - except per share data April 25, 2013 |
Forward-Looking Statements
This document contains certain “forward-looking statements” within the meaning of Section 27A of the Securities Act of 1933, as amended, and Section 21E of the Securities Exchange Act of 1934, as amended. These statements are based on management’s current expectations and are subject to uncertainty and changes in facts and circumstances. The forward-looking statements herein include statements addressing future financial and operating results of Avnet and may include words such as “will,” “anticipate,” “estimate,” “forecast,” “expect,” believe,” and “should,” and other words and terms of similar meaning in connection with any discussions of future operating or financial performance, business prospects or market conditions. Actual results may vary materially from the expectations contained in the forward-looking statements.
The following factors, among others, could cause actual results to differ materially from those described in the forward-looking statements: the Company’s ability to retain and grow market share and to generate additional cash flow, risks associated with any acquisition activities and the successful integration of acquired companies, declines in sales, changes in business conditions and the economy in general, changes in market demand and pricing pressures, any material changes in the allocation of product or product rebates by suppliers, allocations of products by suppliers, other competitive and/or regulatory factors affecting the businesses of Avnet generally.
More detailed information about these and other factors is set forth in Avnet’s filings with the Securities and Exchange Commission, including the Company’s reports on Form 10-K, Form 10-Q and Form 8-K. Except as required by law, Avnet is under no obligation to update any forward-looking statements, whether as a result of new information, future events or otherwise.
Non-GAAP Financial Information
In addition to disclosing financial results that are determined in accordance with generally accepted accounting principles in the United States (“GAAP”), the Company also discloses in this document certain non-GAAP financial information including adjusted operating income, adjusted net income and adjusted diluted earnings per share, as well as revenue adjusted for the impact of acquisitions and other items (as defined in the Pro forma (Organic) Revenue section of this document). Management believes pro forma revenue is a useful measure for evaluating current period performance as compared with prior periods and for understanding underlying trends.
Management believes that operating income adjusted for restructuring, integration and other items is a useful measure to help investors better assess and understand the Company’s operating performance, especially when comparing results with previous periods or forecasting performance for future periods, primarily because management views the excluded items to be outside of Avnet’s normal operating results. Management analyzes operating income without the impact of these items as an indicator of ongoing margin performance and underlying trends in the business. Management also uses these non-GAAP measures to establish operational goals and, in some cases, for measuring performance for compensation purposes.
Management believes net income and EPS adjusted for the impact of the items described above is useful to investors because it provides a measure of the Company’s net profitability on a more comparable basis to historical periods and provides a more meaningful basis for forecasting future performance. Additionally, because of management’s focus on generating shareholder value, of which net profitability is a primary driver, management believes net income and EPS excluding the impact of these items provides an important measure of the Company’s net results of operations for the investing public.
12
| Avnet, Inc. Q3 Fiscal Year 2013 | ||
| $ in millions - except per share data April 25, 2013 |
Other metrics management monitors in its assessment of business performance include return on working capital (ROWC), return on capital employed (ROCE) and working capital velocity (WC velocity).
| • | ROWC is defined as annualized operating income, excluding restructuring, integration and other items, divided by the sum of the monthly average balances of receivables and inventory less accounts payable. |
| • | ROCE is defined as annualized, tax effected operating income, excluding restructuring, integration and other items, divided by the monthly average balances of interest-bearing debt and equity (including the impact of restructuring, integration, impairment charges and other items) less cash and cash equivalents. |
| • | WC velocity is defined as annualized sales divided by the sum of the monthly average balances of receivable and inventory less accounts payable. |
Any analysis of results and outlook on a non-GAAP basis should be used as a complement to, and in conjunction with, data presented in accordance with GAAP.
Third Quarter Fiscal 2013
| Third Quarter Ended Fiscal 2013 | ||||||||||||||||
| Op Income | Pre-tax | Net Income | Diluted EPS |
|||||||||||||
| $ in thousands, except per share data | ||||||||||||||||
| GAAP results |
$ | 167,610 | $ | 144,375 | $ | 86,196 | $ | 0.62 | ||||||||
| Restructuring, integration and other charges |
27,341 | 27,341 | 25,786 | 0.18 | ||||||||||||
| Income tax adjustments |
— | — | 13,371 | 0.10 | ||||||||||||
|
|
|
|
|
|
|
|
|
|||||||||
| Total adjustments |
27,341 | 27,341 | 39,157 | 0.28 | ||||||||||||
|
|
|
|
|
|
|
|
|
|||||||||
| Adjusted results |
$ | 194,951 | $ | 171,716 | $ | 125,353 | $ | 0.90 | ||||||||
|
|
|
|
|
|
|
|
|
|||||||||
Items impacting the third quarter of fiscal 2013 consisted of the following:
| • | Restructuring, integration and other charges of $27.3 million pre-tax consisted of $14.9 million for integration-related costs of which $8.8 million related to the exit of two multi-employer pension plans in Japan, $14.6 million for severance, a credit of $10.8 million for acquisition related charges of which $11.2 million related to the reversal of an earn-out liability, $7.1 million for other charges of which $6.6 million related to the exit of a non-integrated business, $2.2 million for facility exit-related costs, and a credit of $0.6 million to adjust prior year restructuring reserves no longer required. |
| • | An income tax adjustment of $13.4 million primarily related to the increase to a valuation allowance against existing deferred tax assets and increases to tax reserves. |
13
| Avnet, Inc. Q3 Fiscal Year 2013 | ||
| $ in millions - except per share data April 25, 2013 |
Third Quarter Fiscal 2012
| Third Quarter Ended Fiscal 2012 | ||||||||||||||||
| Op Income | Pre-tax | Net Income | Diluted EPS |
|||||||||||||
| $ in thousands, except per share data | ||||||||||||||||
| GAAP results |
$ | 216,774 | $ | 200,923 | $ | 147,562 | $ | 1.00 | ||||||||
| Restructuring, integration and other charges |
18,609 | 18,609 | 13,691 | 0.10 | ||||||||||||
| Loss on investments |
— | (4,460 | ) | (4,460 | ) | (0.03 | ) | |||||||||
| Income tax adjustments |
— | — | (5,168 | ) | (0.04 | ) | ||||||||||
|
|
|
|
|
|
|
|
|
|||||||||
| Total adjustments |
18,609 | 14,149 | 4,063 | 0.03 | ||||||||||||
|
|
|
|
|
|
|
|
|
|||||||||
| Adjusted results |
$ | 235,383 | $ | 215,072 | $ | 151,625 | $ | 1.03 | ||||||||
|
|
|
|
|
|
|
|
|
|||||||||
Items impacting the third quarter of fiscal 2012 consisted of the following:
| • | Restructuring, integration and other charges of $18.6 million pre-tax related to cost reduction actions initiated during the third quarter and acquisition and integration charges associated with acquired businesses. The charges consisted of $6.7 million for severance, $3.1 million for facility exit costs and fixed asset write downs, $4.0 million for integration costs, $4.2 million for acquisition transaction costs, $1.4 million for other restructuring charges, and a reversal of $0.8 million to adjust prior year restructuring reserves; |
| • | a gain on the bargain purchase of $4.5 million pre- and after tax related to the acquisition of Unidux Electronics Limited (Singapore) for which the gain was not taxable; and |
| • | an income tax adjustment of $5.2 million related primarily to the combination of favorable audit settlements, certain reserve releases and the release of a valuation allowance on deferred tax assets which were determined to be realizable. |
14
| Avnet, Inc. Q3 Fiscal Year 2013 | ||
| $ in millions - except per share data April 25, 2013 |
Pro Forma (Organic) Revenue
Pro forma or Organic revenue is defined as reported revenue adjusted for (i) the impact of acquisitions by adjusting Avnet’s prior periods to include the sales of businesses acquired as if the acquisitions had occurred at the beginning of fiscal 2012, (ii) the impact of a divestiture of a small business in TS Asia and (iii) the impact of the transfer of a business from TS Americas to EM Americas, which did not have an impact to Avnet on a consolidated basis but did impact the pro forma sales for the groups by approximately $7 million in the third quarter of fiscal 2012. Sales taking into account the combination of these adjustments are referred to as “pro forma sales” or “organic sales.”
| Revenue as Reported |
Acquisition / Divested Revenue |
Pro forma Revenue |
||||||||||
| (in thousands) | ||||||||||||
| Q1 Fiscal 2013 |
$ | 5,870,057 | $ | 222,785 | $ | 6,092,842 | ||||||
| Q2 Fiscal 2013 |
6,699,465 | 22,954 | 6,722,419 | |||||||||
| Q3 Fiscal 2013 |
6,298,699 | — | 6,298,699 | |||||||||
|
|
|
|
|
|
|
|||||||
| YTD Fiscal year 2013 |
$ | 18,868,221 | $ | 245,739 | $ | 19,113,960 | ||||||
|
|
|
|
|
|
|
|||||||
| Q1 Fiscal 2012 |
$ | 6,426,006 | $ | 420,232 | $ | 6,846,238 | ||||||
| Q2 Fiscal 2012 |
6,693,573 | 426,351 | 7,119,924 | |||||||||
| Q3 Fiscal 2012 |
6,280,557 | 331,967 | 6,612,524 | |||||||||
| Q4 Fiscal 2012 |
6,307,386 | 248,589 | 6,555,975 | |||||||||
|
|
|
|
|
|
|
|||||||
| Fiscal year 2012 |
$ | 25,707,522 | $ | 1,427,139 | $ | 27,134,661 | ||||||
|
|
|
|
|
|
|
|||||||
“Acquisition Revenue” as presented in the preceding table includes the effects of acquisitions and divestitures that have occurred subsequent to December 31, 2011.
15
| Avnet, Inc. Q3 Fiscal Year 2013 | ||
| $ in millions - except per share data April 25, 2013 |
ROWC, ROCE and WC Velocity
The following table presents the calculation for ROWC, ROCE and WC velocity (dollars in thousands)
| Q3 FY 13 | Q3 FY 12 | |||||||||||
| Sales |
6,298,699 | 6,280,557 | ||||||||||
| Sales, annualized |
(a | ) | 25,194,797 | 25,122,226 | ||||||||
| Adjusted operating income (1) |
194,951 | 235,383 | ||||||||||
| Adjusted operating income, annualized |
(b | ) | 779,806 | 941,532 | ||||||||
| Adjusted effective tax rate (2) |
27.30 | % | 29.43 | % | ||||||||
| Adjusted operating income, net after tax |
(c | ) | 566,919 | 664,439 | ||||||||
| Average monthly working capital |
||||||||||||
| Accounts receivable |
4,806,901 | 4,542,093 | ||||||||||
| Inventory |
2,328,051 | 2,540,034 | ||||||||||
| Accounts payable |
(3,233,582 | ) | (3,172,879 | ) | ||||||||
|
|
|
|
|
|||||||||
| Average working capital |
(d | ) | 3,901,370 | 3,909,248 | ||||||||
|
|
|
|
|
|||||||||
| Average monthly total capital |
(e | ) | 5,376,597 | 5,179,911 | ||||||||
|
|
|
|
|
|||||||||
| ROWC = (b) / (d) |
19.99 | % | 24.08 | % | ||||||||
| WC Velocity = (a) / (d) |
6.46 | 6.43 | ||||||||||
| ROCE = (c ) / (e) |
10.54 | % | 12.83 | % | ||||||||
| (1) | See reconciliation to GAAP amounts in the preceding tables in this Non-GAAP Financial Information Section. |
| (2) | Adjusted effective tax rate is based upon a year-to-date (full fiscal year rate for FY12) calculation excluding restructuring, integration and other charges and tax adjustments as described in the reconcilation to GAAP amounts in this Non-GAAP Financial Information Section. |
16