Attached files
| file | filename |
|---|---|
| 8-K - POLARIS INDUSTRIES INC. 8-K - Polaris Inc. | a50615740.htm |
| EX-99.1 - EXHIBIT 99.1 - Polaris Inc. | a50615740ex99_1.htm |
Exhibit 99.2
First Quarter 2013 Earnings Results April 23, 2013 POLARIS INDUSTRIES INC.
Except for historical information contained herein, the matters set forth in this document,including but not limited to management’s expectations regarding 2013 sales, shipments, margins, net income and cash flow are forward-looking statements that involve certain risks and uncertainties that could cause actual results to differ materially from those forwardlooking statements. Potential risks and uncertainties include such factors as product offerings, promotional activities and pricing strategies by competitors; manufacturing operation initiatives; acquisition integration costs; warranty expenses; impact of changes in Polaris stock prices on incentive compensation; foreign currency exchange rate fluctuations; environmental and product safety regulatory activity; effects of weather; commodity costs; uninsured product liability claims; uncertainty in the retail and wholesale credit markets; changes in tax policy and overall economic conditions, including inflation, consumer confidence and spending and relationships with dealers and suppliers. Investors are also directed to consider other risks and uncertainties discussed in our 2012 annual report and Form 10-K filed by the Company with the Securities and Exchange Commission. The Company does not undertake any duty to any person to provide updates to its forward-looking statements. The data source for retail sales figures included in this presentation is registration information provided by Polaris dealers in North America and compiled by the Company or Company estimates. The Company must rely on information that its dealers supply concerning retail sales, and other retail sales data sources and this information is subject to revision. 2

Scott Wine Chairman & CEO First Quarter 2013 Earnings Results April 23, 2013 POLARIS INDUSTRIES INC. 3
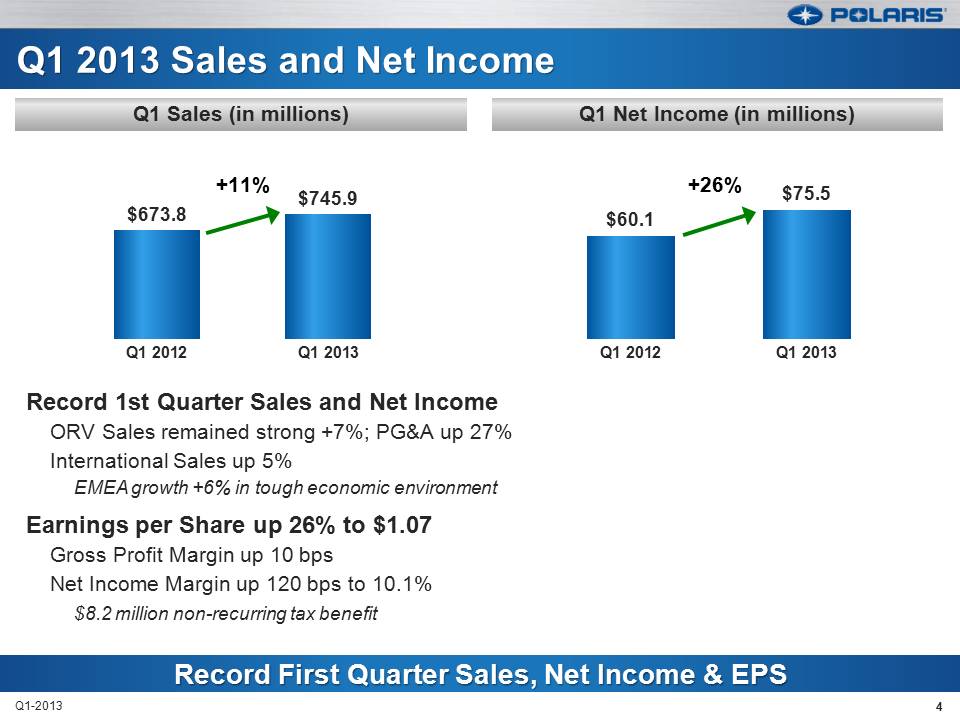
$60.1 $75.5 Q1 2012 Q1 2013 +26% Q1 2013 Sales and Net Income Record 1st Quarter Sales and Net Income ORV Sales remained strong +7%; PG&A up 27% International Sales up 5% EMEA growth +6% in tough economic environment Earnings per Share up 26% to $1.07 Gross Profit Margin up 10 bps Net Income Margin up 120 bps to 10.1% $8.2 million non-recurring tax benefit 4 Q1-2013 $673.8 $745.9 Q1 2012 Q1 2013 +11% Record First Quarter Sales, Net Income & EPS Q1 Net Income (in millions) Q1 Sales (in millions) 4
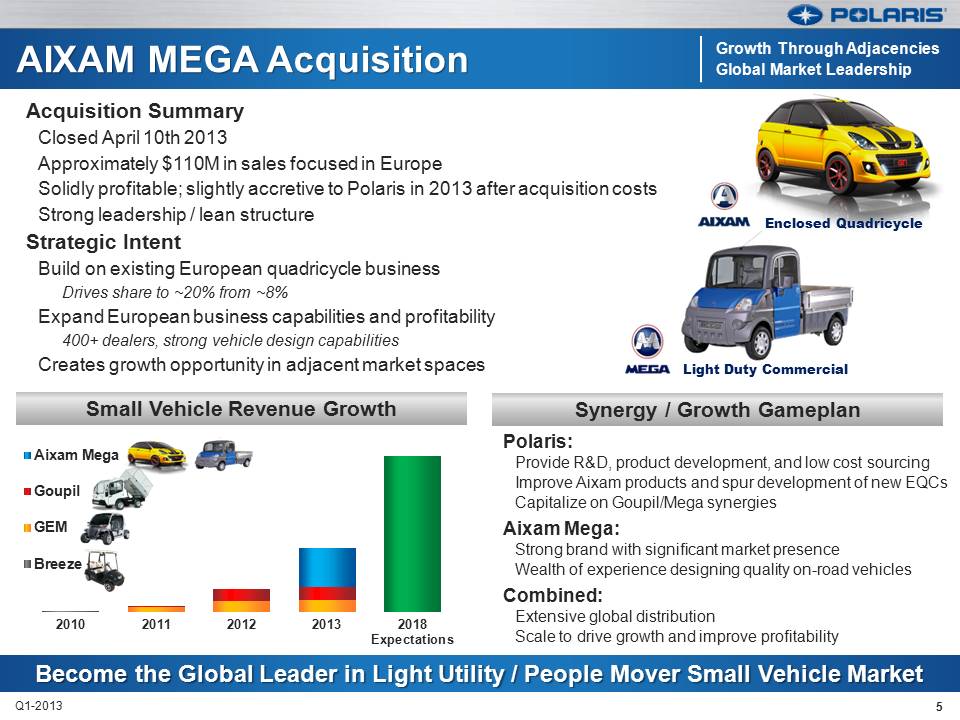
5 Q1-2013 AIXAM MEGA Acquisition Acquisition Summary Closed April 10th 2013 Approximately $110M in sales focused in Europe Solidly profitable; slightly accretive to Polaris in 2013 after acquisition costs Strong leadership / lean structure Strategic Intent Build on existing European quadricycle business Drives share to ~20% from ~8% Expand European business capabilities and profitability 400+ dealers, strong vehicle design capabilities Creates growth opportunity in adjacent market spaces Synergy / Growth Gameplan Small Vehicle Revenue Growth Become the Global Leader in Light Utility / People Mover Small Vehicle Market 2010 2011 2012 2013 2018 Expectations Aixam Mega Goupil GEM Breeze Polaris: Provide R&D, product development, and low cost sourcing Improve Aixam products and spur development of new EQCs Capitalize on Goupil/Mega synergies Aixam Mega: Strong brand with significant market presence Wealth of experience designing quality on-road vehicles Combined: Extensive global distribution Scale to drive growth and improve profitability Growth Through Adjacencies Global Market Leadership Enclosed Quadricycle Light Duty Commercial
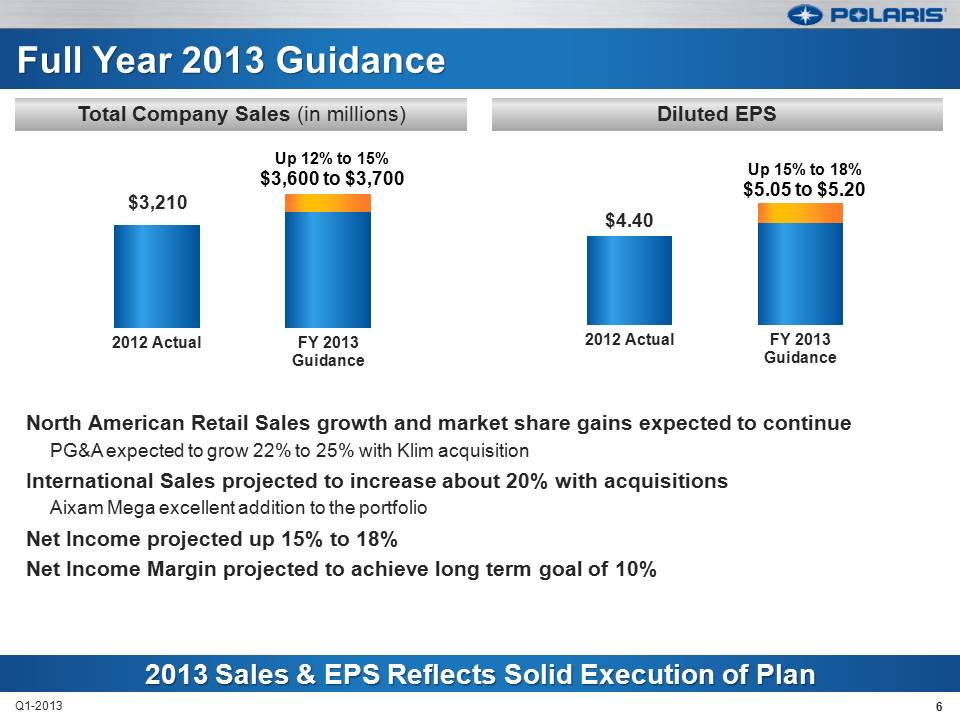
North American Retail Sales growth and market share gains expected to continue PG&A expected to grow 22% to 25% with Klim acquisition International Sales projected to increase about 20% with acquisitions Aixam Mega excellent addition to the portfolio Net Income projected up 15% to 18% Net Income Margin projected to achieve long term goal of 10% 6 Q1-2013 $3,210 2012 Actual FY 2013 Guidance $4.40 2012 Actual FY 2013 Guidance 2013 Sales & EPS Reflects Solid Execution of Plan Diluted EPS Total Company Sales (in millions) Up 12% to 15% $3,600 to $3,700 Up 15% to 18% $5.05 to $5.20 6
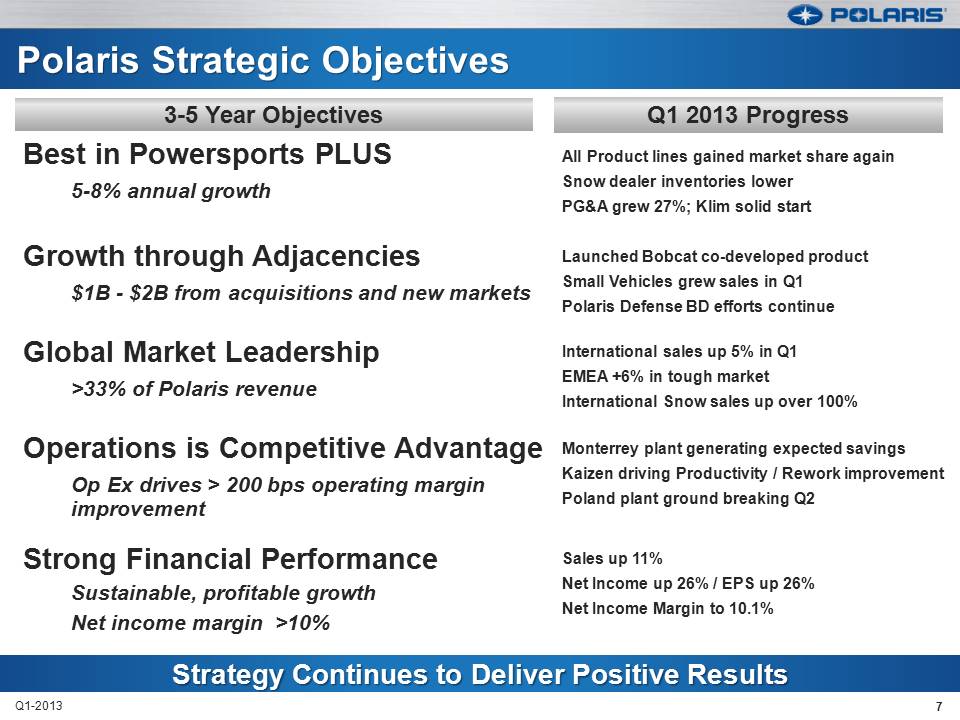
Best in Powersports PLUS 5-8% annual growth All Product lines gained market share again Snow dealer inventories lower PG&A grew 27%; Klim solid start Growth through Adjacencies $1B - $2B from acquisitions and new markets Launched Bobcat co-developed product Small Vehicles grew sales in Q1 Polaris Defense BD efforts continue Global Market Leadership >33% of Polaris revenue International sales up 5% in Q1 EMEA +6% in tough market International Snow sales up over 100% Operations is Competitive Advantage Op Ex drives > 200 bps operating margin improvement Monterrey plant generating expected savings Kaizen driving Productivity / Rework improvement Poland plant ground breaking Q2 Strong Financial Performance Sustainable, profitable growth Net income margin >10% Sales up 11% Net Income up 26% / EPS up 26% Net Income Margin to 10.1% 7 Q1-2013 3-5 Year Objectives Q1 2013 Progress 7
Bennett Morgan President & COO First Quarter 2013 Earnings Results April 23, 2013 POLARIS INDUSTRIES INC. 8
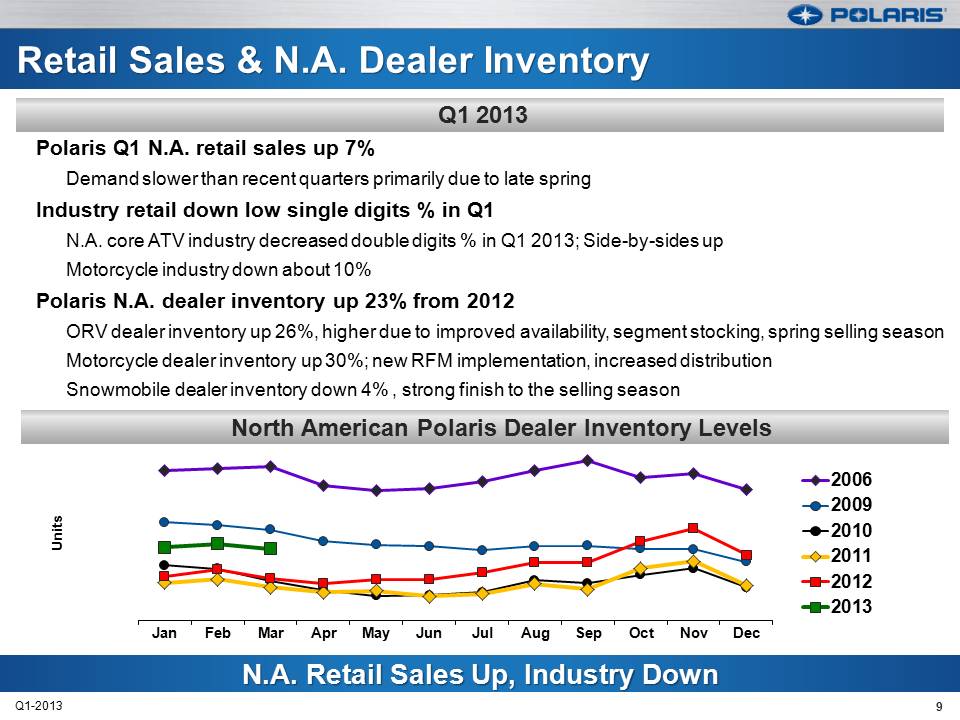
Polaris Q1 N.A. retail sales up 7% Demand slower than recent quarters primarily due to late spring Industry retail down low single digits % in Q1 N.A. core ATV industry decreased double digits % in Q1 2013; Side-by-sides up Motorcycle industry down about 10% Polaris N.A. dealer inventory up 23% from 2012ORV dealer inventory up 26%, higher due to improved availability, segment stocking, spring selling season Motorcycle dealer inventory up 30%; new RFM implementation, increased distribution Snowmobile dealer inventory down 4% , strong finish to the selling season .Q1 2013 Jan Feb Mar Apr May Jun Jul Aug Sep Oct Nov Dec Units 2006 2009 2010 2011 2012 2013 North American Polaris Dealer Inventory Levels 9 Q1-2013
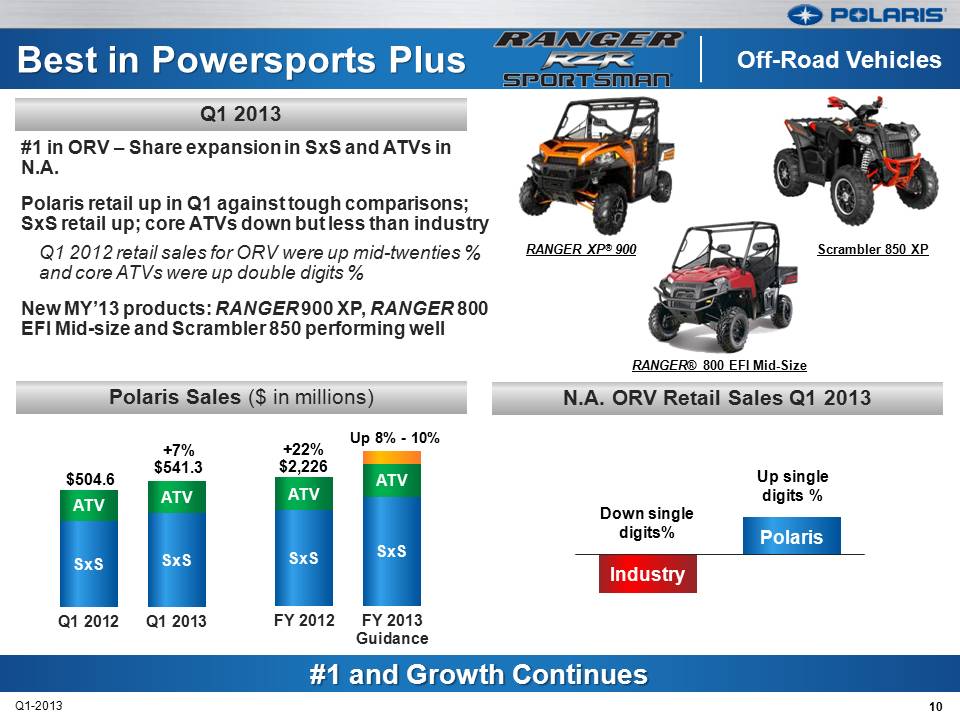
10 Q1-2013 N.A. ORV Retail Sales Q1 2013 Polaris Sales ($ in millions) #1 and Growth Continues #1 in ORV – Share expansion in SxS and ATVs in N.A. Polaris retail up in Q1 against tough comparisons; SxS retail up; core ATVs down but less than industry Q1 2012 retail sales for ORV were up mid-twenties % and core ATVs were up double digits % New MY’13 products: RANGER 900 XP, RANGER 800 EFI Mid-size and Scrambler 850 performing well Off-Road Vehicles Up 8% - 10% +7% $541.3 +22% $2,226 $504.6 Down single digits% Up single digits % RANGER XP® 900 Scrambler 850 XP RANGER® 800 EFI Mid-Size SxS SxS ATV ATV Q1 2012 Q1 2013 SxS SxS ATV ATV FY 2012 FY 2013 Guidance Q1 2013
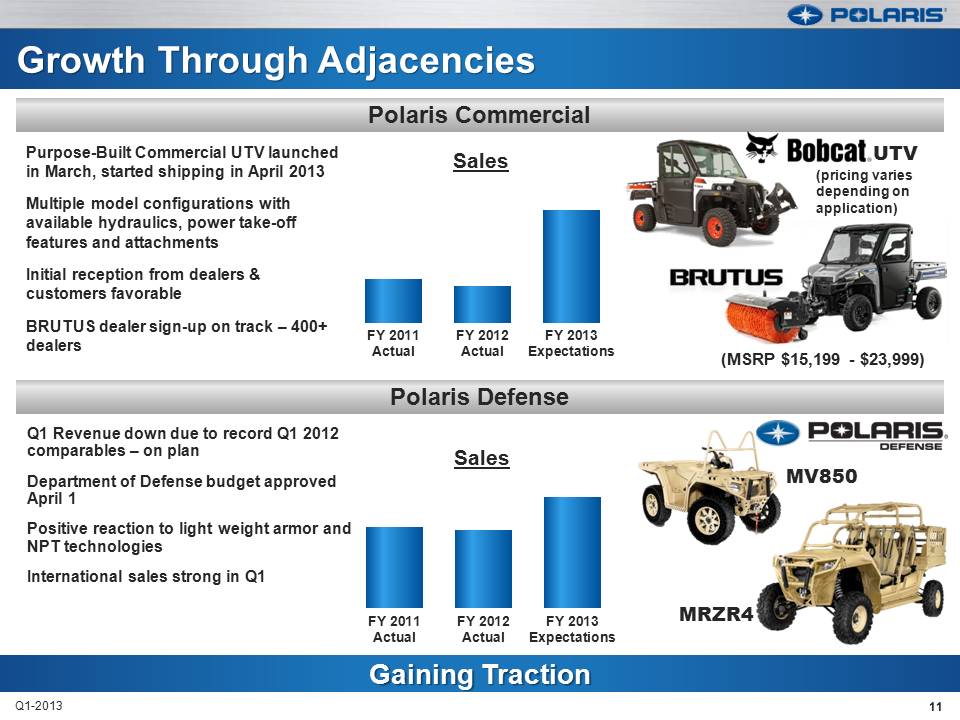
11 Q1-2013 Growth Through Adjacencies Polaris Defense Gaining Traction Polaris Commercial Purpose-Built Commercial UTV launched in March, started shipping in April 2013 Multiple model configurations with available hydraulics, power take-off features and attachments Initial reception from dealers & customers favorable BRUTUS dealer sign-up on track – 400+ dealers Q1 Revenue down due to record Q1 2012 comparables – on plan Department of Defense budget approved April 1 Positive reaction to light weight armor and NPT technologies International sales strong in Q1 (MSRP $15,199 - $23,999) (pricing varies depending on application) UTV MV850 MRZR4 FY 2011 Actual FY 2012 Actual FY 2013 Expectations Sales FY 2011 Actual FY 2012 Actual FY 2013 Expectations Sales
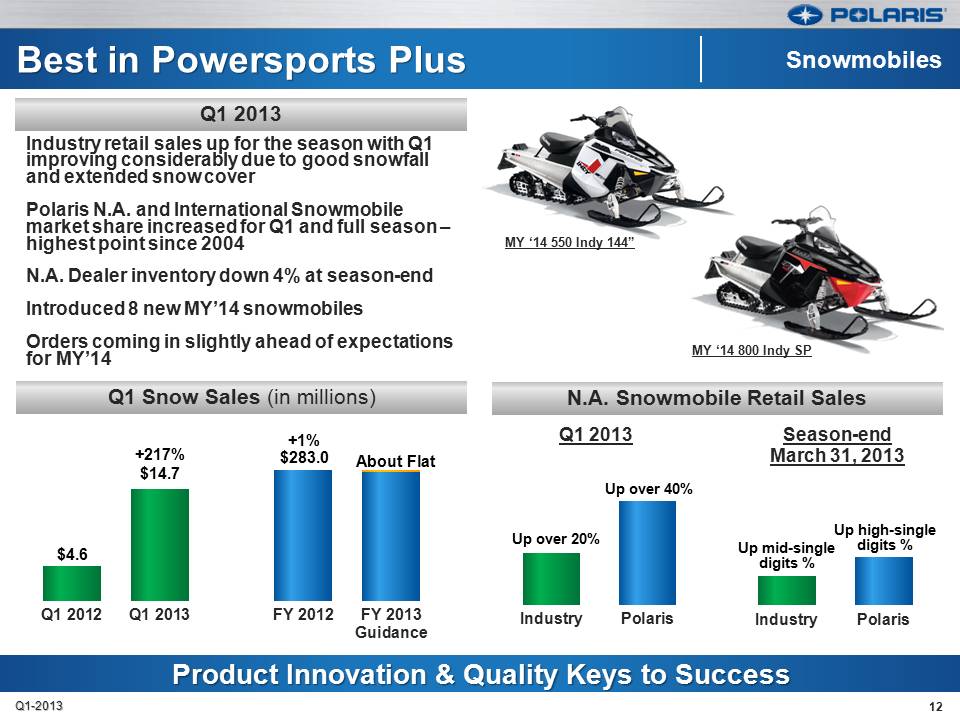
12 N.A. Snowmobile Retail Sales Q1 Snow Sales (in millions) Q1 2013 Product Innovation & Quality Keys to Success Industry retail sales up for the season with Q1 improving considerably due to good snowfall and extended snow cover Polaris N.A. and International Snowmobile market share increased for Q1 and full season – highest point since 2004 N.A. Dealer inventory down 4% at season-end Introduced 8 new MY’14 snowmobiles Orders coming in slightly ahead of expectations for MY’14 Snowmobiles MY ‘14 550 Indy 144” MY ‘14 800 Indy SP Q1 2012 Q1 2013 FY 2012 FY 2013 Guidance About Flat +217% $14.7 +1% $283.0 $4.6 Industry Polaris Season-end March 31, 2013 Up high-single digits % Up mid-single digits % Industry Polaris Q1 2013 Up over 20% Up over 40% Q1-2013
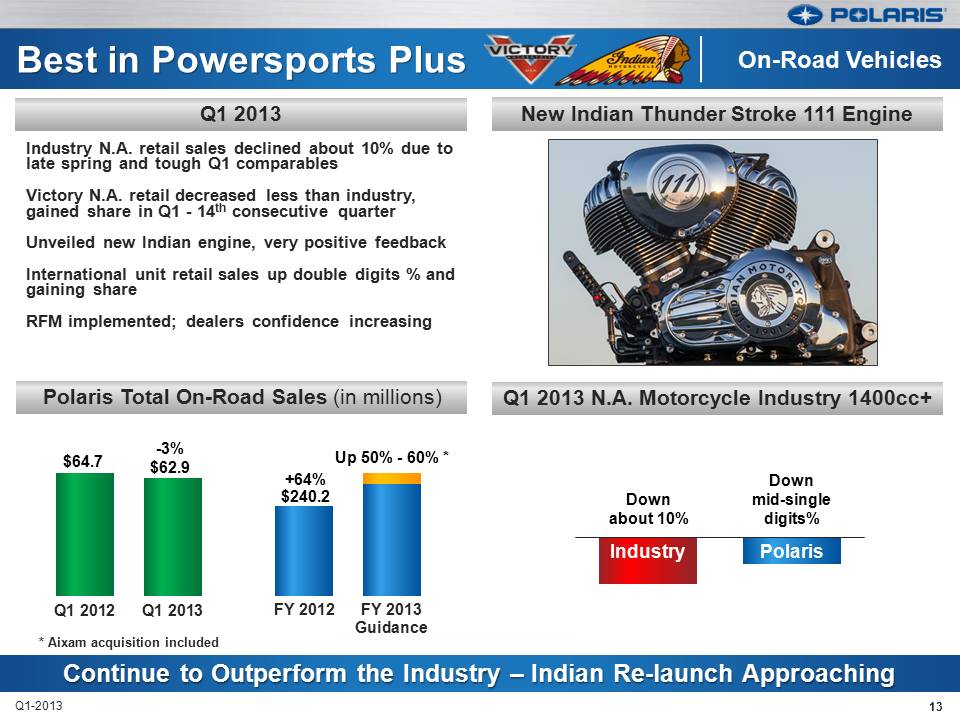
13 Q1-2013 Q1 2013 N.A. Motorcycle Industry 1400cc+ Polaris Total On-Road Sales (in millions) New Indian Thunder Stroke 111 Engine Q1 2013 Continue to Outperform the Industry – Indian Re-launch Approaching Industry N.A. retail sales declined about 10% due to late spring and tough Q1 comparables Victory N.A. retail decreased less than industry, gained share in Q1 - 14th consecutive quarter Unveiled new Indian engine, very positive feedback International unit retail sales up double digits % and gaining share RFM implemented; dealers confidence increasing Q1 2012 Q1 2013 On-Road Vehicles Industry Polaris FY 2012 FY 2013 Guidance Up 50% - 60% * +64% $240.2 Q1 2012 Q1 2013 $64.7 -3% $62.9 * Aixam acquisition included Down mid-single digits% Downabout 10%
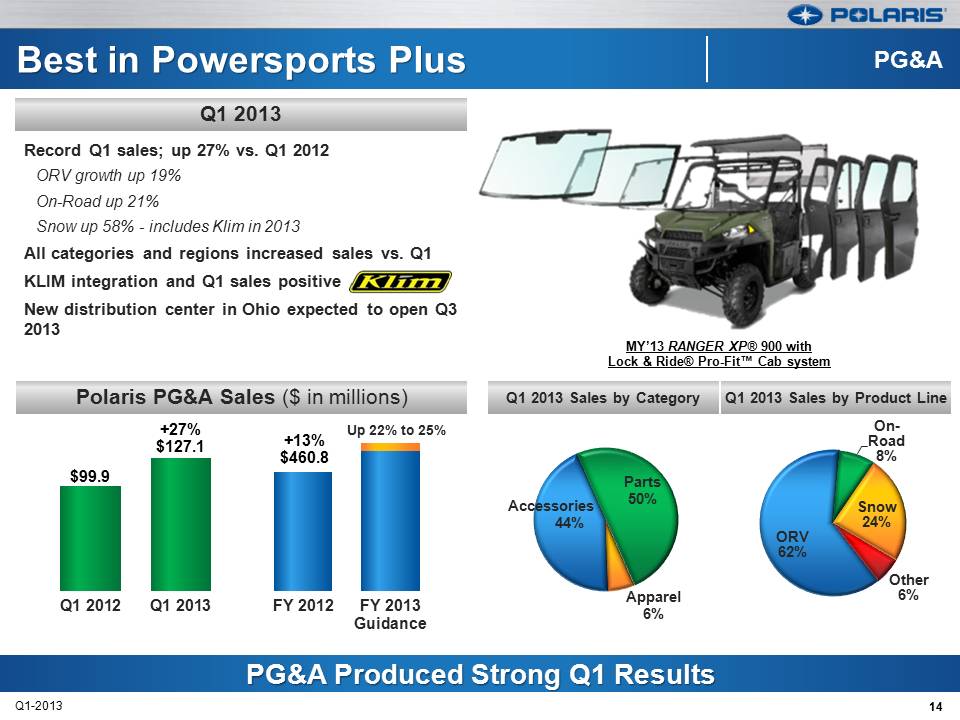
ORV 62% On- Road 8% Snow 24% Other 6% FY 2012 FY 2013 Guidance Best in Powersports Plus 14 Q1-2013 Polaris PG&A Sales ($ in millions) Q1 2013 PG&A Produced Strong Q1 Results Record Q1 sales; up 27% vs. Q1 2012 ORV growth up 19% On-Road up 21% Snow up 58% - includes Klim in 2013 All categories and regions increased sales vs. Q1 KLIM integration and Q1 sales positive New distribution center in Ohio expected to open Q3 2013 44% Parts 50% Apparel 6% Q1 2012 Q1 2013 +27% $127.1 +13% $460.8 $99.9 PG&A Up 22% to 25% Accessories Q1 2013 Sales by Category Q1 2013 Sales by Product Line MY’13 RANGER XP® 900 with Lock & Ride® Pro-Fit™ Cab system 14
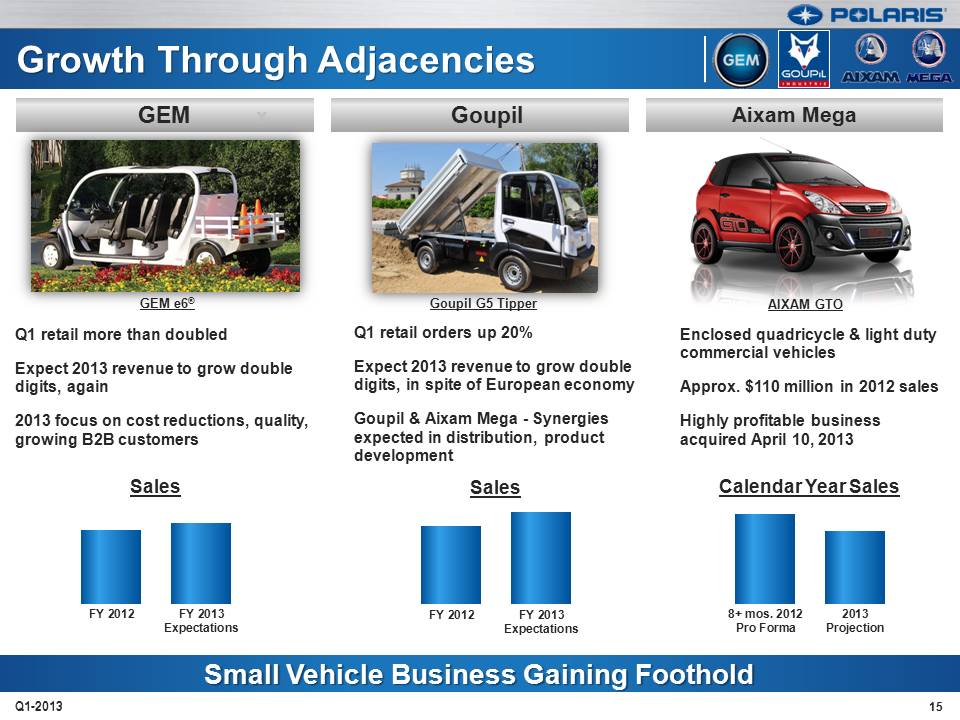
Q1 retail orders up 20% Expect 2013 revenue to grow double digits, in spite of European economy Goupil & Aixam Mega – Synergies expected in distribution, product development Aixam Goupil Growth Through Adjacencies 15 GEM x Small Vehicle Business Gaining Foothold Q1-2013 Q1 retail more than doubled Expect 2013 revenue to grow double digits, again 2013 focus on cost reductions, quality, growing B2B customers FY 2012 FY 2013 Expectations Sales GEM e6® Goupil G5 Tipper AIXAM GTO Enclosed quadricycle & light duty commercial vehicles Approx. $110 million in 2012 sales Highly profitable business acquired April 10, 2013 Aixam Mega 8+ mos. 2012 Pro Forma 2013 Projection Calendar Year Sales FY 2012 FY 2013 Expectations Sales 15
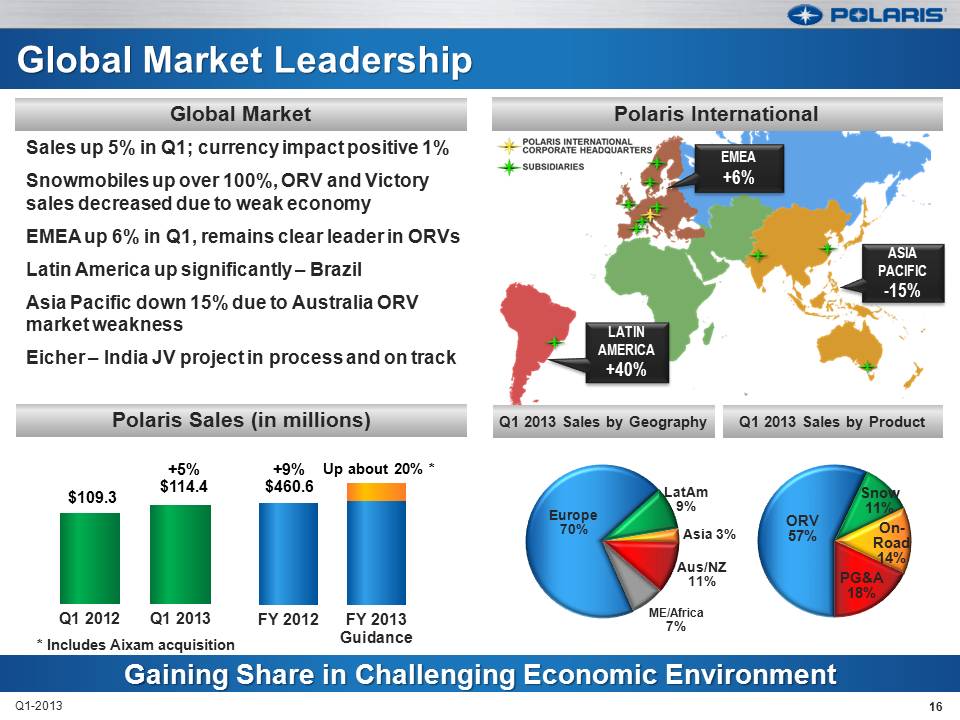
16 Q1-2013 Polaris Sales (in millions) 2013 Objectives Gaining Share in Challenging Economic Environment ORV 57% Snow 11% On- Road 14% PG&A 18% Q1 2012 Q1 2013 FY 2012 FY 2013 Guidance Up about 20% * +5% $114.4 +9% $460.6 $109.3 Europe 70% LatAm 9% Asia 3% Aus/NZ 11% ME/Africa 7% Q1 2013 Sales by Geography Q1 2013 Sales by Product Sales up 5% in Q1; currency impact positive 1% Snowmobiles up over 100%, ORV and Victory sales decreased due to weak economy EMEA up 6% in Q1, remains clear leader in ORVs Latin America up significantly – Brazil Asia Pacific down 15% due to Australia ORV market weakness Eicher – India JV project in process and on track * Includes Aixam acquisition Global Market Polaris International
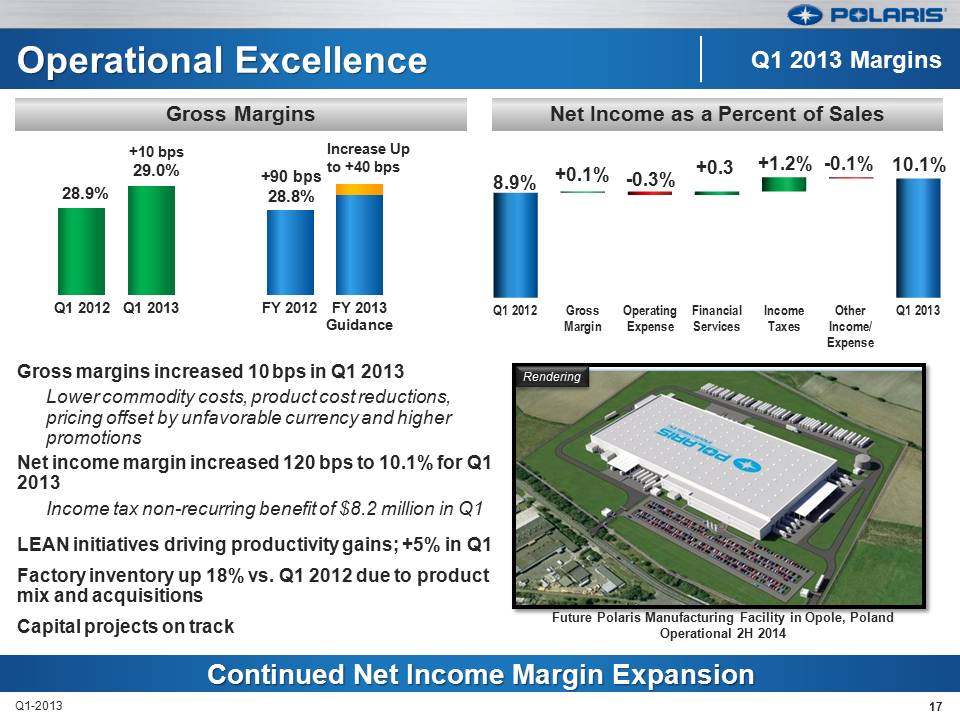
Operational Excellence Gross margins increased 10 bps in Q1 2013 Lower commodity costs, product cost reductions, pricing offset by unfavorable currency and higher promotions Net income margin increased 120 bps to 10.1% for Q1 2013 Income tax non-recurring benefit of $8.2 million in Q1 LEAN initiatives driving productivity gains; +5% in Q1 Factory inventory up 18% vs. Q1 2012 due to product mix and acquisitions Capital projects on track 17 Q1-2013 +90 bps 28.8% 28.9% +10 bps 29.0% Q1 2012 Q1 2013 FY 2012 FY 2013 Guidance Q1 2012 Gross Margin Operating Expense Financial Services Income Taxes Other Income/ Expense Q1 2013 8.9% +0.1% -0.3% +0.3 +1.2% -0.1% 10.1% Continued Net Income Margin Expansion Net Income as a Percent of Sales Gross Margins Q1 2013 Margins Increase Up to +40 bps Future Polaris Manufacturing Facility in Opole, Poland Operational 2H 2014 Rendering

Mike Malone V.P Finance & CFO First Quarter 2013 Earnings Results April 23, 2013 POLARIS INDUSTRIES INC. 18
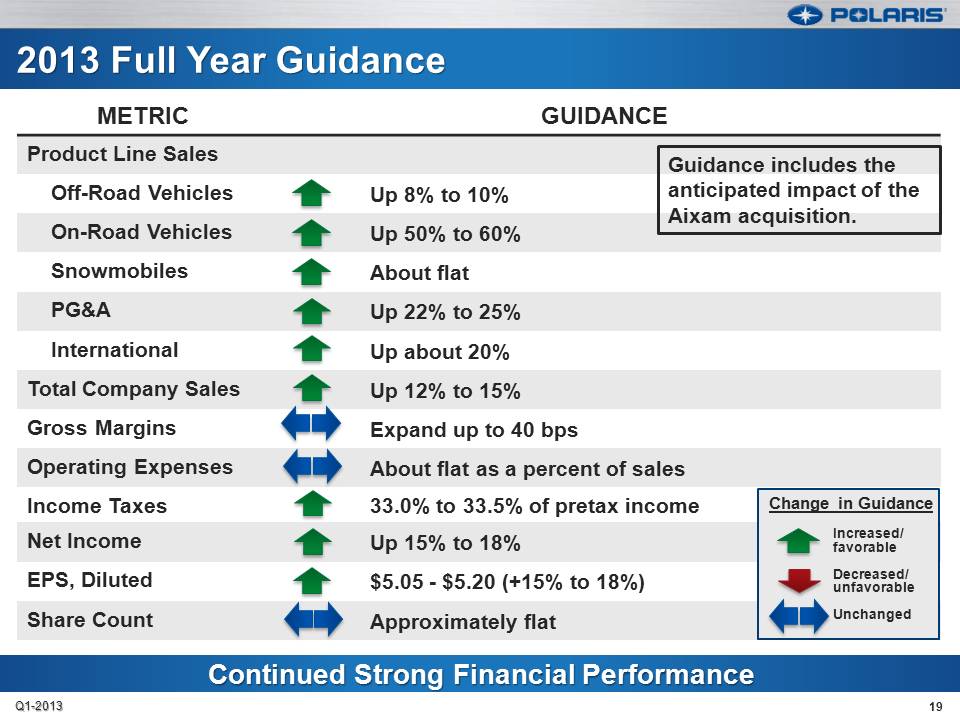
METRIC GUIDANCE Product Line Sales Off-Road Vehicles Up 8% to 10% On-Road Vehicles Up 50% to 60% Snowmobiles About flat PG&A Up 22% to 25% International Up about 20% Total Company Sales Up 12% to 15% Gross Margins Expand up to 40 bps Operating Expenses About flat as a percent of sales Income Taxes 33.0% to 33.5% of pretax income Net Income Up 15% to 18% EPS, Diluted $5.05 - $5.20 (+15% to 18%) Share Count Approximately flat Change in Guidance Increased/ favorable Decreased/ unfavorable Unchanged Guidance includes the anticipated impact of the Aixam acquisition. 19 Q1-2013
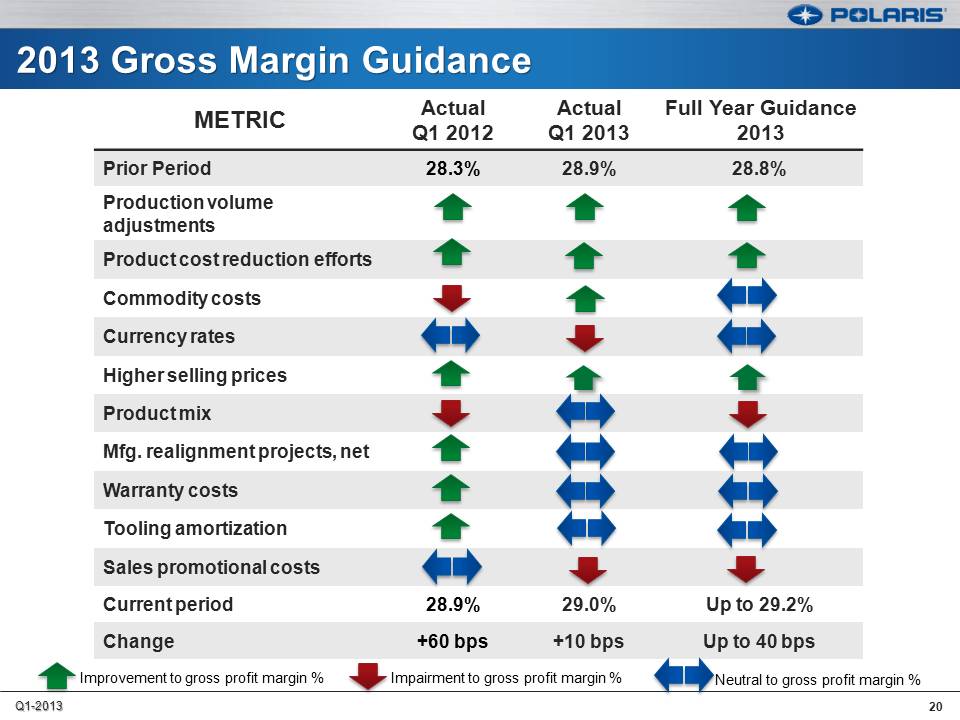
METRIC Actual Q1 2012 Actual Q1 2013 Full Year Guidance 2013 Prior Period 28.3% 28.9% 28.8% Production volume adjustments Product cost reduction efforts Commodity costs Currency rates Higher selling prices Product mix Mfg. realignment projects, net Warranty costs Tooling amortization Sales promotional costs Current period 28.9% 29.0% Up to 29.2% Change +60 bps +10 bps Up to 40 bpsImprovement to gross profit margin % Impairment to gross profit margin % Neutral to gross profit margin % 20 Q1-2013 20
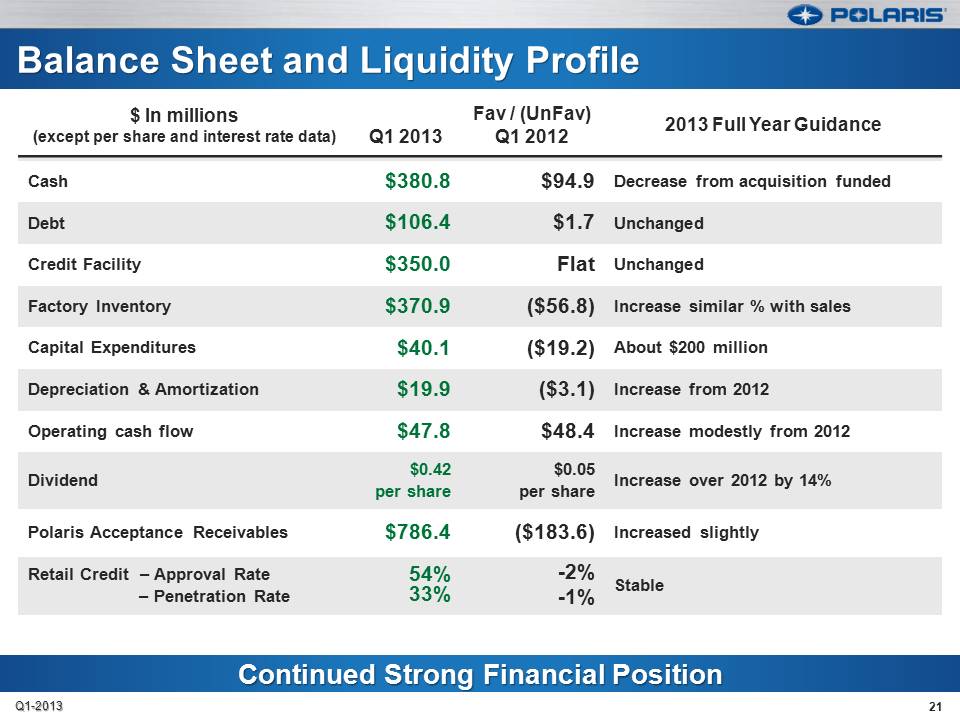
$ In millions (except per share and interest rate data) Q1 2013 Fav / (UnFav) Q1 2012 2013 Full Year Guidance Cash $380.8 $94.9 Decrease from acquisition funded Debt $106.4 $1.7 Unchanged Credit Facility $350.0 Flat Unchanged Factory Inventory $370.9 ($56.8) Increase similar % with sales Capital Expenditures $40.1 ($19.2) About $200 million Depreciation & Amortization $19.9 ($3.1) Increase from 2012 Operating cash flow $47.8 $48.4 Increase modestly from 2012 Dividend $0.42 per share $0.05 per share Increase over 2012 by 14% Polaris Acceptance Receivables $786.4 ($183.6) Increased slightly Retail Credit – Approval Rate – Penetration Rate 54% 33% -2% -1% Stable 21 Q1-2013

Scott Wine Chairman & CEO First Quarter 2013 Earnings Results April 23, 2013 POLARIS INDUSTRIES INC. 22
Economy remains weak, but manageable Making Growth Happen remains our mantra Q1/Q2 building foundation for pivotal 2H 2013 Indian launch, MY ‘14 products poised to drive growth Investments in infrastructure, growth will continue ROIC will remain at industry-leading levels Margin expansion remains a top priority LEAN initiatives accelerating: supply chain & logistics improvements key ORV share gains will continue Product innovation building momentum Indian is rolling up to the starting line… From production to distribution to branding- we are sparing no effort 23 Q1-2013
Thank you Q & A 24