Attached files
| file | filename |
|---|---|
| 8-K - FORM 8-K - UNITIL CORP | d522379d8k.htm |
 Annual Meeting of Shareholders
Presentation by
Robert G. Schoenberger
Chairman, President & Chief Executive Officer
April 18, 2013
Exhibit 99.1 |
 1
Safe Harbor Provision
This
presentation
contains
“forward-looking
statements”
made
pursuant
to
the
safe
harbor
provisions of the Private Securities Litigation Reform Act of 1995. These
forward-looking statements include statements regarding Unitil
Corporation’s (“Unitil”) financial condition, results of
operations, capital expenditures, business strategy, regulatory strategy, market opportunities,
and other plans and objectives. In some cases, forward-looking statements
can be identified by terminology such as “may,”
“will,”
“should,”
“expects,”
“plans,”
“anticipates,”
“believes,”
“estimates,”
“predicts,”
“potential”
or “continue”, the negative of such terms, or other comparable
terminology.
These forward-looking statements are neither promises nor guarantees, but
involve risks and uncertainties that could cause the actual results to
differ materially from those set forth in the forward-looking
statements. Those risks and uncertainties include: Unitil’s regulatory
environment (including regulations relating to climate change, greenhouse gas
emissions and other environmental matters); fluctuations in the supply of,
demand for, and the prices of energy commodities and transmission capacity
and Unitil’s ability to recover energy commodity costs in its rates;
customers’ preferred energy sources; severe storms and Unitil’s
ability to recover storm costs in its rates; general economic conditions;
variations in weather; long-term global climate change; Unitil’s
ability to retain its existing customers and attract new customers; Unitil’s
energy brokering customers’
performance and energy used under multi-year energy brokering
contracts; increased competition; integrity and security of operational and
information systems; publicity and reputational risks; and other risks
detailed in Unitil's filings with the Securities and Exchange
Commission,
including
those
appearing
under
the
caption
"Risk
Factors"
in
Unitil's
Annual Report on Form 10-K for the year ended December 31, 2012.
Readers should not place undue reliance on any forward looking statements, which
speak only as of the date they are made. Unitil undertakes no
obligation to update any forward- looking statements to reflect any
change in Unitil’s expectations or in events, conditions, or
circumstances
on
which
any
such
statements
may
be
based,
or
that
may
affect
the
likelihood
that actual results will differ from those set forth in the forward-looking
statements. |
 2
Our mission is to provide energy for life—safely, reliably, cost-
effectively and responsibly—to a growing number of customers
with a high-performing workforce |
 3
Unitil Overview
Unitil Service Areas
•
Electric and natural gas utility
operations in Maine, New Hampshire
and Massachusetts
•
176,000 total gas and electric
customers
•
Regulated utility business model
•
Growing operations and customers
•
Rate base growth
•
Natural gas system expansion
•
Usource
•
Non-regulated energy brokering
operations conducted through
Usource
•
Historic dividend stability
•
Experienced management team |
 2012
Net Income 4
•
Record Earnings Applicable to Common Shareholders of $18.1 million in 2012
•
Mild winter weather in 2012 negatively affected earnings by an estimated $1.7
million Earnings Applicable to Common Shareholders
($ in millions)
$9.5
$16.3
$18.1
2010
2011
2012 |
 5
Balanced Capital Structure
•
Completed public offering of
common stock in May 2012
•
2.76 million shares issued
•
$66 million in net proceeds
•
Net proceeds were principally
used to contribute equity to all
utility subsidiaries
•
Significant improvement in overall
credit statistics, including a
balanced capital structure
Capitalization Ratios
(December 31, 2012)
Preferred
Stock
<0.1%
Common
Equity
48%
Long
Term Debt
52% |
 Financial Highlights
6
($ in millions)
($ in millions)
($ in millions)
($ in millions)
$121
$141
$154
2010
2011
2012
$9.5
$16.3
$18.1
2010
2011
2012
$487
$517
$557
$601
2009
2010
2011
2012
$28
$37
$37
2010
2011
2012
Operating Income
Sales Margin
Net Income to Common
Net Utility Plant |
 7
Premier Storm Response
•
Unitil selected as one of the winners of the 2012
Emergency Recovery Award from the Edison
Electric Institute for extraordinary recovery
efforts following Hurricane Sandy
•
Unitil received praise from customers,
municipalities, elected officials and regulators
•
In October 2012, Hurricane Sandy struck with
flooding rain and damaging winds
•
During the storm, approximately 69,000 customer
outages were reported, representing 70% of
electric customer base
•
Responded to 40,000-plus calls during the event;
99% of those calls picked up in 20 seconds or less
•
All impacted customers were back online in less
than 48 hours
Hurricane Sandy
Edison Electric Institute Award
“
[Unitil’s] storm management is now a model for other New Hampshire
companies.” -
New Hampshire Public Utilities Commission |
 $0
$500
$1,000
$1,500
$2,000
$2,500
$3,000
$3,500
Annual Residential Heating Cost ($)
Gas
Fuel Oil
8
Source: Energy Information Administration
U.S. Natural Gas Production, 1990-2035
Retail Cost Comparison
Source: Unitil estimates
Gas Growth -
Fundamentals
Natural gas is
currently ~50%
the cost of
retail fuel oil
•
Changing natural gas fundamentals are creating significant opportunities for growth
in the local natural gas distribution industry
•
Increase in domestic natural gas production driven largely by shale gas
resources •
On a retail-delivered basis, natural gas is approximately 50% the cost of
retail fuel oil •
Typical residential customer saves on average ~$1,500 / year with natural
gas 0
5
10
15
20
25
30
Shale
Tight
Non-associated offshore
Associated with oil
Non-associated onshore
Coalbed methane
Alaska |
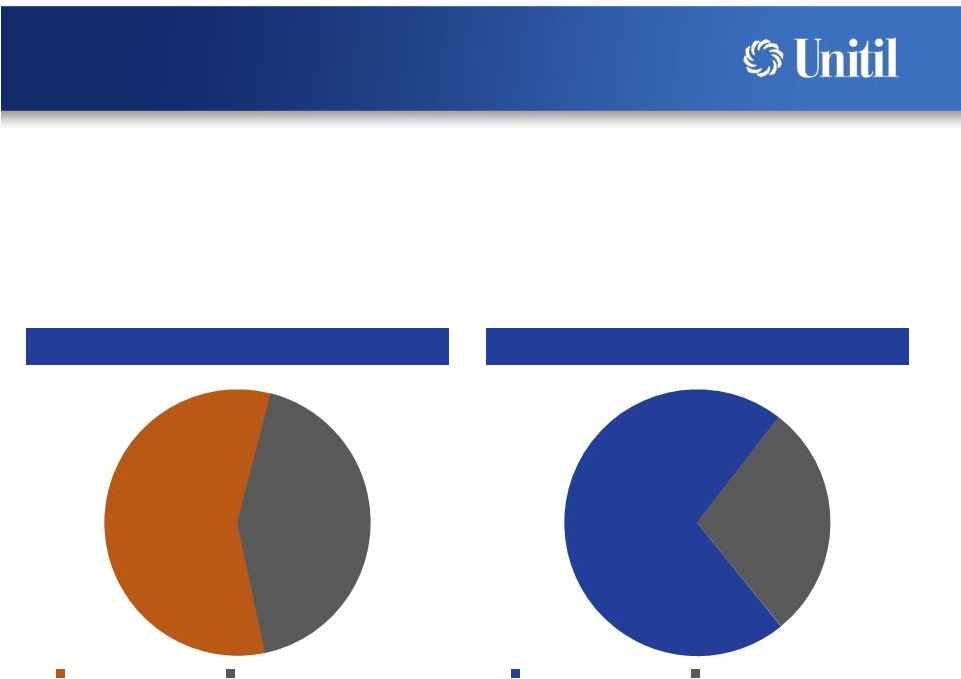 9
Gas Growth -
Market Potential
Current On-the-Main Penetration (2012)
Projected On-the-Main Penetration (2016)
•
Serving 74,000 total gas customers currently
•
Identified
55,000
potential
new
customers
who
are
“on-the-main”,
but
not
currently
taking
gas
service
-
(90% residential / 10% C&I)
•
Over 250,000 homes and businesses within existing service areas do not have
natural gas •
Growth plan target is to serve 92,000 total customers by 2016
•
Represents 5% CAGR in customer growth
74,000
(57%)
55,000
(43%)
Current Customers
On-the-Main Prospects
92,000
(71%)
37,000
(29%)
Projected Customers
On-the-Main Prospects |
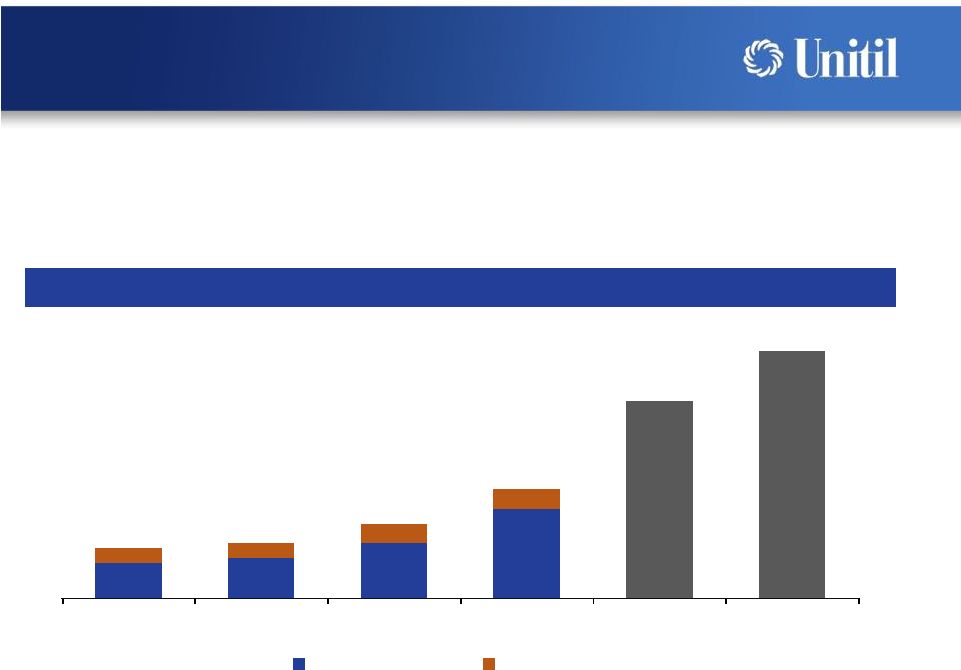 10
Gas Customer Additions
Gas Growth -
Customers
•
Gas customer additions significantly increasing since 2008 acquisition of Northern
Utilities •
Added and converted over 2,000 customers in 2012, up approximately 50% from
2011 •
In 2013, plan to target 4,000 customer additions and conversions
700
800
1,100
1,800
250
250
350
350
950
1,050
1,450
2,150
4,000
5,000
2009
2010
2011
2012
2013F
2014F+
Net Additions
Conversions |
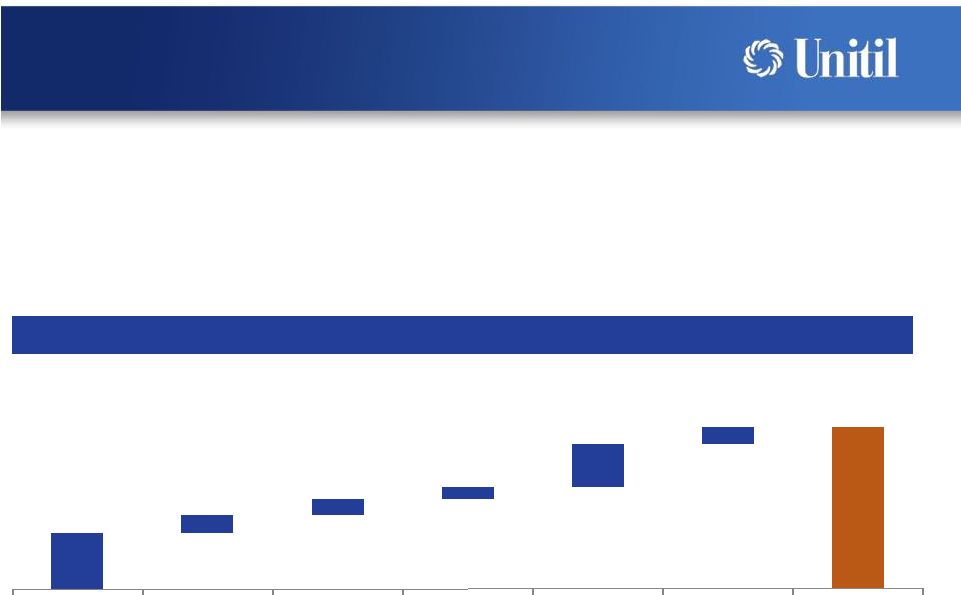 11
Rate Cases
•
Strong
regulatory
track
record
–
base
rate
relief
to
date
has
increased
sales
margins over 30%
•
Continue to have favorable longer term rate plans including cost
tracker
mechanisms at Unitil Energy and Granite State through 2014
Base Rate Relief
($ in millions)
$11.7
$3.7
$3.3
$2.5
$8.7
$3.7
$33.6
Unitil Energy
5/1/2011 &
5/1/2012
Fitchburg Gas
8/1/2011
Fitchburg Electric
8/1/2011
Granite State
1/1/2011
8/1/2011
8/1/2012
Northern ME
1/1/2012 &
5/1/2012
Northern NH
5/1/2012
Total to Date |
 12
2013 Rate Case Filings
Rate
Relief
2013
2014
Company
Requested
Q1
Q2
Q3
Q4
Q1
Q2
Q3
Q4
Northern Utilities (New Hampshire)
$5.2mm
Northern Utilities (Maine)
$4.6mm
Fitchburg (Electric)
TBD
Rates
Expected
Q2 2014
~9 mos.
Rates
Expected
Q1 2014
~10 mos.
~3 mos.
Temporary Rates Expected Q3 2013
Permanent Rates
Expected Q2 2014
~10 mos.
•
Total of $9.8 million of rate relief requested for Northern Utilities in Maine and
New Hampshire
•
Both filings include a comprehensive multi-year rate plan with cost
tracker •
Fitchburg Electric rate case to be filed early third quarter 2013
|
 Usource
13
Competitive Energy Markets
Customers
Connecticut
Minnesota
Delaware
New Hampshire
Florida
New Jersey
Georgia
New York
Illinois
Ohio
Indiana
Pennsylvania
Maine
Rhode Island
Maryland
Texas
Massachusetts
West Virginia
Gas & Electric
Gas
only
Not
fully
open
•
Manages over $660 million annually
in electric and gas energy contracts
•
Serves over 1,200 customers
•
>90%
customer retention rate
•
Currently serves electricity and/or
natural gas clients in 18 states
•
2012 revenue of $5.5 million
•
Year-end 2012 forward book of
revenue at an all-time high of $8.2
million |
 14
Key Investment Highlights
•
Regulated local distribution utility
business model
•
Diversified natural gas and electric sales
•
Growing operations and customer base
•
Utility rate base growth
•
Natural gas system expansion
•
Usource contribution
•
Historic dividend stability
•
Experienced management team |
 Question & Answer Session
15 |