Attached files
| file | filename |
|---|---|
| 8-K - 8-K - PLEXUS CORP | a8-kq2f13.htm |
| EX-99.1 - EXHIBIT 99.1 - PLEXUS CORP | q2f13exhibit991.htm |
FISCAL SECOND QUARTER 2013 FINANCIAL RESULTS April 18, 2013
SAFE HARBOR & FAIR DISCLOSURE STATEMENT 2 Any statements made during our call today that are not historical in nature, such as statements in the future tense and statements that include "believe," "expect," "intend," "plan," "anticipate," and similar terms and concepts, are forward- looking statements. Forward-looking statements are not guarantees since there are inherent difficulties in predicting future results, and actual results could differ materially from those expressed or implied in the forward-looking statements. For a list of major factors that could cause actual results to differ materially from those projected, please refer to the Company’s periodic SEC filings, particularly the risk factors in our Form 10-K filing for the fiscal year ended September 29, 2012, and the Safe Harbor and Fair Disclosure statement in yesterday’s press release. The Company provides non-GAAP supplemental information. For example, our call today will reference return on invested capital and free cash flow. These non-GAAP financial measures are used for internal management assessments because they provide additional insight into ongoing financial performance and the metrics that are driving management decisions. Other measures, such as earnings excluding special charges, help assess trends and performance over time by eliminating the effects of unusual events. For a full reconciliation of non-GAAP supplemental information please refer to yesterday’s press release and our periodic SEC filings.
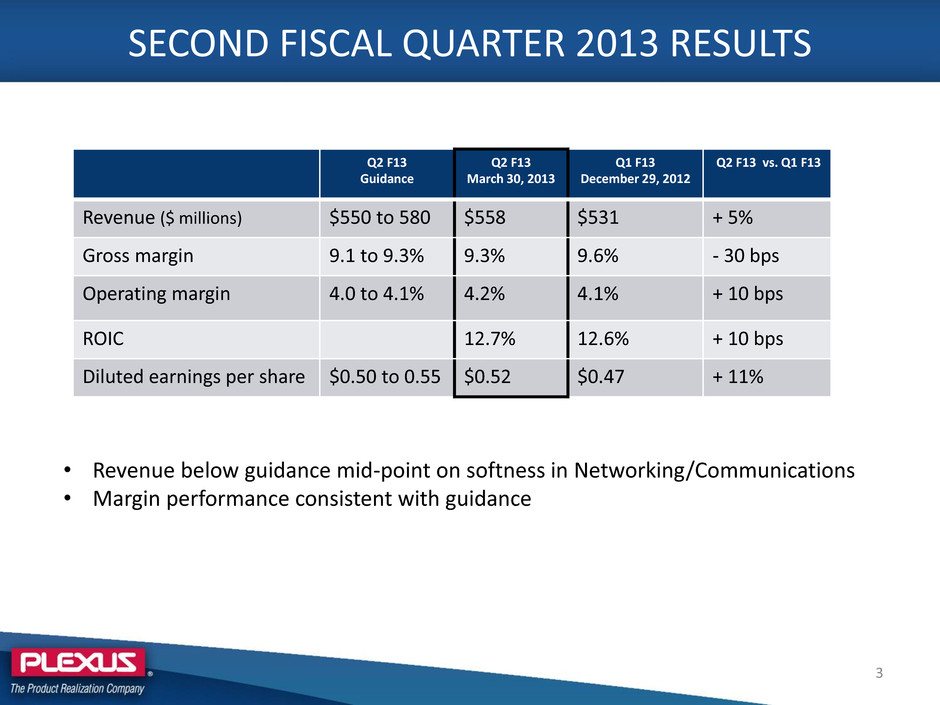
SECOND FISCAL QUARTER 2013 RESULTS 3 Q2 F13 Guidance Q2 F13 March 30, 2013 Q1 F13 December 29, 2012 Q2 F13 vs. Q1 F13 Revenue ($ millions) $550 to 580 $558 $531 + 5% Gross margin 9.1 to 9.3% 9.3% 9.6% - 30 bps Operating margin 4.0 to 4.1% 4.2% 4.1% + 10 bps ROIC 12.7% 12.6% + 10 bps Diluted earnings per share $0.50 to 0.55 $0.52 $0.47 + 11% • Revenue below guidance mid-point on softness in Networking/Communications • Margin performance consistent with guidance
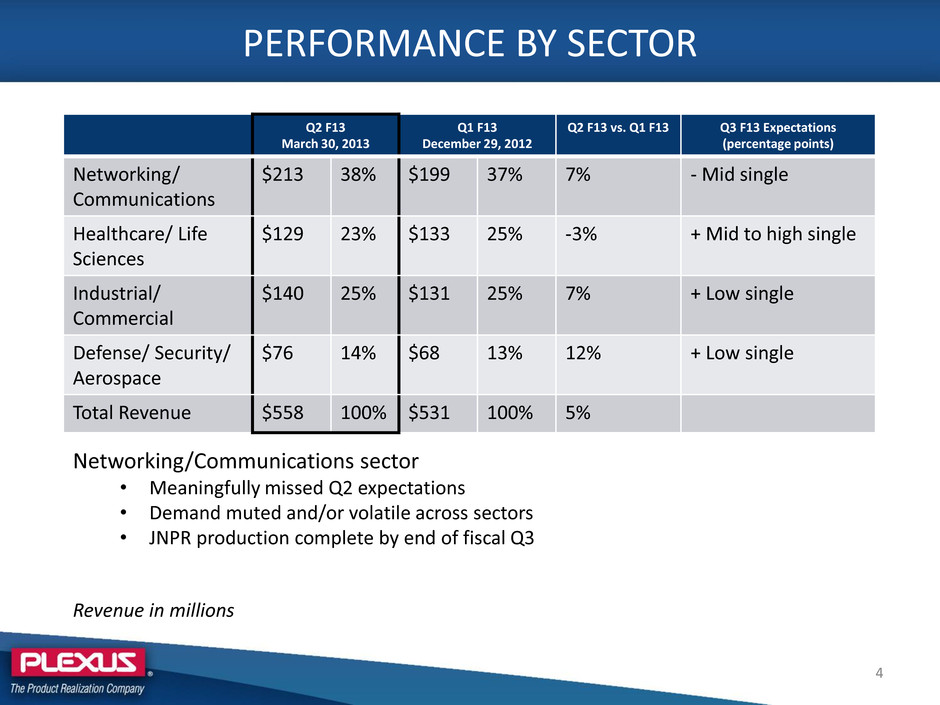
PERFORMANCE BY SECTOR 4 Q2 F13 March 30, 2013 Q1 F13 December 29, 2012 Q2 F13 vs. Q1 F13 Q3 F13 Expectations (percentage points) Networking/ Communications $213 38% $199 37% 7% - Mid single Healthcare/ Life Sciences $129 23% $133 25% -3% + Mid to high single Industrial/ Commercial $140 25% $131 25% 7% + Low single Defense/ Security/ Aerospace $76 14% $68 13% 12% + Low single Total Revenue $558 100% $531 100% 5% Revenue in millions Networking/Communications sector • Meaningfully missed Q2 expectations • Demand muted and/or volatile across sectors • JNPR production complete by end of fiscal Q3
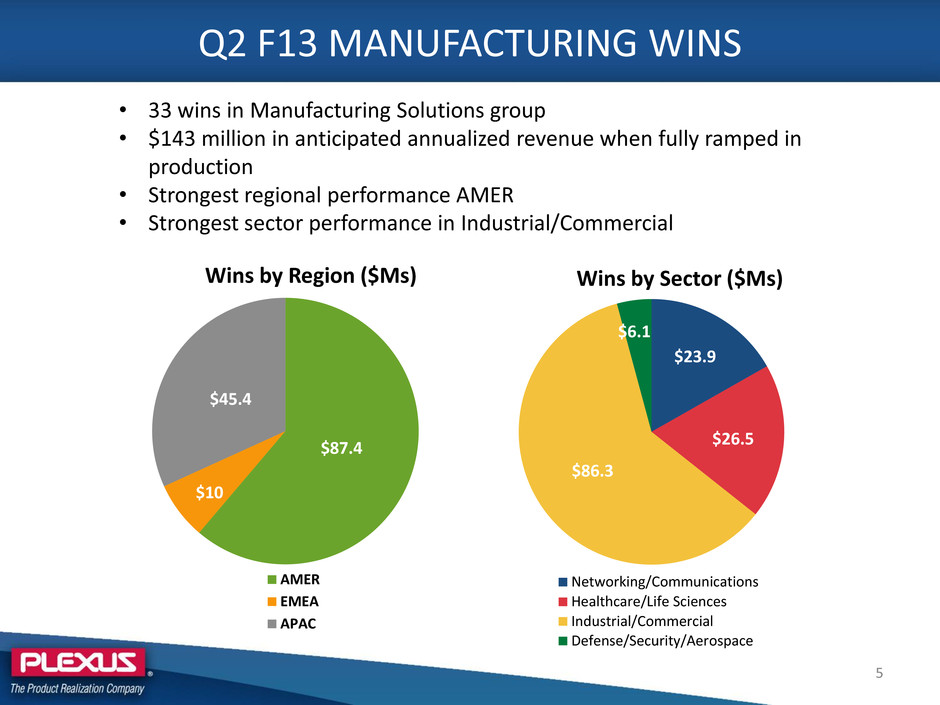
Q2 F13 MANUFACTURING WINS 5 $23.9 $26.5 $86.3 $6.1 Wins by Sector ($Ms) Networking/Communications Healthcare/Life Sciences Industrial/Commercial Defense/Security/Aerospace $87.4 $10 $45.4 Wins by Region ($Ms) AMER EMEA APAC • 33 wins in Manufacturing Solutions group • $143 million in anticipated annualized revenue when fully ramped in production • Strongest regional performance AMER • Strongest sector performance in Industrial/Commercial
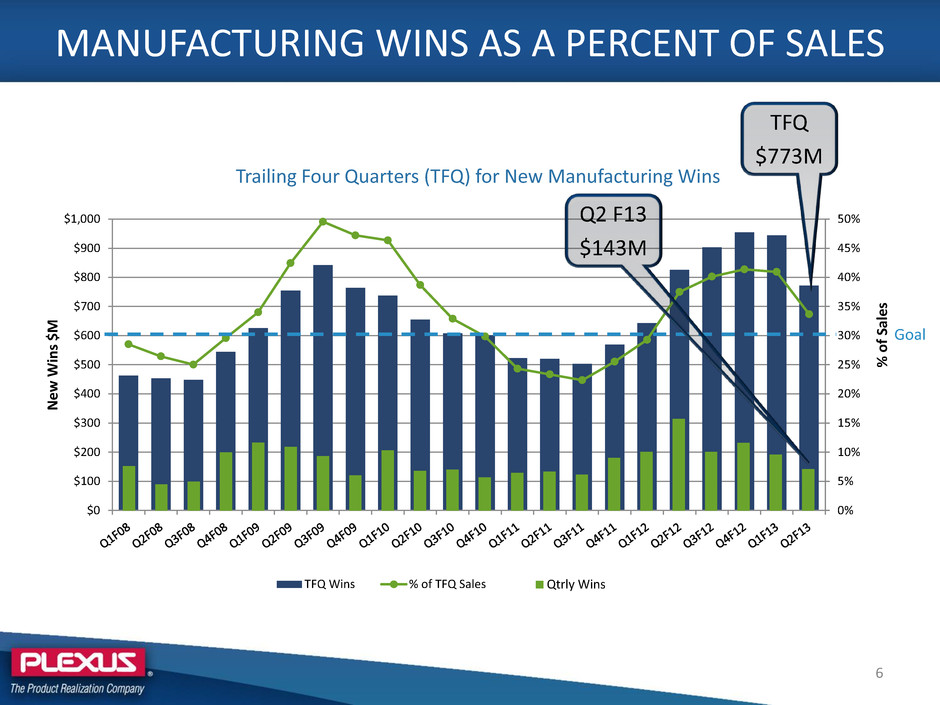
0% 5% 10% 15% 20% 25% 30% 35% 40% 45% 50% $0 $100 $200 $300 $400 $500 $600 $700 $800 $900 $1,000 % o f Sa le s Ne w W in s $ M TFQ Wins % of TFQ Sales Trailing Four Quarters (TFQ) for New Manufacturing Wins Qtrly Wins MANUFACTURING WINS AS A PERCENT OF SALES Goal 6 Q2 F13 $143M TFQ $773M
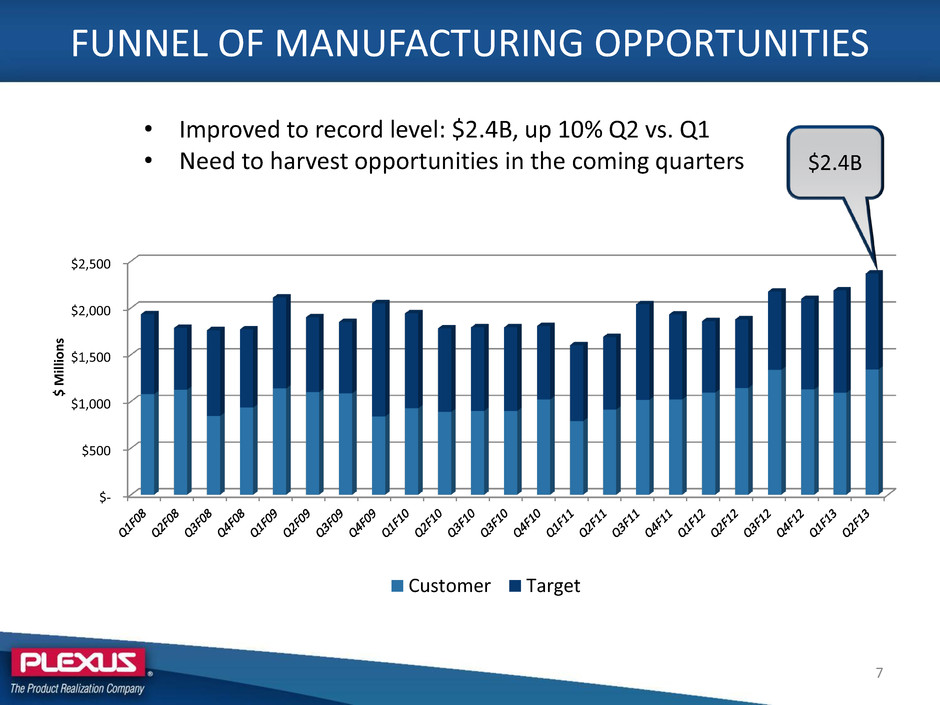
• Improved to record level: $2.4B, up 10% Q2 vs. Q1 • Need to harvest opportunities in the coming quarters FUNNEL OF MANUFACTURING OPPORTUNITIES $- $500 $1,000 $1,500 $2,000 $2,500 $ M ill io n s Customer Target 7 $2.4B
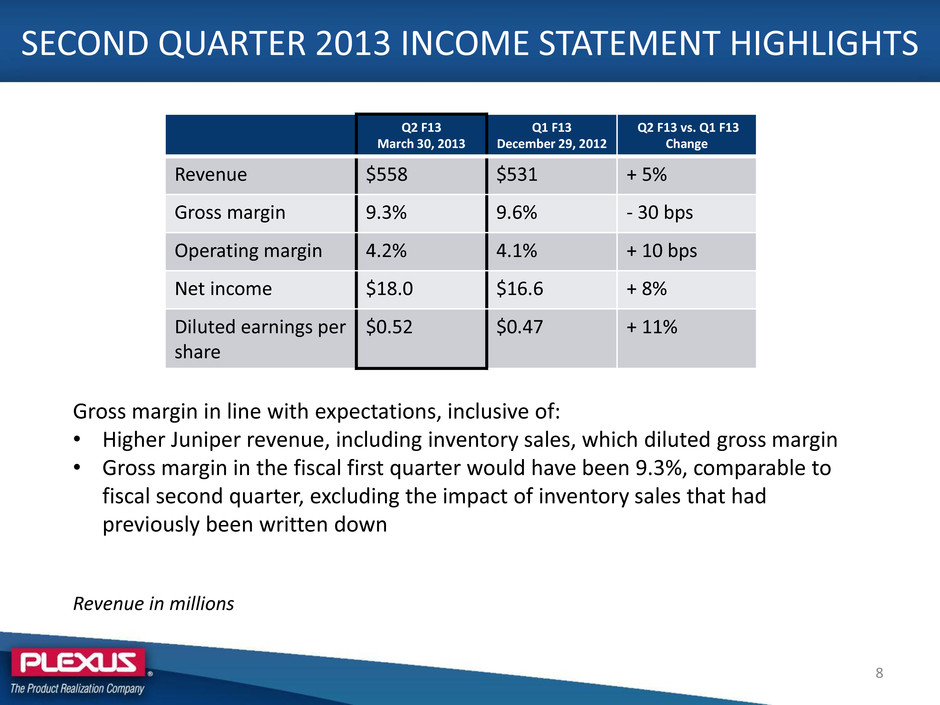
SECOND QUARTER 2013 INCOME STATEMENT HIGHLIGHTS 8 Q2 F13 March 30, 2013 Q1 F13 December 29, 2012 Q2 F13 vs. Q1 F13 Change Revenue $558 $531 + 5% Gross margin 9.3% 9.6% - 30 bps Operating margin 4.2% 4.1% + 10 bps Net income $18.0 $16.6 + 8% Diluted earnings per share $0.52 $0.47 + 11% Revenue in millions Gross margin in line with expectations, inclusive of: • Higher Juniper revenue, including inventory sales, which diluted gross margin • Gross margin in the fiscal first quarter would have been 9.3%, comparable to fiscal second quarter, excluding the impact of inventory sales that had previously been written down
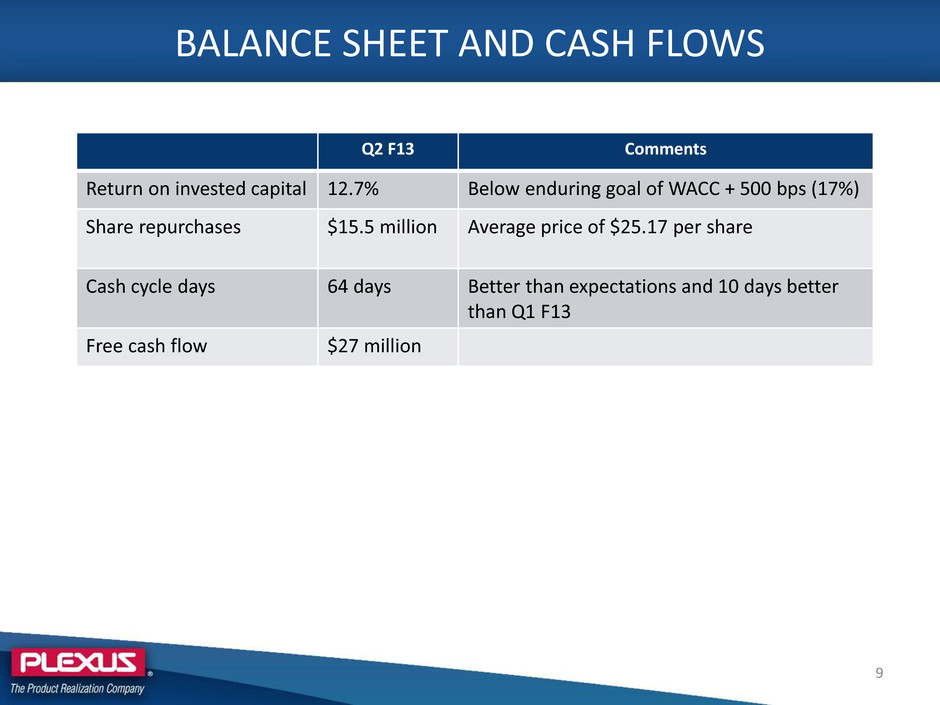
BALANCE SHEET AND CASH FLOWS 9 Q2 F13 Comments Return on invested capital 12.7% Below enduring goal of WACC + 500 bps (17%) Share repurchases $15.5 million Average price of $25.17 per share Cash cycle days 64 days Better than expectations and 10 days better than Q1 F13 Free cash flow $27 million
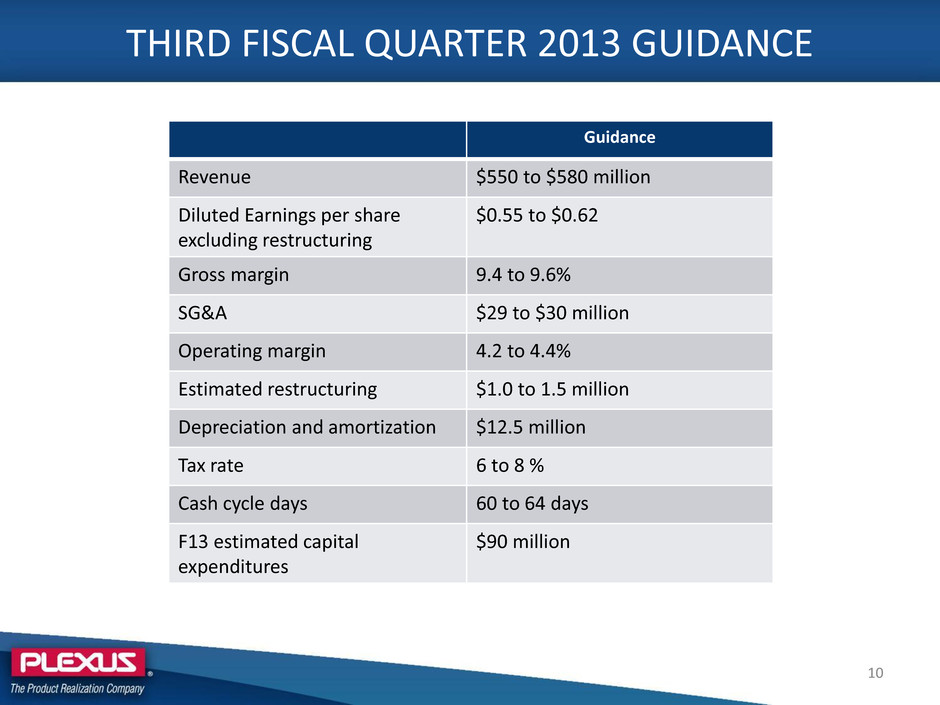
THIRD FISCAL QUARTER 2013 GUIDANCE 10 Guidance Revenue $550 to $580 million Diluted Earnings per share excluding restructuring $0.55 to $0.62 Gross margin 9.4 to 9.6% SG&A $29 to $30 million Operating margin 4.2 to 4.4% Estimated restructuring $1.0 to 1.5 million Depreciation and amortization $12.5 million Tax rate 6 to 8 % Cash cycle days 60 to 64 days F13 estimated capital expenditures $90 million
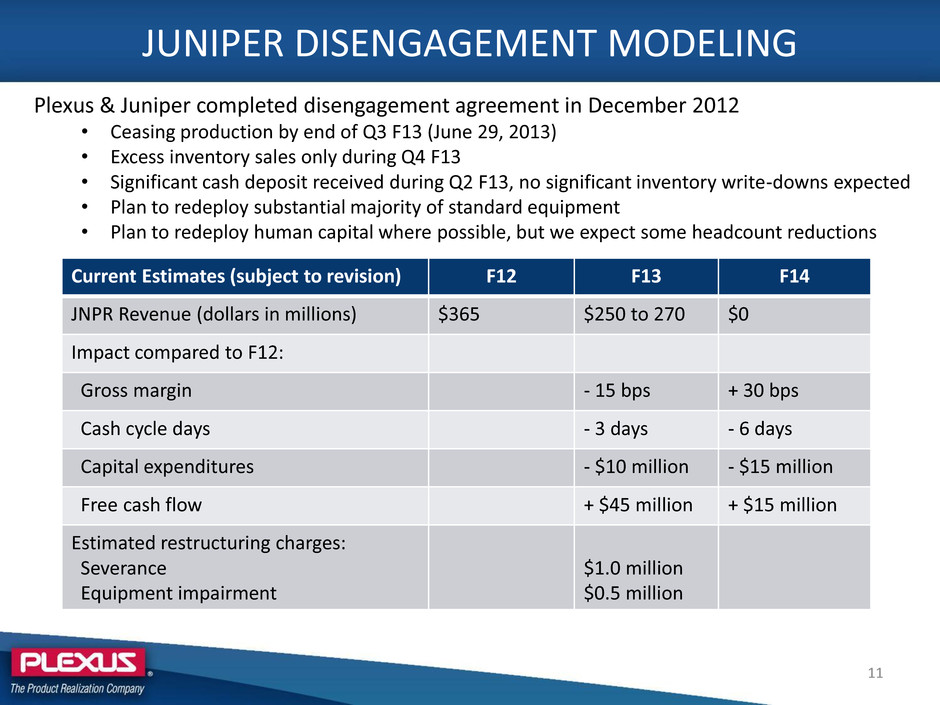
JUNIPER DISENGAGEMENT MODELING Plexus & Juniper completed disengagement agreement in December 2012 • Ceasing production by end of Q3 F13 (June 29, 2013) • Excess inventory sales only during Q4 F13 • Significant cash deposit received during Q2 F13, no significant inventory write-downs expected • Plan to redeploy substantial majority of standard equipment • Plan to redeploy human capital where possible, but we expect some headcount reductions Current Estimates (subject to revision) F12 F13 F14 JNPR Revenue (dollars in millions) $365 $250 to 270 $0 Impact compared to F12: Gross margin - 15 bps + 30 bps Cash cycle days - 3 days - 6 days Capital expenditures - $10 million - $15 million Free cash flow + $45 million + $15 million Estimated restructuring charges: Severance Equipment impairment $1.0 million $0.5 million 11
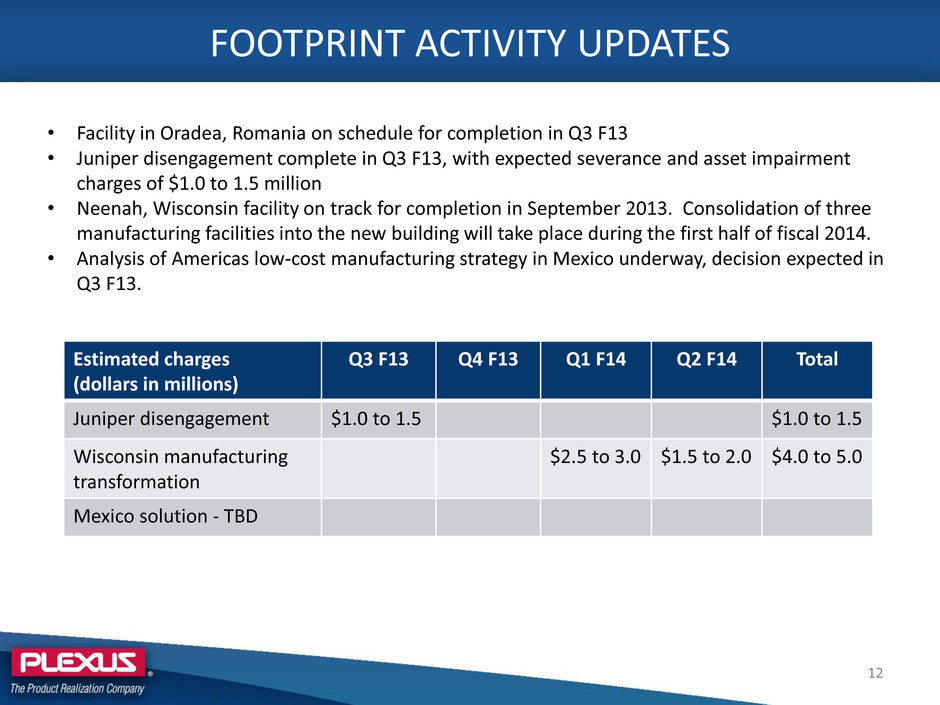
FOOTPRINT ACTIVITY UPDATES • Facility in Oradea, Romania on schedule for completion in Q3 F13 • Juniper disengagement complete in Q3 F13, with expected severance and asset impairment charges of $1.0 to 1.5 million • Neenah, Wisconsin facility on track for completion in September 2013. Consolidation of three manufacturing facilities into the new building will take place during the first half of fiscal 2014. • Analysis of Americas low-cost manufacturing strategy in Mexico underway, decision expected in Q3 F13. Estimated charges (dollars in millions) Q3 F13 Q4 F13 Q1 F14 Q2 F14 Total Juniper disengagement $1.0 to 1.5 $1.0 to 1.5 Wisconsin manufacturing transformation $2.5 to 3.0 $1.5 to 2.0 $4.0 to 5.0 Mexico solution - TBD 12
WRAP-UP 13 Near-term focus items • Harvest opportunities from improved funnel • Meaningful improvement in productivity • Juniper disengagement • New Oradea facility completion Q3 F13 • Fox Cities, WI transformation • Decision on a new solution in Mexico anticipated in Q3 F13
