Attached files
| file | filename |
|---|---|
| 8-K - CHINA FUND INC | fp0007013_8k.htm |
|
Mar 31, 2013
|
Monthly Insight
The China Fund, Inc. (CHN)
|
|
Investment Objective
|
The investment objective of the Fund is to achieve long term capital appreciation. The Fund seeks to achieve its objective through investment in the equity securities of companies and other entities with significant assets, investments, production activities, trading or other business interests in China or which derive a significant part of their revenue from China.
The Fund has an operating policy that the Fund will invest at least 80% of its assets in China companies. For this purpose, ‘China companies’ are (i) companies for which the principal securities trading market is in China; (ii) companies for which the principal securities trading market is outside of China or in companies organized outside of China, that in both cases derive at least 50% of their revenues from goods or services sold or produced, or have a least 50% of their assets in China; or (iii) companies organized in China. Under the policy, China will mean the People’s Republic of China, including Hong Kong, and Taiwan. The Fund will provide its stockholders with at least 60 days’ prior notice of any change to this policy.
|
Performance Overview
|
|
Performance History
|
1 month
|
3 months
|
YTD
|
1 Year
|
3 Years
(p.a.)
|
5 Years
(p.a.)
|
10 Years
(p.a.)
|
Since
Inception
|
|
NAV (%)
|
-1.65
|
3.06
|
3.06
|
6.64
|
2.42
|
3.57
|
18.21
|
10.78
|
|
Market price (%)
|
-2.10
|
-1.87
|
-1.87
|
4.05
|
2.31
|
5.29
|
17.12
|
9.80
|
|
Benchmark (%)
|
-2.82
|
-1.45
|
-1.45
|
7.88
|
4.40
|
2.04
|
13.54
|
N/A
|
|
Performance History
|
2012
|
2011
|
2010
|
2009
|
2008
|
2007
|
2006
|
2005
|
|
NAV (%)
|
12.07
|
-24.37
|
27.25
|
72.82
|
-46.95
|
86.20
|
57.10
|
6.09
|
|
Market price (%)
|
20.46
|
-27.51
|
23.60
|
72.19
|
-40.65
|
50.24
|
65.67
|
-21.51
|
|
Benchmark (%)
|
22.65
|
-18.36
|
13.60
|
67.12
|
-49.37
|
37.97
|
39.50
|
10.27
|
Source: State Street Bank and Trust Company. Source for index data: MSCI as at March 31, 2013.
|
Portfolio Analysis
|
|
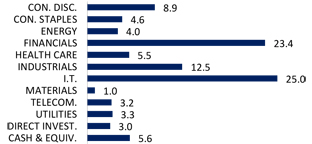
Sector allocation (%)
|
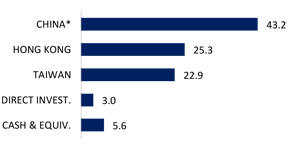
Country allocation (%)
|
 |
 |
|
Source: State Street Bank and Trust Company as at March 31, 2013.
|
* China includes A-shares (6.7%), A-share equity linked securities (7.8%),
B-shares (0.0%), H-shares (13.3%) and Red-chips (15.4%).
|

The China Fund, Inc. (CHN)
|
Portfolio Analysis (continued)
|
|
Top 10 Holdings
|
Sector
|
%
|
|
HAND ENTERPRISE SOLUTIONS CO., LTD.
|
I.T.
|
6.7
|
|
INDUSTRIAL & COMMERCIAL BANK OF CHINA
|
FINANCIALS
|
5.7
|
|
TAIWAN SEMICONDUCTOR MANUFACTURING CO., LTD.
|
I.T.
|
5.6
|
|
CHINA EVERBRIGHT INTERNATIONAL, LTD.
|
INDUSTRIALS
|
5.2
|
|
SUN HUNG KAI PROPERTIES, LTD.
|
FINANCIALS
|
4.7
|
|
ENN ENERGY HOLDINGS, LTD.
|
UTILITIES
|
3.3
|
|
CHINA MEDICAL SYSTEM HOLDINGS, LTD.
|
HEALTHCARE
|
3.3
|
|
CHINA MOBILE, LTD.
|
TELECOM
|
3.2
|
|
DIGITAL CHINA HOLDINGS, LTD.
|
I.T.
|
2.7
|
|
PING AN INSURANCE , LTD.
|
FINANCIALS
|
2.5
|
|
Total
|
42.9
|
|
|
Direct Investments
|
Sector
|
%
|
|
GOLDEN MEDITECH HOLDINGS, LTD. 15.0%, 5/16/13
|
OTHERS
|
1.5
|
|
GOLDEN MEDITECH HOLDINGS, LTD. 15.0%, 11/16/13
|
OTHERS
|
1.5
|
|
Total
|
3.0
|
|
Source: State Street Bank and Trust Company as at March 31, 2013.
|
Fund Details
|
|
NAV
|
$23.27
|
|
Market price
|
$21.01
|
|
Premium/Discount
|
-9.71%
|
|
Market cap
|
US$329.5m
|
|
Shares outstanding
|
15,682,029
|
|
Exchange listed
|
NYSE
|
|
Listing date
|
July 10, 1992
|
|
Benchmark
|
MSCI Golden Dragon Index (Total Return)
|
|
Fund Manager
|
Christina Chung
|
|
Listed and direct investment manager
|
RCM Asia Pacific Limited
|
Source: State Street Bank and Trust Company as at March 31, 2013.
|
Dividend History (10 years)
|
|
Declaration
date
|
Ex-dividend
date
|
Record
date
|
Payable
date
|
Dividend/
Share
|
Income
|
Long-term Capital
|
Short-term Capital
|
|
10 Dec 2012
|
20 Dec 2012
|
24 Dec 2012
|
28 Dec 2012
|
3.2517
|
0.3473
|
2.9044
|
0.0000
|
|
8 Dec 2011
|
21 Dec 2011
|
23 Dec 2011
|
29 Dec 2011
|
2.9964
|
0.1742
|
2.8222
|
0.0000
|
|
8 Dec 2010
|
21 Dec 2010
|
24 Dec 2010
|
29 Dec 2010
|
2.2742
|
0.3746
|
1.8996
|
0.0000
|
|
9 Dec 2009
|
22 Dec 2009
|
24 Dec 2009
|
29 Dec 2009
|
0.2557
|
0.2557
|
0.0000
|
0.0000
|
|
8 Dec 2008
|
22 Dec 2008
|
24 Dec 2008
|
23 Jan 2009
|
5.8174
|
0.4813
|
5.3361
|
0.0000
|
|
7 Dec 2007
|
19 Dec 2007
|
21 Dec 2007
|
25 Jan 2008
|
12.1200
|
0.2800
|
9.0000
|
2.8400
|
|
8 Dec 2006
|
19 Dec 2006
|
21 Dec 2006
|
29 Dec 2006
|
4.0117
|
0.2996
|
2.7309
|
0.9812
|
|
9 Dec 2005
|
19 Dec 2005
|
21 Dec 2005
|
29 Dec 2005
|
2.5119
|
0.2172
|
2.2947
|
0.0000
|
|
13 Dec 2004
|
20 Dec 2004
|
22 Dec 2004
|
7 Jan 2005
|
3.5701
|
0.1963
|
3.2664
|
0.1074
|
|
19 Dec 2003
|
29 Dec 2003
|
31 Dec 2003
|
15 Jan 2004
|
1.7800
|
0.0700
|
0.6700
|
1.0400
|
Source : State Street Bank and Trust Company as at December 31, 2012
2
The China Fund, Inc. (CHN)
The China Fund Inc. NAV Performance of USD $10,000 since inception (with dividends reinvested at NAV price)
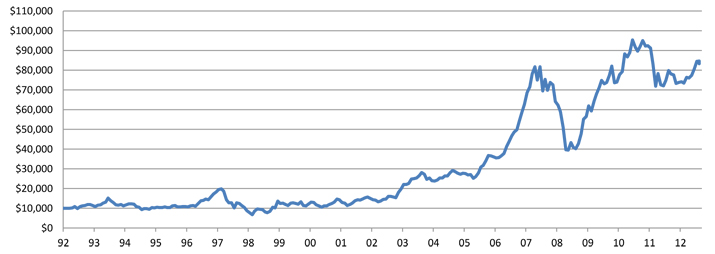
Past performance is not a guide to future returns.
Source: State Street Bank and Trust Company as at March 31, 2013.
The China Fund Inc. Premium / Discount
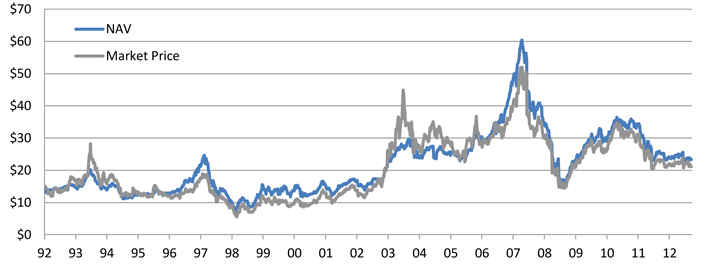
Past performance is not a guide to future returns.
Source: State Street Bank and Trust Company as at March 31, 2013.
3
The China Fund, Inc. (CHN)
Manager’s Commentary
Market Review
In March, although there were no real surprises in the earnings results for the full year 2012, there were still looming worries over the pace of the recovery of economic growth. Near the end of the month, the China Banking Regulatory Commission issued new rules on the securitization of wealth management products which triggered concerns over the banking sector, in particular on smaller banks due to the growth of wealth management products on their balance sheets. On a positive note, the National People’s Congress meeting lifted hopes for reforms in various areas, such as capital markets, social security (including the health care and hukou systems), and as well as environmental protection. In Hong Kong, the equity market staged a pullback as the market awaited details of the government’s property tightening measures. Sentiment surrounding the property market worsened on the news of a mortgage rate hike. Increased uncertainty surrounding the euro area sovereign debt crisis also weighed on market sentiment.
The Taiwan Stock Exchange Weighted Index stayed almost flat month-on-month, outperforming the Asia ex Japan broad index. Both Taiwan’s imports and exports saw a year-on-year decline in February, contrary to the strong positive momentum in January. The Central Bank maintained the benchmark interest unchanged at 1.875% and kept a loose monetary policy, which was in-line with the market’s expectation. As a relatively small, technology-heavy, export-driven economy, the Taiwan equity market was weighed down by weakening momentum in the technology sector and the resurgence of the European debt crisis.
Fund review
The Fund outperformed relative to the benchmark in March, due to both sector allocation and stock selection. The overweight in health care and underweight in materials helped, while our stock selection in the information technology, health care, and industrial sectors also contributed to the outperformance.
The top contributor for the month was Hand Enterprise Solution. The share price continued its strong run on the back of stable spending in the high-end IT market and still-reasonable valuations. Another key contributor, China Everbright International, outperformed with its share price driven by the success of new projects. We believe that the potential for acceleration of new projects, given the increased attention on the pollution problem in China, should continue to drive the stock Additionally, in the medium term, we expect the stock will be re-rated as its revenue stream becomes increasingly driven by operating service revenue, thereby making it an attractive, high- growth utility. On the negative side, the top detractor was Sun Hung Kai Properties. Its share price was undermined by the round of cooling measures, implemented by the Hong Kong government, aimed to mitigate overheating of the physical property market.
Outlook
2012 corporate earnings were generally weaker than expected. Although the economy has stabilized, earnings visibility is still low as demand recovery remains relatively moderate. Valuations are cheap, particularly for China stocks, but in the absence of economic reforms, the market is likely to remain in a trading range in the short-term.
For the Taiwan market, we maintain our underweight, especially with the current trend of weak sentiment in the global technology sector and the continued prolongation of the European debt crisis. Specifically, we will remain selective with respect to the technology space and will focus on names with secular growth potential or niche market positioning. Generally speaking, we favor Hong Kong and China equities over Taiwan equities and will remain underweight in this market.
Source: RCM Asia Pacific Limited as at March 31, 2013.
4
The China Fund, Inc. (CHN)
Portfolio Holdings
|
CUSIP
|
Security Description
|
Cost Base
|
Base MV
|
Shares
|
Percentage of
Net Assets
|
|||||||
|
B3VN92906
|
HAND Enterprise Solutions Co., Ltd.
|
1,793,494 | 24,374,720 | 6,369,715 | 6.7 | |||||||
|
B1G1QD902
|
Industrial & Commercial Bank of China
|
20,739,449 | 20,903,913 | 29,829,000 | 5.7 | |||||||
|
688910900
|
Taiwan Semiconductor Manufacturing Co., Ltd.
|
16,072,089 | 20,346,125 | 6,084,000 | 5.6 | |||||||
|
663094902
|
China Everbright International, Ltd.
|
12,183,629 | 19,076,501 | 26,730,000 | 5.2 | |||||||
|
685992000
|
Sun Hung Kai Properties, Ltd.
|
17,289,798 | 17,066,801 | 1,269,000 | 4.7 | |||||||
|
633393905
|
Enn Energy Holdings, Ltd.
|
606,420 | 12,151,933 | 2,204,000 | 3.3 | |||||||
|
B6WY99909
|
China Medical System Holdings, Ltd.
|
853,792 | 11,845,708 | 11,669,300 | 3.3 | |||||||
|
607355906
|
China Mobile, Ltd.
|
11,683,974 | 11,678,038 | 1,103,500 | 3.2 | |||||||
|
635186901
|
Digital China Holdings, Ltd.
|
13,205,899 | 9,795,995 | 7,256,000 | 2.7 | |||||||
|
913BMZ902
|
Ping An Insurance (Group) Company of China, Ltd. Access Product (expiration 04/01/13)
|
9,494,980 | 9,237,158 | 1,418,047 | 2.5 | |||||||
|
674842901
|
Ruentex Development Co., Ltd.
|
3,423,335 | 8,994,323 | 4,416,301 | 2.5 | |||||||
|
17313A533
|
Gree Electric Appliances, Inc. Access Product (expiration 01/17/14)
|
6,453,442 | 8,479,374 | 1,838,546 | 2.3 | |||||||
|
B01CT3905
|
Tencent Holdings, Ltd.
|
7,312,795 | 8,333,015 | 262,100 | 2.3 | |||||||
|
B00G0S903
|
CNOOC, Ltd.
|
8,859,687 | 8,115,425 | 4,228,000 | 2.2 | |||||||
|
644094906
|
Taiwan FamilyMart Co., Ltd.
|
1,313,077 | 7,979,477 | 1,741,652 | 2.2 | |||||||
|
671815900
|
Qingling Motors Co., Ltd.
|
8,718,221 | 7,797,131 | 28,960,000 | 2.1 | |||||||
|
619376908
|
China Resources Land, Ltd.
|
4,469,418 | 7,245,773 | 2,592,000 | 2.0 | |||||||
|
B2R2ZC908
|
CSR Corp., Ltd.
|
7,466,210 | 7,048,405 | 9,930,000 | 1.9 | |||||||
|
B1YMYT902
|
Hiwin Technologies Corp.
|
9,693,067 | 6,936,042 | 942,750 | 1.9 | |||||||
|
626073902
|
Delta Electronics, Inc.
|
4,550,608 | 6,751,108 | 1,615,000 | 1.9 | |||||||
|
634007900
|
Kunlun Energy Co., Ltd.
|
5,034,472 | 6,627,963 | 3,122,000 | 1.8 | |||||||
|
959GRNII9
|
Taiwan Life Insurance Co., Ltd., 4.0%, 12/28/14
|
6,178,274 | 6,424,205 | 200,000,000 | 1.8 | |||||||
|
B15456906
|
Bank of China, Ltd.
|
6,465,433 | 6,382,253 | 13,762,000 | 1.7 | |||||||
|
637248907
|
MediaTek Inc.
|
6,194,126 | 6,355,990 | 559,000 | 1.7 | |||||||
|
B1L8PB906
|
Tong Hsing Electronic Industries, Ltd.
|
5,919,469 | 5,837,973 | 1,380,000 | 1.6 | |||||||
|
620267906
|
Advantech Co., Ltd.
|
4,104,779 | 5,560,672 | 1,284,000 | 1.5 | |||||||
|
986PLF007
|
Golden Meditech Holdings, Ltd. 15.0%, 05/16/13
|
5,557,209 | 5,549,442 |
58,222,500
|
^ | 1.5 | ||||||
|
986PLG005
|
Golden Meditech Holdings, Ltd. 15.0%, 11/16/13
|
5,557,209 | 5,549,442 |
58,222,500
|
^ | 1.5 | ||||||
|
626735906
|
Hong Kong Exchanges and Clearing, Ltd.
|
4,947,274 | 5,223,725 | 306,500 | 1.4 | |||||||
|
99ZMCS903
|
Kweichow Moutai Co., Ltd. Access Product (expiration 10/26/15)
|
6,129,683 | 4,528,456 | 171,159 | 1.2 | |||||||
|
670039007
|
Uni-President Enterprises Corp.
|
669,016 | 4,299,564 | 2,267,508 | 1.2 | |||||||
|
643055908
|
Golden Meditech Holdings, Ltd.
|
4,555,715 | 4,288,226 | 35,040,000 | 1.2 | |||||||
|
651795908
|
Natural Beauty Bio-Technology, Ltd.
|
4,906,910 | 4,240,807 | 47,710,000 | 1.2 | |||||||
|
658444906
|
Merida Industry Co., Ltd.
|
3,871,743 | 4,087,284 | 679,000 | 1.1 | |||||||
|
B3ZVDV905
|
Sinopharm Group Co., Ltd.
|
2,527,529 | 3,903,306 | 1,212,000 | 1.1 | |||||||
|
644806002
|
Hutchison Whampoa, Ltd.
|
3,303,627 | 3,816,699 | 366,000 | 1.1 | |||||||
|
643648900
|
Shenzhen International Holdings, Ltd.
|
1,900,271 | 3,791,631 | 31,992,500 | 1.0 | |||||||
|
B1CKXF901
|
Zhengzhou Yutong Bus Co., Ltd. Access Product (expiration 01/20/15)
|
3,096,799 | 3,788,903 | 825,469 | 1.0 | |||||||
|
665157905
|
Comba Telecom Systems Holdings, Ltd.
|
7,565,579 | 3,712,760 | 10,958,500 | 1.0 | |||||||
|
B236JB905
|
Tiangong International Co., Ltd.
|
3,744,634 | 3,689,245 | 12,616,000 | 1.0 | |||||||
|
613623909
|
Hengan International Group Co., Ltd.
|
3,889,897 | 3,666,647 | 375,500 | 1.0 | |||||||
|
B633D9904
|
Zhongsheng Group Holdings, Ltd.
|
3,466,065 | 3,223,487 | 2,662,000 | 0.9 | |||||||
|
B60LZR903
|
Agricultural Bank of China, Ltd.
|
2,895,784 | 2,510,143 | 5,238,000 | 0.7 | |||||||
|
B1TDQL904
|
Ping An Insurance (Group) Company of China, Ltd. Access Product (expiration 01/17/14)
|
1,566,145 | 1,373,376 | 209,900 | 0.4 | |||||||
|
B4PTR3906
|
Fook Woo Group Holdings, Ltd.
|
7,974,083 | 1,118,523 | 25,314,000 | 0.3 | |||||||
|
972ZGS900
|
Gree Electric Appliances, Inc. Access Product (expiration 10/14/13)
|
1,002,105 | 972,624 | 212,549 | 0.3 | |||||||
|
B04W2V905
|
FU JI Food and Catering Services Holdings Ltd.
|
4,246,696 | 0 | 5,462,000 | 0.0 | |||||||
|
ACI0090H8
|
Zong Su Foods (acquired 09/21/10)
|
15,000,034 | 0 | 2,677 | 0.0 | |||||||
^Nominal value owed in HK dollars.
Source: State Street Bank and Trust Company as at March 31, 2013.
5
The China Fund, Inc. (CHN)
The information contained herein has been obtained from sources believed to be reliable but RCM and its affiliates do not warrant the information to be accurate, complete or reliable. The opinions expressed herein are subject to change at any time and without notice. Past performance is not indicative of future results. This material is not intended as an offer or solicitation for the purchase or sale of any financial instrument. Investors should consider the investment objectives, risks, charges and expenses of any mutual fund carefully before investing. This and other information is contained in the fund’s annual and semiannual reports, proxy statement and other fund information, which may be obtained by contacting your financial advisor or visiting the fund’s website at www.chinafundinc.com. This information is unaudited and is intended for informational purposes only. It is presented only to provide information on investment strategies and opportunities. The Fund seeks to achieve its objective through investment in the equity securities of companies and other entities with significant assets, investments, production activities, trading or other business interests in China or which derive a significant part of their revenue from China. Investing in non-U.S. securities entails additional risks, including political and economic risk and the risk of currency fluctuations, as well as lower liquidity. These risks, which can result in greater price volatility, will generally be enhanced in less diversified funds that concentrate investments in a particular geographic region. The Fund is a closed-end exchange traded management investment company. This material is presented only to provide information and is not intended for trading purposes. Closed-end funds, unlike open-end funds, are not continuously offered. After the initial public offering, shares are sold on the open market through a stock exchange, where shares may trade at a premium or a discount. Holdings are subject to change daily.