Attached files
| file | filename |
|---|---|
| EX-99.1 - EX-99.1 - Howmet Aerospace Inc. | d520161dex991.htm |
| 8-K - FORM 8-K - Howmet Aerospace Inc. | d520161d8k.htm |
 [Alcoa
Logo] 1
Quarter Earnings Conference
April 8, 2013
1
[Alcoa Logo]
Exhibit 99.2
st
[Alcoa Logo] |
 2
Cautionary Statement
Forward-Looking Statements
This presentation contains statements that relate to future events and expectations and as
such constitute forward-looking statements. Forward-looking statements include those
containing such words as “anticipates,” “estimates,”
“expects,” “forecasts,” “intends,” “outlook,” “plans,” “projects,” “should,” “targets,” “will,” or other words of similar meaning. All
statements that reflect Alcoa’s expectations, assumptions, or projections about the
future other than statements of historical fact are forward-looking statements, including, without
limitation, forecasts concerning global demand growth for aluminum, end-market
conditions, supply/demand balances, and growth opportunities for aluminum in automotive,
aerospace and other applications, trend projections, targeted financial results or operating
performance, and statements about Alcoa’s strategies, outlook, and business and financial
prospects. Forward-looking statements are subject to a number of known and unknown
risks, uncertainties, and other factors and are not guarantees of future performance. Important
factors that could cause actual results to differ materially from those in the
forward-looking statements include: (a) material adverse changes in aluminum industry conditions, including
global supply and demand conditions and fluctuations in London Metal Exchange-based
prices for primary aluminum, alumina, and other products, and fluctuations in indexed-based
and spot prices for alumina; (b) deterioration in global economic and financial market
conditions generally; (c) unfavorable changes in the markets served by Alcoa, including
automotive and commercial transportation, aerospace, building and construction,
distribution, packaging, defense, and industrial gas turbine; (d) the impact of changes in foreign
currency exchange rates on costs and results, particularly the Australian dollar, Brazilian
real, Canadian dollar, euro, and Norwegian kroner; (e) increases in energy costs, including
electricity, natural gas, and fuel oil, or the unavailability or interruption of energy
supplies; (f) increases in the costs of other raw materials, including calcined petroleum coke, caustic
soda, and liquid pitch; (g) Alcoa’s inability to achieve the level of revenue growth,
cash generation, cost savings, improvement in profitability and margins, fiscal discipline, or
strengthening of competitiveness and operations (including moving its alumina refining and
aluminum smelting businesses down on the industry cost curves and increasing revenues
in its Global Rolled Products and Engineered Products and Solutions segments) anticipated
from its restructuring programs and productivity improvement, cash sustainability, and
other initiatives; (h) Alcoa's inability to realize expected benefits, in each case as
planned and by targeted completion dates, from sales of non-core assets, or from newly constructed,
expanded, or acquired facilities, such as the upstream operations in Brazil and the
investments in hydropower projects in Brazil, or from international joint ventures, including the joint
venture in Saudi Arabia; (i) political, economic, and regulatory risks in the countries in
which Alcoa operates or sells products, including unfavorable changes in laws and
governmental policies, civil unrest, or other events beyond Alcoa’s control; (j) the
outcome of contingencies, including legal proceedings, government investigations, and
environmental remediation; (k) the business or financial condition of key customers,
suppliers, and business partners; (l) adverse changes in tax rates or benefits; (m) adverse
changes in discount rates or investment returns on pension assets; (n) the impact of cyber
attacks and potential information technology or data security breaches; and (o) the other
risk factors summarized in Alcoa's Form 10-K for the year ended December 31, 2012 and
other reports filed with the Securities and Exchange Commission. Alcoa disclaims any
obligation to update publicly any forward-looking statements, whether in response to new
information, future events or otherwise, except as required by applicable law.
Non-GAAP Financial Measures
Some of the information included in this presentation is derived from Alcoa’s
consolidated financial information but is not presented in Alcoa’s financial statements prepared in
accordance with U.S. generally accepted accounting principles (GAAP). Certain of these data
are considered “non-GAAP financial measures” under SEC rules. These non-GAAP
financial measures supplement our GAAP disclosures and should not be considered an
alternative to the GAAP measure. Reconciliations to the most directly comparable GAAP
financial measures and management’s rationale for the use of the non-GAAP financial
measures can be found in the Appendix to this presentation and on our website at www.alcoa.com under the “Invest” section. Any
reference during the discussion today to EBITDA means adjusted EBITDA, for which we have provided calculations and reconciliations
in the Appendix and on our website.
[Alcoa Logo] |
 Klaus Kleinfeld
Chairman and Chief Executive Officer
April 8, 2013
[Alcoa Logo]
[Alcoa Logo] |
 [Alcoa
Logo] Delivering Strong Quarterly Results
4
All segments profitable; Best net income
excluding special items since 3Q 2011
Adjusted EBITDA up 16% sequentially and 11% YoY
Record profitability in the Downstream
Improved Upstream performance YoY
despite lower metal price
Strong liquidity; $1.6 Billion cash on hand
Solid global end market growth;
Reaffirm 2013 global aluminum demand growth of 7%
[Alcoa Logo] |
 William Oplinger
Executive Vice President and Chief Financial Officer
5
April 8, 2013
[Alcoa Logo]
[Alcoa Logo] |
 Income Statement Summary
6
[Alcoa Logo]
$ Millions, except per-share amounts
1Q12
4Q12
1Q13
Sequential
Change
Revenue
$6,006
$5,898
$5,833
($65)
Cost of Goods Sold
$5,098
$4,968
$4,847
($121)
COGS % Revenue
84.9%
84.2%
83.1%
(1.1 % pts.)
Selling,
General Administrative, Other
$241
$277
$251
($26)
SGA % Revenue
4.0%
4.7%
4.3%
(0.4 % pts.)
Other Income
, Net
($16)
($345)
($27)
$318
Restructuring and Other Charges
$10
$60
$7
($53)
Effective Tax Rate
28.3%
35.8%
27.4%
(8.4 % pts.)
Net
Income
$94
$242
$149
($93)
Net Income Per Diluted Share
$0.09
$0.21
$0.13
($0.08) |
 [Alcoa Logo]
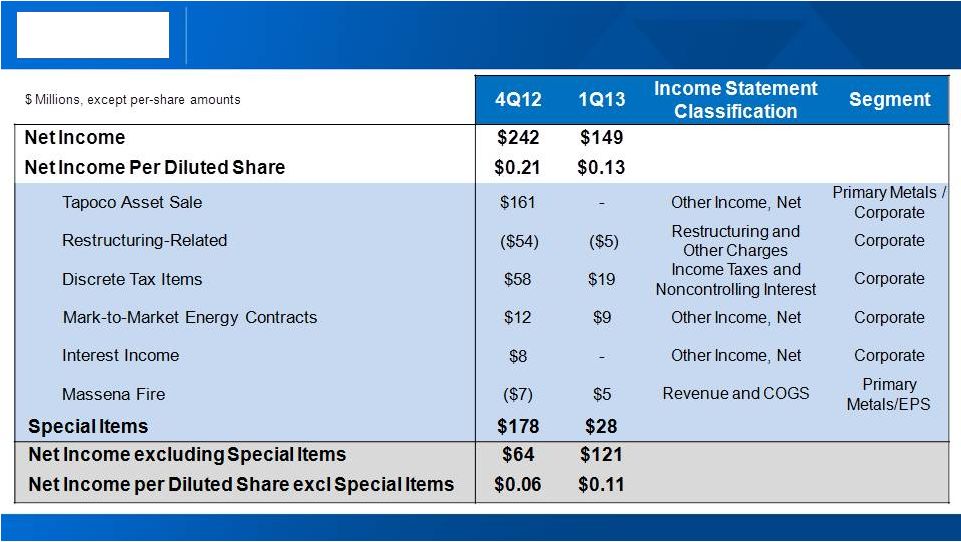
Restructuring and Other Special Items
See appendix for Adjusted Income reconciliation
7
[Alcoa Logo] |
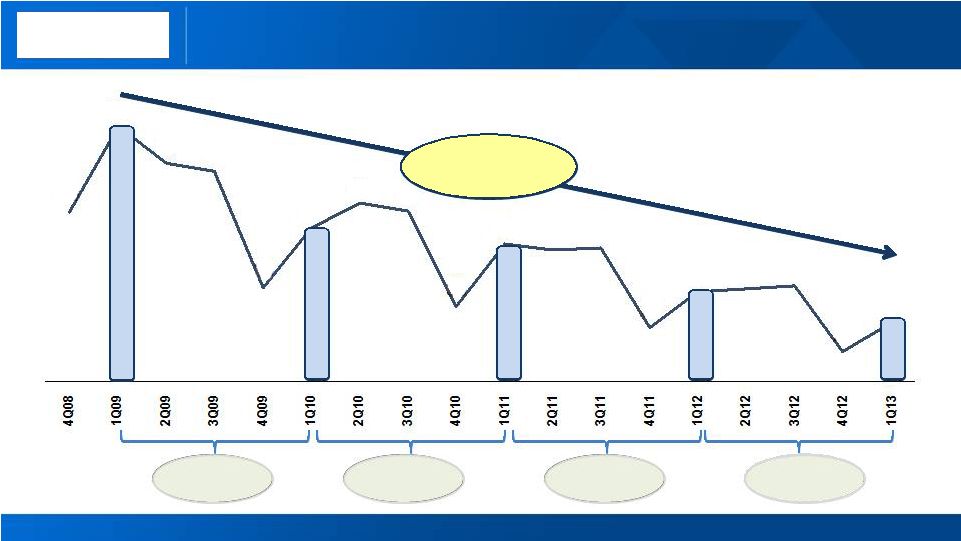
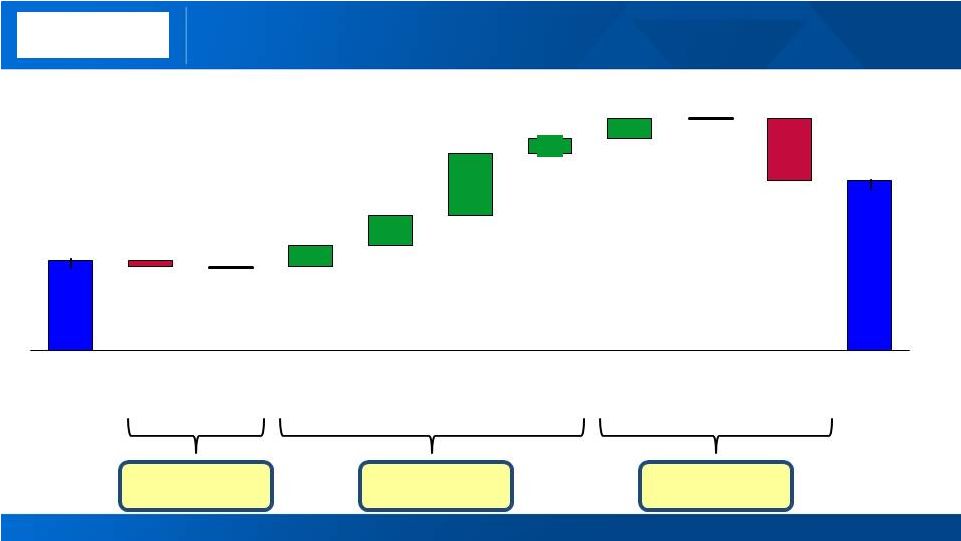 121
64
4
11
Net Income Excluding Restructuring & Other Special Items ($
millions)
Profitability increases nearly 90% driven by performance
See appendix for Adjusted Income reconciliation
8
4Q 2012
1Q 2013
45
Raw
Materials
0
Energy
15
Portfolio
Actions
Productivity
44
Price
/Mix
21
Volume
15
Currency
0
LME
Cost
Increases
/ Other
Market
-$4m
Performance
+$91m
Cost Headwinds
-$30m
[Alcoa Logo] |
 1Q13
Actual
and
2Q13
Outlook
-
EPS
9
Record results for Engineered Products and Solutions
See
appendix
for
Adjusted
EBITDA
reconciliation.
*
Prior
period
amounts
have
been
revised
to
conform
to
the
current
period
presentation.
See
appendix
for
additional
information.
[Alcoa Logo]
$ Millions
1Q 12
4Q 12
1Q 13
Party Revenue
1,390
1,348
1,423
ATOI*
157
140
173
Adjusted EBITDA Margin*
19.4%
18.0%
20.9%
rd
3
Quarterly ATOI up $16M year-
over-
year to
record level
Record ATOI
driven by
productivity & Aerospace volume
offsetting
weakness
Non-
Residential Construction
Commercial Transportation
Achieved
record
adjusted EBITDA
margin of 20.9%
Generated
$19M of productivity
savings;
improvements
achieved by
all business units
in
and
$ Millions
1Q 13
$173
Cost Increase
$1
Productivity
$19
Price / Mix
$0
Volume
$15
4Q 12
$140
-
Aerospace
market remains
strong
European Non-
Residential Construction
market continues
recovery in North America
Share gains
through innovation continue
across all market
sectors
Productivity
improvements
to continue
ATOI
is expected to
increase ~5% sequentially
to decline
; signs of |
 1Q13
Actual
and
2Q13
Outlook
-
GRP
Improved sequential performance for Global Rolled Products
10
[Alcoa Logo]
Aero & auto demand
expected to remain strong
Seasonal demand
increases in Packaging
Pricing pressures
continue in European and N.A.
Industrials and China markets
Productivity improvements
to continue
Excluding
LME
and
currency,
ATOI
is
expected
to
increase 15%-20% sequentially
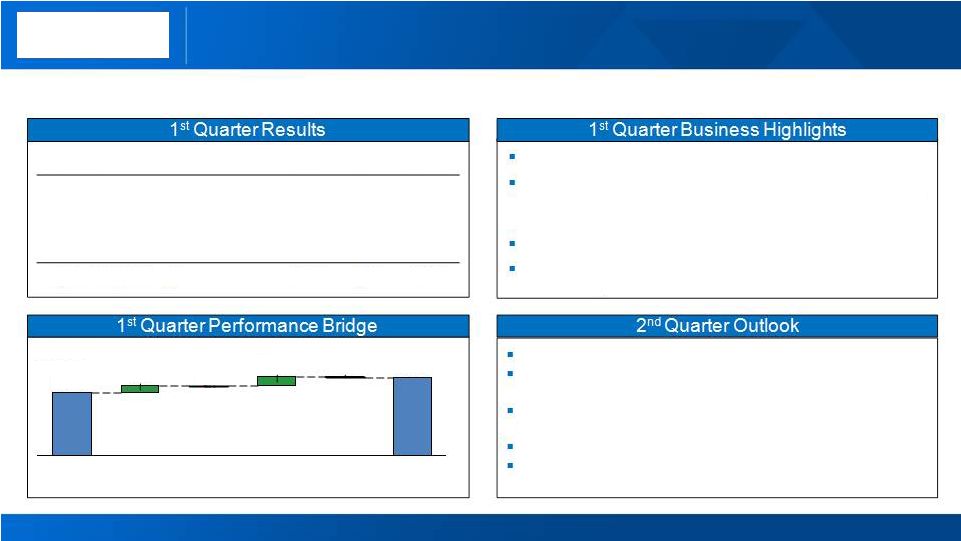
1
st
Quarter Results
1
st
Quarter Business Highlights
2
nd
Quarter Outlook
1
st
Quarter Performance Bridge
$11
$14
$9
$7
$4
$1
$81
$77
1Q13
Cost
Increase
Productivity
Price/Mix
Volume
Currency
LME
4Q12
$ Millions
1Q 12
4Q 12
1Q 13
3
Party Revenue
1,845
1,771
1,779
ATOI*
102
77
81
Adjusted EBITDA/mt*
447
370
385
Aerospace and auto
demand remained strong
Higher volumes
in Packaging and Auto
Price and mix
was impacted by weaker pricing
Productivity
driven by higher utilizations offset
by
costs related to
energy, maintenance, and labor
Days working capital improved ~7 days year-over-year
$ Millions
See appendix for Adjusted EBITDA reconciliation. * Prior period amounts have been revised to
conform to the current period presentation. See appendix for additional information.
rd |
 41% ATOI improvement in the Alumina segment
11
[Alcoa Logo]
Raw
Materials
Energy
Prod-
uctivity
Price
/Mix
Volume
/ Fixed
Cost
Currency
LME
4Q 12
1Q 13
Cost
Increase
$1
$3
$5
$6
$7
$4
$27
$58
$6
$41
+$23m
-$6m
Market
Performance
$ Millions
1Q 12
4Q 12
1Q 13
Production (kmt)
4,153
4,079
3,994
3
Party Shipments (kmt)
2,293
2,440
2,457
3
Party Revenue ($ Millions)
775
803
826
ATOI ($ Millions)
35
41
58
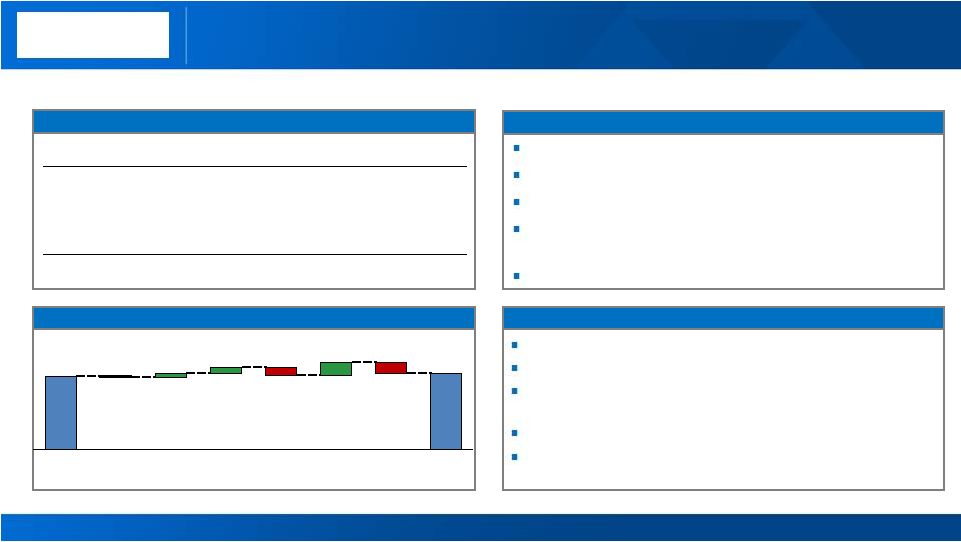
1
Quarter Results
st
1
st
Quarter Business Highlights
2
Quarter Outlook
1
st
Quarter Performance Bridge
1Q13 Actual and 2Q13 Outlook - Alumina
rd
rd
rd
nd
Mining cost increases
of $20m in Australia (Myara
crusher move) and Suriname
Record
days working capital of 23 days; ~9 day
improvement
year-over-year
Production lower
due to 2 fewer days in the quarter
Alumina Price
Index and
spot pricing
continued
positive trend
Productivity improvements
continued
Increased costs driven by the Myara crusher move
Production
increases by 150 kmt
Productivity improvements
to continue
52%
of 3 party shipments on spot or alumina price
index with 30 day lag
for 2013 |
 [Alcoa Logo]
Primary Metals performance overcomes cost headwinds
12
1 Quarter Business Highlights
st
Price/Mix improved as regional premiums rose
and
value-added product mix
strengthened
Productivity improvements
continued
Rockdale outage
neared completion
Achieved record days working capital
of 18.8 days
Ahead of schedule
startup and cost control of Saudi
Arabia JV
minimized equity charge
1 Quarter Results
st
1 Quarter Performance Bridge
st
2 Quarter Outlook
nd
Pricing
to follow 15 day lag
to LME
Production increases by 15 kmt
Power plant outages
with $25m impact in Anglesea
(4-year overhaul) and Warrick
Saudi Arabia
JV
impact to remain flat
Productivity improvements
to continue
rd
rd
rd
$ Millions
market
performance
$39
$15
$17
$11
$275
$8
$13
$19
$316
$17
$41
Price
/Mix &
Vol.
Rockdale/
Anglesea
Cost
Increase
Energy
Portfolio
Actions
Prod-
uctivity
4Q 12
LME
4Q 12
adj.
1Q 13
Tapoco
Sale
Production (kmt)
951
912
891
Party Shipments (kmt)
771
768
705
Party Revenue ($ Millions)
1,944
1,890
1,758
Party Price ($/MT)
2,433
2,325
2,398
ATOI ($ Millions)
10
316
39
3
3
3
-$19m
+$17m
1Q13 Actual and 2Q13 Outlook – Primary Metals
1Q 12
4Q 12
1Q 13 |
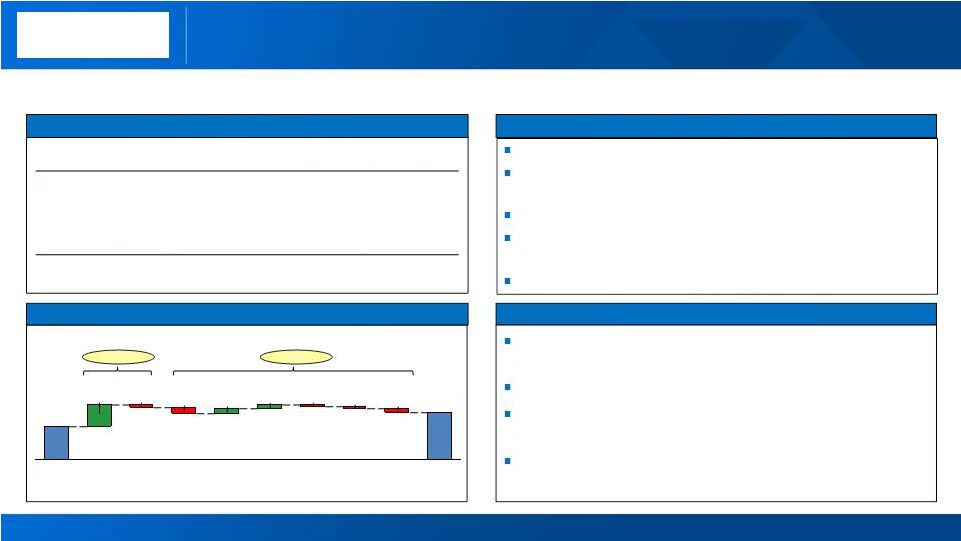
 Continued sustainable days working capital reductions
[Alcoa Logo]
7 days
lower
2 days
lower
14 days
lower
4 days
lower
27 days;
$1.8 B
7 days
lower
Days Working Capital since Fourth Quarter 2008
2 days
lower
14 days
lower
4 days
lower
27 days;
$1.8 B
43
55
50
48
33
41
44
43
30
39
38
38
27
32
33
33
24
28
See appendix for days working capital reconciliation
13 |
 [Alcoa Logo]
See appendix for Free Cash Flow, Net Debt and Net Debt-to-Capital
reconciliations 1 Quarter Cash Flow Overview
14
Net Income
$99
$257
$170
DD&A
$369
$363
$361
Change in Working Capital
($289)
$536
($323)
Pension Contributions
($213)
($46)
($83)
Taxes / Other Adjustments
($202)
($177)
($195)
Cash from Operations
($236)
$933
($70)
Dividends to Shareholders
($33)
($33)
($33)
Change in Debt
$357
($692)
$90
Distributions
to
Noncontrolling
Interests
($26)
($24)
($25)
Contributions
from
Noncontrolling
Interests
$90
$39
$15
Other Financing Activities
$6
($2)
$0
Cash from Financing Activities
$394
($712)
$47
Capital Expenditures
($270)
($398)
($235)
Other Investing Activities
($80)
$605
($50)
Cash from Investing Activities
($350)
$207
($285)
1 Quarter 2013 Cash Flow Overview
st
($ Millions)
1Q12
4Q12
1Q13
2010
2009
2008
1Q13
2012
2011
7,622
8,338
9,816
7,370
6,968
7,432
34.7%
42.5%
38.7%
34.9%
35.3%
34.8%
762
1,481
1,543
1,939
1,861
1,555
9,165
9,819
10,578
8,925
8,829
9,371
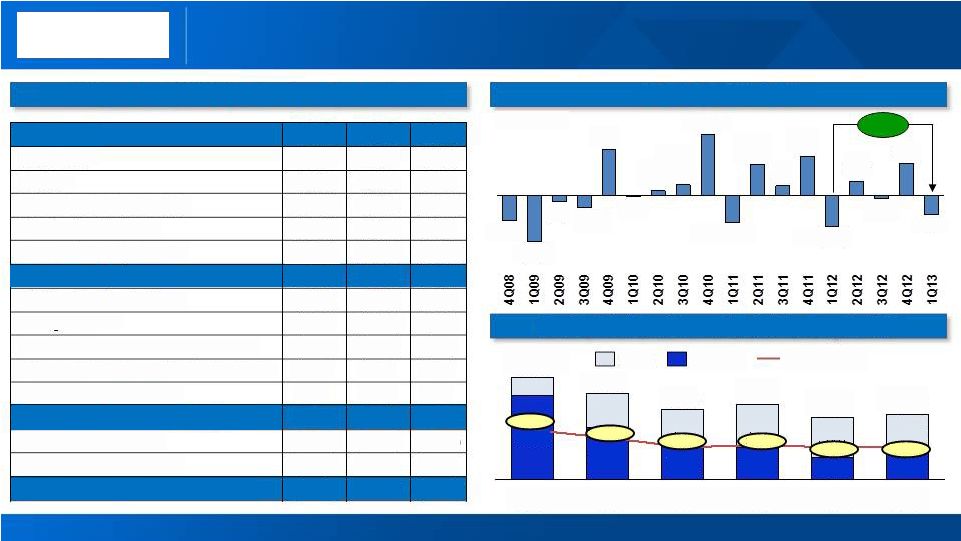
(millions)
Debt to Cap
Net Debt
Cash
(305)
(39)
(506)
(440)
(22)
(186)
(90)
(742)
(409)
535
246
656
164
526
1,005
176
87
761
+201
(millions)
Free Cash Flow
Debt, Net Debt and Debt-to-Capital %
st |
 2013 Targets: Key Actions to Execute 2013 Cash Sustainability
Program Aggressive targets set to maximize
cash in 2013 15
Maintain 30%-35% Debt-to-Capital
Manage Growth Capital of $550M
Generate Productivity Gains of $750M
Target Saudi JV Investment of $350M
Overarching 2013 Financial Target
Taking the right actions
Control Sustaining Capital of $1.0B
Positive
Free Cash
Flow
[Alcoa Logo] |
 16
[Alcoa Logo]
Capital Flows Into Equities from Commodities
2013 Global Aluminum Demand Will Grow at 7%
Supply and Demand Tightening On Curtailments
Inventories Are Stable, Premiums Remain Strong |
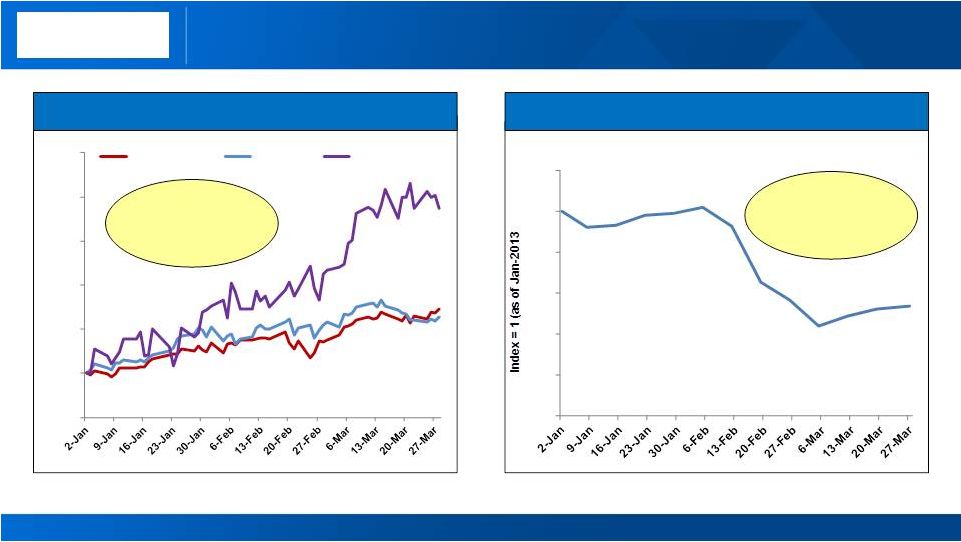 Capital flows into equities and out of commodities
17
Source: Bloomberg, CFTC COT Reports (excl. energy futures)
…attracting capital from commodities
Net Managed Money Positions
($ billion)
Major equity exchanges rally…
95%
100%
105%
110%
115%
120%
125%
S&P 500 Index
FTSE 100
NIKKEI
~50% decline
in 1Q13
~20%
increase in
1Q13
-
0.2
0.4
0.6
0.8
1.0
1.2
[Alcoa Logo] |
 [Alcoa Logo]
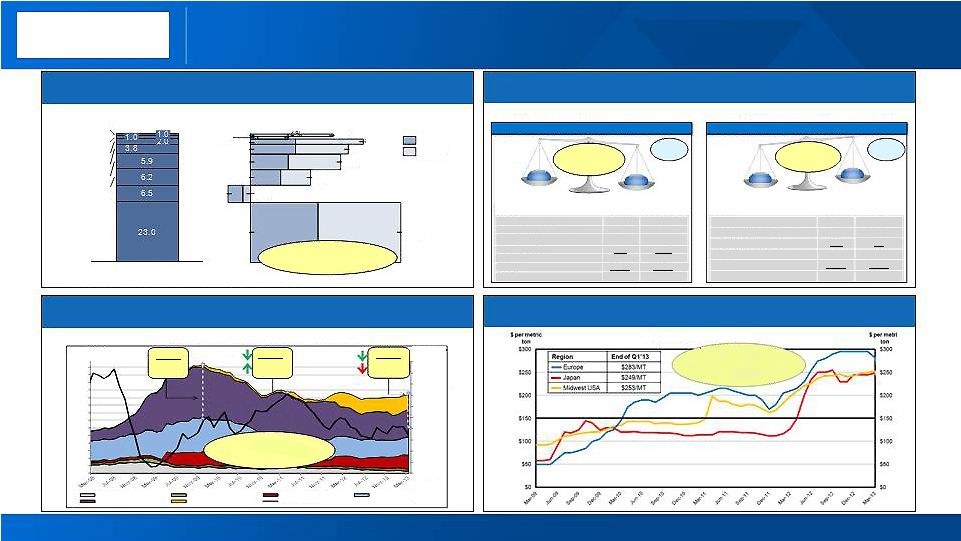
Market fundamentals are stable
18
Market Tightening
On Curtailments
Inventory
is Stable
Regional Premiums Remain Strong
2013 Primary Aluminum Consumption (mmt) and Annualized Growth (%)
Global Inventories vs. LME Price Over Time $
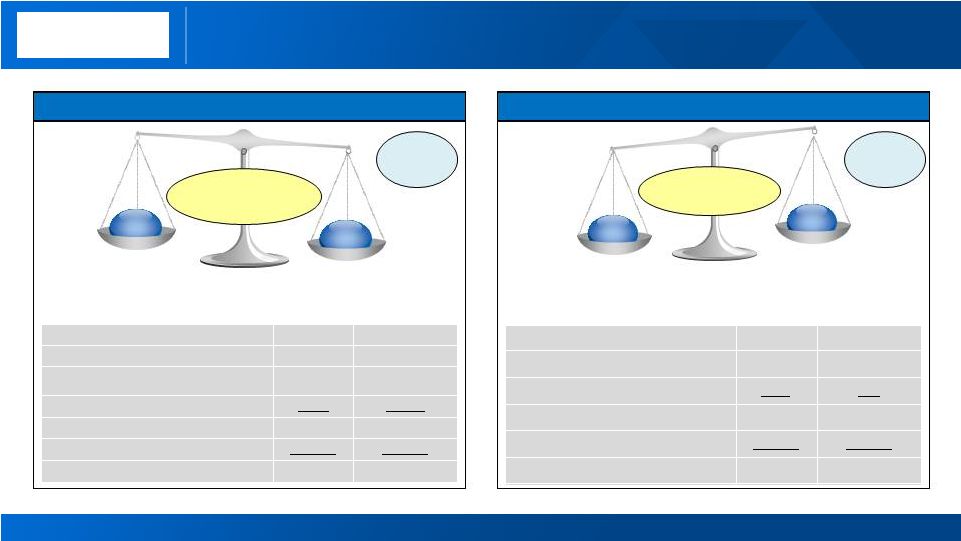
Supply/Demand analysis
See appendix for full scale charts
2013 Global Demand
Growth Rate 7%
(World ex China 4%)
Decline 28 days
Global Inventories
from the ’09 peak
Year on Year Change
Europe +35%
Japan + 96%
Midwest USA +27%
Deficit
(100)
4Q2012
(200)
Deficit
Surplus
155
4Q2012
535
Surplus
2013E Alumina Supply/Demand Balance
2013E Aluminum Supply/Demand Balance
‘000 mt
China
Rest of World
2013 Production
(Feb annualized)
41,600
53,700
2013 Production to be added
600
2,400
2013 Capacity to be curtailed
(1,000)
0
Imports/(exports)
3,900
(3,900)
Total supply
45,100
52,200
Demand
(45,100)
(52,300)
Net Balance
0
(100)
Supply
Demand
Supply
Demand
‘000 mt
China
Rest of World
2013 Production
(Feb annualized)
21,330
25,360
2013 Production to be added
2,270
1,190
2013 Capacity to be curtailed
Total supply
23,075
26,500
Demand
(23,000)
(26,420)
Net Balance
75
80
(525)
(50)
Regional Premiums over time
Global Aluminum Demand Growth at 7%
Producer
Japan Port
China Incl SRB
Off Exchange
LME On Warrant
Cancelled Warrants
LME 3 Mon
1%
8%
6%
5%
9%
11%
-2%
-1%
4%
4%
5%
7%
7%
6%
Asia ex. China
Other
India
Brazil
Russia
China
Europe
North America
2012
2013E
Other includes Middle East, Latin America ex Brazil, Eastern Europe and Rest of
World 49.4 mmt
(1)
(1)
6%
$1,250
$1,450
$1,650
$1,850
$2,050
$2,250
$2,450
$2,650
$2,850
$3,050
$3,250
$ per metric
ton
Days of
Consumption
Days of
Consumption
108 days
LME Price
$2,214/MT
LME Price
$2,686/MT
LME Price
$1,951/MT
Days of
Consumption
83 days
Days of
Consumption
80 days
7
21
28
35
42
49
56
63
70
77
84
91
98
105
14 |
 Klaus Kleinfeld
Chairman and Chief Executive Officer
April 8, 2013
[Alcoa Logo]
[Alcoa Logo] |
 Source: Alcoa analysis
Alcoa End Markets: Current Assessment of 2013 vs. 2012
Growth continues in global end markets
20
[Alcoa Logo]
North America
China
Global
Europe
-
Aerospace
Automotive
Heavy Truck &
Trailer
Beverage Can
Packaging
Commercial Building
and Construction
Industrial Gas
Turbine
9% -
10%
sales growth
2% -
3%
sales growth
4% -
5%
sales growth
3% -
5%
airfoil market
growth rate
1% -
4%
prod growth
2% -
7%
prod growth |
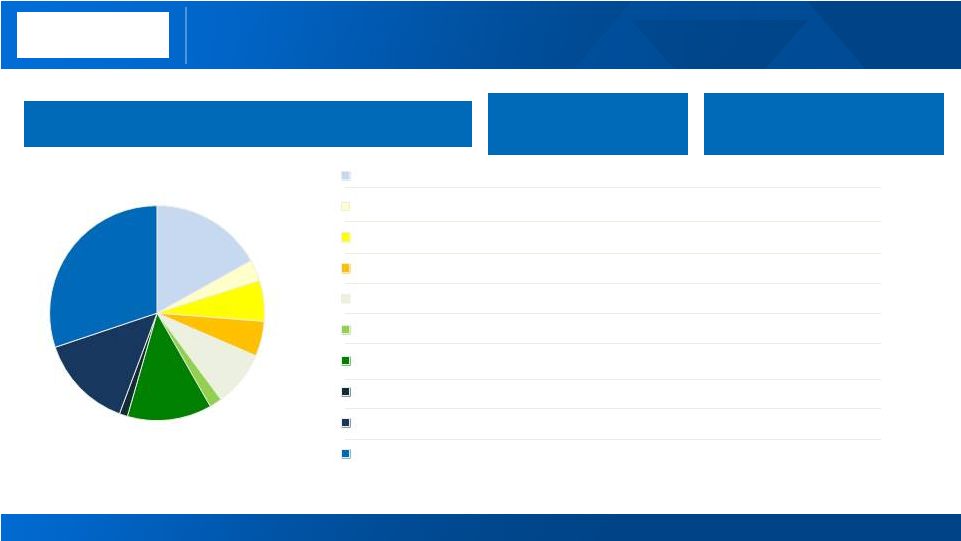
 [Alcoa Logo]
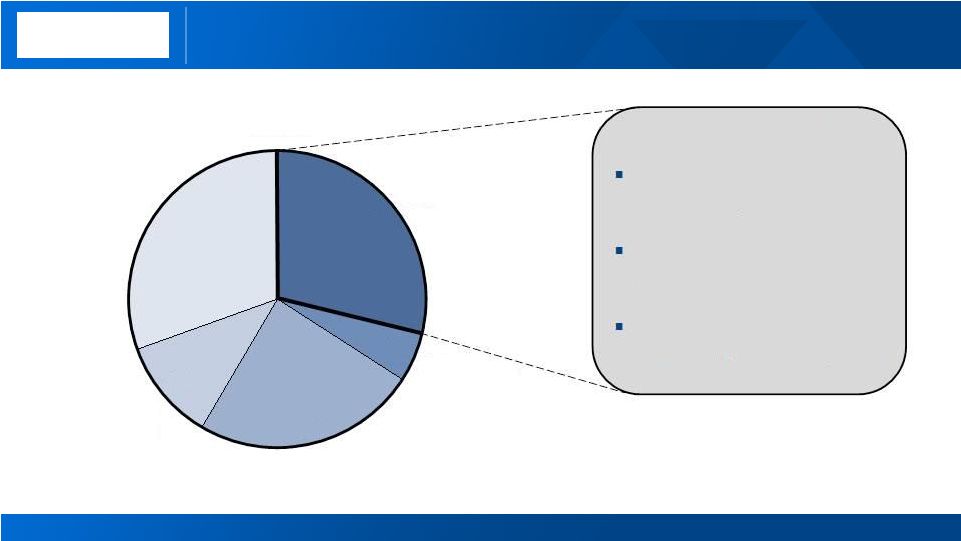
Value add businesses driving 71% of segment profits
Alcoa business mix shift and GRP/EPS margins
21
EPS: Continuing to Grow Profitability
Business mix shifted toward value add
After tax operating income (ATOI) by segment
(% of total segment ATOI)
2003
2012
75%
29%
16%
26%
9%
45%
GPP
GRP
EPS
100%
100%
GRP: Generating Record Margins
10-YR Average ~ $248/MT
385
380
332
69
83
284
292
276
261
1Q’13
2012
2011
2010
2009
2008
2007
2006
2005
2004
2003
Adjusted EBITDA per MT
15%
1Q’13
21%
2012
19%
2011
18%
2010
17%
2009
13%
2008
2007
13%
2006
13%
2005
11%
2004
12%
2003
9%
Adjusted EBITDA
Margin
25%
71%
2.3x 2003 level
1.5x average
184
321
GPP: Combined Alumina and Primary Metals segments, GRP: Global Rolled Products, EPS:
Engineered Products and Solutions. Prior period amounts have been revised to conform to the current period presentation. See appendix for
additional information. |
 [Alcoa Logo]
Aerospace accounts for $3.8B of value add revenue
Breakdown of 2012 Alcoa value-add revenue by market ($B)
22
Other
3.8
Aerospace
0.7
Automotive
3.2
Packaging
1.4
Building and
Construction
4.1
End Market Highlights
$13.2B
11.6%
End
Market
CAGR
(2012 -
2015)
~
(at 2012 rates)
8
year
backlog
of
production
Alcoa
well
positioned
on
both
Aluminum
and
CFRP
planes |
 Sources: The Airline Monitor February 2013
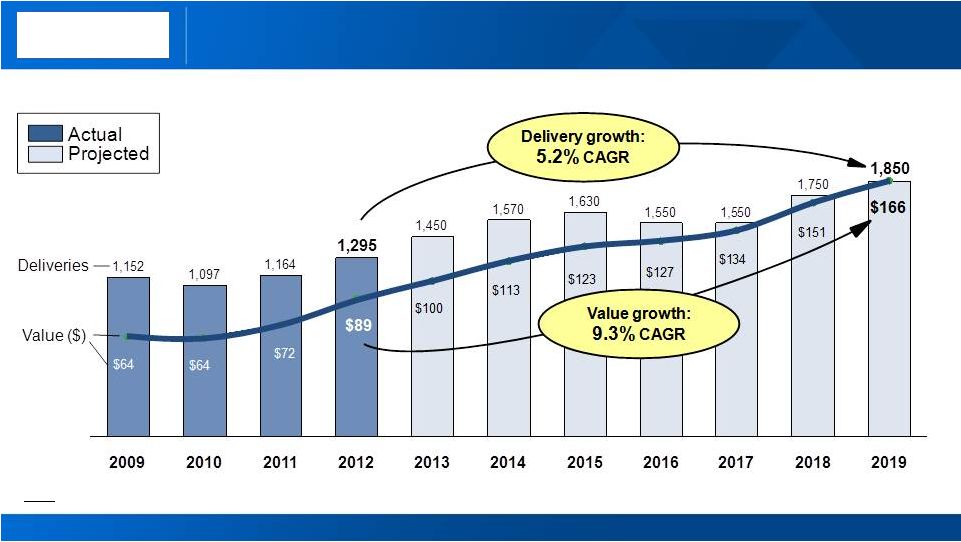
Vibrant growth projected for the aerospace market
23
Aero
market
growth:
Commercial
Jet
Deliveries
1
and
Value
in
$B
Notes: (1) All figures include both Large Commercial Aircraft & Regional
Jets [Alcoa Logo] |
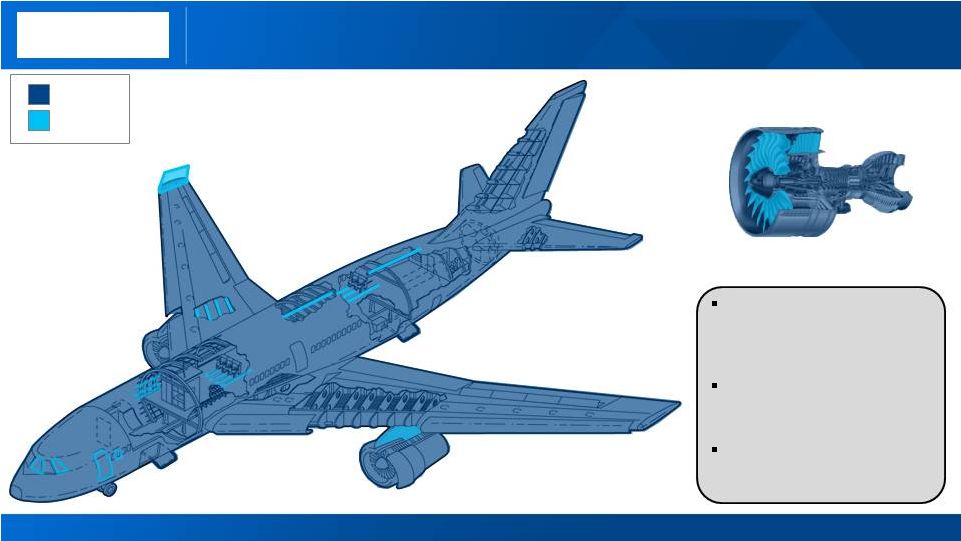 Alcoa Blue Flies From Nose to Tail
Wing ribs (plate
and extrusions)
Wing tips
Hydraulic vessels
Fuel connectors
Torque rods
Seat
frames
Window and
door frames
Wheels, brakes
and torque tubes
Fuselage to
wing
connection
Wing box
fasteners
Engine pylon
structure and
fasteners
Wing spars
(forgings
and plate)
Lower wing skins
Wing flap
fasteners
Wing
stringers
Wing gear ribs,
trunions and support fittings
Upper wing skins
Crown frames
Auxiliary power unit
exhaust ducts
Vertical stabilizer
fasteners
Fuselage
stringers
Fuselage
skins
Seat tracks
Landing gear,
bay frames
Sleeved fasteners
Fan blades
Guide vanes
Hot section
blades and
vanes
Compressor cases
Fuel metering
unit
Fan hub and
compressor
frames
Bearing
housings
Current
Future
More
than
90%
of
all
aluminum aerospace alloys
have been developed by
Alcoa
Every
Western Commercial
aircraft
flying
today
uses
Alcoa
fasteners
Every
Western Commercial
and military aircraft engine
uses Alcoa
castings
24
[Alcoa Logo] |
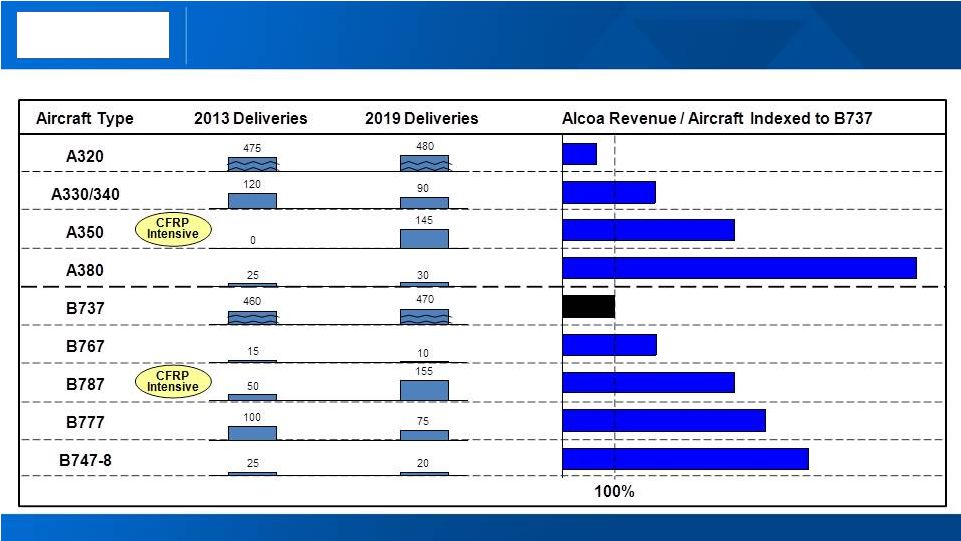 Sources: 1) The Airline Monitor February 2013
Notes: All figures include both Large Commercial Aircraft & Regional
Jets. CFRP refers to carbon fiber reinforced plastic Alcoa is well
positioned on both Aluminum and CFRP planes Commercial jet deliveries and
Alcoa Indexed Revenue by aircraft type 25
[Alcoa Logo] |
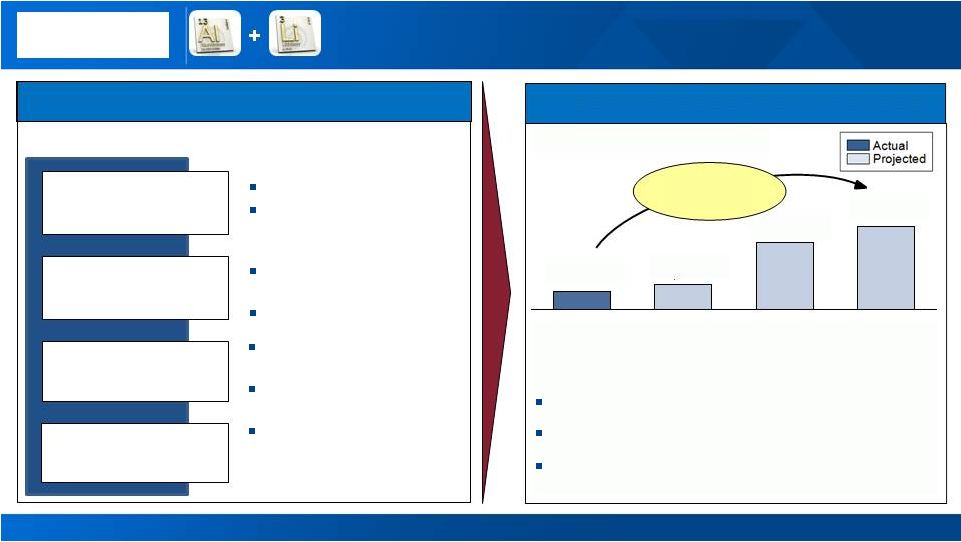 Innovation creating long term value for Alcoa
Aluminum Lithium Meeting Customer Needs
Reduce inspection
Improve comfort
20% fuel efficiency
improvement
Lower capital costs
Customer Needs
Al-Li Value Proposition
Improved corrosion and
fatigue
properties
2X
inspection
intervals
5% to 7% lower density
7% higher stiffness
Capital
costs
avoided
by
using existing Aluminum
infrastructure
Meets 787 humidity and
pressure benchmarks
30%-50% larger windows
26
Key Platforms Drivers:
Twin Aisle: Airbus A380 & A350, Boeing 787
Single Aisle: Bombardier CSeries, Comac
C919
Regional/Business Jet: Gulfstream G650,
Bombardier Global 7000/8000
Projected Al-Li Revenue in $M
Al-Li Revenue quadrupling by 2019
+350%
= 29% CAGR
2019
$197
2017
$161
2015
$61
2013
$43
[Alcoa Logo] |
 [Alcoa Logo]
Automotive accounts for $700M of value add revenue
Breakdown of 2012 Alcoa value-add revenue by market ($B)
27
Building and
Construction
1.4
Packaging
3.2
Automotive
0.7
Aerospace
3.8
Other
4.1
$13.2B
End Market Highlights
2-3% End Market CAGR
(2012
-
2015)
30-35%
CAGR
for NA Auto
Sheet
(
2012
-
2015
)
3.6x
increase
in
Auto
Sheet
revenue
from
2012
to
2015 |
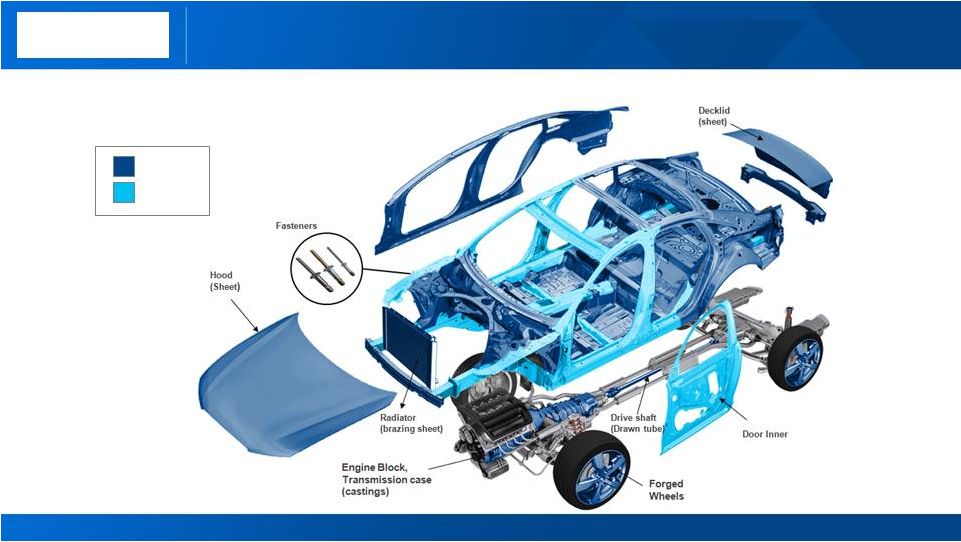 Alcoa’s content runs from bumper to bumper
Alcoa participation in automotive parts
Current
Future
28
[Alcoa Logo] |
 [Alcoa Logo]
Aluminum intensity amplifying automotive market growth
Auto industry growth and projected incremental aluminum content
Sources: Ducker Worldwide , IHS , Alcoa analysis, *)
Extrapolated based on IHS 2020 forecast 29
Growth in Automotive Market…
Global light vehicle production (in millions of units)
19
25
31
19
20
23
15
17
18
China
Europe
North
America
2025*
72
2015
62
2012
53
…amplified by increasing Al intensity
136
55
14
2025
2015
2012
North America Aluminum Body Sheet
Content Per Vehicle (in lbs) |
 [Alcoa Logo]
Consumers and regulations drive auto light-weighting
30
Consumers want it
US Corporate Average
Fuel Economy (MPG)
35.5
2011
27.2
2025
54.5
2016
Regulations demand it
2011
83%
2008
54%
% willing to pay for
better fuel efficiency
Consumers Outpace Regulation
US Consumer Buying vs. Regulation
miles per gallon
2000
29.7
30.8
50
45
40
35
30
25
0
2025
2020
2015
2010
2005
Regulations
Consumer Buying
Safety benefits
Changing body
structure from steel
to aluminum can
reduce stopping
distances
from 45
mph to zero by up to
7 feet –
this can
mean the difference
between a
serious
collision and a
near-miss
NHTSA
1)
says:
Lightweighting
conserves fuel,
maintains footprint,
and may improve
the car’s structural
strength and
handling
1)
National
Highway
Traffic
Safety
Admin.
Source: Ducker Worldwide , Consumer Reports, The Aluminum Association ,
NHTSA 1)
September 17, 2012, Alcoa Analysis |
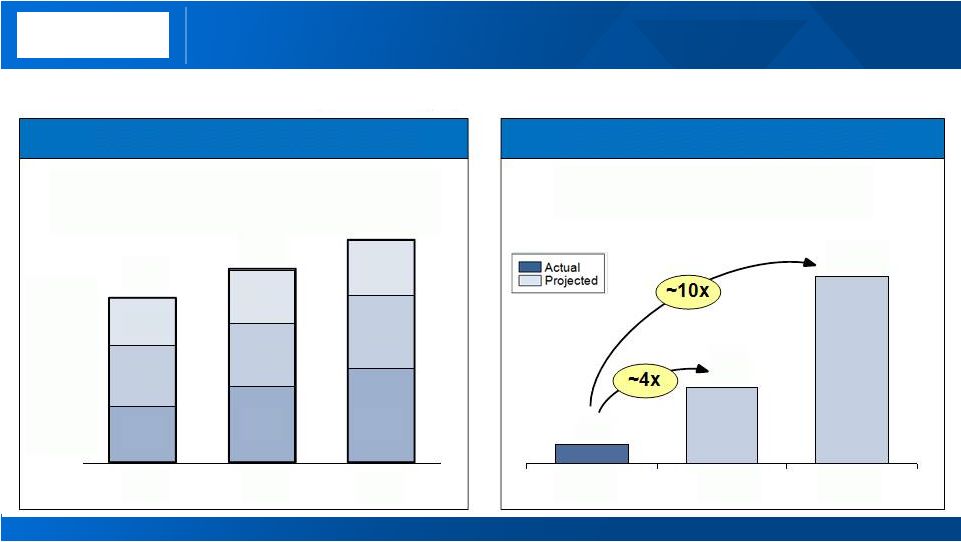
 [Alcoa Logo]
Alcoa is capturing auto sheet opportunity
Source: Ducker Worldwide , IHS , Alcoa analysis
31
$300M expansion
to capture
auto demand
Supported by
secured
contracts
On time and on budget
First coil
by December 2013
Auto Sheet Driving Growth
580
250
200
160
2015
2014
2013
2012
Delivers
~4x
Revenue
Increase
Projected Alcoa Auto Sheet
Revenues ($M)
Auto Treatment Line –
Davenport, IA
North America Market Demand –
Auto Aluminum (kMT)
2025
4,410
3,320
1,090
2015
3,080
2,660
420
2012
2,400
2,300
100
Other Auto Aluminum
(Castings, etc.)
Auto Sheet
4x increase
in
auto sheet already
locked into
designs
of 2015 models
3.6x
Positioned to Capture Demand
Actual
Projected |
 [Alcoa Logo]
We continue to focus on coming down the cost curves
Alumina and Aluminum cost curves and Alcoa targets
32
0
100
200
300
400
500
600
700
0
20,000
40,000
60,000
80,000
100,000
120,000
Cumulative Production
(000MT)
Alcoa 2010
30
Percentile
Alumina Cost Curve
Alcoa 2015
23
Percentile
Refining Cost Curve Holding Steady
$/mt
Alcoa 2012
30
Percentile
Smelting Cost Curve Down 4% Points
0
500
1,000
1,500
2,000
2,500
3,000
3,500
0
20,000
40,000
60,000
Cumulative
Production
(000MT)
Alcoa 2015
41
Percentile
Alcoa 2010
51
Percentile
Aluminum Cost Curve
$/mt
Alcoa 2012
47
Percentile
-10 points
7 points
-
th
th
th
st
st
rd |
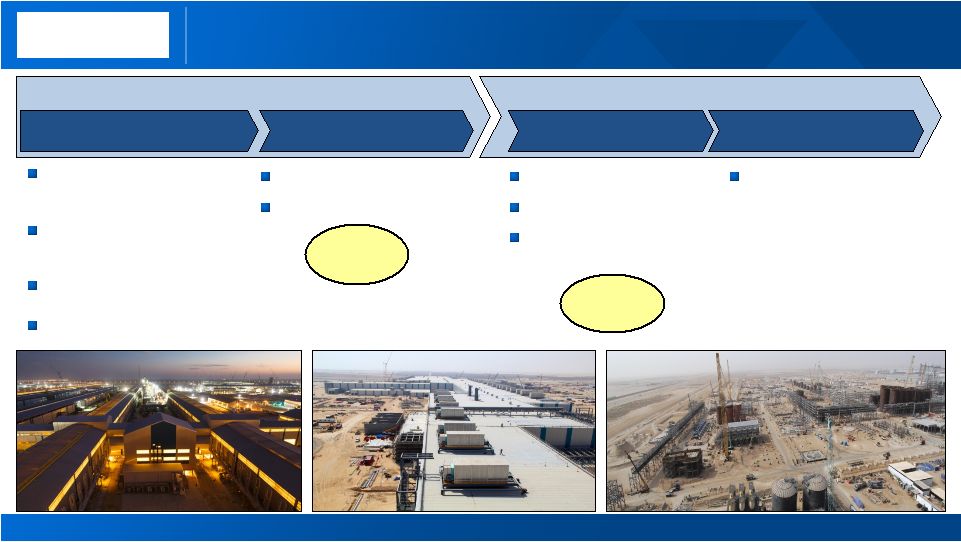 [Alcoa Logo]
Phase 2
Phase 1
Phase 1 and 2 Construction Progressing As Planned
Mine
Refinery
First hot coil 4Q 2013
Auto
hot coil 4Q 2014
First alumina 4Q 2014
Lowest
cost
refinery
2%
point
reduction
on
the refining cost curve
On track to provide
bauxite in 2014
33
Smelter
First Hot Metal December
Full operating capacity in
2014
Lowest
cost
smelting
facility
2%
point
reduction
on
the
smelting cost curve
74%
46%
Rolling Mill
12
, 2012
Complete
Complete
th |
 [Alcoa Logo]
Executing on our targets to deliver long term value
34
All segments achieved solid financial performance
Strong commitment to cash generation
Capturing opportunities in growing markets |
 [Alcoa Logo] |
 [Alcoa Logo]
Kelly Pasterick
Director, Investor Relations
Alcoa
390 Park Avenue
New York, NY 10022-4608
Telephone: (212) 836-2674
www.alcoa.com
Additional Information
36 |
 [Alcoa Logo]
Annual Sensitivity Summary
Currency Annual Net Income Sensitivity
+/-
$100/MT = +/-
$240 million
LME Aluminum Annual Net Income Sensitivity
Australian $
+/-
$11 million
per 0.01 change in USD / AUD
Brazilian $
+/-
$ 3 million
per 0.01 change in BRL / USD
Euro €
+/-
$ 2 million
per 0.01 change in USD / EUR
Canadian $
+/-
$ 5 million
per 0.01 change in CAD / USD
Norwegian Kroner
+/-
$ 5 million
per 0.10 change in NOK / USD
37 |
 [Alcoa Logo]
Revenue Change by Market
4%
3%
0%
9%
7%
2%
(2%)
(39%)
3%
(7%)
6%
0%
(1%)
(11%)
(4%)
17%
(5%)
1%
7%
(10%)
1Q’13 Third-Party Revenue
Sequential
Change
Year-Over-Year
Change
38
17%
3%
6%
5%
9%
2%
13%
1%
14%
30%
Aerospace
Automotive
B&C
Comm. Transport
Industrial Products
IGT
Packaging
Distribution/Other*
Alumina
Primary Metals |
 [Alcoa Logo]
Reconciliation of ATOI to Consolidated Net Income (Loss)
Attributable to Alcoa
39
*
On January 1, 2013, management revised the inventory-costing method used by
certain locations within the Global Rolled Products and Engineered Products
and Solutions segments in order to improve internal consistency and enhance
industry comparability. This revision does not impact the consolidated results of
Alcoa. Segment information for all prior periods presented was revised to
reflect this change. (in millions)
1Q12
2Q12
3Q12
4Q12
2012
1Q13
Total segment ATOI*
$ 304
$ 255
$ 224
$ 574 $ 1,357
$ 351
Unallocated amounts (net of tax):
Impact of LIFO
–
19
(7)
8
20
(2)
Interest expense
(80)
(80)
(81)
(78)
(319)
(75)
Noncontrolling interests
(5)
17
32
(15)
29
(21)
Corporate expense
(64)
(69)
(62)
(87)
(282)
(67)
Restructuring and other charges
(7)
(10)
(2)
(56)
(75)
(5)
Other*
(54)
(134)
(247)
(104)
(539)
(32)
Consolidated net income (loss) attributable to
Alcoa
$ 94
$ (2)
$ (143)
$ 242
$ 191
$ 149 |
 [Alcoa Logo]
Reconciliation of Adjusted Income
40
(in millions, except per-share
amounts)
Income
Diluted EPS
Quarter ended
Quarter ended
March 31,
2012
December 31,
2012
March 31,
2013
March 31,
2012
December 31,
2012
March 31,
2013
Net income attributable to
Alcoa
$ 94
$ 242
$ 149
$ 0.09
$ 0.21
$ 0.13
Restructuring and other
charges
7
54
5
Discrete tax items*
–
(58)
(19)
Other special items**
4
(174)
(14)
Net income attributable to
Alcoa –
as adjusted
$ 105
$ 64
$ 121
0.10
0.06
0.11
* Discrete tax items include the following:
Net income attributable to Alcoa – as adjusted is a non-GAAP financial measure.
Management believes that this measure is meaningful to investors because management reviews the
operating results of Alcoa excluding the impacts of restructuring and other charges, discrete tax
items, and other special items (collectively, “special items”). There can be no assurances
that additional special items will not occur in future periods. To compensate for this
limitation, management believes that it is appropriate to consider both Net income attributable to Alcoa
determined under GAAP as well as Net income attributable to Alcoa – as adjusted.
** Other special items include the following:
for the quarter ended March 31, 2013, a benefit related to the reinstatement under the American
Taxpayer Relief Act of 2012 of two tax provisions that will be applied in 2013 to Alcoa’s
U.S income tax return for calendar year 2012 ($19); and for the quarter ended December 31,
2012, a benefit related to the interim period treatment of losses in jurisdictions for which no tax benefit was recognized during the nine
months ended September 30, 2012 ($39); a benefit for a change in the legal structure of an investment
($13); and a net benefit for other miscellaneous items ($6). for the quarter ended March 31,
2013, a net favorable change in certain mark-to-market energy derivative contracts ($9) and a net insurance recovery related to the March 2012
cast house fire at the Massena, NY location ($5);
for the quarter ended December 31, 2012, a gain on the sale of the Tapoco Hydroelectric Project ($161:
$275 is included in the Primary Metals segment and $(114) is included in Corporate); a net
favorable change in certain mark-to-market energy derivative contracts ($12); interest income on an escrow deposit ($8); and uninsured losses related to
fire damage to the cast house at the Massena, NY location ($7); and
for the quarter ended March 31, 2012, a net unfavorable change in certain mark-to-market
energy derivative contracts. •
•
•
•
• |
 [Alcoa Logo]
Reconciliation of Alcoa Adjusted EBITDA
41
($ in millions)
2003
2004
2005
2006
2007
2008
2009
2010
2011
2012
1Q12
4Q12
1Q13
Net income (loss)
attributable to Alcoa
$ 938
$ 1,310
$ 1,233
$ 2,248
$ 2,564
$ (74)
$ (1,151)
$ 254
$ 611
$ 191
$ 94
$ 242
$ 149
Add:
Net income (loss)
attributable to
noncontrolling
interests
212
233
259
436
365
221
61
138
194
(29)
5
15
21
Cumulative effect of
accounting changes
47
–
2
–
–
–
–
–
–
–
–
–
–
Loss (income) from
discontinued
operations
–
27
50
(22)
250
303
166
8
3
–
–
–
–
Provision (benefit) for
income taxes
367
546
464
853
1,623
342
(574)
148
255
162
39
143
64
Other (income)
expenses, net
(278)
(266)
(478)
(236)
(1,920)
(59)
(161)
5
(87)
(341)
(16)
(345)
(27)
Interest expense
314
271
339
384
401
407
470
494
524
490
123
120
115
Restructuring and other
charges
(28)
(29)
266
507
268
939
237
207
281
87
10
60
7
Provision for
depreciation,
depletion, and
amortization
1,110
1,142
1,227
1,252
1,244
1,234
1,311
1,450
1,479
1,460
369
362
361
Adjusted EBITDA
$ 2,682
$ 3,234
$ 3,362
$ 5,422
$ 4,795
$ 3,313
$ 359
$ 2,704
$ 3,260
$ 2,020
$ 624
$ 597
$ 690
Sales
$18,879
$21,370
$24,149
$28,950
$29,280
$26,901
$18,439
$21,013
$24,951
$23,700
$ 6,006
$ 5,898
$ 5,833
Adjusted EBITDA
Margin
14%
15%
14%
19%
16%
12%
2%
13%
13%
9%
10%
10%
12%
Alcoa’s definition of Adjusted EBITDA (Earnings before interest, taxes,
depreciation, and amortization) is net margin plus an add-back for depreciation, depletion, and amortization. Net margin is equivalent to Sales
minus the following items: Cost of goods sold; Selling, general administrative, and
other expenses; Research and development expenses; and Provision for depreciation, depletion, and amortization. Adjusted EBITDA is
a non-GAAP financial measure. Management believes that this measure is
meaningful to investors because Adjusted EBITDA provides additional information with respect to Alcoa’s operating performance and the
Company’s ability to meet its financial obligations. The Adjusted EBITDA
presented may not be comparable to similarly titled measures of other companies. |
 [Alcoa Logo]
Reconciliation of Alumina Adjusted EBITDA
42
($ in millions, except per
metric ton amounts)
2003
2004
2005
2006
2007
2008
2009
2010
2011
2012
1Q12
4Q12
1Q13
After-tax operating income
(ATOI)
$ 415
$ 632
$ 682
$ 1,050
$ 956
$ 727
$ 112
$ 301
$ 607
$ 90
$ 35
$ 41
$ 58
Add:
Depreciation, depletion,
and amortization
147
153
172
192
267
268
292
406
444
455
114
107
109
Equity (income) loss
–
(1)
–
2
(1)
(7)
(8)
(10)
(25)
(5)
(1)
(1)
(1)
Income taxes
161
240
246
428
340
277
(22)
60
179
(27)
(1)
2
14
Other
(55)
(46)
(8)
(6)
2
(26)
(92)
(5)
(44)
(8)
–
(4)
(3)
Adjusted EBITDA
$ 668
$ 978
$ 1,092
$ 1,666
$ 1,564
$ 1,239
$ 282
$ 752
$ 1,161
$ 505
$ 147
$ 145
$ 177
Production (thousand
metric tons) (kmt)
13,841
14,343
14,598
15,128
15,084
15,256
14,265
15,922
16,486
16,342
4,153
4,079
3,994
Adjusted EBITDA /
Production ($ per metric
ton)
$ 48
$ 68
$ 75
$ 110
$ 104
$ 81
$ 20
$ 47
$ 70
$ 31
$ 35
$ 36
$ 44
Alcoa’s definition of Adjusted EBITDA (Earnings before interest, taxes,
depreciation, and amortization) is net margin plus an add-back for depreciation, depletion, and amortization. Net margin is equivalent to Sales
minus the following items: Cost of goods sold; Selling, general administrative, and
other expenses; Research and development expenses; and Provision for depreciation, depletion, and amortization. The Other line
in the table above includes gains/losses on asset sales and other nonoperating
items. Adjusted EBITDA is a non-GAAP financial measure. Management believes that this measure is meaningful to investors
because Adjusted EBITDA provides additional information with respect to Alcoa’s
operating performance and the Company’s ability to meet its financial obligations. The Adjusted EBITDA presented may not be
comparable to similarly titled measures of other companies.
|
 [Alcoa Logo]
Reconciliation of Primary Metals Adjusted EBITDA
43
($ in millions, except per metric
ton amounts)`
2003
2004
2005
2006
2007
2008
2009
2010
2011
2012
1Q12
4Q12
1Q13
After-tax operating income
(ATOI)
$ 657
$ 808
$ 822
$ 1,760
$ 1,445
$ 931
$ (612)
$ 488
$ 481
$ 309
$ 10
$ 316
$ 39
Add:
Depreciation, depletion,
and amortization
310
326
368
395
410
503
560
571
556
532
135
134
135
Equity (income) loss
(55)
(58)
12
(82)
(57)
(2)
26
(1)
7
27
2
11
9
Income taxes
256
314
307
726
542
172
(365)
96
92
106
(13)
157
1
Other
12
20
(96)
(13)
(27)
(32)
(176)
(7)
2
(422)
–
(423)
(1)
Adjusted EBITDA
$ 1,180
$ 1,410
$ 1,413
$ 2,786
$ 2,313
$ 1,572
$ (567)
$ 1,147
$ 1,138
$ 552
$ 134
$ 195
$ 183
Production (thousand
metric tons) (kmt)
3,508
3,376
3,554
3,552
3,693
4,007
3,564
3,586
3,775
3,742
951
912
891
Adjusted EBITDA /
Production ($ per metric
ton)
$ 336
$ 418
$ 398
$ 784
$ 626
$ 392
$ (159)
$ 320
$ 301
$ 148
$ 141
$ 214
$ 205
Alcoa’s definition of Adjusted EBITDA (Earnings before interest, taxes, depreciation, and
amortization) is net margin plus an add-back for depreciation, depletion, and amortization. Net margin is equivalent
to Sales minus the following items: Cost of goods sold; Selling, general administrative, and other
expenses; Research and development expenses; and Provision for depreciation, depletion, and
amortization. The Other line in the table above includes gains/losses on asset sales and other
nonoperating items. Adjusted EBITDA is a non-GAAP financial measure. Management believes that this
measure is meaningful to investors because Adjusted EBITDA provides additional information with respect
to Alcoa’s operating performance and the Company’s ability to meet its financial obligations. The
Adjusted EBITDA presented may not be comparable to similarly titled measures of other companies.
|
 [Alcoa Logo]
Reconciliation of Global Rolled Products Adjusted EBITDA
44
($ in millions, except
per metric ton
amounts)
2003
2004
2005
2006
2007
2008
2009
2010
2011
2012
1Q12
4Q12
1Q13
After-tax operating
income (ATOI)*
$ 232
$ 290
$ 300
$ 317
$ 151
$ (41)
$
(106)
$ 241
$ 260
$ 346
$ 102
$ 77
$ 81
Add:
Depreciation,
depletion, and
amortization
190
200
220
223
227
216
227
238
237
229
57
58
57
Equity loss
1
1
–
2
–
–
–
–
3
6
1
2
4
Income taxes*
77
97
135
113
77
14
12
103
98
159
51
35
39
Other
(5)
1
1
20
1
6
(2)
1
1
(2)
–
–
(1)
Adjusted EBITDA*
$ 495
$ 589
$ 656
$ 675
$ 456
$ 195
$ 131
$ 583
$ 599
$ 738
$ 211
$ 172
$ 180
Total shipments
(thousand metric
tons) (kmt)
1,893
2,136
2,250
2,376
2,482
2,361
1,888
1,755
1,866
1,943
472
465
468
Adjusted EBITDA
/ Total shipments
($ per metric ton)*
$ 261
$ 276
$ 292
$ 284
$ 184
$ 83
$ 69
$ 332
$ 321
$ 380
$ 447
$ 370
$ 385
Alcoa’s definition of Adjusted EBITDA (Earnings before interest, taxes,
depreciation, and amortization) is net margin plus an add-back for depreciation, depletion, and amortization. Net margin is equivalent to
Sales minus the following items: Cost of goods sold; Selling, general
administrative, and other expenses; Research and development expenses; and Provision for depreciation, depletion, and amortization.
The
Other
line
in
the
table
above
includes
gains/losses
on
asset
sales
and
other
nonoperating
items.
Adjusted
EBITDA
is
a
non-GAAP
financial
measure.
Management
believes
that
this
measure
is
meaningful to investors because Adjusted EBITDA provides additional information with
respect to Alcoa’s operating performance and the Company’s ability to meet its financial obligations. The Adjusted
EBITDA presented may not be comparable to similarly titled measures of other
companies. * On January 1, 2013, management revised the inventory-costing
method used by certain locations within the Global Rolled Products segment in order to improve internal consistency and enhance
industry comparability. This revision does not impact the consolidated results
of Alcoa. Segment information for all prior periods presented was revised to reflect this change. |
 [Alcoa Logo]
Reconciliation of Engineered Products and Solutions
Adjusted EBITDA
45
($ in millions)
2003
2004
2005
2006
2007
2008
2009
2010
2011
2012
1Q12
4Q12
1Q13
After-tax operating
income (ATOI)*
$ 126
$ 161
$ 276
$ 382
$ 423
$ 522
$ 311
$ 419
$ 537
$ 612
$ 157
$ 140
$ 173
Add:
Depreciation,
depletion, and
amortization
166
168
160
152
163
165
177
154
158
158
40
40
40
Equity loss
(income)
–
–
–
6
–
–
(2)
(2)
(1)
–
–
–
–
Income taxes*
57
70
120
164
184
215
138
198
258
296
73
71
84
Other*
11
106
(11)
(2)
(7)
2
1
–
(1)
(8)
–
(9)
–
Adjusted EBITDA*
$ 360
$ 505
$ 545
$ 702
$ 763
$ 904
$ 625
$ 769
$ 951
$ 1,058
$ 270
$ 242
$ 297
Third-party sales
$ 3,905
$ 4,283
$ 4,773
$ 5,428
$ 5,834
$ 6,199
$ 4,689
$ 4,584
$ 5,345
$ 5,525
$ 1,390
$ 1,348
$ 1,423
Adjusted EBITDA
Margin*
9%
12%
11%
13%
13%
15%
13%
17%
18%
19%
19%
18%
21%
* On January 1, 2013, management revised the inventory-costing method used
by certain locations within the Engineered Products and Solutions segment in order to improve internal consistency and enhance
industry comparability. This revision does not impact the consolidated results
of Alcoa. Segment information for all prior periods presented was revised to reflect this change.
Alcoa’s definition of Adjusted EBITDA (Earnings before interest, taxes, depreciation, and
amortization) is net margin plus an add-back for depreciation, depletion, and amortization. Net margin is equivalent
to Sales minus the following items: Cost of goods sold; Selling, general administrative, and other
expenses; Research and development expenses; and Provision for depreciation, depletion, and amortization.
The Other line in the table above includes gains/losses on asset sales and other nonoperating
items. Adjusted EBITDA is a non-GAAP financial measure. Management believes that this measure is
meaningful to investors because Adjusted EBITDA provides additional information with respect to
Alcoa’s operating performance and the Company’s ability to meet its financial obligations. The Adjusted
EBITDA presented may not be comparable to similarly titled measures of other companies.
|
 [Alcoa Logo]
Reconciliation of Free Cash Flow
46
(in millions)
Quarter ended
March 31,
2011
June 30,
2011
September 30,
2011
December 31,
2011
March 31,
2012
June 30,
2012
September 30,
2012
December 31,
2012
March 31,
2013
Cash from
operations
$ (236)
$ 798
$ 489
$ 1,142
$ (236)
$ 537
$ 263
$ 933
$ (70)
Capital
expenditures
(204)
(272)
(325)
(486)
(270)
(291)
(302)
(398)
(235)
Free cash flow
$ (440)
$ 526
$ 164
$ 656
$ (506)
$ 246
$ (39)
$ 535
$ (305)
Free Cash Flow is a non-GAAP financial measure. Management believes that
this measure is meaningful to investors because management reviews cash flows generated from operations after taking
into consideration capital expenditures due to the fact that these expenditures are
considered necessary to maintain and expand Alcoa’s asset base and are expected to generate future cash flows from
operations. It is important to note that Free Cash Flow does not represent the
residual cash flow available for discretionary expenditures since other non-discretionary expenditures, such as mandatory
debt service requirements, are not deducted from the measure.
|
 [Alcoa Logo]
Reconciliation of Free Cash Flow, con’t
47
(in millions)
Quarter ended
December 31,
2008
March 31,
2009
June 30,
2009
September 30,
2009
December 31,
2009
March 31,
2010
June 30,
2010
September 30,
2010
December 31,
2010
Cash from
operations
$ 608
$ (271)
$ 328
$ 184
$ 1,124
$ 199
$ 300
$ 392
$ 1,370
Capital
expenditures
(1,017)
(471)
(418)
(370)
(363)
(221)
(213)
(216)
(365)
Free cash flow
$ (409)
$ (742)
$ (90)
$ (186)
$ 761
$ (22)
$ 87
$ 176
$ 1,005
Free Cash Flow is a non-GAAP financial measure. Management believes that
this measure is meaningful to investors because management reviews cash flows generated from operations after taking into
consideration
capital
expenditures
due
to
the
fact
that
these
expenditures
are
considered
necessary
to
maintain
and
expand
Alcoa’s
asset
base
and
are
expected
to
generate
future
cash
flows
from
operations.
It is important to note that Free Cash Flow does not represent the residual cash
flow available for discretionary expenditures since other non-discretionary expenditures, such as mandatory debt service
requirements, are not deducted from the measure. |
 [Alcoa Logo]
Days Working Capital
($ in millions)
Quarter ended
March 31,
2012
June 30,
2012
September 30,
2012
December 31,
2012
March 31,
2013
Receivables from customers, less
allowances
$ 1,526
$ 1,575
$ 1,619
$ 1,399
$ 1,680
Add: Deferred purchase price receivable
*
254
141
81
18
14
Receivables from customers, less
allowances, as adjusted
1,780
1,716
1,700
1,417
1,694
Add: Inventories
3,097
3,051
2,973
2,825
2,982
Less: Accounts payable, trade
2,734
2,633
2,590
2,702
2,860
Working Capital
$ 2,143
$ 2,134
$ 2,083
$ 1,540
$ 1,816
Sales
$ 6,006
$ 5,963
$ 5,833
$ 5,898
$ 5,833
Days Working Capital
32
33
33
24
28
Days Working Capital = Working Capital divided by (Sales/number of days in the quarter).
*
The deferred purchase price receivable relates to an arrangement to sell certain customer receivables
to a financial institution on a recurring basis. Alcoa is adding back this receivable for
the purposes of the Days Working Capital calculation. 48
|
 [Alcoa Logo]
Reconciliation of Net Debt
49
(in millions)
December 31,
March 31,
2008
2009
2010
2011
2012
2013
Short-term borrowings
$ 478
$ 176
$ 92
$ 62
$ 53
$ 51
Commercial paper
1,535
–
–
224
–
104
Long-term debt due within one year
56
669
231
445
465
1,025
Long-term debt, less amount due
within one year
8,509
8,974
8,842
8,640
8,311
7,745
Total debt
10,578
9,819
9,165
9,371
8,829
8,925
Less: Cash and cash equivalents
762
1,481
1,543
1,939
1,861
1,555
Net debt
$ 9,816
$ 8,338
$ 7,622
$ 7,432
$ 6,968
$ 7,370
Net debt is a non-GAAP financial measure. Management believes that this
measure is meaningful to investors because management assesses Alcoa’s leverage position after
factoring in available cash that could be used to repay outstanding debt.
|
 [Alcoa Logo]
Reconciliation of Net Debt-to-Capital
50
($ in millions)
December 31, 2012
March 31, 2013
Debt-to-Capital
Cash and Cash
Equivalents
Net Debt-to-
Capital
Debt-to-Capital
Cash and Cash
Equivalents
Net Debt-to-
Capital
Total Debt
Short-term borrowings
$ 53
$
51
Commercial paper
–
104
Long-term debt due within one
year
465
1,025
Long-term debt, less amount
due within one year
8,311
7,745
Numerator
$ 8,829
$ 1,861
$ 6,968
$ 8,925
$ 1,555
$ 7,370
Total Capital
Total debt
$ 8,829
$ 8,925
Total equity
16,523
16,774
Denominator
$ 25,352
$ 1,861
$ 23,491
$ 25,699
$ 1,555
$ 24,144
Ratio
34.8%
29.7%
34.7%
30.5%
Net debt-to-capital is a non-GAAP financial measure. Management believes that this
measure is meaningful to investors because management assesses Alcoa’s leverage position
after factoring in available cash that could be used to repay outstanding debt.
|
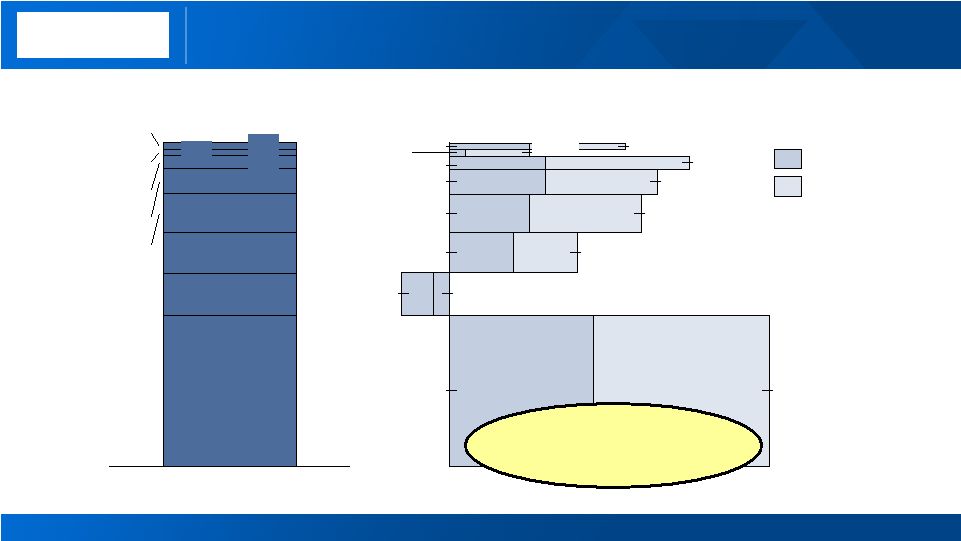
 [Alcoa Logo]
Composition of Upstream Production Costs
51
Refining Cost Structure
Smelting Cost Structure
1
Natural gas information corresponds to Point Comfort, as Australia is priced on a
rolling 16 quarter average Input Cost
Inventory flow
Pricing
convention
Annual ATOI
Sensitivity
Fuel oil
1 –
2 months
Prior month
$4m per $1/bbl
Natural gas
N/A
Spot
1
$16m per $1/GJ
1
Caustic soda
3 -
6 months
Spot & semi-
annual
$9m per
$10/DMT
Input Cost
Inventory flow
Pricing convention
Annual ATOI
Sensitivity
Coke
1 -
2 months
Spot, quarterly &
semi-annual
$9m per
$10/MT
Pitch
1 -
2 months
Spot, quarterly &
semi-annual
$2.5m per
$10/MT
Alumina
32%
Carbon
15%
Power
25%
Materials
6%
Conversion
22%
Fuel Oil
14%
Natural gas
10%
Caustic
11%
Bauxite
23%
Conversion
42% |
 [Alcoa Logo]
Global Aluminum Demand Growth at 7%
52
2013 Primary Aluminum Consumption (mmt), Annualized Growth (%) and Change (% pts) by
Region (1)
Other includes Middle East, Latin America ex Brazil, Eastern Europe and Rest of
World 4.0%
5%
6%
-1%
-2%
11%
9%
5%
4%
7%
4%
6%
7%
6%
8%
1%
3.8
2.0
1.0
1.0
China
Europe
North America
Asia ex. China
Other
(1)
India
Brazil
Russia
23.0
6.5
6.2
5.9
2013 Global Demand
49.4 mmt
2013 versus 2012
Source: Alcoa analysis
2013 Global Demand
Growth Rate 7%
(World ex China 4%)
2012
2013E |
 53
2013E Aluminum Supply/Demand Balance
Supply
Demand
Surplus
155
‘000 mt
China
Rest of World
2013 Production (Feb annualized)
21,330
25,360
2013 Production to be added
2,270
1,190
2013 Capacity to be curtailed
(525)
(50)
Total supply
23,075
26,500
Demand
(23,000)
(26,420)
Net Balance
75
80
2013E Alumina Supply/Demand Balance
‘000 mt
China
Rest of World
2013 Production (Feb annualized)
41,600
53,700
2013 Production to be added
600
2,400
2013 Capacity to be curtailed
(1,000)
0
Imports/(exports)
3,900
(3,900)
Total supply
45,100
52,200
Demand
(45,100)
(52,300)
Net Balance
0
(100)
Supply
Demand
Deficit
(100)
Source: Alcoa analysis, Brook Hunt, CRU, CNIA, NBS, Chinese Customs
Market Tightening
On Curtailments
4Q2012
Deficit
(200)
4Q2012
Surplus
535
[Alcoa Logo] |
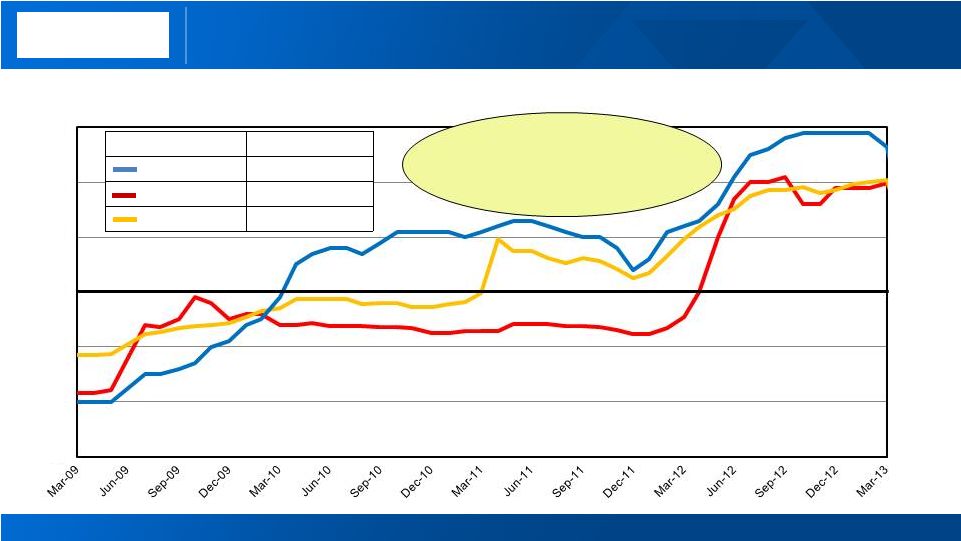
 54
Global Inventories vs. LME Price Over Time $
Source: Alcoa analysis, LME, SHFE, CRU, IAI, Marubeni Corp.
Inventory
is Stable
[Alcoa Logo] |
 [Alcoa Logo]
Regional Premiums
Remain strong
55
Regional Premiums over time
$ per metric
ton
$ per metric
ton
Region
End of Q1’13
Europe
$283/MT
Japan
$249/MT
Midwest USA
$253/MT
Year on Year Change
Europe +35%
Japan +96%
Midwest USA +27%
Source:
Month
end
pricing
-
Platts
Metals
Week
and
Metal
Bulletin
$0
$50
$100
$150
$200
$250
$300
$0
$50
$100
$150
$200
$250
$300 |