Attached files
| file | filename |
|---|---|
| 8-K - FORM 8-K - EveryWare Global, Inc. | v340102_8k.htm |
Exhibit 99.1

April 2, 2013 Investor Presentation Business Combination with ROI Acquisition Corp. STRICTLY CONFIDENTIAL

1 Forward Looking Statements This presentation includes "forward looking statements" within the meaning of the "safe harbor" provisions of the United States Private Securities Litigation Reform Act of 1995 . Forward - looking statements may be identified by the use of words such as "anticipate", "believe", "expect", "estimate", "plan", "outlook", “target”, and "project" and other similar expressions that predict or indicate future events or trends or that are not statements of historical matters . Such forward looking statements with respect to revenues, earnings, performance, strategies, prospects and other aspects of the businesses of ROI Acquisition Corp . (“ROI”), EveryWare Global, Inc . (“EveryWare”) and the combined company after completion of the proposed business combination, are based on current expectations that are subject to risks and uncertainties . A number of factors could cause actual results or outcomes to differ materially from those indicated by such forward looking statements . These factors include, but are not limited to : ( 1 ) the occurrence of any event, change or other circumstances that could give rise to the termination of the Business Combination Agreement and Plan of Merger for the business combination (the "Business Combination Agreement") ; ( 2 ) the outcome of any legal proceedings that may be instituted against ROI, EveryWare or others following announcement of the Business Combination Agreement and transactions contemplated therein ; ( 3 ) the inability to complete the transactions contemplated by the Business Combination Agreement due to the failure to obtain approval of the stockholders of the ROI or other conditions to closing in the Business Combination Agreement ; ( 4 ) the risk that the proposed transaction disrupts current plans and operations as a result of the announcement and consummation of the transactions described herein ; ( 5 ) the ability of EveryWare to meet its financial and strategic goals, due to, among other things, competition, the ability of the combined company to grow and manage growth profitably, maintain relationships with suppliers and obtain adequate supply of products and retain its key employees ; ( 6 ) costs related to the proposed business combination ; ( 7 ) changes in applicable laws or regulations ; ( 8 ) the possibility that EveryWare may be adversely affected by other economic, business, and/or competitive factors ; and ( 9 ) other risks and uncertainties indicated from time to time in the proxy statement, including those under “Risk Factors” therein, and other filings with the Securities and Exchange Commission (“SEC”) by ROI . You are cautioned not to place undue reliance upon any forward - looking statements, which speak only as of the date made, and ROI and EveryWare undertake no obligation to update or revise the forward - looking statements, whether as a result of new information, future events or otherwise . Financial Presentation This presentation includes non - GAAP financial measures, including EBITDA, Adjusted EBITDA, Adjusted EBITDA margin and Adjusted Free Cash Flow . EBITDA is calculated as earnings before interest and taxes (“EBIT”) plus depreciation and amortization (“EBITDA”) . Adjusted EBITDA is calculated as EBITDA plus restructuring expenses, certain historical acquisition/merger - related transaction fees, inventory writedown , management fees and reimbursed expenses paid to our equity sponsor, certain other adjustments that management believes are not representative of its core operating performance, adjustments for the full - year impact of certain cost improvements implemented within the fiscal year, the cost in 2012 related to out - of - the - money natural gas hedges and the estimated increased expenses of operating as a public company . A reconciliation of EBIT to Adjusted EBITDA is set forth on page 31 . Adjusted EBITDA margin is defined as Adjusted EBITDA divided by net sales . Adjusted Free Cash Flow is defined as Adjusted EBITDA less maintenance capital expenditures . Wherever referenced, unless otherwise noted, 2011 results include financial results for the two months ended December 31 , 2011 for Oneida and 12 months ended December 31 , 2011 for Anchor . Furthermore, certain financial information in this presentation gives effect to the proposed business combination with ROI, including TEV, 2013 Estimated EPS, 2013 Estimated Adjusted EPS and 2013 E P/E/Growth . TEV represents total enterprise value, which is calculated as equity value plus debt outstanding minus cash . For purposes of calculating TEV, we have assumed that $ 107 . 5 million in cash consideration is paid to existing EveryWare shareholders, existing ROI shareholders do not redeem any shares, and $ 227 million in net debt is funded at closing . 2013 Estimated EPS is estimated earnings per share, calculated in accordance with GAAP, but with earnings adjusted to add back management fees and reimbursed expenses to EveryWare shareholders, and further adjusted to give pro forma effect to the items noted in the description of Adjusted EBITDA above . The shares contemplated in EveryWare’s EPS do not include earnout shares and only include shares that are vested upon the closing of the contemplated transaction . 2013 Estimated Adjusted EPS is calculated as 2013 Estimated EPS plus deferred tax components, such as temporary book - to - tax variances and the impact of existing NOLs, thereby reflecting a cash tax view of EPS . 2013 E P/E/Growth is calculated as 2013 E P/E (price divided by EPS, with an assumed transaction price for post - merger EveryWare of $ 10 . 00 per share) divided by EPS growth from 2013 E to 2014 E . Additional financial information and further detail to the metrics described above can be found in ROI’s preliminary proxy statement that was filed with the SEC on March 13 , 2013 . STRICTLY CONFIDENTIAL

2 Financial Presentation (continued) EveryWare believes that these non - GAAP measures of financial results provide useful information to management and investors regarding certain financial and business trends relating to EveryWare’s financial condition and results of operations . EveryWare’s management uses these non - GAAP measures to compare EveryWare’s performance to that of prior periods for trend analyses, for purposes of determining management incentive compensation, and for budgeting and planning purposes . These measures are used in monthly financial reports prepared for management and EveryWare’s board of directors . EveryWare believes that the use of these non - GAAP financial measures provides an additional tool for investors to use in evaluating ongoing operating results and trends and in comparing EveryWare’s financial measures with other consumer products companies, many of which present similar non - GAAP financial measures to investors . Management of EveryWare does not consider these non - GAAP measures in isolation or as an alternative to financial measures determined in accordance with GAAP . The principal limitation of these non - GAAP financial measures is that they exclude significant expenses and income that are required by GAAP to be recorded in EveryWare’s financial statements . In addition, they are subject to inherent limitations as they reflect the exercise of judgments by management about which expenses and income are excluded or included in determining these non - GAAP financial measures . In order to compensate for these limitations, management presents non - GAAP financial measures in connection with GAAP results . You should review EveryWare’s audited financial statements, as presented in ROI’s proxy statement (a preliminary version of which was filed with the SEC on March 13 , 2013 ), and not rely on any single financial measure to evaluate EveryWare’s business . Additional Information In connection with the proposed business combination between EveryWare and ROI, ROI filed with the SEC a preliminary proxy statement and will mail a definitive proxy statement and other relevant documents to ROI stockholders . This presentation does not contain all the information that should be considered concerning the business combination . It is not intended to form the basis of any investment decision or any other decision in respect of the proposed business combination . ROI stockholders and other interested persons are advised to read the preliminary proxy statement and any amendments thereto, and the definitive proxy statement in connection with ROI’s solicitation of proxies for the special meeting to be held to approve the transactions contemplated by the proposed business combination because these materials will contain important information about EveryWare, ROI and the proposed transactions . The definitive proxy statement will be mailed to ROI stockholders of record as of April 15 , 2013 . Stockholders will also be able to obtain a copy of the preliminary proxy statement and definitive proxy statement once they are available, without charge, at the SEC’s website at http : //www . sec . gov, or by directing a request to ROI Acquisition Corp . , 601 Lexington Avenue, 51 st Floor, New York, New York 10022 , tel . ( 212 ) 825 - 0400 , Attention : Joseph A . De Perio . This presentation shall not constitute a solicitation of a proxy, consent or authorization with respect to any securities or in respect of the proposed business combination . Participants in the Solicitation ROI and its directors and officers may be deemed participants in the solicitation of proxies to ROI’s stockholders with respect to the transaction . A list of the names of those directors and officers and a description of their interests in ROI is contained in ROI’s preliminary proxy statement, which was filed with the SEC on March 13 , 2013 , and will also be contained in the definitive proxy statement for the proposed business combination when available . STRICTLY CONFIDENTIAL
Executive Summary STRICTLY CONFIDENTIAL

4 STRICTLY CONFIDENTIAL John Sheppard – Chief Executive Officer of EveryWare – Joined EveryWare in April 2012 – Served as President and CEO of Cott Corporation, the world’s largest private label soft drink manufacturer – While at Cott , increased organic growth, increased market share and penetrated international markets – Over 25 years of successful executive leadership experience with international consumer goods companies, including Coca - Cola, wh ere he held such roles as President, Coca - Cola European Division and Vice President Coca - Cola International The EveryWare Team Bernard Peters – Chief Financial Officer of EveryWare – Joined EveryWare in January 2013 – Served as CFO of Heartland Automotive Services, the largest Jiffy Lube franchisee operating more than 500 stores nationwide – While at Heartland, Mr. Peters was key in increasing top - line and EBITDA significantly through organic growth and acquisitions. Mr. Peters also led the successful sale process of Heartland to a private equity firm – Possesses significant international and consumer goods experience with private and publicly held companies Tom Baldwin – Chairman and Chief Executive Officer of ROI Acquisition Corp. – Managing Director, Clinton Group; current director of Bravo Brio Restaurant Group (NASDAQ:BBRG), Firebirds and Benihana , Inc. – Served as Chairman and CEO of Morton’s Restaurant Group (NYSE: MRT) – Will become Vice Chairman of EveryWare upon the closing of the Transaction Dan Collin – Partner and Chairman of EveryWare – Co - founded Monomoy Capital Partners in 2005 and has served as a partner and member of the investment committee of Monomoy since 2005 – Served as an investment professional at KPS Special Situations Fund from 2001 to 2005 and investment banker in the Mergers & Acq uisitions group at JPMorgan Chase & Co from 1999 to 2001 – Currently serves on the board of directors of the following Monomoy investments: EveryWare (Chairman), Gearbox Group, MPI Pr odu cts LLC (Chairman), HTPG, Compass Automotive and Kurz - Kasch, Inc.

5 STRICTLY CONFIDENTIAL Introduction □ Strong revenue and earnings growth □ Strong free cash flow generation □ Demonstrated track record of success □ Strong consumer brand recognition □ Category, channel and market leadership □ Global presence and reach □ Committed management team □ Clear vision □ Considerable “white space” growth opportunities □ Compelling valuation Strong revenue, EBITDA and earnings growth Minimal incremental capital investment required Demonstrated results with scalable cost structure Global footprint, iconic branded products #1 / #2 market leadership across retail & foodservice markets Leading manufacturing, sourcing and distribution platform Dedicated, talented and experienced management team Identified and achievable growth objectives Opportunity to significantly expand international business Attractive valuation, priced at a discount to peers ROI Target Company Objectives EveryWare Global, Inc. ROI Acquisition Corp. – ROI Acquisition Corp. (“ROI”) is a special purpose acquisition company sponsored by a fund managed by Clinton Group – $75 million equity capital, cash in trust – ROI executive team has significant experience leading a growth orientated consumer public company as CEO and CFO – Clinton Group, a multi - strategy investment firm, has a long history investing in public equities
The EveryWare Story STRICTLY CONFIDENTIAL

7 EveryWare: A Significant Growth Opportunity Iconic, globally - recognized brand names #1 or #2 market leadership across consumer and institutional markets Longstanding, loyal blue - chip customer relationships Broad distribution infrastructure Owned asset base with high replacement cost Large, addressable industry with positive tailwinds Vision To b ecome the leading global marketer of trusted brands in dining and food preparation , recognized for providing quality tabletop and kitchen solutions BUFFALO STRICTLY CONFIDENTIAL Consistent recurring revenue model Strong net sales and EBITDA growth Strong free cash flow generation Significant growth and margin expansion opportunities expected to require low incremental investment Exceptionally efficient capital utilization Unique Business Model Strong Fundamentals

Consumer 39% Foodservice 32% Specialty 22% International 7% Dinnerware / Serveware 20% Pantry 19% Flatware 16% Food Prep 16% Décor 4% Spirits 4% Industrial 3% 2012 Sales Mix (1) 8 EveryWare at a Glance Leading Consumer Product Company STRICTLY CONFIDENTIAL – Leading, brand - focused, diversified, global marketer and wholesaler of tabletop and food preparation products for the consumer and foodservice markets – Led by the iconic Oneida and Anchor Hocking brands – Broadest tabletop platform in the industry • Uniquely positioned, full tabletop solution • Products span all price points and categories – World’s largest marketer of flatware for the consumer and foodservice industries – #1 or #2 market share position in key categories within the consumer retail and institutional foodservice markets – Leading designer, manufacturer and marketer of glass products across retail, foodservice and specialty channels – Highly recurring revenue model driven by replacement purchases (Oneida – 70%, Anchor – 90%) – 25+ year relationships with loyal blue - chip customers – Highly diversified customer base • Largest customer, Wal - Mart, represents 14% of 2012 sales • No other customer accounts for more than 4% of sales – Global footprint with broad manufacturing and distribution infrastructure – $50bn global housewares and $2.7bn global foodservice tabletop markets – FY2011A – FY2013E Revenue CAGR of 25.2% and Adj. EBITDA CAGR of 30.5% (1) Presented as Gross Sales Less Returns. By Channel By Category Select Longstanding Blue - Chip Customer Base Beverageware 18%

9 Leading Product Innovation

$30 $49 $53 $0 $20 $40 $60 $80 2011A 2012A 2013E 12.3% 13.0% 13.4% 0% 6% 12% 18% 2011A 2012A 2013E $36 $55 $61 $0 $20 $40 $60 $80 2011A 2012A 2013E $291 $422 $457 $0 $150 $300 $450 $600 2011A 2012A 2013E 10 Historical and Projected Financial Performance Net Sales ($mm) Adjusted EBITDA (2) ($mm) Adjusted Free Cash Flow (3) ($mm) Adjusted EBITDA (2) Margin (%) STRICTLY CONFIDENTIAL (1) 2011 results include 12 months of Anchor and 2 months of Oneida. (2) See “Adjusted EBITDA Reconciliation” on page 31. (3) Assumes FY2013E Furnace Maintenance CapEx of $3.5 million. (1) (1) (1) (1)

Investment Highlights STRICTLY CONFIDENTIAL

12 Investment Highlights Renowned Brand Names with a Diversified Brand Strategy 1 Leading Market Positions Across a Broad Range of Categories 2 Longstanding, High - Quality and Diverse Customer Relationships 3 Significant Domestic and International Growth Opportunities 4 Broad Manufacturing and Distribution Infrastructure 5 Recurring Revenue Model and Owned Asset Base with High Replacement Cost 6 Large, Addressable Industry with Positive Tailwinds and Dynamics 7 Experienced Team with Developed Financial Goals 8 STRICTLY CONFIDENTIAL

Renowned Brand Names with a Diversified Brand Strategy 1 2003 Most Recent 13 HFN Tabletop Brand Recognition (1 ) Dinnerware / Serveware Flatware Banquetware Representative Brands (3 ) Glassware (1) Per Home Furnishing News (“HFN”) survey based on brand recognition and sampling female consumers in the U.S. (2) #1 in glassware. (3) Stölzle and Schönwold brands are licensed by EveryWare. BUFFALO – Tabletop purchasing decisions by both consumers and institutions are highly influenced by brand reputation • Oneida’s brand reputation uniquely extends throughout the general household category and is globally recognized by both consumer and institutional customers • Anchor has established a highly - recognized brand name that is synonymous with quality, value and durability, backed by a 100+ year history – Diversified owned - brand strategy provides EveryWare with product offerings at virtually all price points – Branding strategy tailored to market and geography based on consumer views and trends • Strategic approach to new product development driven by identifying market voids and strategically evaluating margin opportun iti es • Since 2011, EveryWare has commercially launched an average of 150 products and 600 SKUs per year #1 Oneida #2 Corelle #3 Lenox #4 Waterford #5 Pfaltzgraff #6 Mikasa #7 Farberware #8 Anchor Hocking (2 ) #9 Wedgwood #10 Libbey #1 Oneida #2 Waterford #3 Lenox #4 Pfaltzgraff #5 Wedgwood #6 Corelle #7 Mikasa #8 Anchor Hocking (2 ) #9 Fiesta Ware #10 Noritake STRICTLY CONFIDENTIAL

14 (1) Based on Management’s estimates. STRICTLY CONFIDENTIAL – World’s largest marketer of flatware and dinnerware for the consumer and foodservice industries • 27% and 30% consumer flatware and foodservice flatware market share (1) , respectively • #1 provider of flatware to both the consumer and foodservice sectors • Largest supplier of dinnerware to the foodservice industry in North America • Consistently ranked as the #1 tabletop brand according to the Home Furnishings News (“HFN”) survey – Broad portfolio of over 5,700 products includes: • Flatware, dinnerware, crystal stemware, bakeware and cookware – Serves a global customer base directly or through licensed partners, primarily under the Oneida brand name – History extends more than 100 years – Leading designer, manufacturer and marketer of quality glass products across retail, foodservice and specialty markets channels • Most recognized glassware brand name in the U.S. • #1 or #2 market position in all its core glassware categories • #1 supplier of candle containers and premium spirit bottles • #2 in glass bakeware, drinkware and floral vases • #3 glassware supplier to the foodservice industry • Top five tabletop glassware producer worldwide – Broad portfolio of over 3,600 products includes: • Beverageware , stemware, bakeware, serveware , food storage, candle containers, floral vases and specialty products – Presently serves a primarily North American customer base – History extends more than 100 years Renowned Brand Names with a Diversified Brand Strategy 1

Leading Market Positions Across a Broad Range of Categories 15 2 – Uniquely targets the consumer and foodservice tabletop markets with a comprehensive offering across all sub - categories • Portfolio of 9,000+ products is the broadest and most diverse tabletop platform in the industry • Few multi - channel players across entirety of the broader tabletop sector – Leading market positions in core categories with high brand awareness • #1 or #2 market position in seven of the major categories in which Anchor competes • #1 position in retail and foodservice flatware and foodservice dinnerware and crystal – Migration of foodservice and mass retailers to full - line suppliers to consolidate vendor structures and optimize category manag ement • EveryWare’s leading brand equity provides a competitive advantage in key areas such as space allocation and promotions (1) Based on Management’s estimates. (2) #1 in Consumer glass dinnerware. STRICTLY CONFIDENTIAL Bakeware Beverageware Dinnerware Flatware Serveware Crystal Candles Premium Spirit Bottles Industrial / Lighting Floral Consumer Food - service Consumer Food - service Consumer Food - service Consumer Food - service Consumer Food - service Existing Channel Market Positions (1) ݱ ݱ ݱ ݱ ݱ ݱ ݱ ݱ ݱ ݱ ݱ ݱ ݱ ݱ ݱ #2 #2 #3 #1 (2) #1 #1 #1 #1 #1 #1 #1 #1 ݱ ݱ ݱ ݱ ݱ ݱ ݱ ݱ ݱ ݱ ݱ ݱ ݱ ݱ ݱ ݱ ݱ ݱ ݱ ݱ ݱ ݱ Others Pasabahce TTU Waterford Gibson Steelite Homer Fortessa Lenox Cambridge Lifetime Hampton Walco Schott - Zwisesel Bormioli Arkansas Glass The Glass Group
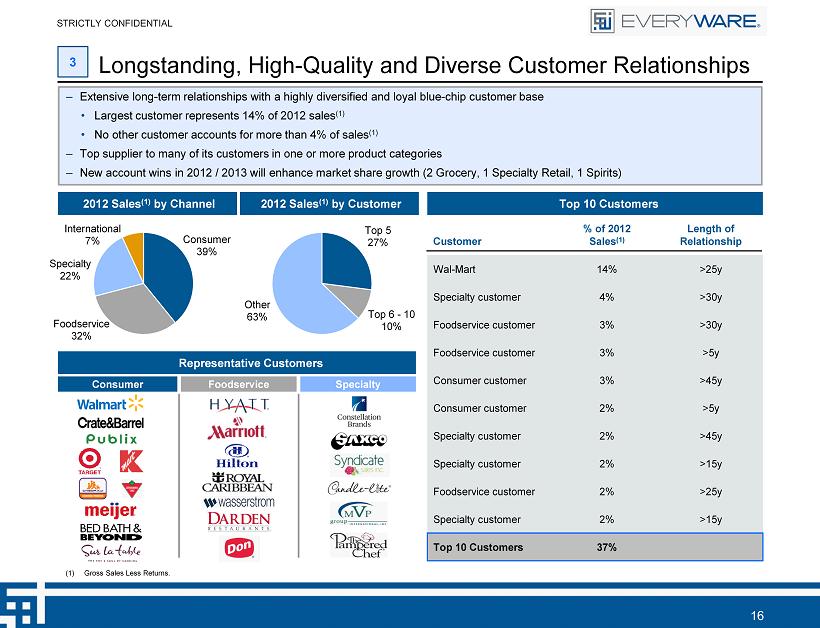
Top 5 27% Top 6 - 10 10% Other 63% Consumer 39% Foodservice 32% Specialty 22% International 7% Customer % of 2012 Sales (1) Length of Relationship Wal - Mart 14% >25y Specialty customer 4% >30y Foodservice customer 3% >30y Foodservice customer 3% >5y Consumer customer 3% >45y Consumer customer 2% >5y Specialty customer 2% >45y Specialty customer 2% >15y Foodservice customer 2% >25y Specialty customer 2% >15y Top 10 Customers 37% 16 Longstanding, High - Quality and Diverse Customer Relationships Top 10 Customers 2012 Sales (1) by Channel 2012 Sales (1) by Customer Representative Customers Consumer Foodservice Specialty 3 (1) Gross Sales Less Returns. STRICTLY CONFIDENTIAL – Extensive long - term relationships with a highly diversified and loyal blue - chip customer base • Largest customer represents 14% of 2012 sales (1) • No other customer accounts for more than 4% of sales (1) – Top supplier to many of its customers in one or more product categories – New account wins in 2012 / 2013 will enhance market share growth (2 Grocery, 1 Specialty Retail, 1 Spirits)

17 Foodservice / B2B OEM and Direct Sell Foodservice One of the most experienced foodservice sales teams in the industry Established OEM contracts and direct selling customers – Multiple go - to market strategies including owned brands, a direct - to - consumer website and catalog business, licensing arrangemen ts, and distribution agreements – Enhanced direct relationship with consumer through branding, trend - right colors / designs, unique product features and customize d product strategy by channel and category – Diverse and flexible strategy promotes tailored approach to the marketplace and optimized resource allocation Consumer / Retail Licensing Consumer Direct Online Retail Strong, long - standing retailer relationships for the combined platform High growth direct - to - consumer online platform benefits from combined portfolio High margin licensing business easily expandable to adjacent product categories and diverse markets www.AnchorHocking.com www.Oneida.com www.Viners.co.uk STRICTLY CONFIDENTIAL Longstanding, High - Quality and Diverse Customer Relationships 3

18 Significant Domestic and International Growth Opportunities 4 Segment Market Indicators Target Rev. CAGR Existing / New Growth Opportunities – Housing recovery – GDP growth – Consumer confidence 8% - 10% – Strong expected international GDP growth in Korea, Mexico and Brazil – Rebound in Europe – Growth of U.S. brands in foreign markets 15% - 20+% – Key manufacturing partners with leading OEMs – Leverage unique manufacturing capabilities and distribution advantages – Identify future niche markets, similar to Specialty Liquor – Top 5 specialty customers averaged 22% growth – Generated a 28% CAGR from key products since 2009 – Optimize existing infrastructure in UK, Mexico and China – Brand stratification and store re - branding – Recent penetration of Korea market – JV and distribution partners in key new markets – Leverage brand portfolio and product development – Continued emerging market penetration STRICTLY CONFIDENTIAL Consumer (39% of ‘12 Net Sales) Foodservice (32% of ‘12 Net Sales) Specialty (22% of ‘12 Net Sales) International (7% of ‘12 Net Sales) – Housing recovery – GDP growth – Consumer confidence – New product development – Brand stratification – Expansion to club, grocery, department store, specialty channels – Direct (e - commerce) – Continuous product innovation – Top 7 consumer accounts averaged 10% growth in 2012 – Restaurant SSS growth and square footage growth – Increasing hotel RevPAR – Convention industry recovery – Total tabletop solution – Logistics savings – Limited overlap between legacy Oneida and Anchor in foodservice – Category expansion – WKI, Buffet, Euro, Strata – Logistics savings – Sales to the top 4 customers grew 14% in 2012 5% - 8% 3% - 5%
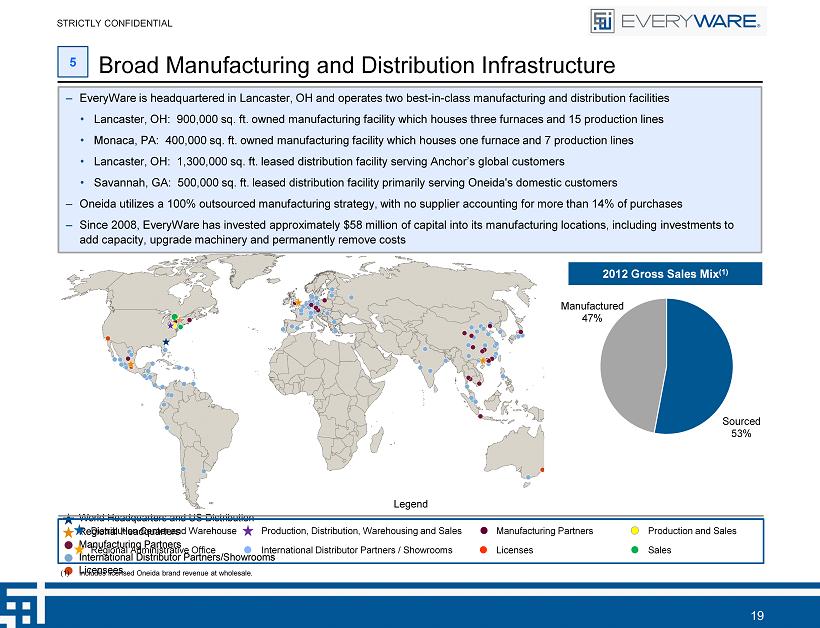
Sourced 53% Manufactured 47% Oneida’s Global Presence Manufacturing Partners Manufacturing Partners International Distributor Partners/Showrooms International Distributor Partners/Showrooms Licensees Licensees Regional Headquarters Regional Headquarters World Headquarters and US Distribution World Headquarters and US Distribution 19 Legend Sales Distribution Center and Warehouse Regional Administrative Office Manufacturing Partners International Distributor Partners / Showrooms Licenses Production and Sales Production, Distribution, Warehousing and Sales – EveryWare is headquartered in Lancaster, OH and operates two best - in - class manufacturing and distribution facilities • Lancaster, OH: 900,000 sq. ft. owned manufacturing facility which houses three furnaces and 15 production lines • Monaca, PA: 400,000 sq. ft. owned manufacturing facility which houses one furnace and 7 production lines • Lancaster, OH: 1,300,000 sq. ft. leased distribution facility serving Anchor’s global customers • Savannah, GA: 500,000 sq. ft. leased distribution facility primarily serving Oneida's domestic customers – Oneida utilizes a 100% outsourced manufacturing strategy, with no supplier accounting for more than 14% of purchases – Since 2008, EveryWare has invested approximately $58 million of capital into its manufacturing locations, including investments to add capacity, upgrade machinery and permanently remove costs 2012 Gross Sales Mix (1) (1) Includes licensed Oneida brand revenue at wholesale. STRICTLY CONFIDENTIAL Broad Manufacturing and Distribution Infrastructure 5

20 Recurring Revenue Model and Owned Asset Base with High Replacement Cost High Switching Costs Drive Highly Recurring Revenues – High switching costs associated with purchasing new tabletop collections drives recurring revenue model • Oneida: 70% replenishment business and 30% new installations • Anchor: 90% replenishment business and 10% new installations – Long - term investments based on well - recognized, iconic brands and confidence in replacement product availability – Consistency of models increases customer stickiness Limited Competition From Low Cost Glassware Imports – Minimal threat from international manufacturers given high shipping costs of glassware • Heavy weight of glass • Need for protective packaging, occupying a significant portion of total package volume • Higher breakage rates Owned Asset Base with High Replacement Cost – It would require over $250 million of invested capital to replicate EveryWare’s capabilities • Since 1983, no new tabletop glass production facilities have been opened in North America • There are no known plans underway for the construction of new glass facilities – Since 2008, EveryWare has invested approximately $58 million of capital into its manufacturing locations, including investments to add capacity, upgrade machinery and permanently remove costs • Minimal incremental capital investment required (Maintenance CapEx of ~1.5% of net sales) – EveryWare can (i) triple its foodservice glass revenue and (ii) accommodate over $200 million of incremental sourced business without significant expansion capital expenditures 6 STRICTLY CONFIDENTIAL

0 250 500 750 1,000 1,250 1,500 Feb-03 Aug-03 Feb-04 Aug-04 Feb-05 Aug-05 Feb-06 Aug-06 Feb-07 Aug-07 Feb-08 Aug-08 Feb-09 Aug-09 Feb-10 Aug-10 Feb-11 Aug-11 Feb-12 Aug-12 8.6% 7.7% 6.1% 1.5% (17.1%) 5.9% 8.2% 6.3% (20%) (15%) (10%) (5%) 0% 5% 10% 2005 2006 2007 2008 2009 2010 2011 2012 250 300 350 400 450 Jan-11 Mar-11 May-11 Jul-11 Sep-11 Nov-11 Jan-12 Mar-12 May-12 Jul-12 Sep-12 Nov-12 Jan-13 21 Large, Addressable Industry with Positive Tailwinds and Dynamics U.S. Single - Family New Home Sales (000s) (2) U.S. Consumer Confidence Index (1) Lodging RevPAR (% change) (3) Restaurant Industry Same Store Sales (4) 0 20 40 60 80 100 120 Feb-03 Aug-03 Feb-04 Aug-04 Feb-05 Aug-05 Feb-06 Aug-06 Feb-07 Aug-07 Feb-08 Aug-08 Feb-09 Aug-09 Feb-10 Aug-10 Feb-11 Aug-11 Feb-12 Aug-12 Feb-13 Jan - 13 3.6% 3.1% 1.6% (1.7%) (4.4%) 1.6% 3.1% 2.9% (5%) (3%) 0% 3% 5% 2005 2006 2007 2008 2009 2010 2011 2012E (1) Source: The Conference Board. Data represents U.S. Consumer Confidence Index (1985 = 100) on a monthly basis as of February 26 , 2013. (2) Source: U.S. Census Bureau. Data represents new single - family houses sold (in thousands) in the United States on a monthly bas is as of February 26, 2013. Note: Seasonally adjusted for annual rate. (3) Source: Wall Street research. (4) Source: Wall Street research. Data represents average same store sales growth for a representative sample of public casual and fine dining restaurants. STRICTLY CONFIDENTIAL 7 – EveryWare participates in the large $50 billion global housewares and $2.7 billion global foodservice tabletop markets, of wh ich the U.S. represents $12.2 billion (tabletop and food preparation) and $990 million (restaurant and beyond restaurant), respective ly – The U.S. tabletop, food preparation, restaurant, and beyond restaurant markets in which EveryWare competes represent $4.9 bil lio n, $7.3 billion, $580 million, and $410 million markets, respectively

22 Experienced Team with Developed Financial Goals 8 STRICTLY CONFIDENTIAL Name Title Industry Experience Prior Experience Dan Collin Chairman 12 KPS Special Situations Fund, Gearbox Group (current), MPI Products LLC (current), HTPG (current), Compass Automotive (current), Kurz - Kasch, Inc. (current) Tom Baldwin Vice Chairman 30+ Morton’s Restaurant Group, Bravo Brio Restaurant Group (current), Firebirds (current), Benihana , Inc. (current) John Sheppard Chief Executive Officer 22 Cott , Coca - Cola Bernard Peters EVP and Chief Financial Officer 14 Heartland Automotive Services, Pampered Chef, Marriott, Coca - Cola Bert Filice SVP North America Sales 25 Trudeau N.A., Coopers & Lybrand Jaci Volles Chief Marketing Officer 28 Lifetime Brands, May Department Stores Colin Walker SVP International 12 Cott , DHR International, Deloitte, Imasco , Canada Trust Dan Taylor SVP Operations 21 World Kitchen, Corning Kerri Love SVP, General Counsel and Secretary 16 Greif , VIA NET.WORKS
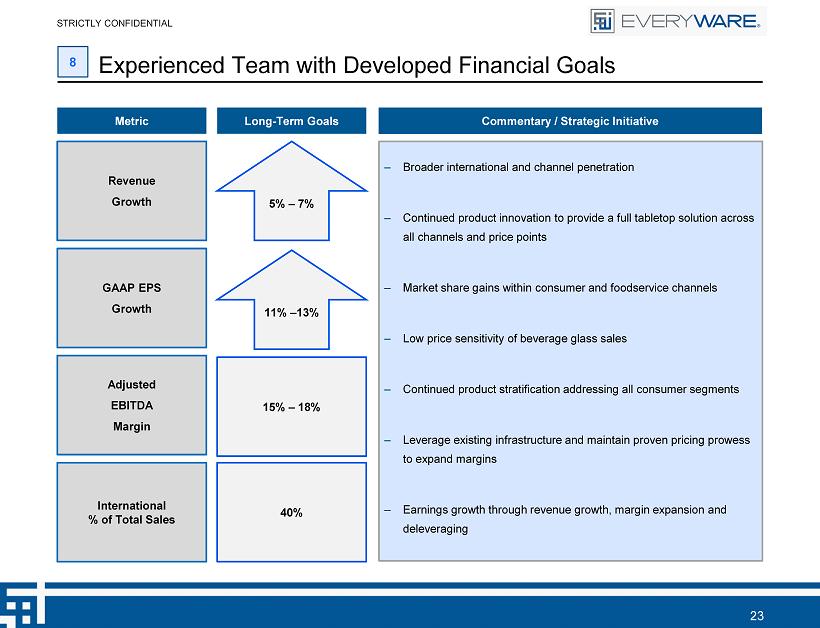
23 Metric Long - Term Goals Revenue Growth GAAP EPS Growth Adjusted EBITDA Margin 5% – 7% 15 % – 18 % 11% – 13 % Commentary / Strategic Initiative – Broader international and channel penetration – Continued product innovation to provide a full tabletop solution across all channels and price points – Market share gains within consumer and foodservice channels – Low price sensitivity of beverage glass sales – Continued product stratification addressing all consumer segments – Leverage existing infrastructure and maintain proven pricing prowess to expand margins – Earnings growth through revenue growth, margin expansion and deleveraging STRICTLY CONFIDENTIAL Experienced Team with Developed Financial Goals 8 International % of Total Sales 40%

Transaction Overview STRICTLY CONFIDENTIAL

25 Transaction Overview Summary – EveryWare’s common stock is expected to trade publicly (NASDAQ: EVRY) upon a combination with ROI Acquisition Corp. – Approximate total enterprise value of $ 420 million and equity value of $193 million – Approximate pro forma net debt of $ 227 million (3.9x 2012 Pro Forma Adjusted EBITDA (1) ) – Attractive valuation, priced at a 22% and 25% discount to median peer TEV / 2013 EBITDA and Price / 2013 Earnings valuation, respectively – $107.5 million of cash – 10.44 million shares of ROI common stock – 1 million earnout shares vesting at $11.00 per share – 1.25 million earnout shares vesting at $12.50 per share – 1.25 million earnout shares vesting at $15.00 per share – Existing EveryWare shareholders, including the current management and funds managed by Monomoy are retaining $104.4 million in common equity, representing approximately 54% of outstanding shares (2) – Monomoy has the right to nominate a majority of the board post - closing, consistent with its majority ownership – Preliminary proxy statement filed with the SEC on March 13, 2013 – Expected closing in the second quarter of 2013 Consideration to Existing EveryWare Shareholders Commitment of Public Shareholders Timing (1) As captured under the existing credit agreement. (2) Does not include earnout shares subject to forfeiture. STRICTLY CONFIDENTIAL

26 Transaction Terms Total Enterprise Valuation Pro Forma Ownership (1) Assumes a $15.00 share price. Assumes treasury method calculation for fully - diluted share equivalents based on a strike price per warrant of $12.00. (2) Assumes a $15.00 share price, which results in release of all sponsor founder’s shares and earnout shares. Valuation Multiples Capitalization Note: Figures in millions. STRICTLY CONFIDENTIAL Pro Forma Shares Outstanding 19.3 Share Price $10.00 Pro Forma Equity Value $192.7 Pro Forma Net Debt 227.3 Implied Fully Distributed TEV $420.0 54.2% 39.0% 6.9% Current Owners Public ROI Founders 2013E 2013E TEV / Adjusted EBITDA 6.9x 2013E P/E - GAAP 10.3x 2013E P/E - Adjusted 7.9x P/E / Growth 0.5x Public Sponsor Earnout Shares Warrants (1) Warrants (1) Shares (2) Total Current Owners 10.4 3.5 13.9 Public 7.5 1.5 9.0 ROI Founders 1.3 0.8 0.6 2.7 Total 19.3 1.5 0.8 4.1 25.7

27 Attractive Valuation Source: Capital IQ, Bloomberg, Company filings, Wall Street research and FactSet . Note: See list of comparable companies on page 30. (1) Multiple reflects 2013 Estimated Adjusted EPS . 2013E Revenue Growth ’11 – ’13E Adjusted EBITDA CAGR 2013E P/E / Growth TEV / LTM Adjusted EBITDA TEV / 2013E Adjusted EBITDA Price / 2013E EPS STRICTLY CONFIDENTIAL 6.9x 8.8x 4.0x 5.0x 6.0x 7.0x 8.0x 9.0x EveryWare Comps 10.3x 13.8x 6.0x 7.0x 8.0x 9.0x 10.0x 11.0x 12.0x 13.0x 14.0x 15.0x EveryWare Comps 7.9x (1) 7.7x 9.9x 5.0x 6.0x 7.0x 8.0x 9.0x 10.0x EveryWare Comps 8.3% 5.5% 0% 2% 4% 6% 8% 10% EveryWare Comps 30.5% 10.0% 0% 5% 10% 15% 20% 25% 30% 35% EveryWare Comps 0.5x 1.1x 0.0x 0.2x 0.4x 0.6x 0.8x 1.0x 1.2x EveryWare Comps
Appendix STRICTLY CONFIDENTIAL

29 Key ROI Terms Key Transaction Terms Description Corporate Structure Delaware C Corporation IPO Proceeds $75,000,000 Shares of Public Common Stock Outstanding 7,500,000 Amount in Trust @ IPO $10.00 per share Exchange / Ticker “ROIQ” – common stock / NASDAQ “ROIQW” – warrants / NASDAQ “ROIQU” – units / NASDAQ STRICTLY CONFIDENTIAL

30 Comparable Companies Analysis Note: $ in millions, except per share data. Source : Capital IQ, Bloomberg, Company filings, Wall Street research and FactSet . (1) Includes in - the - money outstanding options, warrants and convertible securities, treasury - adjusted. Enterprise value is equity va lue plus total debt and minority interest, less cash and equivalents. (2) Libbey enterprise value and net debt include pension and OPEB liabilities. (3) Spectrum Brands LTM EBITDA shown pro forma for HHI acquisition closed on December 17, 2012. (4) Multiple reflects 2013 Estimated Adjusted EPS. STRICTLY CONFIDENTIAL Stock Price Market Enterprise Net Debt/ TEV/EBITDA P / E P / E / G Company 3/28/13 Cap (1) Value (1) LTM EBITDA LTM CY '13E CY '13E CY '13E Church & Dwight Co. Inc. $64.63 $8,929 $9,489 0.9x 15.0x 13.2x 23.1x 2.2x De' Longhi S.p.A. 15.75 2,354 2,477 0.4x 8.1x 7.6x 13.8x 1.0x Helen of Troy Limited 38.36 1,219 1,527 1.7x 8.5x 7.8x 10.3x 1.8x Jarden Corp. 42.85 5,021 7,798 3.6x 10.2x 8.8x 13.2x 1.0x Libbey Inc. (2) 19.33 404 941 4.1x 7.1x 6.8x 9.5x 4.3x Lifetime Brands, Inc. 11.41 146 240 2.5x 6.3x 5.5x 8.2x 1.1x Newell Rubbermaid Inc. 26.10 7,475 9,220 1.9x 10.2x 9.8x 14.3x 1.5x SEB SA 69.18 3,308 4,210 1.5x 6.9x 6.5x 11.4x 1.0x SodaStream International Ltd. 49.64 1,013 951 NM 17.1x 12.1x 17.1x 1.0x Spectrum Brands Holdings, Inc. (3) 56.59 2,948 6,140 5.1x 9.9x 9.3x 15.7x 1.1x Tupperware Brands Corporation 81.74 4,415 4,913 1.1x 11.1x 10.1x 14.4x 1.1x Median 1.8x 9.9x 8.8x 13.8x 1.1x EveryWare - Pro Forma $10.00 $193 $420 3.9x 7.7x 6.9x 10.3x / 7.9x (4) 0.5x

31 ($ in millions) 2011A 2012A 2013E EBIT $17.2 $18.0 $42.8 Depreciation 7.1 10.3 12.4 Amortization 0.7 4.3 4.0 EBITDA $25.0 $32.6 $59.3 Restructuring $2.0 $6.9 $ -- Acquisition / Merger - Related Transaction Fees 3.2 3.7 -- Inventory Writedown 1.9 2.5 -- Management Fees 1.8 2.6 1.1 Other 1.9 1.2 0.7 Annualization of Pro Forma Cost Savings -- 4.6 -- Impact of Unwind of Natural Gas Hedges -- 2.8 0.5 Pro Forma Public Company Expenses -- (2.0) (0.5) Adjusted EBITDA $35.9 $54.9 $61.1 Adjusted EBITDA Reconciliation (1) Amortization of deferred gain from sale - leasback of Lancaster distribution center. (1)
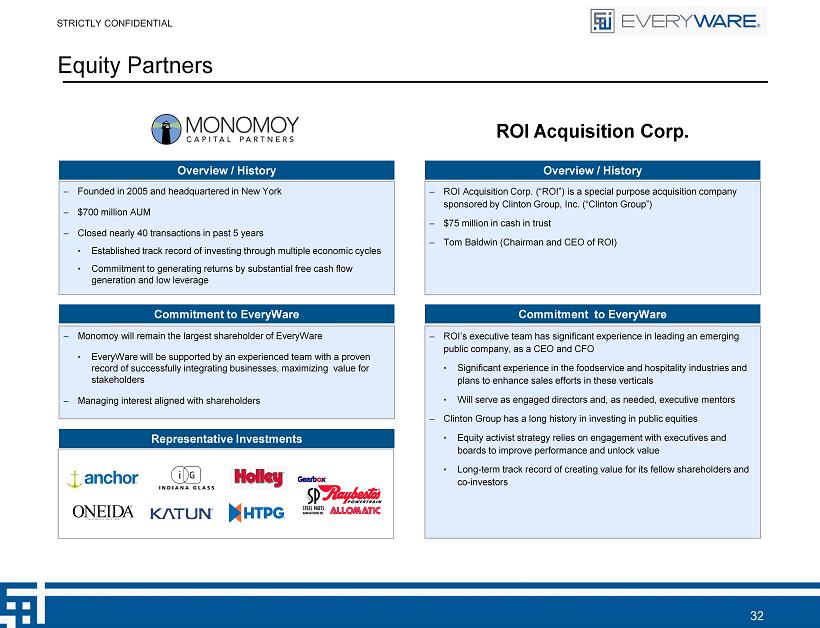
32 Equity Partners Overview / History Overview / History – Founded in 2005 and headquartered in New York – $ 700 million AUM – Closed nearly 40 transactions in past 5 years • Established track record of investing through multiple economic cycles • Commitment to generating returns by substantial free cash flow generation and low leverage – ROI Acquisition Corp. (“ROI”) is a special purpose acquisition company sponsored by Clinton Group, Inc. (“Clinton Group”) – $75 million in cash in trust – Tom Baldwin (Chairman and CEO of ROI) Representative Investments Commitment to EveryWare – Monomoy will remain the largest shareholder of EveryWare • EveryWare will be supported by an experienced team with a proven record of successfully integrating businesses, maximizing value for stakeholders – Managing interest aligned with shareholders ROI Acquisition Corp. Commitment to EveryWare – ROI’s executive team has significant experience in leading an emerging public company, as a CEO and CFO • Significant experience in the foodservice and hospitality industries and plans to enhance sales efforts in these verticals • Will serve as engaged directors and, as needed, executive mentors – Clinton Group has a long history in investing in public equities • Equity activist strategy relies on engagement with executives and boards to improve performance and unlock value • Long - term track record of creating value for its fellow shareholders and co - investors STRICTLY CONFIDENTIAL