Attached files
UNITED STATES
SECURITIES AND EXCHANGE COMMISSION
Washington, D.C. 20549
FORM 10-K
|
(Mark one)
|
|
|
x
|
ANNUAL REPORT PURSUANT TO SECTION 13 OR 15(d) OF THE SECURITIES EXCHANGE ACT OF 1934
|
|
For the fiscal year ended December 31, 2012
|
|
|
or
|
|
|
o
|
TRANSITION REPORT PURSUANT TO SECTION 13 OR 15(d) OF THE SECURITIES EXCHANGEACT OF 1934
|
|
For the transition period from _____________ to _____________
|
|
Commission file number: 001-33695

WESTINGHOUSE SOLAR, INC.
(Exact name of registrant as specified in its charter)
|
Delaware
|
90-0181035
|
|
(State or other jurisdiction of
incorporation or organization)
|
(I.R.S. Employer
Identification No.)
|
|
1475 S. Bascom Ave., Suite 101
|
|
|
Campbell, CA
|
95008
|
|
(Address of principal executive offices)
|
(Zip Code)
|
(408) 402-9400
(Registrant’s telephone number, including area code)
Securities registered pursuant to Section 12(b) of the Act:
None
Securities registered pursuant to Section 12(g) of the Exchange Act:
Common Stock, par value $0.001 per share
Indicate by check mark if the registrant is a well-known seasoned issuer, as defined in Rule 405 of the Securities Act. Yes o No x
Indicate by check mark if the registrant is not required to file reports pursuant to Section 13 or 15(d) of the Act.
Yes o No x
Indicate by checkmark whether the registrant (1) has filed all reports required to be filed by Section 13 or 15(d) of the Securities Exchange Act of 1934 during the preceding 12 months (or for such shorter period that the registrant was required to file such reports), and (2) has been subject to such requirements for the past 90 days. Yes x No o
Indicate by checkmark whether the registrant has submitted electronically and posted on its corporate Website, if any, every Interactive Data File required to be submitted and posted pursuant to Rule 405 of Regulation S-T (§232.405 of this chapter) during the preceding 12 months (or for such shorter period that the registrant was required to submit and post such files). Yes x No o
Indicate by checkmark if disclosure of delinquent filers pursuant to Item 405 of Regulation S-K (§229.405 of this chapter) is not contained herein, and will not be contained, to the best of registrant’s knowledge, in definitive proxy or information statements incorporated by reference to Part III of this Form 10-K or any amendment to this Form 10-K. o
Indicate by check mark whether the registrant is a large accelerated filer, an accelerated filer, a non-accelerated filer, or a smaller reporting company. See the definitions of “large accelerated filer,” “accelerated filer” and “smaller reporting company” in Rule 12b-2 of the Exchange Act.
|
Large accelerated filer o
|
Accelerated filer o
|
|
Non-accelerated filer o
|
Smaller reporting company x
|
|
(Do not check if a smaller reporting company)
|
Indicate by check mark whether the registrant is a shell company (as defined in Rule 12b-2 of the Act).Yes o No x
The aggregate market value of the Common Stock held by non-affiliates of the registrant, based on the closing sales price of the Common Stock as reported on The NASDAQ Capital Market on June 30, 2012, was approximately $6.6 million. For purposes of this computation, all officers and directors of the registrant are deemed to be affiliates.
As of March 25, 2013, 38,414,049 shares of common stock of the registrant were outstanding.
DOCUMENTS INCORPORATED BY REFERENCE
Selected portions of the Registrant’s definitive proxy statement for the 2013 annual meeting of stockholders are incorporated by reference into Part III of this Form 10-K, which will be filed with the SEC within 120 days after December 31, 2012.
WESTINGHOUSE SOLAR, INC.
TABLE OF CONTENTS
|
Page No.
|
|||||
| 2 | |||||
| 10 | |||||
| 18 | |||||
| 18 | |||||
| 18 | |||||
| 18 | |||||
| 19 | |||||
| 20 | |||||
| 21 | |||||
| 29 | |||||
| 30 | |||||
| 56 | |||||
| 56 | |||||
| 56 | |||||
| 57 | |||||
| 57 | |||||
| 57 | |||||
| 57 | |||||
| 57 | |||||
| 58 | |||||
| 62 | |||||
| 63 | |||||
PART I
As used in this Annual Report on Form 10-K, unless otherwise indicated, the terms “we,” “us,” “our” and “the Company” refer to Westinghouse Solar, Inc. (“Westinghouse Solar”) and its subsidiaries.
Our Annual Report on Form 10-K for 2012, and information we provide in our Annual Report to Stockholders, press releases, telephonic reports and other investor communications, including those on our website, may contain forward-looking statements with respect to anticipated future events and our projected financial performance, operations and competitive position that are subject to risks and uncertainties that could cause our actual results to differ materially from those forward-looking statements and our expectations.
Forward-looking statements can be identified by the use of words such as “expects,” “plans,” “will,” “may,” “anticipates,” “believes,” “should,” “intends,” “estimates” and other words of similar meaning. These statements constitute forward-looking statements within the meaning of the Safe Harbor Provisions of the Private Securities Litigation Reform Act of 1995. These forward-looking statements reflect our then current beliefs, projections and estimates with respect to future events and our projected financial performance, operations and competitive position.
Such risks and uncertainties include, without limitation, our ability to raise capital to finance our operations, the effectiveness, profitability and marketability of our products, our ability to protect our intellectual property rights and proprietary information, general economic and business conditions, the impact of technological developments and competition, adverse results of any legal proceedings, the impact of current, pending or future legislation and regulation of the solar power industry, our ability to enter into acceptable relationships with one or more manufacturers for solar panel components and the ability of such contract manufacturers to manufacture products or components of an acceptable quality on a cost-effective basis, our ability to attract or retain qualified senior management personnel, including sales and marketing and technical personnel and other risks detailed from time to time in our filings with the SEC, including those described in Item 1A below. We do not undertake any obligation to update any forward-looking statements.
Item 1. Business.
Overview
We are a designer and manufacturer of solar power systems and solar panels with integrated microinverters (which we call AC solar panels). Our products are designed for use in solar power systems for residential and commercial rooftop customers. We design, market and sell these solar power systems to solar installers, trade workers and do-it-yourself customers in the United States and Canada through distribution partnerships, our dealer network and retail home improvement outlets. We have historically sourced our components (such as solar panels and inverters) from manufacturers such as Suntech Power Holdings Co. Ltd. (Suntech), Light Way Green New Energy Co., Ltd (Lightway) and Enphase Energy (Enphase). We are actively working with CBD Energy Limited, a diversified renewable energy company based in Sydney, Australia (CBD) or related entities, to produce Westinghouse Solar modules at a supplier facility in Australia. The processes to obtain necessary product certifications for both U.S. and Australian distribution are currently underway and are expected to be completed by early in the second quarter of 2013. Prior to September 2010, we were also in the solar power system installation business and we had completed over 4,300 solar power installations for customers in California, New York, New Jersey, Pennsylvania, Colorado and Connecticut since the commencement of our operations in 2001. In early 2009, we closed our non-California offices on the east coast and in Colorado and began distributing our solar power systems to customers outside of California. By mid-2010, it became clear to us that the business and profit potential of the design and manufacturing business was better than that of being an installer. Thus, in September 2010, we made the strategic decision to exit our California solar panel installation business and expand our solar panel distribution network to dealers and other installers in California, by far the largest solar market in the United States. Our business is now focused solely on design and manufacturing activities, and sales of our solar power systems to solar installers, trade workers and retailers through distribution partnerships, our dealer network and retail home improvement outlets.
On May 9, 2012, we announced the execution of an agreement and plan of merger with CBD, which contemplates a merger in which CBD would become our parent company, subject to shareholder approvals and other customary closing conditions. CBD and the Company are working toward completion of the Form F-4 Registration Statement and Proxy Statement, planned to be filed in the coming weeks with the Securities and Exchange Commission. While the targeted completion of merger has been repeatedly delayed, the companies currently anticipate merger closing early in the third quarter of 2013. In the meantime, our supply relationships have been disrupted, our revenue has declined significantly and we have had to implement significant cost reductions and lay off many of our employees.
The Company was incorporated as Akeena Solar, Inc. (Akeena Solar) in February 2001 in the State of California and elected at that time to be taxed as an S Corporation. During June 2006, we reincorporated in the State of Delaware and became a C Corporation. On August 11, 2006, we entered into a reverse merger transaction (the “Merger”) with Fairview Energy Corporation, Inc. (“Fairview”). Pursuant to the merger agreement, the stockholders of Akeena Solar received one share of Fairview common stock for each issued and outstanding share of Akeena Solar common stock. Our common shares were also adjusted from $0.01 par value to $0.001 par value at the time of the Merger. Subsequent to the closing of the Merger, the former stockholders of Akeena Solar held a majority of Fairview’s outstanding common stock. Since the stockholders of Akeena Solar owned a majority of the outstanding shares of Fairview common stock immediately following the Merger, and the management and board of Akeena Solar became the management and board of Fairview immediately following the Merger, the Merger was accounted for as a reverse merger transaction and Akeena Solar was deemed to be the acquirer. The assets, liabilities and the historical operations prior to the Merger are those of Akeena Solar. Subsequent to the Merger, the consolidated financial statements include the assets, liabilities and the historical operations of Akeena Solar and Fairview from the closing date of the Merger.
On May 17, 2010, we entered into an exclusive worldwide license agreement that permits us to manufacture, distribute and market our solar panels under the Westinghouse name. On July 22, 2010, we announced that we will operate under the name “Westinghouse Solar” and, effective July 23, 2010 at the opening of the market, our stock began trading under the stock symbol “WEST” on the NASDAQ Capital Market. In September 2012, our common stock was delisted from the NASDAQ Capital Market and we began trading on the OTCQB under the stock symbol “WEST”. CBD has applied for listing on the NASDAQ Stock Exchange, to be effective upon consummation of the merger. CBD intends to delist from the ASX upon merger closing, subject to shareholder approval.
We changed our name from “Akeena Solar, Inc.” to “Westinghouse Solar, Inc.” effective on April 6, 2011. On April 13, 2011, we effected a reverse split of our common stock at a ratio of 1-for-4.
Our Corporate headquarters is located at 1475 S. Bascom Ave., Campbell, CA 95008. Our telephone number is (408) 402-9400. Additional information about Westinghouse Solar is available on our website at http://www.westinghousesolar.com . The information on our web site is not incorporated herein by reference.
Strategy
Our philosophy is simple: “we believe that producing clean electricity directly from the sun is the right thing to do for our environment and economy.” Since our founding, we have concentrated on serving the solar power needs of residential and commercial customers tied to the electric power grid.
The solar power industry is rapidly evolving, but is still at an early stage and is highly fragmented. The prospects for long-term worldwide demand for solar power have attracted many new solar panel manufacturers, as well as a multitude of design/integration companies. We expect the commodity manufacturing segment of the industry to consolidate as more solar panel manufacturing capacity comes online.
Accordingly, strategy primarily includes:
|
·
|
Developing and commercializing our solar panel technology optimized for the residential and commercial markets.
|
|
·
|
Reducing installation costs and improving the aesthetics and performance of solar systems compared to ordinary, commercially available solar equipment.
|
|
·
|
Promoting and enhancing our company's brand name and reputation.
|
Based on our experience as a solar power system designer and integrator, we believe we understand certain areas in which costs for installations can be significantly reduced. In 2007, we introduced a new “plug and play” solar panel technology (under the brand name “Andalay”) which we believe significantly reduces the installation time, number of parts and costs, as well as provides superior reliability and aesthetics for customers, when compared to other solar panel mounting products and technology.
In February 2009, we announced a strategic relationship with Enphase, a leading manufacturer of microinverters, to develop and market Andalay solar panel systems with ordinary AC house current output instead of high voltage DC output. We introduced Andalay AC panel products and began offering them to our customers in the second quarter of 2009. Andalay AC panels cost less to install, are safer, and generally provide higher energy output than ordinary DC panels.
On September 10, 2010, we announced that we were expanding our distribution business to include sales of our Westinghouse Solar Power Systems directly to dealers in California and that we were exiting the solar panel installation business. We had already transitioned to a design and manufacturing business model with a distribution network in other parts of the United States and in Canada. As a result, beginning with the third quarter of 2010, our installation business has been reclassified in our financial statements as discontinued operations. The exit from the installation business was essentially completed at the end of the fourth quarter of 2010. Since May 2010, we have been marketing our AC solar panels under the Westinghouse Solar brand, for which we have licensed exclusive rights from Westinghouse Electric Corporation.
Industry
Electric power is used to operate businesses, industries, homes and offices and provides the power for our communications, entertainment, transportation and medical needs. As our energy supply and distribution mix changes, electricity is likely to be used more for local transportation (electric vehicles) and space/water heating needs. According to the Edison Electric Institute, the electric power industry in the U.S. is over $218 billion in size, and will continue to grow with our economy.
According to a 2011 report from the U.S. Energy Information Administration (http://www.eia.gov/energy_in_brief/article/renewable_electricity.cfm), electricity in the U.S. is generated from the following: coal – 42%, natural gas – 25%, nuclear – 19%, oil – 1%, with renewable energy contributing 13%. “Renewable Energy” typically refers to non-traditional energy sources, including hydroelectric, wind and solar energy. Due to continuously increasing energy demands, we believe the electric power industry faces the following challenges:
|
·
|
Limited Energy Supplies. The primary fuels that have supplied this industry, fossil fuels in the form of oil, coal and natural gas, are limited. Worldwide demand is increasing at a time that industry experts have concluded that supply is limited. Therefore, the increased demand will probably result in increased prices, making it more likely that long-term average costs for electricity will continue to increase.
|
|
·
|
Generation, Transmission and Distribution Infrastructure Costs. Historically, electricity has been generated in centralized power plants transmitted over high voltage lines, and distributed locally through lower voltage transmission lines and transformer equipment. As electricity needs increase, these systems will need to be expanded. Without further investments in this infrastructure, the likelihood of power shortages (“brownouts” and “blackouts”) may increase.
|
|
·
|
Stability of Suppliers. Since many of the major countries who supply fossil fuel are located in unstable regions of the world, purchasing oil and natural gas from these countries may increase the risk of supply shortages and cost increases.
|
|
·
|
Environmental Concerns and Climate Change. Concerns about global warming and greenhouse gas emissions has resulted in the Kyoto Protocol, various states enacting stricter emissions control laws and utilities being required to comply with Renewable Portfolio Standards, which require the purchase of a certain amount of power from renewable sources. Currently, within the U.S., there are approximately 30 states with established RPS standards.
|
Solar energy is the underlying energy source for renewable fuel sources, including biomass fuels and hydroelectric energy. By extracting energy directly from the sun and converting it into an immediately usable form, either as heat or electricity, intermediate steps are eliminated. We believe, in this sense, solar energy is one of the most direct and unlimited energy sources.
Solar energy can be converted into usable forms of energy either through the photovoltaic effect (generating electricity from photons) or by generating heat (solar thermal energy). Solar thermal systems include traditional domestic hot water collectors (DHW), swimming pool collectors, and high temperature thermal collectors (used to generate electricity in central generating systems). DHW thermal systems are typically distributed on rooftops so that they generate heat for the building on which they are situated. High temperature thermal collectors typically use concentrating mirror systems and are typically located in remote sites.
Anatomy of a Solar Power System
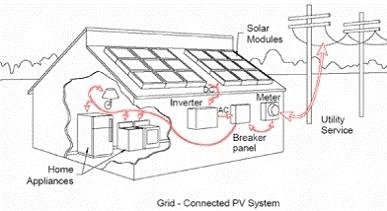
Solar power systems convert the energy in sunlight directly into electrical energy within solar cells based on the photovoltaic effect. Multiple solar cells, which produce DC power, are electrically interconnected into solar panels. A typical 180 watt solar panel may have 72 individual solar cells. Multiple solar panels are electrically wired together. The number of solar panels installed on a building are generally selected to meet that building’s annual electrical usage, or selected to fill available un-shaded roof or ground space.
Ordinary solar power systems have solar panels that are electrically wired to a central inverter, which converts the power from DC to AC and interconnects with the utility grid. The following diagram schematically shows an ordinary DC solar power system:
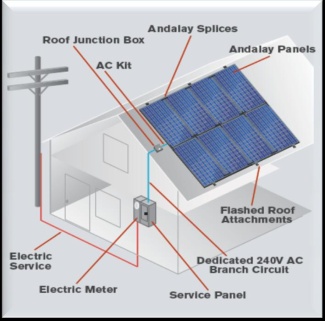
Westinghouse Solar AC panels also include integrated micro-inverters that produce AC power, eliminating the need for a central inverter. The following diagram schematically shows a typical Westinghouse Solar AC solar power system.
Solar Electric Cells. Solar electric cells convert light energy into electricity at the atomic level. The conversion efficiency of a solar electric cell is defined as the ratio of the sunlight energy that hits the cell divided by the electrical energy that is produced by the cell. By improving this efficiency, we believe solar electric energy becomes competitive with fossil fuel sources. The earliest solar electric devices converted about 1%-2% of sunlight energy into electric energy. Current solar electric devices convert 5%-25% of light energy into electric energy (the overall efficiency for solar panels is lower than solar cells because of the panel frame and gaps between solar cells), and current mass produced panel systems are substantially less expensive than earlier systems. Effort in the industry is currently being directed towards the development of new solar cell technology to reduce per watt costs and increase area efficiencies.
Solar Panels. Solar electric panels are composed of multiple solar cells, along with the necessary internal wiring, aluminum and glass framework, and external electrical connections. Although panels are usually installed on top of a roof or on an external structure, certain designs include the solar electric cells as part of traditional building materials, such as shingles and rolled out roofing. Solar electric cells integrated with traditional shingles is usually most compatible with masonry roofs and, while it may offset costs for other building materials and be aesthetically appealing, it is generally more expensive than traditional panels. Westinghouse Solar’s design integrates racking wiring and grounding components directly into the panel resulting in an integrated solution that reduces by 80%, the amount of rooftop solar components resulting in a solar power system that reduces the amount of field assembly, thereby increasing reliability and performance, while providing a better looking design.
Inverters. Inverters convert the DC power from solar panels to the AC power used in buildings. Grid-tie inverters synchronize to utility voltage and frequency and only operate when utility power is stable (in the case of a power failure these grid-tie inverters shut down to safeguard utility personnel from possible harm during repairs). Inverters also operate to maximize the power extracted from the solar panels, regulating the voltage and current output of the solar array based on sun intensity. Westinghouse Solar’s AC solution incorporates an integrated micro-inverter on each panel which improves system performance, is more reliable, safer for installers and homeowners, and reduces the amount of installation labor.
Monitoring. There are two basic approaches to access information on the performance of a solar power system. DC systems with central inverters collect the solar power performance data from the central inverter and then transmit that data to a digital hardware display. AC systems utilizing microinverters collect the solar power performance data of each panel and transmit panel-level and combined system data via the internet to a centralized database. AC system data on the performance of each panel and total system can then be accessed from any device with a web browser, including personal computers and cell phones.
Net Metering. The owner of a grid-connected solar electric system may not only buy, but may also sell, electricity each month. This is because electricity generated by the solar electric system can be used on-site or fed through a meter into the utility grid. Utilities are required to buy power from owners of solar electric systems (and other independent producers of electricity) under the Public Utilities Regulatory Policy Act of 1978 (PURPA). When a home or business requires more electricity than the solar power array is generating (for example, in the evening), the need is automatically met by power from the utility grid. When a home or business requires less electricity than the solar electric system is generating, the excess is fed (or sold) back to the utility and the electric meter actually spins backwards. Used this way, the utility serves as a backup to the solar system similar to the way in which batteries serve as a backup in stand-alone systems.
Solar Power Benefits
The direct conversion of light into energy offers the following benefits compared to conventional energy sources:
|
·
|
Economic — Once a solar power system is installed, the cost of generating electricity is fixed over the lifespan of the system. There are no risks that fuel prices will escalate or fuel shortages will develop. In addition, cash paybacks for systems range from 5 to 25 years, depending on the level of state and federal incentives, electric rates, annualized sun intensity and installation costs. Solar power systems at customer sites generally qualify for net metering to offset a customer’s highest electric rate tiers, at the retail, as opposed to the wholesale, electric rate.
|
|
·
|
Convenience — Solar power systems can be installed on a wide range of sites, including small residential roofs, the ground, covered parking structures and large industrial buildings. Solar power systems also have few, if any, moving parts and are generally guaranteed to operate for 20-25 years resulting, we believe, in low maintenance and operating costs and reliability compared to other forms of power generation.
|
|
·
|
Environmental — We believe solar power systems are one of the most environmentally friendly way of generating electricity. There are no harmful greenhouse gas emissions, no wasted water, no noise, no waste generation and no particulates. Such benefits continue for the life of the system.
|
|
·
|
Security — Producing solar power improves energy security both on an international level (by reducing fossil energy purchases from hostile countries) and a local level (by reducing power strains on local electrical transmission and distribution systems).
|
|
·
|
Infrastructure — Solar power systems can be installed at the site where the power is to be used, thereby reducing electrical transmission and distribution costs. Solar power systems installed and operating at customer sites may also save the cost of construction of additional energy infrastructure including power plants, transmission lines, distribution systems and operating costs.
|
We believe escalating fuel costs, environmental concerns and energy security make it likely that the demand for solar power systems will continue to grow. The federal government, and several states, have put a variety of incentive programs in place that directly spur the installation of grid-tied solar power systems, so that customers will “purchase” their own power generating system rather than “renting” power from a local utility. These programs include:
|
·
|
Rebates — to customers (or to installers) to reduce the initial cost of the solar power system, generally based on the size of the system. Many states have rebates that can substantially reduce initial costs.
|
|
·
|
Tax Credits — federal and state income tax offsets directly reducing ordinary income tax. There is currently a 30% federal tax credit for solar power systems.
|
|
·
|
Accelerated Depreciation — solar power systems installed for businesses (including applicable home offices) are generally eligible for accelerated depreciation.
|
|
·
|
Net Metering — provides a full retail credit for energy generated.
|
|
·
|
Feed-in Tariffs — are additional credits to consumers based on how much energy their solar power system generates. Feed-in Tariffs set at appropriate rates have been successfully used in Europe to accelerate growth.
|
|
·
|
Renewable Portfolio Standards — require utilities to deliver a certain percentage of power generated from renewable energy sources.
|
|
·
|
Renewable Energy Credits (RECs) — are additional credits provided to customers based on the amount of renewable energy they produce.
|
|
·
|
Solar Rights Acts — state laws to prevent unreasonable restrictions on solar power systems. California’s Solar Rights Act has been updated several times in past years to make it easier for customers of all types and in all locations to install a solar power system.
|
|
·
|
PPA's — Power Purchase Agreements, or agreements between a solar power system purchaser and an electricity user under which electricity is sold/purchased on a long-term basis.
|
|
·
|
Leases — in which the solar equipment is owned by a third party entity and repaid over time by the host customer.
|
Challenges Facing the Solar Power Industry
We believe the solar power industry faces three key challenges:
|
·
|
Customer Economics — In many cases, the net (after applicable incentives) cost to customers for electricity produced by a solar power system at the customer’s site is comparable to conventional, utility-generated power. We believe lower equipment (primarily solar panels) and installation costs would reduce the total cost of a system and increase the potential market for solar power.
|
|
·
|
System Performance and Reliability — We believe that a design that incorporates factory assembly of an integrated solar power system versus field assembly provides a more reliable solution. A system with these characteristics will deliver improved system performance and allow the customer to achieve the shortest possible payback.
|
|
·
|
Aesthetics — We believe that customers prefer solar panels that blend into existing roof surfaces with fewer shiny parts, mounted closely to the roof surface and have more of a “skylight” appearance than the traditional rooftop metal framed solar panels raised off the roof.
|
Competition
The solar panel design and manufacturing industry is in its early stages of development and is highly fragmented, consisting of many large and small companies. Worldwide, the manufacturers of rooftop solar panels include Suntech, Sharp, Yingli, Trina, SunPower, Sanyo, SolarWorld, LG and Samsung.
We believe the principal competitive factors in the solar panel manufacturing industry include:
|
·
|
Quality;
|
|
·
|
Price;
|
|
·
|
Installation cost; and
|
|
·
|
Company reputation
|
We believe that our competitive advantages as a designer and manufacturer of our solar panels include:
|
·
|
Integrated DC and AC Panels Dramatically Reduce Installation Costs. Our Westinghouse Solar technology significantly reduces the installation complexity, parts and costs, as well as providing superior reliability and aesthetics for customers when compared to other solar panel mounting products and technology. In 2007 we introduced our DC panels, which offer the following advantages to our customers: (i) low profile panel design looks like a beautiful, energy producing skylight and eliminates unsightly racking and exposed wires; (ii) built-in wiring connections that improve reliability; (iii) 70% fewer roof-assembled parts and 50% less roof-top labor required; (iv) 25% fewer roof attachment points; (v) complete compliance with the National Electric Code and UL wiring and grounding requirements. In 2009 we introduced our AC panels, which deliver 5-25% more energy compared to ordinary panels, produce safe household AC power and have built-in panel level monitoring, racking, wiring, grounding and microinverters. With 80% fewer parts and 5 – 25% better performance than ordinary DC panels, we believe our AC panels are an ideal solution for solar installers, trade workers and do-it-yourself customers.
|
|
·
|
Proprietary Technology. We have received three U.S. patents and six international patents for our technology, and have 23 more U.S. and foreign patents pending.
|
|
·
|
Brand Recognition. We are working to rapidly expand our distribution business and sales of our Westinghouse Solar Power Systems. We are seeking to take full advantage of the very strong worldwide brand equity that the Westinghouse name currently enjoys, and to emphasize that our solar panels are safer, more reliable and easier to install than other products on the market today.
|
Our Services and Products
We are active in the solar power industry as a designer and manufacturer of solar power systems. We specify the design of our proprietary solar panels and contract with existing, experienced solar panel manufacturers for the supply of our Westinghouse Solar labeled solar panels. We help these manufacturing partners source unique components of our panels (typically microinverters and special frame hardware).
Westinghouse Solar Panel Technology
Based on our previous experience as a solar power installer, we believe we understand certain areas in which costs for installations can be significantly reduced. In September 2007, we introduced a new “plug and play” solar panel technology, originally launched under the brand name Andalay, which we believe significantly reduces the installation time and costs, as well as providing superior reliability and aesthetics, when compared to other solar panels.
Installation costs for a solar power system are generally proportional to the area of panels installed. Thin film and amorphous solar cell technologies, although offering solar panels that are less expensive on a cost per watt basis, are generally less efficient (producing fewer watts per square foot) and correspondingly more expensive to install. Therefore, we believe that Westinghouse Solar technology becomes even more useful for the new generation of less expensive but lower efficiency solar panels. Westinghouse Solar panel technology is generally applicable to all framed rooftop solar cell technologies, including silicon, amorphous silicon, thin film and concentrators.
Customers
In 2012, we market and sell to a network of authorized dealers and distributors across the United States and Canada. We are planning to expand our distribution channel to include Australia in the second quarter of 2013. Our Westinghouse Solar Authorized Dealer program provides installation companies with the opportunity to differentiate themselves from ordinary solar installers through product and program offerings we extend exclusively to our established Dealers. In addition to the ability to sell and install Westinghouse Solar products, Westinghouse Solar Dealers benefit from the ability to leverage the Westinghouse brand, and leverage critical marketing support to help them grow their business.
Suppliers
Historically, we obtained virtually all of our solar panels, built to our specifications, from Suntech and Lightway. We currently have no pending orders with either Suntech or Lightway, and we do not anticipate receiving further solar panels from thm. We are actively working with CBD to produce Westinghouse Solar modules at a supplier facility in Australia. The processes to obtain necessary product certifications for both U.S. and Australian distribution are currently underway and are expected to be completed by early in the second quarter of 2013. Pursuant to our agreement with Enphase, they provide us with micro-inverters. We purchase small assembly, racking and packaging components from a variety of domestic and foreign suppliers.
Sales and Marketing
Our sales and marketing program incorporates a marketing mix of print, web, social and other media advertisements as well as participation in industry trade shows and individual discussions with prospective dealers. As we onboard dealers under our sales and marketing program, we rely on the skill of our sales team. We regularly evaluate the effectiveness of our sales team and marketing efforts using sales management software and make tactical marketing and sales changes as indicated to achieve and maintain cost effectiveness.
Intellectual Property
Andalay Solar Panel
We have three U.S. patents (Patent No. 7,406,800, Patent No. 7,832,157 and Patent No. 7,866,098) that cover key aspects of our Andalay solar panel technology, as well as U.S. Trademark No. 3481373 for registration of the mark “Andalay.” In addition to these U.S. patents, we have 6 foreign patents. Currently, Westinghouse Solar has nine issued patents and 23 other pending U.S. and foreign patent applications that cover the Andalay technology working their way through the USPTO and foreign patent offices.
The following table provides a summary of our patents:
|
Country of issuance
|
Patent Number
|
Date of Expiration
|
|||
|
United States
|
7,406,800 |
May 18, 2025
|
|||
|
United States
|
7,832,157 |
November 16, 2027
|
|||
|
United States
|
7,866,098 |
January 11, 2028
|
|||
|
Australia
|
2,005,248,343 |
May 18, 2025
|
|||
|
India
|
243,626 |
May 18, 2025
|
|||
|
Mexico
|
274,182 |
May 18, 2025
|
|||
|
Korea
|
751,614 |
May 18, 2025
|
|||
|
China
|
200580015652.1 |
May 30, 2032
|
|||
|
Canada
|
2,566,296 |
October 23, 2032
|
|||
We have registered with the United States Patent and Trademark Office the trademark “Instant Connect” (Reg. No. 4,290,244 and 4,290,245) for the designation of our patented “plug and play” solar panel. We have also registered with the United States Patent and Trademark Office the trademark “Akeena” for providing consulting services in the field of energy systems, technical information via a global computer network in the field of renewable energy systems, and renewable energy systems, namely, photovoltaic systems composed of photovoltaic solar panels, batteries, voltage regulators, inverters, racks and electrical controls, as well as the installation of such systems.
We have also registered the trademarks “Double Your Power” and “Andalay” with the United States Patent and Trademark Office for two goods classes: providing computer software for photovoltaic systems for evaluating electric consumption, determining system sizing, estimating electrical output, estimating customer costs, and estimating financial life cycle savings, for use by consumers and businesses; and, installation of renewable energy systems, namely photovoltaic systems composed of solar panels, batteries, voltage regulators, inverters, racks and electrical controls. Additionally, we have applications currently pending with the United States Patent and Trademark Office to expand the goods classes for “Double Your Power” and “Andalay.”
Since May 2010, we have been marketing our AC solar panels under the Westinghouse Solar brand, for which we have licensed exclusive rights from Westinghouse Electric Corporation.
Employees
As of March 25, 2013, we had 7 employees, of which 2 were sales and marketing employee, 4 were general and administrative employees and 1 was research and development employees. All employees were full-time employees. Our employees are not party to any collective bargaining agreement and we have never experienced an organized work stoppage. We believe our relations with our employees are good.
Item 1A. Risk Factors.
Our Annual Report on Form 10-K for 2012, and information we provide in our press releases, telephonic reports and other investor communications, may contain forward-looking statements with respect to anticipated future events and our projected financial performance, operations and competitive position that are subject to risks and uncertainties that could cause our actual results to differ materially from those forward-looking statements and our expectations. Future economic and industry trends that could potentially impact revenue, profitability, and growth remain difficult to predict. The factors underlying our forecasts and forward-looking statements are dynamic and subject to change. As a result, any forecasts or forward-looking statements speak only as of the date they are given and do not necessarily reflect our outlook at any other point in time.
Risks Relating to Our Business
We will need additional capital in the future to fund our business, and financing may not be available.
We expect our currently available capital resources and cash flows from operations to be insufficient to meet our working capital and capital expenditure requirements. Our cash requirements will depend on numerous factors, including the amount of our sales, the timing and levels of products purchased, pricing, payment terms and credit limits from manufacturers, the availability and terms of asset-based credit facilities, the timing and level of our accounts receivable collections, and our ability to manage our business towards profitability.
We expect to need to raise additional funds through public or private debt or equity financings or enter into new asset-based or other credit facilities, but such financings will likely dilute our stockholders. We cannot assure you that any additional financing that we may need will be available on terms favorable to us, or at all. In addition, on May 9, 2012 we announced the execution of an agreement and plan of merger which contemplates a merger in which CBD would become our parent company. This event may diminish our independent access to additional financing. If adequate funds are not available or are not available on acceptable terms, we may not be able to take advantage of business opportunities, develop new products or otherwise respond to competitive pressures. In any such case, our business, operating results or financial condition could be materially adversely affected.
We are dependent upon our solar panel suppliers for regular shipments of products; however we have not been timely in payment to them in recent periods, which has resulted in disruption in our supply of products. If we do not quickly establish replacement sources of supply, our operations will be further adversely affected.
Historically, we obtained virtually all of our solar panels from Suntech. On March 25, 2011, we entered into a volume supply agreement for a new generation of our solar panel products with Lightway, and in August 2011, we began purchasing solar panels from Lightway. Both Suntech and Lightway manufacture panels for us that are built to our unique specifications. We have a limited amount of remaining inventory on hand as of December 31, 2012, and although we believe we can find alternative suppliers for solar panels manufactured to our specifications, the disruption or loss of our current primary component supply relationships would be disruptive to our operations. In recent months, because of our cash position and liquidity constraints, we have been late in making payments to both of our panel suppliers. On March 30, 2012, pursuant to our Supply Agreement with Lightway, we issued 1,900,000 shares of our common stock to Lightway in partial payment of our past due account payable to them. The shares were valued at $1,045,000. On May 1, 2012, Suntech America filed a lawsuit against us for breach of contract, alleging that it delivered products to us and has not received full payment, and seeking payment of approximately $990,000. On July 31, 2012, we and Suntech entered into a settlement of this dispute, which allows and requires us make payment of the account balance over time, with the unpaid balance accruing interest at 10% per annum. Because of our inability to make scheduled settlement payments, on March 15, 2013, Suntech entered a judgment against us in the amount of $946,438. As of March 28, 2013, Suntech has not sought to enforce its judgment. Unless we are able to satisfy our prior panel suppliers payment for product orders, our prior suppliers may file additional lawsuits, which could result in decreased sales and revenue for us, and adversely affect our customer relationships and result in cancelled orders.
We currently do not have any unshipped orders for solar panel product pending with Suntech or Lightway, and we have not received any shipments of panels since April 2012. Our supply relationship with Lightway is currently stalled. We are actively working with CBD to produce Westinghouse Solar modules at a supplier facility in Australia. Unless we are able to secure alternative sources of supply, our inventory and revenue could diminish significantly, causing further disruption to our operations.
We are dependent upon our key suppliers for the components used in our systems and we must arrange for cost competitive manufacturing of our proprietary solar panels in order to grow our business; our suppliers are dependent upon the continued availability and pricing of silicon and other raw materials used in solar modules .
Historically, we obtained virtually all of our solar panels from Suntech and Lightway. Both Suntech and Lightway manufactured panels for us that were built to our unique specifications. We have a limited amount of remaining inventory on hand as of December 31, 2012. We are actively working with CBD to produce Westinghouse Solar modules at a supplier facility in Australia. The processes to obtain necessary product certifications for both U.S. and Australian distribution are currently underway and are expected to be completed by early in the second quarter of 2013.
It is critical to the growth of our revenue that our products be high quality while offered at competitive pricing. We believe that we will need to reduce the unit production cost of our products over time to obtain and maintain our ability to offer competitively priced products. Our ability to achieve cost reductions will depend on our ability to maintain favorable supplier contracts and to increase sales volumes so we can achieve economies of scale. We cannot provide assurance that we will be able to achieve any such production cost reductions. If we fail to negotiate better terms and maintain our relationships with our current suppliers or develop new supplier relationships, we may not achieve production cost reductions necessary to competitively price our products, which could adversely affect or limit our sales and growth.
We are currently subject to market prices for the components that we purchase, which are subject to fluctuation beyond our control. An increase in the price of components used in our systems could result in an increase in costs to our customers and could have a material adverse effect on our revenues and demand for our products.
Interruptions in our ability to procure needed components for our systems, whether due to discontinuance by our suppliers, delays or failures in delivery, shortages caused by inadequate production capacity or unavailability, financial failure, manufacturing quality, or for other reasons, would adversely affect or limit our sales and growth. There is no assurance that we will continue to find qualified manufacturers on acceptable terms and, if we do, there can be no assurance that product quality will continue to be acceptable, which could lead to a loss of sales and revenues.
The U.S. Government imposed tariffs on solar panels manufactured in China causing the prices we pay for solar panels to increase. This could cause customer demand for our products to decrease.
A group of solar panel manufacturers with domestic U.S. production facilities requested the U.S. Government to impose tariffs on the import of solar panels manufactured in China, based on allegations of unfair competition and of subsidization of prices for Chinese-made solar panels by the Chinese Government. In March 2012, the United States Commerce Department issued a preliminary decision imposing tariffs between 2.9% and 4.73%. In May 2012, a further decision by the Commerce Department was issued providing for a provisional tariff averaging 31% on 61 Chinese manufacturers caused by “dumping” solar panels into the U.S. market at prices below their actual cost. On October 11, the Commerce Department announced its final decision on these tariffs affirming its preliminary findings that modules containing cells of Chinese origin are subject to anti-dumping and countervailing duties (AD/CVD) when imported into the United States. The AD rates to be applied at the border range from 7.78% to 21.19% for participating respondents and up to 239.42% for non-participants. The CVD rates range from 14.78 to 15.97%. The AD and CVD rates will be applied collectively. The final step in the proceedings occurred on November 7, 2012, when the International Trade Commission (ITC) rendered a final affirmative injury determination concluding that the subject Chinese imports caused injury to U.S. manufacturers of crystalline-silicon solar cells and modules. The ITC also decided that the AD and CVD duties should not apply retroactively and rendered a negative "critical circumstances" determination. Thus, the effective dates were March 26, 2012 for CVD duties and May 25, 2012 for AD duties. Given the large current market share of solar panels manufactured in China, the imposition of these tariffs will have had far reaching, industry-wide effects, and have been disruptive to many established supply relationships. In fact, the imposition of these tariffs have caused prices for solar power systems in the United States to increase and resulted in reduced market demand for the purchase of solar power systems.
Our historical solar panel suppliers, Suntech and Lightway, both manufactured panels for us in China. As a result, aggregate AD and CVD duties of 30.66% (for Lightway) and 35.97% (for Suntech) were imposed on our purchases. The resulting increase in our product prices has harmed our competitive position in selling our products, and adversely affected our results of operations.
We have experienced significant customer concentration in recent periods, and our revenue levels could be adversely affected if any significant customer fails to purchase products from us at anticipated levels.
The relative magnitude and the mix of revenue from our largest customers have varied significantly quarter to quarter, but have been concentrated on a small number of large customers. During the twelve months ended December 31, 2012, two customers have accounted for a significant portion of our revenues:, Lennox International Inc. (Lennox), a global leader in the heating and air conditioning markets and Lennar Corporation (Lennar), a leading national homebuilder. Through December 31, 2012, Lennar had historically only ordered solar power systems from us for installation on 234 new homes, which was below their 600 home order commitment volume. No further orders have been received from Lennar since April 25, 2012. On December 28, 2012, we filed a complaint against Lennar in the United States District Court for the Southern District of Florida stating claims for breach of contract under a supply agreement with us. The volume of orders from key customers is difficult to predict. Fluctuations in order levels from significant customers could cause our revenue levels to correspondingly fluctuate, and the failure by any significant customer to maintain anticipated order levels could cause our revenue to fall short of expectations and adversely affect our results of operations.
We may fail to realize some or all of the anticipated benefits of our shift to a design and manufacturing business model in California and throughout North America, which may adversely affect the value of our common stock.
The success of our exit from the solar system installation business in California in September 2010, and our shift to focus exclusively on a design and manufacturing business model will depend, in large part, on our ability to successfully expand our distribution channels to include authorized dealers in California, as well as elsewhere in North America and Australia, and to accelerate the growth of our design and manufacturing business. California is the largest state in the country for solar products, accounting for approximately 50 percent of the U.S. market. Therefore, we continue to pursue developing distribution channel partners in California and are beginning to develop distribution channels in Australia given our merger plans with CBD.
If we are not able to achieve the expansion of our design and manufacturing business and meet our revenue growth and cost reduction objectives within the anticipated time frame, or at all, the anticipated benefits and cost savings of our change in strategic focus and our restructuring may not be realized or may take longer to realize than expected, and the value of our common stock may be adversely affected.
Specifically, risks in the operations of our business in order to realize the anticipated benefits of the change to a design and manufacturing business model include, among other things:
|
·
|
failure to arrange for cost competitive manufacturing of our proprietary solar panels;
|
|
·
|
failure to find and develop distribution relationships with new channel partners, particularly in the California and Australia market;
|
|
·
|
failure to successfully manage existing distribution relationships;
|
|
·
|
the loss of key employees critical to the ongoing operation of our business;
|
|
·
|
failure to effectively coordinate sales and marketing efforts to communicate the capabilities of our company;
|
|
·
|
unpredictability and delays in the timing of projected distribution orders, and resulting accumulation of excess product inventory;
|
|
·
|
failure to focus and develop our distribution product and service offerings quickly and effectively;
|
|
·
|
failure to successfully develop new products and services on a timely basis that address the market opportunities; and
|
|
·
|
unexpected revenue attrition or delays.
|
In addition, the shift in our business model may result in additional or unforeseen expenses, and the anticipated cost reduction benefits may not be realized.
We are exposed to risks associated with the weak global economy, which increase the uncertainty of project financing for solar installations and the risk of non-payment from customers.
The continuing tight credit markets and weak global economy are contributing to an ongoing slowdown in the solar industry, which may worsen if these economic conditions are prolonged or deteriorate further. The market for installation of solar power systems depends largely on commercial and consumer capital spending. Economic uncertainty exacerbates negative trends in these areas of spending, and may cause customers to push out, cancel, or refrain from placing orders, which may reduce our net sales. Difficulties in obtaining capital and adverse market conditions may also lead to the inability of some customers to obtain affordable financing, including traditional project financing and tax-incentive based financing and home equity based financing, resulting in lower sales to potential customers with liquidity issues, and may lead to an increase of incidents where our customers are unwilling or unable to pay for systems they purchase, and additional bad debt expense for us. Further, these conditions and uncertainty about future economic conditions make it challenging for us to obtain equity and debt financing to meet our working capital requirements to support our business, forecast our operating results, make business decisions, and identify the risks that may affect our business, financial condition and results of operations. If we are unable to timely and appropriately adapt to changes resulting from the difficult macroeconomic environment, our business, financial condition or results of operations may be materially and adversely affected.
Our technology may encounter unexpected problems or may not be protectable, which could adversely affect our business and results of operations.
Our technology is relatively new and has not been tested in installation settings for a sufficient period of time to prove its long-term effectiveness and benefits. Problems may occur with products or their underlying components that are unexpected and could have a material adverse effect on our business or results of operations. We have been issued several U.S. and foreign patents that cover our Andalay solar panel technology. We have several other pending patent applications covering Andalay technology. Ultimately, we may not be able to realize the benefits from any patent that is issued.
Because our industry is highly competitive and has low barriers to entry, we may lose market share to larger companies that are better equipped to weather a decline in market conditions due to increased competition.
Our industry is highly competitive and fragmented, is subject to rapid change and has low barriers to entry. Competition in the solar power services industry may increase in the future, partly due to low barriers to entry, as well as from other alternative energy sources now in existence or developed in the future. Increased competition could result in price reductions, reduced margins or loss of market share and greater competition for qualified technical personnel. There can be no assurance that we will be able to compete successfully against current and future competitors. If we are unable to compete effectively, or if competition results in a deterioration of market conditions, our business and results of operations would be adversely affected.
Our profitability depends, in part, on our success and brand recognition and we could lose our competitive advantage if we are not able to protect our trademarks and patents against infringement, and any related litigation could be time-consuming and costly.
We believe that the “Westinghouse” name has significant value and recognition in the North American market, and that our “Andalay” brand has gained substantial recognition by customers in certain geographic areas. We have registered the “Andalay” trademark with the United States Patent and Trademark Office. Use of our trademarks or similar trademarks by competitors in geographic areas in which we have not yet operated could adversely affect our ability to use or gain protection for our brand in those markets, which could weaken our brand and harm our business and competitive position. In addition, any litigation relating to protecting our trademarks and patents against infringement could be time consuming and costly.
We may have warranty obligations to Real Goods Solar, Inc. that could adversely affect our results of operations.
In connection with our exit from the solar system installation business in California, Real Goods Solar, Inc. (Real Goods) agreed to undertake primary, “first responder” responsibility for future warranty service obligations relating to the approximately 800 installations for SunRun that we have previously completed (the “WS Installations”). We retain secondary warranty responsibility on the WS Installations, in the event that Real Goods fails to perform the warranty. We will reimburse Real Goods for actual warranty service work completed by Real Goods related to these “first responder” installations. Other than solar panels and inverters that are covered under the manufacturer warranty, we provided our customers for WS Installations a 5-year or a 10-year warranty. We have accrued, and included within “Liabilities of Discontinued Operations” in our consolidated balance sheets for December 31, 2012 and December 31, 2011, a liability of approximately $1.1 million, to cover these warranty obligations. That amount is intended to cover both the WS Installations and certain installation projects assigned to Real Goods. The terms of the Warranty Agreements provided that we establish an escrow account as a source of funds from which to satisfy our obligation to pay Real Goods for its fees and reimburse it for its expenses for warranty work performed by it pursuant to the Warranty Agreements which are not paid to Real Goods from the company directly. In March 2011, we entered into an Escrow Agreement with Real Goods and deposited $200,000 into an escrow fund. The amount is reflected in long-term assets of discontinued operations in our consolidated balance sheets. The escrow deposit will be released to us in the amount of $40,000, or one-fifth of the remaining escrow funds, per year after each of the fifth through the ninth anniversary of the escrow agreement. If Real Goods fails to perform under the assigned warranty coverage, or the actual warranty expenses exceed the amounts we have accrued, we could incur significant unexpected additional expenses, which would adversely affect our results of operations.
Impairment charges could reduce our results of operations.
In accordance with the provisions of Financial Accounting Standards Board (FASB) Accounting Standard Codification (ASC) 350, Goodwill and Other Intangible Assets (ASC 350), we test intangible assets with indefinite useful lives for impairment on an annual basis, and on an interim basis if an event occurs that might reduce the fair value of the reporting unit below its carrying value. We also assess the fair value of our inventory and other tangible assets as of the end of each reporting period. During the year ended December 31, 2012, we recorded a $206,000 non-cash inventory write-down, which represented an adjustment to the carrying value of our older, smaller-format solar panels and older micro-inverter inventory to reflect the decline in market prices compared to our original cost, a $65,000 write-off of accumulated inventory overhead costs and a $112,000 non-cash inventory write-off of obsolete inventory. As a result of our exit from the installation business, during the year ended December 31, 2010, we impaired approximately $2.0 million for inventory, equipment and other assets no longer needed in our business. We may determine that further asset impairment charges are needed in the future. Although any such impairment charge would be a non-cash expense, further impairment of our tangible or intangible assets could materially increase our expenses and reduce our results of operations.
Our success depends on our key personnel, including our executive officers, and the loss of key personnel or the transition of key personnel, including our Chief Executive Officer, could disrupt our business.
Our success greatly depends on the continued contributions of our senior management and other key sales, marketing and operations personnel. These employees may voluntarily terminate their employment at any time. We may not be able to successfully retain existing personnel or identify, hire and integrate new personnel; and we do not have key person insurance policies in place for these employees. Since May 7, 2012, Margaret Randazzo, our Chief Financial Officer, has acted as our Chief Executive Officer.
If we are unable to attract, train and retain highly qualified personnel, the quality of our services may decline and we may not successfully execute our internal growth strategies.
Our success depends in large part upon our ability to continue to attract, train, motivate and retain highly skilled and experienced employees, including technical personnel. Qualified technical employees periodically are in great demand and may be unavailable in the time frame required to satisfy our customers’ requirements. While we currently have available technical expertise sufficient for the requirements of our business, expansion of our business could require us to employ additional highly skilled technical personnel. We expect competition for such personnel to increase as the market for solar power systems expands.
There can be no assurance that we will be able to attract and retain sufficient numbers of highly skilled technical employees in the future. The loss of personnel or our inability to hire or retain sufficient personnel at competitive rates of compensation could impair our ability to secure and complete customer engagements and could harm our business.
Unexpected warranty expenses or service claims could reduce our profits.
We maintain a warranty reserve on our balance sheet for potential warranty or service claims that could occur in the future. This reserve is adjusted based on our ongoing operating experience with equipment and installations. It is possible, perhaps due to bad supplier material or defective installations, that we would have actual expenses substantially in excess of the reserves we maintain. Our failure to accurately predict future warranty claims could result in unexpected profit volatility.
Risks Relating to Our Industry
We have experienced technological changes in our industry. New technologies may prove inappropriate and result in liability to us or may not gain market acceptance by our customers.
The solar power industry (and the alternative energy industry, in general) is subject to technological change. Our future success will depend on our ability to appropriately respond to changing technologies and changes in function of products and quality. If we adopt products and technologies that are not attractive to consumers, we may not be successful in capturing or retaining a significant share of our market. In addition, some new technologies are relatively untested and unperfected and may not perform as expected or as desired, in which event our adoption of such products or technologies may cause us to lose money.
A drop in the retail price of conventional energy or non-solar alternative energy sources may negatively impact our profitability.
We believe that an end customer’s decision to purchase or install solar power capabilities is primarily driven by the cost and return on investment resulting from solar power systems. Fluctuations in economic and market conditions that affect the prices of conventional and non-solar alternative energy sources, such as decreases in the prices of oil and other fossil fuels, could cause the demand for solar power systems to decline, which would have a negative impact on our profitability. Changes in utility electric rates or net metering policies could also have a negative effect on our business.
Existing regulations, and changes to such regulations, may present technical, regulatory and economic barriers to the purchase and use of solar power products, which may significantly reduce demand for our products and services.
New government regulations or utility policies pertaining to solar power systems are unpredictable and may result in significant additional expenses or delays and, as a result, could cause a significant reduction in demand for solar energy systems and our services. For example, there currently exist metering caps in certain jurisdictions which effectively limit the aggregate amount of power that may be sold by solar power generators into the power grid.
Our business depends on the availability of rebates, tax credits and other financial incentives; reduction, elimination or uncertainty of which would reduce the demand for our products and services.
Many states offer incentives to offset the cost of solar power systems. These systems can take many forms, including direct rebates, state tax credits, system performance payments and Renewable Energy Credits (RECs). Moreover, the federal government currently offers a 30% tax credit for the installation of solar power systems. Businesses may also elect to accelerate the depreciation on their system over five years. Uncertainty about the introduction of, reduction in or elimination of such incentives or delays or interruptions in the implementation of favorable federal or state laws could substantially increase the cost of our systems to our customers, resulting in significant reductions in demand for our services, which would negatively impact our sales.
If solar power technology is not suitable for widespread adoption or sufficient demand for solar power products does not develop or takes longer to develop than we anticipate, our sales would decline and we would be unable to achieve or sustain profitability.
The market for solar power products is emerging and rapidly evolving, and its future success is uncertain. Many factors will influence the widespread adoption of solar power technology and demand for solar power products, including:
|
·
|
cost effectiveness of solar power technologies as compared with conventional and non-solar alternative energy technologies;
|
|
·
|
performance and reliability of solar power products as compared with conventional and non-solar alternative energy products;
|
|
·
|
capital expenditures by customers that tend to decrease if the U.S. economy slows; and
|
|
·
|
availability of government subsidies and incentives.
|
If solar power technology proves unsuitable for widespread commercial deployment or if demand for solar power products fails to develop sufficiently, we would be unable to generate enough revenue to achieve and sustain profitability. In addition, demand for solar power products in the markets and geographic regions we target may not develop or may develop more slowly than we anticipate.
Risks Relating to our Common Stock
We were delisted from the Nasdaq Capital Market and there is a limited trading volume for our common stock on the OTCQB.
In September 2012, our common stock was delisted from the Nasdaq Capital Market. Our common stock, which currently trades on the OTCQB, does not have substantial trading volume. As a result, relatively small trades of our common stock may have a significant impact on the price of our common stock and, therefore, may contribute to the price volatility of our common stock. Because of the limited trading volume in our common stock and the price volatility of our common stock, you may be unable to sell your shares of common stock when you desire or at the price you desire. The inability to sell your shares in a declining market because of such illiquidity or at a price you desire may substantially increase your risk of loss.
In addition, the delisting of our common stock from the Nasdaq Capital Market could materially adversely affect our ability to raise capital on terms acceptable to us or at all and could adversely affect institutional investor interest.
Our stockholders may be diluted by the conversion of our preferred stock and the exercise of warrants; in the event we have a “change of control” or if we fail to comply with the terms of the Preferred Stock, we may be in default and face demands for redemption and significant penalties.
On February 17, 2011, we entered into a Securities Purchase Agreement with accredited investors, pursuant to which we sold to such investors our Series B 4% Convertible Preferred (“Series B Preferred”), and our Series K Warrants. On October 18, 2012, we entered into a Securities Purchase Agreement with accredited investors, pursuant to which we sold to such investors our Series C 8% Convertible Preferred (Series C Preferred). On February 15, 2013, we entered into a Securities Purchase Agreement with accredited investors pursuant to which we sold to such investors our Series D 8% Convertible Preferred Stock (Series D Preferred), and together with the Series B and C Preferred (the “Preferred Stock”). The conversion price of the Preferred Stock is subject to adjustment downward in the event that we sell common stock (or securities convertible into or exercisable for shares of common stock) at an effective price below the conversion price of such Preferred Stock. If the price adjustment provisions are triggered, then the number of shares of common stock issuable upon conversion of the Preferred Stock are subject to increase. When the investors convert our Preferred Stock, our stockholders may experience dilution in the net tangible book value of their common stock. In addition, the sale or availability for sale of the underlying shares in the marketplace could depress our stock price. Except for the Series D Preferred, we have registered all of the underlying shares of common stock relating to the Preferred Stock and our outstanding warrants. As a result, the investors could resell the underlying shares immediately upon issuance, which may result in significant downward pressure on the market price of our stock. In connection with the Series D Preferred we have granted the purchasers “piggy-back” registration rights to include the underlying shares of common stock issuable upon conversion of the Series D Preferred in future registration statements, if any are filed by us.
In addition, the terms of our Preferred Stock include various agreements and negative covenants on our part. In the event we fail to comply with those provisions, or if a “change of control” of the Company occurs, it could constitute a “triggering event” (as defined in the Certificates of Designation which designate the rights of the two series of Preferred Stock), and the holders of our Preferred Stock could then demand that all of the outstanding shares of Preferred Stock be redeemed for cash (in certain circumstances generally within our control), or under certain circumstances, for shares of our common stock. Any such demand for redemption in cash could have a material adverse affect on our financial position and liquidity, and any demand for redemption in stock could have a material dilutive effect for our stockholders. In addition, in certain such triggering events, the dividend rate on our outstanding Preferred Stock is subject to increase to 18% per annum thereafter.
Future sales of common stock by our existing stockholders may cause our stock price to fall.
The market price of our common stock could decline as a result of sales by our existing stockholders of shares of common stock in the market, or the perception that these sales could occur. These sales might also make it more difficult for us to sell equity securities at a time and price that we deem appropriate. As of March 25, 2013, we had 38,414,049 shares of common stock outstanding (which includes 18,320 unvested shares of restricted stock granted to our directors and our employees), 347 shares of Series D Preferred that are convertible into 3,470,000 shares of common stock, 310 shares of Series C Preferred that are convertible into 6,200,000 shares of common stock, 2,209.686 shares of Series B Preferred that are convertible into 39,774,348 shares of common stock, and we had warrants to purchase 3,398,045 shares of common stock and options to purchase 575,199 shares of common stock outstanding.
All of the shares of common stock issuable upon exercise of our outstanding vested options will be freely tradable without restriction under the federal securities laws unless purchased by our affiliates. The shares of common stock issuable upon exercise of our outstanding warrants are generally covered by effective registration statements which permit the underlying shares issuable upon their exercise to be freely tradable in the public market.
Our stock price may be volatile, which could result in substantial losses for investors.
The market price of our common stock is likely to be highly volatile and could fluctuate widely in response to various factors, many of which are beyond our control, including the following:
|
·
|
technological innovations or new products and services by us or our competitors;
|
|
·
|
announcements or press releases relating to the energy sector or to our business or prospects;
|
|
·
|
additions or departures of key personnel;
|
|
·
|
regulatory, legislative or other developments affecting us or the solar power industry generally;
|
|
·
|
our ability to execute our business plan;
|
|
·
|
operating results that fall below expectations;
|
|
·
|
volume and timing of customer orders;
|
|
·
|
industry developments;
|
|
·
|
economic and other external factors; and
|
|
·
|
period-to-period fluctuations in our financial results.
|
|
·
|
future developments relating to the status of a business combination with CBD.
|
In addition, the securities markets have from time to time experienced significant price and volume fluctuations that are unrelated to the operating performance of particular companies. These market fluctuations may also significantly affect the market price of our common stock.
Risks Relating to Our Company
If the Merger contemplated by the Merger Agreement with CBD does not occur or continues to be delayed, it could have a material adverse effect on our business, results of operations, and financial condition.
On May 7, 2012, we entered into a Merger Agreement with CBD. We had originally targeted completion of the merger during the third quarter of 2012, however the target date for completion has been repeatedly delayed, and the necessary registration statemeent has yet to be completed and filed. The companies currently anticipate that completion will occur early in the third quarter of 2013. In the meantime, our supply relationships have been disrupted, our revenue has declined significantly and we have had to implement significant cost reductions and lay off employees. We cannot predict whether and when the closing conditions for the Merger as set forth in the Merger Agreement will be satisfied, and the contemplated Merger transaction may continue to be delayed or even abandoned before completion if certain events occur. The Merger Agreement may be terminated by us, on the one hand, or CBD, on the other hand, under certain circumstances, and termination of the Merger Agreement may in certain circumstances require us to pay a termination fee to CBD equal to the greater of (i) $500,000 and (ii) the amount of expenses that CBD has incurred in connection with the Merger, including legal and financial advisor fees. In September 2012, we entered into an amendment to the Merger Agreement under which the parties agreed to extend the Outside Date (as defined in the Merger Agreement) relating to termination rights under the Merger Agreement from October 31, 2012 to January 31, 2013 (or in certain circumstances, from December 31, 2012 to March 31, 2013), subject to additional extensions. Currently, both parties are working diligently to complete the merger. Subsequent to March 31, 2013, the termination of the Merger Agreement does not occur automatically, but it can be terminated unilaterally by either party, upon notice to the other. In addition, the failure by our stockholders to approve and adopt the Merger Agreement at our future meeting of stockholders may require us to pay CBD the same termination fee. If the closing conditions set forth in the Merger Agreement are not satisfied or waived, or if the transactions are not completed for any other reason, (i) the market price of our common stock could significantly decline; (ii) we will remain liable for the significant expenses that we have incurred related to the transaction, including legal and financial advisor fees, and may be required to pay the foregoing termination fees; (iii) we may experience substantial disruption in our sales, operating activities, customers, suppliers, and other third-party relationships, any of which could materially and adversely affect us and our business, operating results, and financial condition; and (iv) we may have difficulty attracting and retaining key personnel.
Until the closing of the Merger, the focus of our management team and employees will likely continue to be diverted, and there may be a negative reaction to the Merger on the part of our customers, employees, suppliers, or other third-party relationships more than what has been factored in after the announcement of the merger. The Merger Agreement also contains certain limitations regarding our business operations prior to completion of the Merger.
Upon closing of the proposed Merger with CBD, we may fail to realize some or all of the anticipated benefits of the Merger, which may adversely affect the value of the common stock of the combined company.
The success of the Merger will depend, in part, on the combined company’s ability to realize the anticipated benefits and cost savings from combining our historical business with that of CBD. However, to realize these anticipated benefits and cost savings, both companies must successfully combine those businesses. If we are not able to achieve these objectives within the anticipated time frame, or at all, the anticipated benefits and cost savings of the Merger may not be realized or may take longer to realize than expected, and the value of the merger consideration to be received by our stockholders may be adversely affected.
Specifically, risks in integrating our operations into CBD’s operations in order to realize the anticipated benefits of the Merger include, among other things:
|
·
|
the loss of key employees critical to the ongoing operation of the business;
|
|
·
|
failure to effectively coordinate sales and marketing efforts to communicate the capabilities of the combined company;
|
|
·
|
failure to combine product and service offerings quickly and effectively;
|
|
·
|
failure to successfully develop new products and services on a timely basis that address the market opportunities of the combined company;
|
|
·
|
unexpected revenue attrition;
|
|
·
|
failure to successfully integrate and harmonize financial reporting and information technology systems of CBD and us; and
|
|
·
|
failure to develop and maintain an effective internal control environment as required under the Sarbanes-Oxley Act of 2002 (CBD is an Australian public corporation not subject, at the moment, to the Sarbanes-Oxley Act of 2002).
|
We are subject to the reporting requirements of the federal securities laws, which impose additional burdens on us.
We are a public reporting company and, accordingly, subject to the information and reporting requirements of the Exchange Act and other federal securities laws, including compliance with the Sarbanes-Oxley Act of 2002. As a public company, these rules and regulations result in increased compliance costs and make certain activities more time consuming and costly.
Our Certificate of Incorporation authorizes our board to create new series of preferred stock without further approval by our stockholders, which could adversely affect the rights of the holders of our common stock.
Our Board of Directors has the authority to fix and determine the relative rights and preferences of preferred stock. Our Board of Directors also has the authority to issue preferred stock without further stockholder approval. As a result, our Board of Directors could authorize the issuance of new series of preferred stock that would grant to holders the preferred right to our assets upon liquidation, the right to receive dividend payments before dividends are distributed to the holders of common stock and the right to the redemption of the shares, together with a premium, prior to the redemption of our common stock. In addition, our Board of Directors could authorize the issuance of new series of preferred stock that has greater voting power than our common stock or that is convertible into our common stock, which could decrease the relative voting power of our common stock or result in dilution to our existing stockholders.
Item 1B. Unresolved Staff Comments.
None
Item 2. Properties.
As of March 15, 2013, we had two offices. Our corporate headquarters is located at 1475 S. Bascom Ave. Campbell, California 95008. We also maintain a warehouse in San Jose, California for distribution of our solar products.
The following table indicates the approximate square footage for each of our leased office locations.
|
Property Location
|
Approximate Square Footage
|
|||
|
Campbell, California
|
5,000 | |||
|
San Jose, California
|
25,000 | |||
Item 3. Legal Proceedings.
On May 1, 2012, Suntech America, Inc., a Delaware corporation (Suntech America), filed a complaint for breach of contract, goods sold and delivered, account stated and open account against us in the Superior Court of the State of California, County of San Francisco. Suntech America alleged that it delivered products and did not receive full payment from us. On July 31, 2012, we and Suntech entered into a settlement of this dispute. Because of our inability to make scheduled settlement payments, on March 15, 2013, Suntech entered a judgment against us in the amount of $946,438. As of March 28, 2013, Suntech has not sought to enforce its judgment. As of December 31, 2012, we have included in our Condensed Consolidated Balance Sheets a balance due to Suntech America of $946,438.
On December 28, 2012, we filed a complaint against Lennar Homes, LLC (Lennar) in the United States District Court for the Southern District of Florida stating claims for breach of contract under a supply agreement. As previously disclosed, Lennar had agreed to purchase solar power systems from us for residential housing Lennar was developing and constructing. Under the agreement, Lennar had a 600 home order commitment by March 1, 2012, with stated penalty amounts payable for any shortfall below that minimum. Through December 28, 2012, Lennar had only ordered and paid for solar power systems for 234 new homes. Lennar filed a motion to dismiss the complaint which was denied by the Judge on March 6, 2013. The matter has been scheduled for trial on the Court’s two-week trial docket commencing December 29, 2013. The parties are presently in the discovery stage and on March 6, 2013, were ordered to attend a non-binding settlement conference in front of the Magistrate Judge. A non-binding settlement conference is scheduled for April 22, 2013.
We are also involved in other litigation from time to time in the ordinary course of business. In the opinion of management, the outcome of such proceedings will not materially affect our financial position, results of operations or cash flows.
Item 4. Mine Safety Disclosure
Not applicable.
PART II
Item 5. Market for Registrant’s Common Equity, Related Stockholder Matters and Issuer Purchases of Equity Securities.
Price Range of Common Stock
Our common stock has been quoted on the OTCQB Marketplace since September 6, 2012. From August 2010 to September 2012, we were traded on the NASDAQ Capital Market under the symbol WEST, from September 2007 until July 2010, we were traded under the symbol AKNS, and from August 2006 through August 2007, our common stock was quoted on the OTC Bulletin Board under the symbol AKNS.OB. Prior to that date, there was no active market for our common stock.
The following table sets forth the high and low bid prices for our common stock for the periods indicated, as reported by the OTCQB Marketplace from September 6, 2012 through December 31, 2012 and previously as reported by the NASDAQ. All historical share prices have been adjusted to reflect this reverse stock split.
|
High
|
Low
|
|||||||
|
Fiscal Year 2011
|
||||||||
|
First Quarter
|
$ | 2.56 | $ | 1.88 | ||||
|
Second Quarter
|
$ | 2.75 | $ | 1.00 | ||||
|
Third Quarter
|
$ | 1.83 | $ | 0.75 | ||||
|
Fourth Quarter
|
$ | 0.83 | $ | 0.26 | ||||
|
Fiscal Year 2012
|
||||||||
|
First Quarter
|
$ | 0.88 | $ | 0.32 | ||||
|
Second Quarter
|
$ | 0.57 | $ | 0.15 | ||||
|
Third Quarter
|
$ | 0.39 | $ | 0.16 | ||||
|
Fourth Quarter
|
$ | 0.20 | $ | 0.04 | ||||
The last reported sale price of our common stock on the OTCQB Marketplace on March 25, 2013, was $0.05 per share. As of March 25, 2013, there were approximately 21 holders of record of our common stock.
We have not declared or paid any cash dividends on our common stock and do not anticipate declaring or paying any cash dividends on our common stock in the foreseeable future. We currently expect to retain future earnings, if any, for the development of our business. Dividends may be paid on our common stock only if and when declared by our board of directors.
Equity Compensation Plan Information
The following table sets forth a summary of restricted stock activity for the twelve months ended December 31, 2012 and 2011:
|
Number of Restricted Shares
|
Weighted-Average Grant Date
Fair Value
|
|||||||
|
Outstanding and not vested beginning balance at January 1, 2011
|
101,446 | $ | 7.57 | |||||
|
Granted
|
332,155 | $ | 1.46 | |||||
|
Forfeited/cancelled
|
(33,550 | ) | $ | 4.61 | ||||
|
Released/vested
|
(110,256 | ) | $ | 4.91 | ||||
|
Outstanding and not vested beginning balance at January 1, 2012
|
289,795 | $ | 1.92 | |||||
|
Granted
|
1,029,113 | $ | 0.31 | |||||
|
Forfeited/cancelled
|
(131,216 | ) | $ | 1.68 | ||||
|
Released/vested
|
(1,139,619 | ) | $ | 0.47 | ||||
|
Outstanding and not vested at December 31, 2012
|
48,073 | $ | 2.50 | |||||
The following table sets forth a summary of stock option activity for the twelve months ended December 31, 2012 and 2011:
|
Number of
Shares Subject To
Option 2012
|
Weighted-Average
Exercise Price
|
Number of
Shares Subject To
Option 2011
|
Weighted-Average
Exercise Price
|
|||||||||||||
|
Outstanding beginning balance
|
1,077,744 | $ | 5.47 | 999,775 | $ | 8.66 | ||||||||||
|
Granted during the year
|
46,875 | 0.26 | 377,699 | 1.72 | ||||||||||||
|
Forfeited/cancelled/expired during the year
|
(444,875 | ) | 9.08 | (299,730 | ) | 11.36 | ||||||||||
|
Exercised during the year
|
— | — | — | — | ||||||||||||
|
Outstanding at end of year
|
679,744 | $ | 2.75 | 1,077,744 | $ | 5.47 | ||||||||||
|
Exercisable at end of year
|
477,538 | $ | 2.82 | 468,758 | $ | 8.95 | ||||||||||
|
Outstanding and expected to vest
|
669,049 | $ | 2.82 | 1,007,256 | $ | 5.68 | ||||||||||
|
Number of securities to be issued upon exercise of outstanding options
|
Weighted-average exercise price of outstanding options
|
Number of securities remaining available for issuance under equity compensation plans (excluding outstanding options and restricted stock awards)
|
||||
|
Equity compensation plans approved by stock holders:
|
||||||
|
2006 Stock Incentive Plan
|
679,744
|
$
|
2.75
|
1,112,308
|
||
|
Equity compensation plans not approved by stock holders
|
—
|
$
|
—
|
—
|
||
Item 6. Selected Financial Data.
Not applicable.
Item 7. Management’s Discussion and Analysis of Financial Condition and Results of Operations.
The following discussion highlights what we believe are the principal factors that have affected our financial condition and results of operations as well as our liquidity and capital resources for the periods described. This discussion should be read in conjunction with our financial statements and related notes appearing elsewhere in this Annual Report. This discussion contains “forward-looking statements,” which can be identified by the use of words such as “expects,” “plans,” “will,” “may,” “anticipates,” “believes,” “should,” “intends,” “estimates” and other words of similar meaning. These forward-looking statements are subject to risks and uncertainties that may cause actual results to differ materially from those expressed or implied by these forward-looking statements. Such risks and uncertainties include, without limitation, the risks described on page 1 of this Annual Report, and the risks described in Item 1A above.
Company Overview
We are a designer and manufacturer of solar power systems and solar panels with integrated microinverters (which we call AC solar panels). We design, market and sell these solar power systems to solar installers, trade workers and do-it-yourself customers in the United States and Canada through distribution partnerships, our dealer network and retail outlets. Our products are designed for use in solar power systems for residential and commercial rooftop customers. Prior to September 2010, we were also in the solar power installation business.
On May 9, 2012, we announced the execution of an agreement and plan of merger with CBD Energy Limited, a diversified renewable energy company based in Sydney, Australia (CBD), which contemplates a merger in which CBD would become our parent company, subject to shareholder approvals and other customary closing conditions. CBD and the Company are working toward completion of the Form F-4 Registration Statement and Proxy Statement, planned to be filed in the coming weeks with the Securities and Exchange Commission. While the target date for completing the merger has been repeatedly delayed, the companies currently anticipate merger closing by early in the third quarter of 2013. In the meantime, our supply relationships have been disrupted, our revenue has declined significantly and we have had to implement significant cost reductions and lay off employees.
In September 2007, we introduced our new “plug and play” solar panel technology (under the brand name “Andalay”), which we believe significantly reduces the installation time and costs, and provides superior reliability and aesthetics, when compared to other solar panel mounting products and technology. Our panel technology offers the following features: (i) mounts closer to the roof with less space in between panels; (ii) all black appearance with no unsightly racks underneath or beside panels; (iii) built-in wiring connections; (iv) approximately 70% fewer roof-assembled parts and approximately 50% less roof-top labor required; (v) approximately 25% fewer roof attachment points; (vi) complete compliance with the National Electric Code and UL wiring and grounding requirements. We have three U.S. patents (Patent No. 7,406,800, Patent No. 7,832,157 and Patent No. 7,866,098) that cover key aspects of our Andalay solar panel technology, as well as U.S. Trademark No. 3481373 for registration of the mark “Andalay.” In addition to these U.S. patents, we have 6 foreign patents. Currently, Westinghouse Solar has nine issued patents and 23 other pending U.S. and foreign patent applications that cover the Andalay technology working their way through the USPTO and foreign patent offices.
In February 2009, we announced a strategic relationship with Enphase, a leading manufacturer of microinverters, to develop and market solar panel systems with ordinary AC house current output instead of high voltage DC output. We introduced Andalay AC panel products and began offering them to our customers in the second quarter of 2009. Andalay AC panels cost less to install, are safer, and generally provide higher energy output than ordinary DC panels. Andalay AC panels deliver 5-25% more energy compared to ordinary panels, produce safe household AC power, and have built-in panel level monitoring, racking, wiring, grounding and microinverters. With 80% fewer parts and 5 – 25% better performance than ordinary DC panels, we believe Andalay AC panels are an ideal solution for solar installers, trade workers and do-it-yourself customers.
As a result of our announced exit from the solar panel installation business, our installation business has been reclassified in our financial statements as discontinued operations. The exit from the installation business was essentially completed by the end of the fourth quarter of 2010.
Concentration of Risk
Financial instruments that potentially subject us to credit risk are comprised of cash and cash equivalents, which are maintained at high quality financial institutions. At December 31, 2012 and 2011, there was approximately $0 and $1.1 million, respectively, in excess of the Federal Deposit Insurance Corporation limit of $250,000.
Disruption of Supplier Relationships
Historically, we obtained virtually all of our solar panels from Suntech. On March 25, 2011, we entered into a volume supply agreement for a new generation of our solar panel products with Lightway, and in August 2011, we began purchasing solar panels from Lightway. Both Suntech and Lightway manufacture panels for us that are built to our unique specifications. We had a limited amount of remaining inventory on hand as of December 31, 2012, and although we are actively negotiating alternative sources of supply through other sources, including a CBD Energy Limited preferred supplier, the disruption and loss of our historical primary component supply relationships is severely disruptive to our operations. In recent periods, because of our cash position and liquidity constraints, we have been late in making payments to both of our panel suppliers. On March 30, 2012, pursuant to our Supply Agreement with Lightway, we issued 1,900,000 shares of our common stock to Lightway in partial payment of our past due account payable to them. At the time of issuance, the shares were valued at $1,045,000. On May 1, 2012, Suntech America filed a lawsuit against us for breach of contract, alleging that it delivered products to us and has not received full payment, and seeking payment of approximately $990,000. On July 31, 2012, we and Suntech entered into a settlement of this dispute, which allows and requires us make payment of the account balance over time, with the unpaid balance accruing interest at 10% per annum. As of December 31, 2012, we have included in our Condensed Consolidated Balance Sheets, under accounts payable, a balance due to Suntech America of $870,000, plus accrued interest of $76,438, which is included in accrued liabilities in our Condensed Consolidated Balance Sheets. We do not anticipate that our prior supplies will make and further shipments to us, which is resulting in decreased sales and revenue for us, and adversely affecting our customer relationships. We currently do not have any unshipped orders for solar panel product pending with Suntech or Lightway and we have not received any shipments of panels since April 2012.
Concentration of Risk in Customer Relationships
The relative magnitude and the mix of revenue from our largest customers have varied significantly quarter to quarter. During the years ended December 31, 2012 and 2011, three customers have accounted for significant revenues, varying by period, to our company: Lennar Corporation (Lennar), a leading national homebuilder, Lennox International Inc. (Lennox), a global leader in the heating and air conditioning markets, and Lowe’s Companies, Inc. (Lowe’s), a nationwide home improvement retail chain. For the years ended December 31, 2012 and 2011, the percentages of sales to Lennar, Lennox and Lowe’s are as follows:
|
Twelve Months Ended December 31,
|
||||||||
|
2012
|
2011
|
|||||||
|
Lennar Corporation
|
8.8 | % | 21.5 | % | ||||
|
Lennox International Inc.
|
30.1 | % | 20.6 | % | ||||
|
Lowe’s Companies, Inc.
|
7.7 | % | 3.5 | % | ||||
We had no receivable balance from Lennar as of December 31, 2012 or 2011. Lennox accounted for 5.9% and 23.1% of our gross accounts receivable as of December 31, 2012, and 2011, respectively. Lowe’s accounted for 4.0% and 13.9% of our gross accounts receivable as of December 31, 2012, and 2011, respectively.
We maintain reserves for potential credit losses and such losses, in the aggregate, have generally not exceeded management’s estimates. Our top three vendors accounted for approximately 36.1% and 61.3% of materials purchased during the years ended December 31, 2012 and 2011, respectively. At December 31, 2012, accounts payable included amounts owed to these top three vendors of approximately $960,000. At December 31, 2011, accounts payable included amounts owed to the top three vendors of approximately $3.3 million.
Results of Operations
The following table sets forth, for the periods indicated, certain information related to our operations as a percentage of our net revenue:
|
2012
|
%
|
2011
|
%
|
|||||||||||||
|
Net revenue
|
$ | 5,222,248 | 100.0 | $ | 11,429,383 | 100.0 | ||||||||||
|
Cost of goods sold
|
5,249,121 | 100.5 | 10,380,051 | 90.8 | ||||||||||||
|
Gross profit
|
(26,873 | ) | (0.5 | ) | 1,049,332 | 9.2 | ||||||||||
|
Operating expenses
|
||||||||||||||||
|
Sales and marketing
|
2,078,830 | 39.8 | 2,271,392 | 19.9 | ||||||||||||
|
General and administrative
|
6,012,542 | 115.1 | 5,868,175 | 51.3 | ||||||||||||
|
Total operating expenses
|
8,091,372 | 154.9 | 8,139,567 | 71.2 | ||||||||||||
|
Loss from operations
|
(8,118,245 | ) | (155.5 | ) | (7,090,235 | ) | (62.0 | ) | ||||||||
|
Other income (expense)
|
||||||||||||||||
|
Interest income (expense), net
|
(103,429 | ) | (2.0 | ) | (21,260 | ) | (0.2 | ) | ||||||||
|
Adjustment to the fair value of common stock warrants
|
(416,526 | ) | (8.0 | ) | 2,592,722 | 22.7 | ||||||||||
|
Total other income (expense)
|
(519,955 | ) | (10.0 | ) | 2,571,462 | 22.5 | ||||||||||
|
Loss before provision for income taxes and discontinued operations
|
(8,638,200 | ) | (165.4 | ) | (4,518,773 | ) | (39.5 | ) | ||||||||
|
Provision for income taxes
|
— | — | ||||||||||||||
|
Net loss from continuing operations
|
(8,638,200 | ) | (165.4 | ) | (4,518,773 | ) | (39.5 | ) | ||||||||
|
Income (loss) from discontinued operations, net of tax
|
15,807 | 0.3 | (112,848 | ) | (1.0 | ) | ||||||||||
|
Net loss
|
(8,622,393 | ) | (165.1 | ) | (4,631,621 | ) | (40.5 | ) | ||||||||
|
Preferred stock dividend
|
(174,342 | ) | (3.3 | ) | (99,047 | ) | (0.9 | ) | ||||||||
|
Preferred deemed dividend
|
(362,903 | ) | (6.9 | ) | (975,460 | ) | (8.5 | ) | ||||||||
|
Net loss attributable to common stockholders
|
$ | (9,159,638 | ) | (175.4 | ) | $ | (5,706,128 | ) | (49.9 | ) | ||||||
|
Net loss per common and common equivalent share attributable to common shareholders (basic and diluted)
|
$ | (0.46 | ) | $ | (0.46 | ) | ||||||||||
|
Weighted average shares used in computing loss per common share: (basic and diluted)
|
19,400,724 | 12,342,655 | ||||||||||||||
Year Ended December 31, 2012 as compared to Year Ended December 31, 2011
Net revenue
We generate revenue from the sale of solar power systems. For the year ended December 31, 2012, we generated $5.2 million of revenue, a decrease of $6.2 million, or 54.3%, compared to $11.4 million of revenue for the year ended December 31, 2011. The decrease in revenue was due to a decrease in unit volume of product sales to our dealer network and strategic partners, lower average selling prices, limited inventory levels due to severe, ongoing supplier relationship issues, and the overall soft solar market conditions following punitive tariff announcements in the U.S. related to solar modules manufactured in China. In addition, as of December 31, 2012, we had no current or unshipped orders for solar panel product pending with Suntech. Our supply relationship with Lightway is stalled. We are actively negotiating an alternative supplier through a CBD Energy Limited preferred supplier. Unless we rapidly secure alternative, cost competitive source of supply, our inventory will be depleted and our revenue will diminish significantly, causing disruption to our operations.
Cost of goods sold as a percent of revenue for the year ended December 31, 2012, was 100.5% of net revenue, compared to 90.8% for the year ended December 31, 2011. Gross loss for the year ended December 31, 2012 was $27,000, or 0.5% of revenue, compared to gross profit of $1.0 million or 9.2% of revenue for the same period in 2011. During the year ended December 31, 2012, we recorded a $206,000 non-cash inventory write-down, a $65,000 write-off of accumulated inventory overhead costs and a $112,000 non-cash inventory write-off, representing 7.3% of revenue in total. The $206,000 write-down was an adjustment to the carrying value of our older, smaller-format solar panels and older microinverter inventory to reflect the decline in market prices compared to our original cost and the $112,000 was an inventory write-off of obsolete inventory. The decrease in gross margin for the year ended December 31, 2012 compared to the year ended December 31, 2011, was due to the inventory revaluation, higher inventory overhead allocations related to lower revenue volume, and lower average selling prices, partially offset by a decline in panel and component costs. Excluding the inventory revaluation of $383,000, gross profit would have been $356,000 or 6.8% of revenue.
Sales and marketing expenses
Sales and marketing expenses for the year ended December 31, 2012 were $2.1 million, or 39.8% of net revenue as compared to $2.3 million, or 19.9% of net revenue during the same period of the prior year. The $193,000 decrease in sales and marketing expenses for the year ended December 31, 2012 compared to the same period in 2011, was primarily due to decreases in payroll and commission costs of $211,000, travel of $52,000 and advertising and trade shows of $242,000, partially offset by an increase in licensing fees we owe to Westinghouse Electric Corporation of $250,000 for 2012.
General and administrative expenses
General and administrative expenses for the year ended December 31, 2012 were $6.0 million, or 115.1% of net revenue as compared to $5.9 million, or 51.3% of net revenue during the same period of the prior year. The increase in general and administrative expense for the year ended December 31, 2012 was due primarily to increases in legal fees of $915,000, bad debt expense of $451,000 and professional fees of $380,000, partially offset by lower payroll and payroll tax costs of $866,000. The increase in legal and professional fees related to the pending CBD merger transaction and patent litigation settled in May 2012. The increase in bad debt expense was driven by a $400,000 non-cash write-down of a receivable from a supplier reflected in “Other Receivables” in our Condensed Consolidated Balance Sheets.
Interest, net
During the year ended December 31, 2012, net interest expense was approximately $103,000 compared with net interest expense of $21,000 for the same period in 2011, due to interest incurred related to the settlement agreement with Suntech.
Adjustment to the fair value of common stock warrants
During the year ended December 31, 2012, we recorded mark-to-market adjustments to reflect the fair value of outstanding common stock warrants accounted for as a liability, resulting in an unrealized loss of $417,000 in our condensed consolidated statements of operations. The fair value of the warrants is lower now primarily due to a decrease in the price of our common stock and a shorter life for the remainder of our outstanding warrants. During the year ended December 31, 2011, we recorded mark-to-market adjustments resulting in a $2.6 million unrealized gain in our condensed consolidated statements of operations.
Income taxes
During the years ended December 31, 2012 and 2011, there was no income tax expense or benefit for federal and state income taxes reflected in our condensed consolidated statements of operations due to our net loss and a valuation allowance on the resulting deferred tax asset.
Net loss from continuing operations
Net loss from continuing operations for the year ended December 31, 2012 was $8.6 million, or $0.46 per share, compared to a net loss from continuing operations of $4.5 million, or $0.46 per share, for the year ended December 31, 2011. For the year ended December 31, 2012, the net loss includes an unfavorable non-cash adjustment to the fair value of common stock warrants of $417,000 compared with a favorable non-cash adjustment to the fair value of the common stock warrants of $2.6 million for the year ended December 31, 2011. Excluding the impact of the common stock warrant adjustments in both periods, net loss from continuing operations for the year ended December 31, 2012 was $8.2 million, or $0.44 per share, compared to a net loss of $7.1 million, or $0.66 per share, for the same period in 2011.
Gain (loss) from discontinued operations
During the year ended December 31, 2012, we recorded a $16,000 net gain from the discontinuance of our installation business segment, compared with a loss of $113,000 during the same period in 2011.
Preferred deemed dividend
On October 18, 2012, we entered into a securities purchase agreement with certain institutional accredited investors relating to the sale and issuance of up to 1,245 shares of our newly created Series C Preferred Stock, for aggregate proceeds of up to $1,245,000. At the initial closing, we sold and issued 750 shares of Series C Preferred, for initial aggregate proceeds of $750,000. On November 2, 2012, we provided to the purchasers of our Series C Preferred Stock a draw down notice under the Purchase Agreement. As a result of the draw down, we sold an aggregate of 350 additional shares of our Series C Preferred to the purchasers for aggregate proceeds of $350,000. Based on the closing price of our common stock as reported on the OTCQB Marketplace (OTCQB) on November 2, 2012 (which was $0.08 per share), the 350 shares of Series C Preferred issued pursuant to the draw down was convertible into 4,375,000 shares of our common stock. As a result of the contingent conversion feature on the Series C Preferred, which reduced the conversion price from $0.155 to $0.08 per share on the total 750 shares of Series C Preferred Stock issued and outstanding at November 2, 2012, and which resulted in an increase in the number of common shares issuable, we recognized a preferred deemed dividend of $362,000. The net loss attributable to common shareholders reflects both the net loss and the deemed dividend.
In connection with our sale of Series B Preferred Stock and Series K Warrants on February 17, 2011, on the date of issuance, we recorded the fair value of the warrants of $2.6 million as “Common stock warrant liability” with the residual value of $975,460 allocated to “Convertible redeemable preferred stock.” We used the Black-Scholes model to value the Series K warrants. For purposes of calculating the fair value of the warrants, we used a risk free rate of return of 1.4%, an expected life of 4.1 years and a volatility percentage of 103.2%. We also recorded the beneficial conversion feature of $975,460 as a preferred deemed dividend. The amount of the beneficial conversion feature was limited to the amount of proceeds allocated to the instrument. In addition, direct fundraising costs of approximately $532,000 and warrants to purchase 60,000 shares of our common stock issued to the placement agent, valued at $89,010, were deducted from the proceeds raised.
Liquidity and Capital Resources
The current economic downturn presents us with challenges in meeting the working capital needs of our business. Our primary requirements for working capital are to fund purchases for solar panels and microinverters, and to cover our payroll and lease expenses. For each of the two years in the period ending December 31, 2012, we have incurred net losses and negative cash flows from operations. During the recent years, we have undertaken several equity financing transactions to provide the capital needed to sustain our business. We have dramatically reduced our headcount and other variable expenses. In addition, we expect to incur a net loss from operations for the year ending December 31, 2013. Based on current cash projections for 2013, we intend to address ongoing working capital needs through cost reduction measures and liquidation of remaining inventory, along with raising additional equity. In January 2013, our board of directors approved actions to dramatically reduce our variable operating costs, including a 12 person employee headcount reduction effective January 15, 2013, for the period through the anticipated merger closing with CBD. No restructuring charges or severance payments were incurred. While the targeted date for completing the merger has been repeatedly delayed, the companies currently anticipate merger closing by early in the third quarter of 2013. In the event that revenue is lower or the merger is delayed further, additional staffing reductions and expense cuts could occur. Our revenue levels remain difficult to predict, and we anticipate that we will continue to sustain losses in the near term, and we cannot assure investors that we will be successful in reaching break-even.
As of December 31, 2012, we had approximately $127,000 in cash on hand. Our potentially available $750,000 credit facility is subject to limitations based on the level of our qualifying accounts receivable, and at December 31, 2012, we had no qualifying accounts receivable. In addition, due to Suntech entering judgment against us on March 15, 2013, our credit facility is currently unavailable. Under the Merger Agreement we entered into with CBD, we are required to raise sufficient equity capital, with the cooperation and support of CBD, to meet our own liquidity and working capital requirements. In addition, prior to closing of the merger, CBD may provide capital funding support to us if necessary, subject to conditions and limitations as provided in the Merger Agreement.
In recent months, because of our cash position and liquidity constraints, we have been late in making payments to both of our panel suppliers. We had a limited amount of remaining inventory on hand as of December 31, 2012. We do not have any unshipped orders for solar panel product pending with Suntech, and our supply relationship with Lightway is currently stalled. We are actively negotiating alternative sources of supply through other sources, including a CBD Energy Limited preferred supplier. Although we believe we can find alternative suppliers for solar panels manufactured to our specifications, our operations will be disrupted further unless we are able to rapidly secure alternative sources of supply, our inventory and revenue could diminish significantly, causing disruption to our operations in recent quarters.
The accompanying consolidated financial statements have been prepared assuming we will continue as a going concern. Our significant operating losses, negative cash flow from operations, and challenges in rapidly securing alternative sources of supply for solar panels, raise substantial uncertainty about our ability to continue as a going concern. The accompanying financial statements do not include any adjustments that might result from the outcome of this uncertainty, and contemplate the realization of assets and the settlement of liabilities and commitments in the normal course of business. There can be no assurance that we will be able to raise additional funds on commercially reasonable terms, if at all. The current economic downturn adds uncertainty to our anticipated revenue levels and to the timing of cash receipts, which are needed to support our operations. It also worsens the market conditions for seeking equity and debt financing. As a result of our delisting from the Nasdaq Capital Market in September 2012, we are no longer eligible to file new registration statements on Form S-3, which may make it more costly and more difficult for us to obtain additional equity financing. We currently anticipate that we will retain all of our earnings, if any, for development of our business and do not anticipate paying any cash dividends on common stock in the foreseeable future.
Our Line of Credit
On February 15, 2011, we entered into the 2011 Credit Facility with Bridge Bank to finance our accounts receivables. The 2011 Credit Facility provides for a credit limit of $750,000, representing the maximum amount of advances based on up to 50% of $1.5 million of gross eligible accounts receivables. The 2011 Credit Facility may be terminated at any time by either party and may be renewed under similar terms if acceptable and agreed to by the parties. If any advance is not repaid in full within 90 days from the earlier of (a) invoice date, or (b) the date on which such advance is made, we are obligated to immediately pay the outstanding amount to Bridge Bank. Outstanding loans under the 2011 Credit Facility will accrue interest at the Bridge Bank Prime rate plus 3.0% (annualized) of the daily gross financed amount outstanding. The 2011 Credit Facility is secured by substantially all of our assets. As of December 31, 2012, we had no outstanding amounts borrowed under the 2011 Credit Facility. We had no qualifying accounts receivable at December 31, 2012 and therefore no available borrowing capacity. In addition, due to Suntech entering judgment against us on March 15, 2013, our credit facility is currently unavailable.
Equity Financing Activity
On February 17, 2011, we entered into a securities purchase agreement with certain institutional accredited investors relating to the sale of 4,000 units at a price of $900 per unit. Each unit consists of (i) one share of Series B Preferred Stock, convertible into shares of common stock, and (ii) warrants to purchase shares of common stock, which warrants were not exercisable until six months after issuance and have a term of five years from the date of first exercisability. The aggregate purchase price for the Securities was $3,600,000. As a result of several equity financings after the sale of the foregoing units, the conversion price of the Series B Preferred and the exercise price of the Series K Warrants have been reduced. Currently, the conversion price of the Series B Preferred is $0.05 per share of common stock and the exercise price of the Series K warrant is $0.40 per share of common stock. As of December 31, 2012, 1,757 shares of preferred stock had been converted into 1,152,601 shares of common stock.
On August 16, 2011, we entered into a securities purchase agreement with an institutional accredited investor relating to the sale of 990,099 shares of common stock at a price of $1.01 per share, along with the sale of Series L Warrants to purchase up to 643,564 shares of common stock (65% of the number of shares of common stock initially issued) at an exercise price of $1.17 per share. The warrants were not exercisable until six months after issuance and have a term of five years from the date they are first exercisable. The aggregate purchase price for the shares and the warrants was $1,000,000. Under the securities purchase agreement, we agreed to amend the outstanding Series J Warrants, such that the exercise price of the Series J Warrants was reduced from $2.44 per share to $1.17 per share. In addition, each of the Series J Warrants, (i) was not exercisable until the six month anniversary of the closing under the August 16, 2011 securities purchase agreement, and (ii) the expiration date is extended such that the warrant is exercisable for five years from the delayed initial exercise date. The outstanding Series J Warrants were originally issued on October 7, 2010, and represent the right to purchase up to an aggregate of 400,001 shares of common stock.
On September 28, 2011, we entered into a securities purchase agreement with an institutional accredited investor relating to the sale of 500,000 shares of common stock at a price of $0.80 per share, along with the sale of Series M Warrants to purchase up to 325,000 shares of common stock (65% of the number of shares of common stock initially issued) at an exercise price of $0.81 per share. The warrants were not exercisable until six months after issuance and have a term of five years from the date they are first exercisable. The aggregate purchase price for the shares and the warrants was $500,000. Under the securities purchase agreement, we agreed to amend the outstanding Series L Warrants, such that the exercise price of the Series L Warrants was reduced from $1.17 per share to $0.81 per share. In addition, each of the Series L Warrants, (i) was not exercisable until the six month anniversary of the closing under the September 28, 2011 securities purchase agreement, and (ii) the expiration date was extended such that the warrant is exercisable for five years from the delayed initial exercise date. The outstanding Series L Warrants were originally issued on August 16, 2011, and represent the right to purchase up to an aggregate of 643,564 shares of common stock.
On December 30, 2011, we entered into a securities purchase agreement with CBD, relating to the sale of 1,666,667 shares of common stock at a price of $0.60 per share. The aggregate purchase price was $1,000,000. See previous discussion in Liquidity and Capital resources on proposed merger with CBD.
On March 30, 2012, we entered into an amendment with the outstanding Series K warrants (Series K Amendment) removing the provision for any future price adjustment to the exercise price. On March 30, 2012, the fair value of the warrants was estimated using Black-Scholes with the following weighted average assumptions: risk-free interest rate of 0.5%, an expected life of 3.0 years; an expected volatility factor of 109.3% and a dividend yield of 0.0%. The fair value of the warrants decreased to $481,000 as of March 30, 2012 and we recognized a $425,000 unfavorable non-cash adjustment from the change in fair value of these warrants during the three months ended March 31, 2012. As a result of the March 30, 2012 Series K Amendment the fair value of the warrants of $481,000 was reclassified from warrant liability to equity.
On March 30, 2012, pursuant to our supply agreement with Lightway, we issued 1,900,000 share of our common stock to them. The shares were issued at $0.55 per share based on the latest closing sale price on the date of issuance.
On August 14, 2012, we entered into a securities purchase agreement with an institutional accredited investor relating to the sale of 2,000,000 shares of our common stock at a price of $0.25 per share. The aggregate purchase price was $500,000.
On October 18, 2012, we entered into a securities purchase agreement with certain institutional accredited investors relating to the sale and issuance of up to 1,245 shares of our newly created Series C 8% Convertible Preferred Stock at a price of $1,000 per share, for aggregate proceeds of up to $1,245,000. At the initial closing, we sold and issue 750 shares of Series C Preferred, for initial aggregate proceeds of $750,000. Subsequently, on November 2, 2012, we sold and issued 350 shares of Series C Preferred for proceeds of $350,000. On January 24, 2013, we provided to the purchasers a draw down notice under the Purchase Agreement. The purchasers agreed to accept the new draw down notice and thereby extend our right to exercise a “put” to sell additional Series C Preferred beyond the Securities Purchase Agreement’s prior expiration date of December 31, 2012. As a result of the draw down, we sold an aggregate of 75 additional shares of its Series C Preferred to the purchasers for aggregate proceeds of $75,000.
On February 15, 2013, we entered into a securities purchase agreement with an institutional accredited investors relating to the sale and issuance of up to 1,000 shares of our newly created Series D 8% Convertible Preferred Stock (Series D Preferred) at a price per share equal to the stated value, which is $1,000 per share, for aggregate proceeds of up to $1,000,000. At the initial closing, concurrent with entering the agreement, we issued 150 shares of Series D Preferred, for initial aggregate proceeds of $150,000. After the initial closing, the Securities Purchase Agreement permits the purchaser to exercise a “call” right to purchase additional Series D Preferred in multiple draw downs from time to time until December 31, 2013, subject to certain limits, terms and conditions. In March 2013, the company and investors entered into a letter agreement to the Securities Purchase Agreement dated as of February 15, 2013, modifying the number of shares of Series D Preferred Stock to be issued upon settlement of any purchaser draw downs made on or after March 18, 2013, equal to the purchaser investment amount divided by the stated value multiplied by a number agreed upon by the Company and the Purchaser, which shall not be higher than 1.67. Subsequently, on March 21, 2013, we issued 167 shares of Series D Preferred for aggregate proceeds of $100,000.
Cash flow analysis
Our primary capital requirement is to fund purchases of solar panels and inverters. Significant sources of liquidity are cash on hand, cash flows from operating activities, working capital and proceeds from equity financings. As of December 31, 2012, we had approximately $127,000 in cash on hand. Our potentially available $750,000 credit facility is subject to limitations based on the level of our qualifying accounts receivable, and at December 31, 2012, we had no qualifying accounts receivable. In addition, due to Suntech entering judgment against us on March 15, 2013, our credit facility is currently unavailable.
Cash used in operating activities was approximately $2.5 million for the years ended December 31, 2012. Excluding non-cash items of $704,000 of stock-based compensation expense, $485,000 in bad debt expense and $417,000 of unrealized loss on the fair value adjustment of common stock warrants cash used in operating activities was primarily due to a $625,000 increase in other assets, a $172,000 increase in accrued liabilities and accrued warranty and a $509,000 decrease in accounts payable, offset by a $2.9 million decrease in inventory, a $646,000 decrease in accounts receivable, and a $559,000 decrease in prepaid expenses and other current assets. Cash used in operating activities was approximately $4.5 million for the year ended December 31, 2011. Excluding non-cash items of $2.6 million of unrealized gain on the fair value adjustment of common stock warrants and stock-based compensation expense of $1.1 million, cash used in operating activities was primarily due to a $536,000 increase in other assets, a $454,000 increase in other receivables, a $384,000 decrease in liabilities of discontinued operations and a $218,000 increase in accounts receivable, offset by a $2.4 million increase in accounts payable and a $531,000 decrease in assets of discontinued operations – short term. The increases and decreases in assets and liabilities were primarily due to the timing of payments and receipts.
During the year ended December 31, 2012, cash provided by investing activities was $3,000 from proceeds from disposal of property and equipment. Cash provided by investing activities was $180,000 for the December 31, 2011, primarily due to $235,000 in proceeds from disposal of property and equipment from discontinued operations and $19,000 in proceeds from disposal of property and equipment, partially offset by $73,000 in acquisitions of property and equipment.
Cash provided by financing activities was approximately $1.3 million for the year ended December 31, 2012. During the year ended December 31, 2012, we received $1.1 million in proceeds from a preferred stock offering, less $45,000 in payment of placement agent fees, $500,000 in proceeds from a securities purchase agreement, less $183,000 in payment of placement agent and registration fees and $283,000 from the exercise of warrants, partially offset by the repayment of notes payable of $283,000 and the repayment of $92,000 on our line of credit. Cash provided by financing activities was approximately $5.1 million for the year ended December 31, 2011. During the year ended December 31, 2011, we received net proceeds of $5.2 million from the issuance of common and preferred stock, partially offset by the repayment of notes payable of $168,000.
Application of Critical Accounting Policies and Estimates
The preparation of financial statements in conformity with accounting principles generally accepted in the United States requires estimates and assumptions that affect the reporting of assets, liabilities, sales and expenses, and the disclosure of contingent assets and liabilities. Note 2 to our consolidated financial statements as filed in our Annual Report on Form 10-K provides a summary of our significant accounting policies, which are all in accordance with generally accepted accounting policies in the United States. Certain of our accounting policies are critical to understanding our consolidated financial statements, because their application requires management to make assumptions about future results and depends to a large extent on management’s judgment, because past results have fluctuated and are expected to continue to do so in the future.
We believe that the application of the accounting policies described in the following paragraphs is highly dependent on critical estimates and assumptions that are inherently uncertain and highly susceptible to change. For all these policies, we caution that future events rarely develop exactly as estimated, and the best estimates routinely require adjustment. On an ongoing basis, we evaluate our estimates and assumptions, including those discussed below.
Revenue recognition. Revenue from sales of products is recognized when: (1) persuasive evidence of an arrangement exists, (2) delivery has occurred or services have been rendered, (3) the sale price is fixed or determinable, and (4) collection of the related receivable is reasonably assured. We recognize revenue when the solar power systems are shipped to the customer.
Discontinued operations. Discontinued operations are presented and accounted for in accordance with Accounting Standards Codification (ASC) 360, “Impairment or Disposal of Long-Lived Assets,” (ASC 360). When a qualifying component of the Company is disposed of or has been classified as held for sale, the operating results of that component are removed from continuing operations for all periods presented and displayed as discontinued operations if: (a) elimination of the component’s operations and cash flows from the Company’s ongoing operations has occurred (or will occur) and (b) significant continuing involvement by the Company in the component’s operations does not exist after the disposal transaction. On September 10, 2010, we announced that we were exiting the solar panel installation business. The exit from the installation business was essentially completed at the end of the fourth quarter of 2010. The exit from the installation business was therefore classified as discontinued operations for all periods presented under the requirements of ASC 360.
Inventory. Inventory is stated at the lower of cost (on an average basis) or market value. We determine cost based on our weighted-average purchase price and include both the costs of acquisition and the shipping costs in our inventory. We regularly review the cost of inventory against its estimated market value and record a lower of cost or market write-down to cost of goods sold, if any inventory has a cost in excess of estimated market value. Our inventory generally has a long life cycle and obsolescence has not historically been a significant factor in its valuation.
Long-lived assets. We periodically review our property and equipment and identifiable intangible assets for possible impairment whenever facts and circumstances indicate that the carrying amount may not be fully recoverable. Assumptions and estimates used in the evaluation of impairment may affect the carrying value of long-lived assets, which could result in impairment charges in future periods. Significant assumptions and estimates include the projected cash flows based upon estimated revenue and expense growth rates and the discount rate applied to expected cash flows. In addition, our depreciation and amortization policies reflect judgments on the estimated useful lives of assets.
Patent Costs. We capitalize external legal costs and filing fees associated with obtaining or defending our patents and amortize these costs using the straight-line method over the shorter of the legal life of the patent or its economic life. We believe the remaining useful lives we assigned to these assets, approximately 12 years as of December 31, 2012, are reasonable. We periodically review our patents to determine whether any such costs have been impaired and are no longer being used. To the extent we no longer use certain patents, the associated costs will be written-off at that time.
Stock-based compensation. We use the Black-Scholes-Merton Options Pricing Model (Black-Scholes) to estimate fair value of our employee and our non-employee director stock-based awards. Black-Scholes requires various judgmental assumptions, including estimating stock price volatility, expected option life and forfeiture rates. We measure compensation expense for non-employee stock-based compensation under ASC 505-50, “Equity-Based Payments to Non-Employees.” The fair value of the option issued is used to measure the transaction, as this is more reliable than the fair value of the services received. The estimated fair value is measured utilizing Black-Scholes using the value of our common stock on the date that the commitment for performance by the counterparty has been reached or the counterparty’s performance is complete.
Warranty provision. The manufacturer directly warrants the solar panels and inverters for a range from 15 to 25 years. We warrant the balance of system components of our products against defects in material and workmanship for five years. We assist our customers in the event of a claim under the manufacturer warranty to replace a defective solar panel or inverter.
Off-Balance Sheet Arrangements
We do not have any off-balance sheet arrangements (as defined in the applicable regulations) that have or are reasonably likely to have a current or future effect on our financial condition, changes in financial condition, revenues or expenses, results of operations, liquidity, capital expenditures or capital resources.
Inflation
We believe that inflation has not had a material impact on our historical results of operations; however, there can be no assurance that our business will not be affected by inflation in the future.
Seasonality
Our quarterly operating results may vary significantly from quarter to quarter as a result of seasonal changes in weather as well as state or Federal subsidies. Historically, sales are highest during the third and fourth quarters as a result of good weather and robust bookings in the second quarter.
Item 7A. Quantitative and Qualitative Disclosures About Market Risk.
Market risk represents the risk of changes in the value of market risk sensitive instruments caused by fluctuations in interest rates, foreign exchange rates and commodity prices. Changes in these factors could cause fluctuations in our results of operations and cash flows. In the ordinary course of business, we are exposed to interest rate risk. Fluctuations in interest rates could adversely affect our financial results.
Interest Rate Risk
Our exposure to interest rate risk at December 31, 2012 is primarily related to our outstanding balance on our 2011 Credit Facility. As of December 31, 2012, there was nothing outstanding under the 2011 Credit Facility. If we were to borrow the maximum $750,000 under the 2011 Credit Facility, interest would accrue at the rate of the Bridge Bank Prime rate plus 3.0%.
Foreign Currency Exchange Risk
We do not have any foreign currency exchange risk as product we purchase from manufacturers outside the United States are denominated in U.S. currency.
Item 8. Financial Statements and Supplementary Data.
REPORT OF INDEPENDENT REGISTERED PUBLIC ACCOUNTING FIRM
To the Board of Directors and Stockholders of
Westinghouse Solar, Inc.
We have audited the accompanying consolidated balance sheets of Westinghouse Solar, Inc. and its subsidiaries (the “Company”) as of December 31, 2012 and 2011, and the related consolidated statements of operations, stockholders’ equity (deficit) and cash flows in the two year period ended December 31, 2012. These consolidated financial statements are the responsibility of the Company’s management. Our responsibility is to express an opinion on these consolidated financial statements based on our audits.
We conducted our audits in accordance with the standards of the Public Company Accounting Oversight Board (United States). Those standards require that we plan and perform the audit to obtain reasonable assurance about whether the financial statements are free of material misstatement. The Company is not required to have, nor were we engaged to perform, an audit of its internal control over financial reporting. Our audits included consideration of internal control over financial reporting as a basis for designing audit procedures that are appropriate in the circumstances, but not for the purpose of expressing an opinion on the effectiveness of the Company’s internal control over financial reporting. Accordingly, we express no such opinion. An audit also includes examining, on a test basis, evidence supporting the amounts and disclosures in the financial statements, assessing the accounting principles used and significant estimates made by management, as well as evaluating the overall financial statement presentation. We believe that our audits provide a reasonable basis for our opinion.
In our opinion, the consolidated financial statements referred to above, present fairly, in all material respects, the financial position of Westinghouse Solar, Inc. and its subsidiaries as of December 31, 2012 and 2011, and the results of their operations and their cash flows for each of the years then ended in conformity with accounting principles generally accepted in the United States of America.
The accompanying consolidated financial statements have been prepared assuming that the Company will continue as a going concern. As discussed in Note 2 to the financial statements, the Company’s significant operating losses and negative cash flow from operations raise substantial doubt about its ability to continue as a going concern. The financial statements do not include any adjustments that might result from the outcome of this uncertainty.
/s/ Burr Pilger Mayer, Inc
San Francisco, California
March 28, 2013
Westinghouse Solar, Inc.
Consolidated Balance Sheets
|
December 31,
2012
|
December 31,
2011
|
|||||||
|
Assets
|
||||||||
|
Current assets:
|
||||||||
|
Cash and cash equivalents
|
$ | 127,385 | $ | 1,346,777 | ||||
|
Accounts receivable, net
|
365,845 | 1,096,580 | ||||||
|
Other receivables
|
121,990 | 469,469 | ||||||
|
Inventory, net
|
995,713 | 4,172,809 | ||||||
|
Prepaid expenses and other current assets
|
420,108 | 978,709 | ||||||
|
Assets of discontinued operations
|
10,896 | 87,455 | ||||||
|
Assets held for sale – discontinued operations
|
— | 18,293 | ||||||
|
Total current assets
|
2,041,937 | 8,170,092 | ||||||
|
Property and equipment, net
|
46,877 | 196,718 | ||||||
|
Patents, net
|
1,329,046 | 103,920 | ||||||
|
Other assets, net
|
183,258 | 851,650 | ||||||
|
Assets of discontinued operations – long-term
|
200,000 | 209,913 | ||||||
|
Total assets
|
$ | 3,801,118 | $ | 9,532,293 | ||||
|
Liabilities and Stockholders’ Equity (Deficit)
|
||||||||
|
Current liabilities:
|
||||||||
|
Accounts payable
|
$ | 3,329,537 | $ | 3,865,039 | ||||
|
Accrued liabilities
|
488,956 | 428,813 | ||||||
|
Accrued warranty
|
329,680 | 217,812 | ||||||
|
Common stock warrant liability
|
9 | 317,490 | ||||||
|
Credit facility
|
— | 92,266 | ||||||
|
Capital lease obligations – current portion
|
4,385 | 4,699 | ||||||
|
Note payable – current portion
|
— | 283,252 | ||||||
|
Liabilities of discontinued operations – short-term
|
1,052,819 | 1,308,820 | ||||||
|
Total current liabilities
|
5,205,386 | 6,518,191 | ||||||
|
Capital lease obligations, less current portion
|
328 | 4,713 | ||||||
|
Long-term liabilities of discontinued operations
|
— | 10,200 | ||||||
|
Total liabilities
|
5,205,714 | 6,533,104 | ||||||
|
Commitments, contingencies and subsequent events (Notes 16 and 19)
|
||||||||
|
Series C convertible redeemable preferred stock, $0.001 par value; 800 and 0 shares issued and outstanding on December 31, 2012 and 2011, respectively
|
983,747 | — | ||||||
|
Stockholders’ equity (deficit):
|
||||||||
|
Series B convertible redeemable preferred stock, $0.001 par value; 2,243 and 2,273 shares issued and outstanding on December 31, 2012 and 2011, respectively
|
741,171 | 751,223 | ||||||
|
Common stock, $0.001 par value; 100,000,000 shares authorized; 26,924,643 and 16,040,581 shares issued and outstanding at December 31, 2012 and 2011, respectively (Note 1)
|
26,925 | 16,041 | ||||||
|
Additional paid-in capital
|
76,455,054 | 72,683,781 | ||||||
|
Accumulated deficit
|
(79,611,493 | ) | (70,451,856 | ) | ||||
|
Total stockholders’ equity (deficit)
|
(2,388,343 | ) | 2,999,189 | |||||
|
Total liabilities and stockholders’ equity (deficit)
|
$ | 3,801,118 | $ | 9,532,293 | ||||
The accompanying notes are an integral part of these consolidated financial statements.
Westinghouse Solar, Inc.
Consolidated Statements of Operations
|
2012
|
2011
|
|||||||
|
Net revenue
|
$ | 5,222,248 | $ | 11,429,383 | ||||
|
Cost of goods sold
|
5,249,121 | 10,380,051 | ||||||
|
Gross profit
|
(26,873 | ) | 1,049,332 | |||||
|
Operating expenses
|
||||||||
|
Sales and marketing
|
2,078,830 | 2,271,392 | ||||||
|
General and administrative
|
6,012,542 | 5,868,175 | ||||||
|
Total operating expenses
|
8,091,372 | 8,139,567 | ||||||
|
Loss from operations
|
(8,118,245 | ) | (7,090,235 | ) | ||||
|
Other income (expense)
|
||||||||
|
Interest income (expense), net
|
(103,429 | ) | (21,260 | ) | ||||
|
Adjustment to the fair value of common stock warrants
|
(416,526 | ) | 2,592,722 | |||||
|
Total other income (expense)
|
(519,955 | ) | 2,571,462 | |||||
|
Loss before provision for income taxes and discontinued operations
|
(8,638,200 | ) | (4,518,773 | ) | ||||
|
Provision for income taxes
|
— | — | ||||||
|
Net loss from continuing operations
|
(8,638,200 | ) | (4,518,773 | ) | ||||
|
Income (loss) from discontinued operations, net of tax
|
15,807 | (112,848 | ) | |||||
|
Net loss
|
(8,622,393 | ) | (4,631,621 | ) | ||||
|
Preferred stock dividend
|
(174,342 | ) | (99,047 | ) | ||||
|
Preferred deemed dividend
|
(362,903 | ) | (975,460 | ) | ||||
|
Net loss attributable to common stockholders
|
$ | (9,159,638 | ) | $ | (5,706,128 | ) | ||
|
Net loss per common and common equivalent share (basic and diluted) attributable to common shareholders
|
$ | (0.46 | ) | $ | (0.46 | ) | ||
|
Weighted average shares used in computing loss per common share: (basic and diluted)
|
19,400,724 | 12,342,655 | ||||||
The accompanying notes are an integral part of these consolidated financial statements.
Westinghouse Solar, Inc.
Consolidated Statements of Changes in Stockholders’ Equity (Deficit)
|
Series C Convertible Redeemable Preferred Stock
|
Series B Convertible Redeemable Preferred Stock
|
Common Stock
|
||||||||||||||||||||||||||||||||||
|
Number of Shares
|
Amount
|
Number of Shares
|
Amount
|
Number of Shares
|
Amount
|
Additional Paid-in Capital
|
Accumulated Deficit
|
Stockholders' Equity (Deficit)
|
||||||||||||||||||||||||||||
|
Balance at January 1, 2011
|
— | $ | — | — | $ | — | 11,442,438 | $ | 11,442 | $ | 68,683,205 | $ | (64,745,728 | ) | $ | 3,948,919 | ||||||||||||||||||||
|
Issuance of Series B redeemable convertible preferred stock and common stock warrants
|
— | — | 4,000 | 354,545 | — | — | 89,011 | — | 443,556 | |||||||||||||||||||||||||||
|
Conversion of convertible redeemable preferred stock to common stock
|
— | — | (1,727 | ) | (578,782 | ) | 891,601 | 892 | 577,890 | — | — | |||||||||||||||||||||||||
|
Preferred deemed dividend
|
— | — | — | 975,460 | — | — | — | (975,460 | ) | — | ||||||||||||||||||||||||||
|
Preferred stock dividends paid in common stock
|
— | — | — | — | 105,682 | 106 | 98,941 | (99,047 | ) | — | ||||||||||||||||||||||||||
|
Issuance of common stock pursuant to August and September 2011 Securities Purchase Agreements
|
— | — | — | — | 3,156,766 | 3,157 | 2,106,127 | — | 2,109,284 | |||||||||||||||||||||||||||
|
Issuance of common stock for supply agreement
|
— | — | 150,464 | 150 | 99,758 | — | 99,908 | |||||||||||||||||||||||||||||
|
Grants of restricted stock, net of forfeitures and repurchases for employee taxes
|
— | — | — | — | 293,630 | 294 | (24,629 | ) | — | (24,335 | ) | |||||||||||||||||||||||||
|
Stock-based compensation expense
|
— | — | — | — | — | — | 1,053,478 | — | 1,053,478 | |||||||||||||||||||||||||||
|
Net loss
|
— | — | — | — | — | — | — | (4,631,621 | ) | (4,631,621 | ) | |||||||||||||||||||||||||
|
Balance at December 31, 2011
|
— | — | 2,273 | 751,223 | 16,040,581 | 16,041 | 72,683,781 | (70,451,856 | ) | 2,999,189 | ||||||||||||||||||||||||||
|
Issuance of common stock pursuant to a securities purchase agreement
|
— | — | — | — | 2,000,000 | 2,000.00 | 498,000 | — | 500,000 | |||||||||||||||||||||||||||
|
Issuance of common stock for supply agreement
|
— | — | — | — | 2,110,647 | 2,111 | 1,140,690 | — | 1,142,801 | |||||||||||||||||||||||||||
|
Issuance of Series C Convertible preferred stock a for cash
|
1,100 | 1,100,000 | — | — | — | — | — | — | — | |||||||||||||||||||||||||||
|
Preferred deemed dividend
|
— | 362,903 | — | — | — | — | — | (362,903 | ) | (362,903 | ) | |||||||||||||||||||||||||
|
Conversion of convertible redeemable preferred stock to common stock
|
(300 | ) | (434,156 | ) | (30 | ) | (10,052 | ) | 4,011,000 | 4,011 | 440,197 | — | 434,156 | |||||||||||||||||||||||
|
Conversion of common stock warrant liability upon exercise of warrants
|
— | — | — | — | — | — | 734,007 | — | 734,007 | |||||||||||||||||||||||||||
|
Convertible Redeemable Preferred Stock dividends paid in common stock
|
— | — | — | — | 1,465,304 | 1,465 | 172,876 | (174,341 | ) | — | ||||||||||||||||||||||||||
|
Exercise of warrants for common shares, $0.001 par value
|
— | — | — | — | 472,222 | 472 | 282,861 | — | 283,333 | |||||||||||||||||||||||||||
|
Placement agent and registration fees and other direct costs
|
— | (45,000 | ) | — | — | — | — | (183,180 | ) | — | (183,180 | ) | ||||||||||||||||||||||||
|
Grants of restricted stock, net of forfeitures and upon exercise or expiration of warrants
|
— | — | — | — | 824,889 | 825 | (18,366 | ) | — | (17,541 | ) | |||||||||||||||||||||||||
|
Stock-based compensation
|
— | — | — | — | — | — | 704,188 | 704,188 | ||||||||||||||||||||||||||||
|
Net loss
|
— | — | — | — | — | — | — | (8,622,393 | ) | (8,622,393 | ) | |||||||||||||||||||||||||
|
Balance at December 31, 2012
|
800 | $ | 983,747 | 2,243 | $ | 741,171 | 26,924,643 | $ | 26,925 | $ | 76,455,054 | $ | (79,611,493 | ) | $ | (2,388,343 | ) | |||||||||||||||||||
The accompanying notes are an integral part of these consolidated financial statements.
Westinghouse Solar, Inc.
Consolidated Statements of Cash Flows
|
Twelve Months Ended December 31,
|
||||||||
|
2012
|
2011
|
|||||||
|
Cash flows from operating activities
|
||||||||
|
Net loss
|
$ | (8,622,393 | ) | $ | (4,631,621 | ) | ||
|
Adjustments to reconcile net loss to net cash used in by operations:
|
||||||||
|
Depreciation
|
149,840 | 192,520 | ||||||
|
Amortization of patents
|
67,919 | 6,722 | ||||||
|
Bad debt expense
|
485,072 | 34,504 | ||||||
|
Inventory revaluation
|
383,081 | — | ||||||
|
Unrealized loss (gain) on fair value adjustment of common stock warrants
|
416,526 | (2,592,722 | ) | |||||
|
Non-cash stock-based compensation expense
|
704,188 | 1,053,478 | ||||||
|
Gain on sale of property and equipment
|
(3,060 | ) | 10,840 | |||||
|
Changes in assets and liabilities:
|
||||||||
|
Accounts receivable
|
645,842 | (218,496 | ) | |||||
|
Other receivables
|
(52,700 | ) | (453,605 | ) | ||||
|
Inventory
|
2,891,816 | 149,899 | ||||||
|
Prepaid expenses and other current assets
|
558,601 | 122,310 | ||||||
|
Assets of discontinued operations – short term
|
76,560 | 530,749 | ||||||
|
Assets held for sale
|
18,293 | 37,066 | ||||||
|
Other assets
|
(624,654 | ) | (535,800 | ) | ||||
|
Assets of discontinued operations – long-term
|
9,913 | (188,189 | ) | |||||
|
Accounts payable
|
509,498 | 2,381,859 | ||||||
|
Accrued liabilities and accrued warranty
|
172,011 | (13,058 | ) | |||||
|
Liabilities of discontinued operations
|
(266,201 | ) | (384,232 | ) | ||||
|
Net cash used in operating activities
|
(2,479,848 | ) | (4,497,776 | ) | ||||
|
Cash flows from investing activities
|
||||||||
|
Acquisition of property and equipment
|
— | (73,014 | ) | |||||
|
Proceeds from disposal of property and equipment
|
3,060 | 18,800 | ||||||
|
Proceeds from disposal of property and equipment from discontinued operations
|
— | 234,692 | ||||||
|
Net cash provided by investing activities
|
3,060 | 180,478 | ||||||
|
Cash flows from financing activities
|
||||||||
|
Repayment of notes payable
|
(283,252 | ) | (167,930 | ) | ||||
|
Borrowing (repayment) on line of credit, net
|
(92,266 | ) | (447,984 | ) | ||||
|
Repayments on capital lease obligations
|
(4,698 | ) | (1,588 | ) | ||||
|
Repayments on capital lease obligations from discontinued operations
|
— | (7,764 | ) | |||||
|
Restricted cash
|
— | 540,250 | ||||||
|
Proceeds from stock offering
|
1,100,000 | 3,600,000 | ||||||
|
Proceeds from securities purchase agreement
|
500,000 | 2,400,000 | ||||||
|
Proceeds from exercise of warrants
|
283,333 | — | ||||||
|
Payment of placement agent and registration fees and other direct costs
|
(228,180 | ) | (822,619 | ) | ||||
|
Employee taxes paid for vesting of restricted stock
|
(17,541 | ) | (24,336 | ) | ||||
|
Net cash provided by financing activities
|
1,257,396 | 5,068,029 | ||||||
|
Net increase (decrease) in cash and cash equivalents
|
(1,219,392 | ) | 750,731 | |||||
|
Cash and cash equivalents
|
||||||||
|
Beginning of period
|
1,346,777 | 596,046 | ||||||
|
End of period
|
$ | 127,385 | $ | 1,346,777 | ||||
|
Supplemental cash flows disclosures:
|
||||||||
|
Cash paid during the period for interest
|
$ | 26,468 | $ | 27,397 | ||||
|
Supplemental disclosure of non-cash financing activity:
|
||||||||
|
Fair value of warrants issued in stock offering
|
$ | — | $ | 2,713,550 | ||||
|
Common stock warrant liability issued in connection with agency placement fee
|
$ | — | $ | 89,010 | ||||
|
Preferred deemed dividend
|
$ | 362,903 | $ | 975,460 | ||||
|
Conversion of preferred stock to common stock
|
$ | 310,052 | $ | — | ||||
|
Conversion of common stock warrant liability upon exercise of warrants
|
$ | 252,765 | $ | — | ||||
|
Reclassification of common stock warrant liability to Additional Paid-in Capital
|
$ | 481,242 | $ | — | ||||
|
Preferred stock dividends paid in common stock
|
$ | 174,342 | $ | 99,047 | ||||
|
Property and equipment acquired through capital lease
|
$ | — | $ | 11,000 | ||||
|
Stock issued to procure inventory
|
$ | 1,142,801 | $ | 99,908 | ||||
|
Note payable obtained to finance prepaid insurance
|
$ | — | $ | 314,366 | ||||
The accompanying notes are an integral part of these consolidated financial statements.
Westinghouse Solar, Inc.
Notes to Consolidated Financial Statements
December 31, 2012 and 2011
1. Description of Business
We are a designer and manufacturer of solar power systems and solar panels with integrated microinverters (which we call AC solar panels). We design, market and sell these solar power systems to solar installers, trade workers and do-it-yourself customers through distribution partnerships, our dealer network and retail outlets. Our products are designed for use in solar power systems for residential and commercial rooftop customers. Prior to September 2010, we were also in the solar power installation business. We launched the distribution of our solar power systems in the second quarter of 2009.
On May 9, 2012, we announced the execution of an agreement and plan of merger, as amended to date, with CBD Energy Limited, a diversified renewable energy company based in Sydney, Australia (CBD), which contemplates a merger in which CBD would become our parent company, subject to shareholder approvals and other customary closing conditions. CBD and the Company are working toward completion of the Form F-4 Registration Statement and Proxy Statement, planned to be filed in the coming weeks with the Securities and Exchange Commission. While the merger has been repeatedly delayed, the companies currently anticipate merger closing by early in the third quarter of 2013. In the meantime, our supply relationships have been disrupted, our revenue has declined significantly and we have had to implement significant cost reductions and lay off employees.
The Company was incorporated as Akeena Solar, Inc. (Akeena Solar) in February 2001 in the State of California and elected at that time to be taxed as an S Corporation. During June 2006, we reincorporated in the State of Delaware and became a C Corporation. On August 11, 2006, we entered into a reverse merger transaction (the “Merger”) with Fairview Energy Corporation, Inc. (“Fairview”). Pursuant to the merger agreement, the stockholders of Akeena Solar received one share of Fairview common stock for each issued and outstanding share of Akeena Solar common stock. Our common shares were also adjusted from $0.01 par value to $0.001 par value at the time of the Merger. Subsequent to the closing of the Merger, the former stockholders of Akeena Solar held a majority of Fairview’s outstanding common stock. Since the stockholders of Akeena Solar owned a majority of the outstanding shares of Fairview common stock immediately following the Merger, and the management and board of Akeena Solar became the management and board of Fairview immediately following the Merger, the Merger was accounted for as a reverse merger transaction and Akeena Solar was deemed to be the acquirer. The assets, liabilities and the historical operations prior to the Merger are those of Akeena Solar. Subsequent to the Merger, the consolidated financial statements include the assets, liabilities and the historical operations of Akeena Solar and Fairview from the closing date of the Merger.
On May 17, 2010, we entered into an exclusive worldwide license agreement that permits us to manufacture, distribute and market our solar panels under the Westinghouse name. On July 22, 2010, we announced that we will operate under the name “Westinghouse Solar” and, effective July 23, 2010 at the opening of the market, our stock began trading under the stock symbol “WEST” on the NASDAQ Capital Market. In September 2012, our common stock was delisted from NASDAQ Capital Market and we began trading on the OTCQB under the stock symbol “WEST”. CBD has applied for listing on the NASDAQ Stock Exchange, to be effective upon consummation of the merger. CBD intends to delist from the ASX upon merger closing, subject to shareholder approval.
On September 10, 2010, we announced that we were expanding our sales of our solar power systems directly to dealers in California and that we were exiting the solar panel installation business. As a result, beginning with the third quarter of 2010, our installation business has been reclassified in our financial statements as discontinued operations. The exit from the installation business was essentially completed by the end of the fourth quarter of 2010. (See Note 3. Discontinued Operations).
We changed our name from “Akeena Solar, Inc.” to “Westinghouse Solar, Inc.” effective on April 6, 2011. On April 13, 2011, we effected a reverse split of our common stock at a ratio of 1-for-4.
Our Corporate headquarters is located at 1475 S. Bascom Ave., Campbell, CA 95008. Our telephone number is (408) 402-9400. Additional information about Westinghouse Solar is available on our website at http://www.westinghousesolar.com. The information on our web site is not incorporated herein by reference.
Reclassifications
Certain line items have been reclassified to conform to the current presentation. Inventory has been reclassified between finished goods and work in process under Note 4 of our Notes to Consolidated Financial Statements.
Discontinued Operations
See Note 3 for a detailed discussion of our Discontinued Operations.
Reverse Stock Split
On April 6, 2011, we filed a Certificate of Amendment to our Certificate of Incorporation with the Secretary of State of the State of Delaware to effect a reverse split of our common stock at a ratio of 1-for-4. The reverse stock split became effective at the close of business on April 13, 2011. Amounts for the prior periods have been reclassified to conform to this presentation.
Concentration of Risk in Customer and Supplier Relationships
See Note 17 for a detailed discussion of our concentration of risk in customer and supplier relationships.
2. Summary of Significant Accounting Policies
Liquidity and Financial Position
The current economic downturn presents us with challenges in meeting the working capital needs of our business. Our primary requirements for working capital are to fund purchases for solar panels and microinverters, and to cover our payroll and lease expenses. For each of the two years in the period ended December 31, 2012 and 2011, we have incurred net losses and negative cash flows from operations. During the recent years, we have undertaken several equity financing transactions to provide the capital needed to sustain our business. We have dramatically reduced our headcount and other variable expenses. In addition, we expect to incur a net loss from operations for the year ending December 31, 2013. Based on current cash projections for 2013, we intend to address ongoing working capital needs through cost reduction measures and liquidation of remaining inventory, along with raising additional equity. In January 2013, our board of directors approved actions to dramatically reduce our variable operating costs, including a 12 person employee headcount reduction effective January 15, 2013, for the period through the anticipated merger closing with CBD. No restructuring charges or severance payments were incurred. While the merger has been repeatedly delayed, the companies currently anticipate merger closing by early in the third quarter of 2013. In the event that revenue is lower or the merger is delayed further, additional staffing reductions and expense cuts could occur. Our revenue levels remain difficult to predict, and we anticipate that we will continue to sustain losses in the near term, and we cannot assure investors that we will be successful in reaching break-even.
As of December 31, 2012, we had approximately $127,000 in cash on hand. Our potentially available $750,000 credit facility is subject to limitations based on the level of our qualifying accounts receivable, and at December 31, 2012, we had no qualifying accounts receivable. In addition, due to Suntech entering judgment against us on March 15, 2013, our credit facility is currently unavailable. Under the Merger Agreement we entered into with CBD, we are required to raise sufficient equity capital, with the cooperation and support of CBD, to meet our own liquidity and working capital requirements. In addition, prior to closing of the merger, CBD may provide capital funding support to us if necessary, subject to conditions and limitations as provided in the Merger Agreement.
In recent months, because of our cash position and liquidity constraints, we have been late in making payments to both of our panel suppliers. We had a limited amount of remaining inventory on hand as of December 31, 2012. We do not have any unshipped orders for solar panel product pending with Suntech, and our supply relationship with Lightway is currently stalled. We are actively negotiating alternative sources of supply through other sources, including CBD Energy Limited. Although we believe we can find alternative suppliers for solar panels manufactured to our specifications, unless we are able to rapidly secure alternative sources of supply, our inventory and revenue could diminish significantly, causing disruption to our operations in the next few quarters.
On October 18, 2012, we entered into a securities purchase agreement with certain institutional accredited investors relating to the sale and issuance of up to 1,245 shares of our newly created Series C 8% Convertible Preferred Stock at a price of $1,000 per share, for aggregate proceeds of up to $1,245,000. At the initial closing, we sold and issue 750 shares of Series C Preferred, for initial aggregate proceeds of $750,000. Subsequently, on November 2, 2012, we sold and issued 350 shares of Series C Preferred for proceeds of $350,000. On January 24, 2013, we provided to the purchasers a draw down notice under the Purchase Agreement. The purchasers agreed to accept the new draw down notice and thereby extend our right to exercise a “put” to sell additional Series C Preferred beyond the Securities Purchase Agreement’s prior expiration date of December 31, 2012. As a result of the draw down, we sold an aggregate of 75 additional shares of its Series C Preferred to the purchasers for aggregate proceeds of $75,000.
On February 15, 2013, we entered into a securities purchase agreement with an institutional accredited investors relating to the sale and issuance of up to 1,000 shares of our newly created Series D 8% Convertible Preferred Stock (Series D Preferred) at a price per share equal to the stated value, which is $1,000 per share, for aggregate proceeds of up to $1,000,000. At the initial closing, concurrent with entering the agreement, we issued 150 shares of Series D Preferred, for initial aggregate proceeds of $150,000. After the initial closing, the Securities Purchase Agreement permits the purchaser to exercise a “call” right to purchase additional Series D Preferred in multiple draw downs from time to time until December 31, 2013, subject to certain limits, terms and conditions. In March 2013, the company and investors entered into a letter agreement to the Securities Purchase Agreement dated as of February 15, 2013, modifying the number of shares of Series D Preferred Stock to be issued upon settlement of any purchaser draw downs made on or after March 18, 2013, equal to the purchaser investment amount divided by the stated value multiplied by a number agreed upon by the Company and the Purchaser, which shall not be higher than 1.67. Subsequently, on March 21, 2013, we issued 167 shares of Series D Preferred for aggregate proceeds of $100,000.
The accompanying consolidated financial statements have been prepared assuming we will continue as a going concern. Our significant operating losses, negative cash flow from operations, and challenges in rapidly securing alternative sources of supply for solar panels, raise substantial uncertainty about our ability to continue as a going concern. The accompanying financial statements do not include any adjustments that might result from the outcome of this uncertainty, and contemplate the realization of assets and the settlement of liabilities and commitments in the normal course of business. We believe our current cash balance, projected financial results from our operations, and the amounts that should be available to us through debt and equity financing provide sufficient resources and operating flexibility to fund our anticipated cash needs, through at least the next 12 months; however, there can be no assurance that we will be able to raise additional funds on commercially reasonable terms, if at all. The current economic downturn adds uncertainty to our anticipated revenue levels and to the timing of cash receipts, which are needed to support our operations. It also worsens the market conditions for seeking equity and debt financing. As a result of our delisting from the Nasdaq Capital Market in September 2012, we are no longer eligible to file new registration statements on Form S-3, which may make it more costly and more difficult for us to obtain additional equity financing. We currently anticipate that we will retain all of our earnings, if any, for development of our business and do not anticipate paying any cash dividends on common stock in the foreseeable future.
Cash and Cash Equivalents
We consider all highly liquid investments with maturities of three months or less, when purchased, to be cash equivalents. We maintain cash and cash equivalents, which consist principally of money market demand deposits with high credit quality financial institutions. At certain times, such amounts exceed FDIC insurance limits. We have not experienced any losses on these investments.
Accounts Receivable
Accounts receivable consist of trade receivables. We regularly evaluate the collectability of our accounts receivable. An allowance for doubtful accounts is maintained for estimated credit losses. We consider a number of factors when estimating credit losses, including the aging of a customer’s account, creditworthiness of specific customers, historical trends and other information.
Inventory
Inventory is stated at the lower of cost (on an average basis) or market value. We determine cost based on the weighted-average purchase price and include both the costs of acquisition and the shipping costs in inventory. We regularly review the cost of inventory against its estimated market value and record a lower of cost or market write-down to cost of goods sold, if any inventory has a cost in excess of estimated market value.
Property and Equipment
Property and equipment are stated at cost less accumulated depreciation and amortization. Depreciation and amortization are provided for using the straight-line method over the estimated useful lives of the respective assets.
Estimated useful lives are as follows:
|
Category
|
Useful Lives
|
|
Office Equipment
|
2-5 years
|
|
Vehicles
|
3-5 years
|
|
Leasehold Improvements
|
2 years
|
Maintenance and repairs are expensed as incurred. Expenditures for significant renewals or betterments are capitalized. Upon disposition, the cost and related accumulated depreciation are removed from the accounts and the resulting gain or loss is reflected in current operations.
Long-Lived Assets
We review long-lived assets for impairment whenever events or changes in circumstances indicate that the carrying value of a long-lived asset may not be recoverable. We periodically evaluate whether events and circumstances have occurred that may warrant revision of the estimated useful lives of our long-lived assets or whether the remaining balance of long-lived assets should be evaluated for possible impairment. We do not believe that there were any indicators of impairment that would require an adjustment to such assets or their estimated periods of recovery at December 31, 2012 and 2011.
Goodwill and Other Intangible Assets
We do not amortize goodwill, but rather test goodwill for impairment at least annually.
We capitalize external legal costs and filing fees associated with obtaining or defending our patents. Upon issuance of new patents or successful defense of existing patents, we amortize these costs using the straight line method over the shorter of the legal life of the patent or its economic life. We believe the remaining useful life we assign to these patents, approximately 12 years as of December 31, 2012, are reasonable. We periodically review our patents to determine whether any such cost have been impaired and are no longer being used. To the extent we are no longer using certain patents, the associated costs will be written off at that time.
Costs associated with patents currently held are approximately $1.4 million, net of approximately $89,000 of accumulated amortization, are included in other assets, net as of December 31, 2012, and are being amortized over the estimated useful life, which was determined to be seventeen years. Amortization expense of patents was approximately $68,000 and $7,000 in each of the years ended December 31, 2012 and 2011, respectively. Estimated amortization expense of patents for the five years subsequent to December 31, 2012, is approximately $110,000 per year. Capitalized filing fees associated with obtaining new patents not yet issued and defense of existing patents (not yet resolved) of approximately $165,000 are included in other assets as December 31, 2012.
Discontinued operations
Discontinued operations are presented and accounted for in accordance with Accounting Standards Codification (ASC) 360, “Impairment or Disposal of Long-Lived Assets,” (ASC 360). When a qualifying component of the Company is disposed of or has been classified as held for sale, the operating results of that component are removed from continuing operations for all periods presented and displayed as discontinued operations if: (a) elimination of the component’s operations and cash flows from the Company’s ongoing operations has occurred (or will occur) and (b) significant continuing involvement by the Company in the component’s operations does not exist after the disposal transaction.
On September 10, 2010, we announced that we were exiting the solar panel installation business. The exit from the installation business was essentially completed at the end of the fourth quarter of 2010. The exit from the installation business was therefore classified as discontinued operations for all periods presented under the requirements of ASC 360.
Manufacturer and Installation Warranties
The manufacturer directly warrants the solar panels and inverters for a range from 15 to 25 years. We warrant the balance of system components of our products against defects in material and workmanship for five years. We assist our customers in the event of a claim under the manufacturer warranty to replace a defective solar panel or inverter. The warranty liability for the material and the workmanship of the balance of system components of approximately $330,000 at December 31, 2012 and $218,000 at December 31, 2011, is included within “Accrued warranty” in the accompanying consolidated balance sheets.
The liability for our manufacturing warranty consists of the following:
|
Twelve Months Ended
|
||||||||
|
2012
|
2011
|
|||||||
|
Beginning accrued warranty balance
|
$ | 217,812 | $ | 51,860 | ||||
|
Reduction for labor payments and claims made under the warranty
|
(1,723 | ) | — | |||||
|
Accruals related to warranties issued during the period
|
113,591 | 165,952 | ||||||
|
Ending accrued warranty balance
|
$ | 329,680 | $ | 217,812 | ||||
We previously recorded a provision for warranty liability related to our discontinued installation operations. We provided for a 5-year or a 10-year warranty on the installation of a system and all equipment and incidental supplies other than solar panels and inverters that are covered under the manufacturer warranty. The liability for the installation warranty at December 31, 2012 and 2011 was approximately $1.0 million and $1.1 million, respectively, and is included within “Liabilities of Discontinued Operations” in the accompanying consolidated balance sheets. Defective solar panels or inverters are covered under the manufacturer warranty. In the event that a panel or inverter needs to be replaced, we will replace the defective item within the manufacturer’s warranty period (between 5-25 years).
Fair Value of Financial Instruments
The carrying values reported for cash equivalents, accounts receivable, assets associated with discontinued operations, accounts payable, accrued liabilities and the outstanding credit facility approximated their respective fair values at each balance sheet date due to the short-term maturity of these financial instruments.
Revenue Recognition
Revenue from sales of products is recognized when: (1) persuasive evidence of an arrangement exists, (2) delivery has occurred or services have been rendered, (3) the sale price is fixed or determinable, and (4) collection of the related receivable is reasonably assured. We recognize revenue when the solar power systems are shipped to the customer.
Stock-based Compensation
We apply the fair value method under Accounting Standards Codification (ASC) 718 in accounting for our 2001 Stock Option Plan and our 2006 Stock Incentive Plan. Under ASC 718, compensation cost is measured at the grant date based on the fair value of the equity instruments awarded and is recognized over the period during which an employee is required to provide service in exchange for the award, or the requisite service period, which is usually the vesting period. The fair value of the equity award granted is estimated on the date of the grant.
Advertising
We expense advertising costs as incurred. Advertising expense, included in “Sales and marketing expenses,” for the years ended December 31, 2012 and 2011, was approximately $144,000 and $187,000, respectively.
Research and Development Costs
Research and development expenses, which include the cost of activities that are useful in developing new products, processes or techniques, as well as expenses for activities that may significantly improve existing products or processes are expensed as incurred. In the years ended December 31, 2012 and 2011, we expensed approximately $649,000 and $800,000, respectively, in general and administrative costs.
Shipping and Handling Costs
Shipping and handling costs associated with inbound freight are included in cost of inventory and expensed as cost of sales when the related inventory is sold.
Income Taxes
Deferred income taxes arise from timing differences resulting from income and expense items reported for financial accounting and tax purposes in different periods. A deferred tax asset valuation allowance is recorded when it is more likely than not that deferred tax assets will not be realized. Utilization of net operating loss carryforwards may be subject to a substantial annual limitation due to ownership change limitations provided by the Internal Revenue Code. The annual limitation may result in the expiration of net operating loss carryforwards before utilization. We apply the provisions of ASC 740, formerly FASB Interpretation No. 48, “Accounting for Uncertainty in Income Taxes” (FIN 48). We recognize the financial statement benefit of a tax position only after determining that the relevant tax authority would more likely than not sustain the position following an audit. For tax positions meeting this standard, the amount recognized in the financial statements is the largest benefit that has a greater than 50 percent likelihood of being realized upon ultimate settlement with the relevant tax authority.
Earnings Per Share
As of January 1, 2009, we adopted Accounting Standards Codification (ASC) 260 (formerly Financial Accounting Standards Board Staff Position (FSP) Emerging Issues Task Force (EITF) 03-6-1) (ASC 260), “Determining Whether Instruments Granted in Share-Based Payment Transactions Are Participating Securities” (the “Staff Position”), which states that unvested share-based payment awards that contain non-forfeitable rights to dividends or dividend equivalents are considered participating securities and shall be included in the computation of net income (loss) per share pursuant to the two-class method described in ASC 260 (formerly Statement of Financial Accounting Standards (SFAS) No. 128), Earnings Per Share. The effect of the adoption of the Staff Position was not material to our net loss per share.
In accordance with the Staff Position, basic net income (loss) per share is computed by dividing net income (loss), excluding net income (loss) attributable to participating securities, by the weighted average number of shares outstanding less the weighted average unvested restricted shares outstanding. Diluted net income (loss) per share is computed by dividing net income (loss), excluding net income (loss) attributable to participating securities, by the denominator for basic net income (loss) per share and any dilutive effects of stock options, restricted stock, convertible notes and warrants.
On April 6, 2011, we filed a Certificate of Amendment to our Certificate of Incorporation with the Secretary of State of the State of Delaware to effect a reverse split of our common stock at a ratio of 1-for-4. The reverse stock split became effective at the close of business on April 13, 2011. All historical share and per share amounts have been adjusted to reflect this reverse stock split. The par value of our common stock did not change. The following table sets forth the computation of basic and diluted net loss per share:
|
Twelve Months Ended
December 31,
|
||||||||
|
2012
|
2011
|
|||||||
|
Basic:
|
||||||||
|
Numerator:
|
||||||||
|
Net loss
|
$ | (8,622,393 | ) | $ | (4,631,621 | ) | ||
|
Less: Net loss allocated to participating securities
|
170,052 | 72,062 | ||||||
|
Net loss attributable to stockholders
|
(8,452,341 | ) | (4,559,559 | ) | ||||
|
Preferred stock dividend
|
(174,342 | ) | (99,047 | ) | ||||
|
Preferred deemed dividend
|
(362,903 | ) | (975,460 | ) | ||||
| $ | (8,989,586 | ) | $ | (5,634,066 | ) | |||
|
Denominator:
|
||||||||
|
Weighted-average shares outstanding
|
19,791,045 | 12,537,727 | ||||||
|
Weighted-average unvested restricted shares outstanding
|
(390,321 | ) | (195,072 | ) | ||||
|
Denominator for basic net loss per share
|
19,400,724 | 12,342,655 | ||||||
|
Basic net loss per share attributable to common stockholders
|
$ | (0.46 | ) | $ | (0.46 | ) | ||
|
Diluted:
|
||||||||
|
Numerator:
|
||||||||
|
Net loss
|
$ | (8,622,393 | ) | $ | (4,631,621 | ) | ||
|
Less: Net loss allocated to participating securities
|
170,052 | 72,062 | ||||||
|
Net loss attributable to stockholders
|
(8,452,341 | ) | (4,559,559 | ) | ||||
|
Preferred stock dividend
|
(174,342 | ) | (99,047 | ) | ||||
|
Preferred deemed dividend
|
(362,903 | ) | (975,460 | ) | ||||
| $ | (8,989,586 | ) | $ | (5,634,066 | ) | |||
|
Denominator:
|
||||||||
|
Denominator for basic calculation
|
19,400,724 | 12,342,655 | ||||||
|
Weighted-average effect of dilutive stock options
|
— | — | ||||||
|
Denominator for diluted net loss per share
|
19,400,724 | 12,342,655 | ||||||
|
Diluted net loss per share attributable to common stockholders
|
$ | (0.46 | ) | $ | (0.46 | ) | ||
The following table sets forth potential shares of common stock at the end of each period presented that are not included in the calculation of diluted net loss per share because to do so would be anti-dilutive:
|
December 31, 2012
|
December 31, 2011
|
|||
|
Stock options outstanding
|
679,744
|
1,077,744
|
||
|
Unvested restricted stock
|
48,073
|
289,795
|
||
|
Warrants to purchase common stock
|
3,398,045
|
4,106,016
|
||
|
Preferred stock convertible into common stock
|
35,230,263
|
3,409,029
|
Segment Reporting
Operating segments are components of an enterprise for which separate financial information is available and is evaluated regularly by management in deciding how to allocate resources and in assessing performance. We are engaged in a single business segment wherein we design, manufacture and sell our solar panels to solar installers, trade workers and do-it-yourself customers through distribution partnerships, our dealer network and retail outlets.
Use of Estimates
The preparation of financial statements in conformity with accounting principles generally accepted in the United States of America requires management to make estimates and assumptions that affect the reported amounts of assets and liabilities and disclosure of contingent assets and liabilities at the date of the financial statements and the reported amounts of revenues and expenses during the reporting period. Actual results could differ from those estimates.
Principles of Consolidation
The accompanying consolidated financial statements include the accounts of Westinghouse Solar and Fairview, pursuant to the Merger as described in Note 1. We also have two wholly-owned subsidiaries as of December 31, 2012 and 2011. Akeena Corp. and Andalay Solar, Inc. are wholly-owned subsidiaries of Westinghouse Solar, Inc. All inter-company accounts have been eliminated in consolidation.
3. Discontinued Operations
On September 10, 2010, we announced that we were exiting the solar panel installation business and we were expanding our distribution business to include sales of our Westinghouse Solar Power Systems directly to dealers in California. The exit from the installation business was essentially completed by the end of 2010. As a result of the decision to exit the California installation business we recorded a restructuring charge totaling approximately $3.0 million for the year ended December 31, 2010, the majority of which were non-cash charges. This restructuring charge was comprised primarily of (i) one-time severance costs of $765,000 related to headcount reductions paid primarily in shares of our common stock, (ii) inventory write downs of $948,000, (iii) lease accelerations and the write off of leasehold improvements of $307,000, (iv) goodwill impairment of $299,000, (v) vehicle, furniture and fixtures and computer equipment write downs of $290,000 and (vi) other prepaid costs write-downs of $367,000. During the year ended December 31, 2010, we recorded a loss from discontinued operations of $6.5 million. During the year ended December 31, 2012, we recorded a $16,000 gain from the discontinued installation business and during the year ended December 31, 2011, we recorded a $113,000 loss from the discontinued installation business.
The assets and liabilities of discontinued operations are presented separately under the captions “Assets of discontinued operations,” “Liabilities of discontinued operations” and “Long-term liabilities of discontinued operations,” respectively, in the accompanying consolidated balance sheets at December 31, 2012 and 2011, and consist of the following:
|
Assets of discontinued operations:
|
December 31, 2012
|
December 31, 2011
|
||||||
|
Accounts receivable and other receivables
|
$ | 1,340 | $ | 41,762 | ||||
|
Prepaid expenses and other current assets
|
— | 34,415 | ||||||
|
Other assets
|
9,556 | 11,278 | ||||||
|
Total current assets of discontinued operations
|
10,896 | 87,455 | ||||||
|
Security deposits on operating leases
|
— | 9,913 | ||||||
|
Security deposit – escrow account for installation jobs
|
200,000 | 200,000 | ||||||
|
Total assets of discontinued operations
|
$ | 210,896 | $ | 297,368 | ||||
|
Liabilities of discontinued operations:
|
December 31, 2012
|
December 31, 2011
|
||||||
|
Accrued liabilities
|
$ | 8,656 | $ | 124,751 | ||||
|
Accrued warranty
|
1,042,663 | 1,133,549 | ||||||
|
Deferred revenue
|
1,500 | 50,520 | ||||||
|
Total current liabilities
|
1,052,819 | 1,308,820 | ||||||
|
Other long-term liabilities
|
— | 10,200 | ||||||
|
Total discontinued operations liabilities
|
$ | 1,052,819 | $ | 1,319,020 | ||||
We entered into a Supply and Warranty Agreement and Master Assignment Agreement with Real Goods Solar, Inc. (Real Goods), pursuant to which Real Goods has agreed to perform certain warranty work. The terms of the agreement provide that an escrow account be established as a source of funds from which to satisfy our obligation to pay Real Goods for its fees and reimburse it for its expenses for this warranty work. In March 2011, we entered into an Escrow Agreement with Real Goods and deposited $200,000 into an escrow account. The amount is reflected in long-term assets of discontinued operations in the balance sheet. The escrow deposit will be released to us in the amount of $40,000, or one-fifth of the remaining escrow funds, per year after each of the fifth through the ninth anniversary of the escrow agreement.
In connection with the announcement of our exit from the solar panel installation business, we reclassified certain assets as “Assets held for sale,” in the accompanying consolidated balance sheets. At December 31, 2011, we had $18,293 in inventory in assets held for sale. There were no assets held for sale at December 31, 2012.
4. Accounts Receivable
Accounts receivable consists of the following:
|
December 31, 2012
|
December 31, 2011
|
|||||||
|
Trade accounts
|
$ | 490,401 | $ | 1,230,895 | ||||
|
Less: Allowance for bad debts
|
(108,750 | ) | (39,000 | ) | ||||
|
Less: Allowance for returns
|
(15,806 | ) | (95,315 | ) | ||||
| $ | 365,845 | $ | 1,096,580 | |||||
The following table summarizes the allowance for doubtful accounts as of December 31, 2012 and 2011:
|
Balance at Beginning of Period
|
Provisions, net
|
Write-Off/
Recovery
|
Balance at End of Period
|
|||||||||||||
|
Year ended December 31, 2012
|
$
|
39,000
|
$
|
485,000
|
$
|
(415,000)
|
$
|
109,000
|
||||||||
|
Year ended December 31, 2011
|
$
|
5,000
|
$
|
34,000
|
$
|
—
|
$
|
39,000
|
||||||||
5. Inventory
Inventory consists of the following:
|
December 31, 2012
|
December 31, 2011
|
|||||||
| Finished goods | $ | 755,643 | $ | 3,428,301 | ||||
|
Work in process
|
240,070 | 744,508 | ||||||
| $ | 995,713 | $ | 4,172,809 | |||||
Included in inventory at December 31, 2012, is an $11,000 credit related to a pricing adjustment from a supply agreement. As of December 31, 2011, we had capitalized in inventory approximately $75,000 in stock compensation related to the restricted stock grant for a supply agreement with Light Way Green New Energy Co., Ltd, and $12,000 related to rent, depreciation and salary costs.
During the year ended December 31, 2012, we recorded a $206,000 non-cash inventory write-down, a $65,000 write-off of accumulated inventory overhead costs and a $112,000 non-cash inventory write-off, representing 7.3% of revenue in total. The $206,000 write-down was an adjustment to the carrying value of our older, smaller-format solar panels and older microinverter inventory to reflect the decline in market prices compared to our original cost and the $112,000 was an inventory write-off of obsolete inventory.
6. Property and Equipment, Net
Property and equipment, net consist of the following:
|
December 31, 2012
|
December 31, 2011
|
|||||||
|
Office equipment
|
$ | 522,745 | $ | 573,852 | ||||
|
Leasehold improvements
|
148,759 | 148,759 | ||||||
|
Vehicles
|
17,992 | 17,992 | ||||||
| 689,496 | 740,603 | |||||||
|
Less: Accumulated depreciation and amortization
|
(642,619 | ) | (543,885 | ) | ||||
| $ | 46,877 | $ | 196,718 | |||||
Depreciation expense for the twelve months ended December 31, 2012 and 2011 was approximately $150,000 and $193,000, respectively. Beginning in the fourth quarter 2010, concurrent with our change in business model to a pure a manufacturing and distribution business, a portion of depreciation expense related to leasehold improvements and equipment in our warehouse is allocated to cost of goods sold. All other depreciation is included in general and administrative expense.
7. Accrued Liabilities
Accrued liabilities consist of the following:
|
December 31, 2012
|
December 31, 2011
|
|||||||
|
Accrued salaries, wages, benefits and bonus
|
$ | 65,581 | $ | 92,692 | ||||
|
Sales tax payable
|
877 | 1,159 | ||||||
|
Accrued accounting and legal fees
|
5,160 | 138,233 | ||||||
|
Allowance for returns
|
— | 20,081 | ||||||
|
Customer deposit payable
|
36,540 | 13,819 | ||||||
|
Accrued interest
|
76,438 | — | ||||||
|
Royalty payable
|
262,500 | 125,000 | ||||||
|
Other accrued liabilities
|
41,860 | 37,829 | ||||||
| $ | 488,956 | $ | 428,813 | |||||
8. Credit Facility
Line of credit
On February 15, 2011, we entered into a Business Financing Agreement (the "2011 Credit Facility") with Bridge Bank, National Association (“Bridge Bank”) to finance our accounts receivables. The 2011 Credit Facility provides for a credit limit of $750,000, representing the maximum amount of advances based on up to 50% of $1.5 million of gross eligible accounts receivables. The 2011 Credit Facility may be terminated at any time by either party and may be renewed under similar terms if acceptable and agreed to by both parties. If any advance is not repaid in full within 90 days from the earlier of (a) invoice date, or (b) the date on which such advance is made, we are obligated to immediately pay the outstanding amount to Bridge Bank. Outstanding loans under the 2011 Credit Facility will accrue interest at the Bridge Bank Prime rate plus 3.0% (annualized) of the daily gross financed amount outstanding. The 2011 Credit Facility is secured by substantially all of our assets. As of December 31, 2012, there were no borrowings under the 2011 Credit Facility. In addition, due to Suntech entering judgment against us on March 15, 2013, our credit facility is currently unavailable. As of December 31, 2011, there was approximately $92,000 borrowed under the 2011 Credit Facility.
9. Capital Lease Obligations
Our capital lease obligation consists of a lease on equipment. Our scheduled principal maturities relating to this capital lease obligation at December 31, 2012 is approximately $5,000 in 2013.
10. Stockholders’ Equity
We were incorporated in 2001 and elected at that time to be taxed as an S corporation. During June 2006, we reincorporated in the State of Delaware and became a C corporation. On August 11, 2006, we entered into a reverse merger transaction with Fairview as discussed in Note 1. Pursuant to the Merger, the stockholders of Westinghouse Solar received one share of Fairview common stock for each issued and outstanding share of Westinghouse Solar common stock. Westinghouse Solar’s common shares were also adjusted from $0.01 par value to $0.001 par value at the time of the Merger. Since the stockholders of Westinghouse Solar owned a majority of the outstanding shares of Fairview common stock immediately following the Merger, and the management and board of Westinghouse Solar became the management and board of Fairview immediately following the Merger, the Merger is being accounted for as a reverse merger transaction and Westinghouse Solar was deemed to be the acquirer. The assets, liabilities and the historical operations prior to the Merger are those of Westinghouse Solar. Subsequent to the Merger, the consolidated financial statements include the assets, and the historical operations of Westinghouse Solar and Fairview from the closing date of the Merger.
We have 101,000,000 shares of capital stock authorized under our certificate of incorporation, consisting of 100,000,000 shares of common stock and 1,000,000 shares of preferred stock. As of December 31, 2012, we have authorized (i) 2,000 shares of Series A Convertible Preferred Stock, par value $0.001, all of which have been converted or cancelled and none of which remain outstanding, (ii) 4,000 shares of Series B 4% Convertible Preferred Stock, par value $0.001, of which 2,242.686 shares remain outstanding and (iii) 1,175 shares of our Series C 8% Convertible Preferred Stock, par value $0.001, of which 800 shares remain outstanding. See “Subsequent Events” for a discussion of the sale of our Series C and Series D Convertible Redeemable Preferred Stock.
On February 17, 2011, we entered into a securities purchase agreement with certain institutional accredited investors relating to the sale of 4,000 units at a price of $900 per unit. See “Convertible Redeemable Preferred Stock and Preferred Deemed Dividend” for a discussion of the sale of units.
On March 25, 2011, we entered into a Supply Agreement (the “Lightway Supply Agreement”) with Light Way Green New Energy Co., Ltd (Lightway). Lightway is a vertically integrated manufacturer of polycrystalline silicon wafers, solar cells and solar modules. Lightway is a supplier for our proprietary Westinghouse solar panels. In consideration of the new contract manufacturing arrangement, we agreed to issue to Lightway shares of our common stock with a market value of $520,000, based on the closing share price of our common stock on the date of the first shipment of products by Lightway. On July 31, 2011, in conjunction with their first shipment, we issued Lightway 361,111 unvested shares of our common stock. The shares vested ratably on a monthly basis over a one year period beginning August 31, 2011 and, as of September 30, 2012, all shares have vested.
On August 16, 2011, we entered into a securities purchase agreement with an institutional accredited investor relating to the sale of 990,099 shares of common stock at a price of $1.01 per share, along with the sale of Series L Warrants to purchase up to 643,564 shares of common stock (65% of the number of shares of common stock initially issued) at an exercise price of $1.17 per share. The warrants were not exercisable until six months after issuance and have a term of five years from the date they are first exercisable. The aggregate purchase price for the shares and the warrants was $1,000,000. Under the securities purchase agreement, we agreed to amend the outstanding Series J Warrants, such that the exercise price of the Series J Warrants was reduced from $2.44 per share to $1.17 per share. In addition, each of the Series J Warrants, (i) is not exercisable until the six month anniversary of the closing under the August 16, 2011 securities purchase agreement, and (ii) the expiration date is extended such that the warrant is exercisable for five years from the delayed initial exercise date.
On September 28, 2011, we entered into a securities purchase agreement with an institutional accredited investor relating to the sale of 500,000 shares of common stock at a price of $0.80 per share, along with the sale of Series M Warrants to purchase up to 325,000 shares of common stock (65% of the number of shares of common stock initially issued) at an exercise price of $0.81 per share. The warrants were not exercisable for six months after issuance and have a term of 5½ years from the date they are first exercisable. The aggregate purchase price for the shares and the warrants was $500,000. Under the securities purchase agreement, we agreed to amend the outstanding Series L Warrants, such that the exercise price of the Series L Warrants was reduced from $1.17 per share to $0.81 per share. In addition, each of the Series L Warrants, (i) was not exercisable for the six month anniversary of the closing under the September 28, 2011 securities purchase agreement, and (ii) the expiration date is extended such that the warrant is exercisable for five years from the delayed initial exercise date.
On December 30, 2011, we entered into a securities purchase agreement with CBD, relating to the sale of 1,666,667 shares of common stock at a price of $0.60 per share. The aggregate purchase price was $1,000,000. As a result of the December 30, 2011 sale, (i) the conversion price of the Series B Preferred was reduced to $0.60 per share of common stock, and (ii) the exercise price per share of the Series K Warrants was reduced to $0.60 per share of common stock.
On March 30, 2012, we entered into an amendment to the outstanding Series K warrants which removed the provision for any future price adjustment to the exercise price. See “Stock Warrants and Warrant Liability” for a discussion on the accounting treatment of these warrants.
On March 30, 2012, pursuant to a supply agreement with Lightway, we issued 1,900,000 share of our common stock to them. The shares were issued at $0.55 per share based on the latest closing sale price on the date of issuance.
On August 14, 2012, we entered into a securities purchase agreement with an institutional accredited investor relating to the sale of 2,000,000 shares of our common stock at a price of $0.25 per share. The aggregate purchase price was $500,000.
See Note 13 for a discussion of the accounting treatment of the stock warrant transactions discussed above.
11. Convertible Redeemable Preferred Stock and Preferred Deemed Dividend
On February 17, 2011, we entered into a securities purchase agreement with certain institutional accredited investors relating to the sale of 4,000 units at a price of $900 per unit (the “Securities Purchase Agreement”). Each unit consists of (i) one share of Series B Preferred Stock (the “Series B Preferred”), with each such share of Series B Preferred initially convertible into 500 shares of common stock at an initial conversion price of $1.80 per share, subject to future adjustment for various events, and (ii) warrants to purchase 425 shares of common stock at an initial exercise price of $2.40 per share, subject to future adjustment for various events, which warrants were not exercisable for six months after issuance and have a term of five years from the date of first exercisability (the “Series K Warrants” and together with the Series B Preferred, the “Securities”). The aggregate purchase price for the Securities was $3,600,000, less $532,000 in issuance costs. As of December 31, 2012, 1,757 shares of preferred stock had been converted into 1,152,601 shares of common stock.
The Certificate of Designation to create the Series B Preferred includes certain negative covenants regarding indebtedness and other matters, and includes provisions under which the holders of the Series B Preferred are entitled to demand redemption for cash upon specified triggering events. The Series B Preferred bears dividends at the rate 4% per year for the first year, and 8% per year thereafter, payable in stock or in cash at our election, subject to certain restrictions.
In connection with the sale of the Securities under the Securities Purchase Agreement, we entered into a registration rights agreement with the purchasers (the “Registration Rights Agreement”). In accordance with the Registration Rights Agreement, we filed a registration statement, on March 18, 2011, to register for resale the shares of common stock issued and issuable to the purchasers upon conversion of the Series B Preferred and the shares issuable upon exercise of the Series K Warrants. The registration statement was declared effective on June 17, 2011. Under the terms of the Registration Rights Agreement, we are obligated to maintain the effectiveness of the resale registration statement until all securities registered thereunder are sold or otherwise can be sold pursuant to Rule 144, without restriction.
On the date of issuance, we recorded the value of the Series B Preferred of $1.0 million and of the warrants of $2.6 million on our balance sheet. The closing price of our common stock on the date of issuance was used to value the Series B Preferred and we used the Black-Scholes model to value the Series K Warrants. For purposes of calculating the fair value of the warrants, we used a risk free rate of return of 1.4%, an expected life of 4.1 years and a volatility percentage of 103.2%. The intrinsic value of the beneficial conversion feature is considered a preferred deemed dividend totaling $975,000 to the preferred shareholders, and was charged to additional paid-in capital on our condensed consolidated balance sheets and net loss attributable to common stockholders on our condensed consolidated statements of operations.
Effective August 23, 2011, we amended our Certificate of Designation of Preferences, Rights and Limitations of the Series B 4% Convertible Preferred Stock to amend the terms of the outstanding Series B 4% Convertible Preferred Stock. The principal changes included in the Certificate of Amendment are to: (i) add a hard floor price of $0.10 per share of common stock as a limitation to any future conversion price adjustment to the Series B Preferred Stock resulting from future sales of common stock (or common stock equivalents) or at the one year anniversary of the original issuance date (February 18, 2012) if the recent trading price (20 day VWAP) is below the then current conversion price; (ii) reclassify the consequence of certain breaches and triggering events such that the holders of the Series B Preferred Stock would not be entitled to potentially receive cash redemption in such events, but instead would have rights to receive additional shares of common stock (either in the form of increased dividend payments or upon redemption of their Series B Preferred); and (iii) take into account certain adjustment events that have occurred since the Original Filing, including the 1-for-4 reverse stock split of our common stock implemented after the close of business on April 13, 2011. The purpose for adopting the Certificate of Amendment was to implement revisions that caused the balance sheet value associated with the Series B Preferred Stock to be treated as stockholders’ equity, rather than as “mezzanine” equity, for accounting purposes.
As a result of our December 30, 2011 stock sale to CBD, the conversion price of the Series B Preferred was reduced to $0.60 per share of common stock. As a result of our August 14, 2012 stock sale, the conversion price of the Series B Preferred was further reduced to $0.25 per share of common stock. The maximum intrinsic value of the beneficial conversion feature was previously recorded on the date of issuance for the Series B Preferred and, consequently, no additional preferred deemed dividend was recorded as a result of the reduction in the conversion price of the Series B Preferred.
On October 18, 2012, we filed with the Secretary of State of the State of Delaware a Certificate of Designation creating and specifying the rights of our Series C Preferred Stock. The number of shares designated Series C Preferred Stock is 1,750 (which shall not be subject to increase without the written consent of the holders of a majority of such series of preferred stock). Each share of Series C Preferred has a par value of $0.001 per share and a stated value equal to $1,000, subject to increase under certain circumstances. Each share of Series C Preferred is convertible, at any time at the option of the holder thereof, into shares of our common stock determined by dividing the stated value per share of our Series C Preferred by the closing price per share of our common stock as reported on the OTCQB Marketplace (OTCQB) on October 18, 2012, which is $0.155. The conversion price is subject to further adjustments as set forth in the Series C Certificate of Designation.
The holders of our Series C Preferred are entitled to receive, and we are obligated to pay, cumulative dividends at the rate per share (as a percentage of the stated value per share) of 8% per annum, payable quarterly on March 31, June 30, September 30 and December 31. Dividends are payable in cash or in shares of newly issued common stock, depending on whether we have cash available for lawful payment of dividends and whether we satisfy certain conditions for the alternative to pay the dividends in shares.
Our Series C Preferred generally is non-voting, provided that our holders of Series C Preferred have rights of approval with regard to amendments to our Certificate of Incorporation or to the Certificate of Designation that would adversely affect the rights of our Series C Preferred. Our Series C Preferred provides for a number of negative covenants applicable to us, including restrictions on the amount of our indebtedness (generally, to an amount not to exceed $5 million) and related liens, and restrictions on our use of cash to redeem or to pay dividends with respect to our common stock or other junior securities. In various “triggering event” circumstances set forth in the Series C Certificate of Designation, the holders of our Series C Preferred have rights to demand the redemption of their shares, for cash or for shares of our common stock, depending on the nature of the triggering event.
On October 18, 2012, we entered into a securities purchase agreement with certain institutional accredited investors relating to the sale and issuance of up to 1,245 shares of our newly created Series C Preferred Stock, for aggregate proceeds of up to $1,245,000. At the initial closing, we sold and issued 750 shares of Series C Preferred, for initial aggregate proceeds of $750,000. On November 2, 2012, we provided to the purchasers of our Series C Preferred Stock a draw down notice under the Purchase Agreement. As a result of the draw down, we sold an aggregate of 350 additional shares of our Series C Preferred to the purchasers for aggregate proceeds of $350,000. Based on the closing price of our common stock as reported on the OTCQB Marketplace (OTCQB) on November 2, 2012 (which was $0.08 per share), the 350 shares of Series C Preferred issued pursuant to the draw down was convertible into 4,375,000 shares of our common stock. As a result of the contingent conversion feature on the Series C Preferred, which reduced the conversion price from $0.155 to $0.08 per share on the total 750 shares of Series C Preferred Stock issued and outstanding at November 2, 2012, and which resulted in an increase in the number of common shares issuable, we recognized a preferred deemed dividend of $362,000. The net loss attributable to common shareholders reflects both the net loss and the deemed dividend.
Effective October 18, 2012, we amended our Series B Certificate of Designation to reduce the “Floor Price” limitation related to the conversion rights of the Series B Preferred Stock from $0.10 to $0.01 per share.
On January 24, 2013, we provided to the Purchasers of our Series C Preferred Stock a draw down notice under the Purchase Agreement. The Purchasers agreed to accept the new draw down notice and thereby extend our right to exercise a “put” to sell additional Series C Preferred beyond the Securities Purchase Agreement’s prior expiration date of December 31, 2012. As a result of the draw down, we sold an aggregate of 75 additional shares of Series C Preferred to the Purchasers for aggregate proceeds of $75,000. Based on the closing price of our common stock as reported on the OTCQB Marketplace on January 24, 2013 (which was $0.05 per share), the 75 shares of Series C Preferred to be issued pursuant to the draw down would be convertible into 1,500,000 shares of our common stock.
As a result of the January 24, 2013 draw down notice, pursuant to the terms of the outstanding Series B 4% Convertible Preferred Stock (the “Series B Preferred”), the conversion price of the Series B Preferred was reduced from $0.08 per share of common stock to become equal to $0.05, and the conversion price of the Series C Preferred issued under the initial closing was reduced from $0.08 per share of common stock to become equal to $0.05. As of March 7, 2013, there were 2,209.686 shares of Series B Preferred that remain outstanding. With the January 24, 2013 draw down, and after recent conversions of our Series C Preferred, there are 310 shares of Series C Preferred that remain outstanding. After adjustment to the conversion prices as a result of the January 24th draw down, the outstanding Series B Preferred and Series C Preferred would be convertible into 39,774,348 shares and 6,200,000 shares, respectively, of our common stock.
See Note 13 for a discussion of the accounting treatment of the stock warrant transactions described above.
12. Stock Option and Incentive Plan
On August 8, 2006, we adopted the Westinghouse Solar, Inc. 2006 Stock Incentive Plan (the “Stock Plan”) pursuant to which shares of common stock are available for issuance to employees, directors and consultants under the Stock Plan as restricted stock and/or options to purchase common stock. The Stock Plan allows for issuance of up to 3,000,000 shares and there were 1,112,310 shares available for issuance under the Stock Plan as of December 31, 2012.
Restricted stock and options to purchase common stock may be issued under the Stock Plan. The restriction period on restricted stock grants generally expire at a rate of 25% per quarter over one year or 25% per year over four years, unless decided otherwise by our Compensation Committee. Options to purchase common stock generally vest and become exercisable at a rate of 25% per quarter over one year or as to one-third of the total amount of shares subject to the option on each of the first, second and third anniversaries from the date of grant. Options to purchase common stock generally have a 5-year term.
We use the Black-Scholes-Merton Options Pricing Model (Black-Scholes) to estimate fair value of our employee and our non-employee director stock-based awards. Black-Scholes requires various judgmental assumptions, including estimating stock price volatility, expected option life and forfeiture rates. If we had made different assumptions, the amount of our deferred stock-based compensation, stock-based compensation expense, gross margin, net loss and net loss per share amounts could have been significantly different. We believe that we have used reasonable methodologies, approaches and assumptions to determine the fair value of our common stock, and that our deferred stock-based compensation and related amortization were recorded properly for accounting purposes. If any of the assumptions we used change significantly, stock-based compensation expense may differ materially in the future from that recorded in the current period.
We measure compensation expense for non-employee stock-based compensation under Accounting Standards Codification (ASC) 505-50, “Equity-Based Payments to Non-Employees.” The fair value of the option issued is used to measure the transaction, as this is more reliable than the fair value of the services received. The estimated fair value is measured utilizing Black-Scholes using the value of our common stock on the date that the commitment for performance by the counterparty has been reached or the counterparty’s performance is complete (generally the vesting date). The fair value of the equity instrument is charged directly to expense and additional paid-in capital.
We recognized stock-based compensation expense of approximately $704,000 and $1.1 million during the twelve months ended December 31, 2012 and 2011, respectively, relating to compensation expense calculated based on the fair value at the time of grant for restricted stock and based on Black-Scholes for stock options granted under the Stock Plan.
The following table sets forth a summary of restricted stock activity for the twelve months ended December 31, 2012 and 2011:
|
Number of Restricted Shares
|
Weighted-Average Grant Date
Fair Value
|
|||||||
|
Outstanding and not vested beginning balance at January 1, 2011
|
101,446 | $ | 7.57 | |||||
|
Granted
|
332,155 | $ | 1.46 | |||||
|
Forfeited/cancelled
|
(33,550 | ) | $ | 4.61 | ||||
|
Released/vested
|
(110,256 | ) | $ | 4.91 | ||||
|
Outstanding and not vested beginning balance at January 1, 2012
|
289,795 | $ | 1.92 | |||||
|
Granted
|
1,029,113 | $ | 0.31 | |||||
|
Forfeited/cancelled
|
(131,216 | ) | $ | 1.68 | ||||
|
Released/vested
|
(1,139,619 | ) | $ | 0.47 | ||||
|
Outstanding and not vested at December 31, 2012
|
48,073 | $ | 2.50 | |||||
Restricted stock is valued at the grant date fair value of the common stock and expensed over the requisite service period or vesting period. We estimate forfeitures when recognizing stock-based compensation expense for restricted stock, and the estimate of forfeitures is adjusted over the requisite service period should actual forfeitures differ from such estimates. At December 31, 2012 and 2011, there was approximately $96,000 and $465,000, respectively, of unrecognized stock-based compensation expense associated with the granted but unvested restricted stock. Stock-based compensation expense relating to these restricted shares is being recognized over a weighted-average period of 1.9 years. The total fair value of shares vested during the twelve months ended December 31, 2012 and 2011, was approximately $256,000 and $161,000, respectively. Tax benefits resulting from tax deductions in excess of the compensation cost recognized (excess tax benefits) are classified as financing cash flows on our consolidated statements of cash flows. During the twelve months ended December 31, 2012 and 2011, there were no excess tax benefits relating to restricted stock and therefore there is no impact on the accompanying consolidated statements of cash flows.
The following table sets forth a summary of stock option activity for the twelve months ended December 31, 2012 and 2011:
|
Number of
Shares Subject To
Option 2012
|
Weighted-Average
Exercise Price
|
Number of
Shares Subject To
Option 2011
|
Weighted-Average
Exercise Price
|
|||||||||||||
|
Outstanding beginning balance
|
1,077,744 | $ | 5.47 | 999,775 | $ | 8.66 | ||||||||||
|
Granted during the year
|
46,875 | 0.26 | 377,699 | 1.72 | ||||||||||||
|
Forfeited/cancelled/expired during the year
|
(444,875 | ) | 9.08 | (299,730 | ) | 11.36 | ||||||||||
|
Exercised during the year
|
— | — | — | — | ||||||||||||
|
Outstanding at end of year
|
679,744 | $ | 2.75 | 1,077,744 | $ | 5.47 | ||||||||||
|
Exercisable at end of year
|
477,538 | $ | 2.82 | 468,758 | $ | 8.95 | ||||||||||
|
Outstanding and expected to vest
|
669,049 | $ | 2.82 | 1,007,256 | $ | 5.68 | ||||||||||
Stock options are valued at the estimated fair value on the grant date or the measurement date and expensed over the requisite service period or vesting period. The weighted-average volatility was based upon the historical volatility of our common stock price. The fair value of stock option grants during the twelve months ended December 31, 2012 and 2011 was estimated using the Black-Scholes option-pricing model with the following assumptions:
|
Twelve Months Ended
December 31,
|
||||||||
|
2012
|
2011
|
|||||||
|
Weighted-average volatility
|
105.5 | % | 103.8 | % | ||||
|
Expected dividends
|
0.0 | % | 0.0 | % | ||||
|
Expected life
|
2.9 years
|
3.0 years
|
||||||
|
Weighted-average risk-free interest rate
|
0.25 | % | 1.1 | % | ||||
The weighted-average fair value per share of the stock options as determined on the date of grant was $0.14 for the stock options to purchase 46,875 shares of common stock granted during the twelve months ended December 31, 2012 and $1.07 for the stock options to purchase 377,699 share of common stock granted during the twelve months ended December 31, 2011. The weighted-average remaining contractual term for the stock options outstanding (vested and expected to vest) and exercisable as of December 31, 2012 and 2011, was 2.9 years and 3.2 years, respectively. The total estimated fair value of stock options vested during the twelve months ended December 31, 2012 and 2011 was approximately $406,000 and $541,000, respectively. The aggregate intrinsic value of stock options outstanding as of December 31, 2012 and 2011 was zero.
We estimate forfeitures when recognizing stock-based compensation expense for stock options and the estimate of forfeitures is adjusted over the requisite service period should actual forfeitures differ from such estimates. At December 31, 2012 and 2011, there was approximately $94,000 and $520,000, respectively, of unrecognized stock-based compensation expense associated with stock options granted. Stock-based compensation expense relating to these stock options is being recognized over a weighted-average period of 1.0 years and 1.5, respectively. Tax benefits resulting from tax deductions in excess of the compensation cost recognized (excess tax benefits) is classified as financing cash flows on our consolidated statements of cash flows. During the twelve months ended December 31, 2012 and 2011, there were no excess tax benefits relating to stock options and therefore there is no impact on the accompanying consolidated statements of cash flows.
Non-vested stock option activity for the year ended December 31, 2012 is as follows:
|
Non-Vested Stock Options
|
Weighted-Average Grant Date
Fair Value
|
|||||||
|
Outstanding at December 31, 2011
|
608,986 | $ | 0.85 | |||||
|
Granted
|
46,875 | $ | 0.14 | |||||
|
Forfeited/cancelled
|
(140,415 | ) | $ | (1.70 | ) | |||
|
Released/vested
|
(313,240 | ) | $ | (1.30 | ) | |||
|
Outstanding at December 31, 2012
|
202,206 | $ | 0.65 | |||||
Options outstanding at December 31, 2012 are summarized as follows:
|
Options Outstanding
|
Vested Options
|
|||||||||||||||||||||
|
Number
Outstanding
|
Weighted-
Average
Remaining
Contractual Life
(in years)
|
Weighted-
Average
Exercise
Price
|
Number
Outstanding
|
Weighted-
Average
Exercise
Price
|
||||||||||||||||||
| $0.11 - $0.58 | 114,865 | 4.2 | $ | 0.45 | 86,115 | $ | 0.41 | |||||||||||||||
| $0.75 - $2.04 | 88,596 | 3.4 | $ | 1.46 | 88,596 | $ | 1.46 | |||||||||||||||
| $2.16 - $2.44 | 146,113 | 3.0 | $ | 2.21 | 75,281 | $ | 2.26 | |||||||||||||||
| $3.48 - $10.84 | 128,875 | 1.5 | $ | 4.95 | 113,751 | $ | 5.15 | |||||||||||||||
| $17.44 - $32.08 | 1,295 | 0.5 | $ | 32.08 | 1,295 | $ | 32.08 | |||||||||||||||
| $0.11 - $32.08 | 479,744 | 3.0 | $ | 2.47 | 365,038 | $ | 2.64 | |||||||||||||||
13. Stock Warrants and Warrant Liability
On February 17, 2011, we entered into a securities purchase agreement and issued Series K Warrants to purchase up to 1,700,002 shares of common stock at an exercise price of $2.40 per share, which warrants are not exercisable until six months after issuance and have a term of five and one-half years. The fair value of the warrants was estimated using Black-Scholes with the following weighted-average assumptions: risk-free interest rate of 1.4%, an expected life of 4.1 years; an expected volatility factor of 103.2% and a dividend yield of 0.0%. The estimated value of these warrants was approximately $2.6 million, of which $2.6 million was reflected as common stock warrant liability with an offset to preferred stock as of the offering close date. As a result of the August 16, 2011 security sale, the exercise price of the Series K warrants was reduced from $2.40 to $1.01; as a result of the September 28, 2011 security sale, the exercise price of the Series K warrants was further reduced from $1.01 to $0.80. The estimated value assigned to the reduction in exercise price was $270,000 and $50,000, respectively, on August 16, 2011 and September 28, 2011, and we recognized a non-cash charge from the change in the fair value of the warrants. During the nine months ended September 30, 2012, 472,222 Series K Warrants were exercised at a price of $0.60 per share and total proceeds of approximately $283,000. As a result of the exercise, we recognized approximately $253,000 in the change in the estimated value assigned to the warrants as an increase to equity and a decrease to the warrant liability. On March 30, 2012, we entered into an Amendment to Securities Purchase Agreement with the holders of the remaining Series K warrants (Series K Amendment) reducing the exercise price to $0.40 and removing provisions for any future price adjustment to the exercise price. On March 30, 2012, the fair value of the warrants was estimated using Black-Scholes with the following weighted average assumptions: risk-free interest rate of 0.5%, an expected life of 3.0 years; an expected volatility factor of 109.3% and a dividend yield of 0.0%. The fair value of the warrants increased to approximately $481,000 as of March 30, 2012 and we recognized a $425,000 unfavorable non-cash adjustment from the change in fair value of these warrants for the three months ended March 31, 2012. On March 30, 2012, as a result of the Series K Amendment, the fair value of the warrants of approximately $481,000 was reclassified from warrant liability to equity.
In connection with the February 17, 2011 securities purchase agreement, we issued as a placement agent fee to our financial advisory firm warrants to purchase 60,000 shares of common stock at an exercise price of $2.44 per share, with a term of five years. The fair value of the warrants was estimated using Black-Scholes with the following weighted-average assumptions: risk-free interest rate of 1.4%, an expected life of 3.8 years; an expected volatility factor of 103.2% and a dividend yield of 0.0%. The estimated value of these warrants was approximately $89,000 which was reflected as a reduction in the net proceeds of the preferred stock with an offset to additional paid in capital as of the offering close date.
On August 16, 2011, we entered into a securities purchase agreement and issued Series L Warrants to purchase up to 643,564 shares of common stock at an exercise price of $1.17 per share, which warrants were not exercisable until six months after issuance and have a term of five and one-half years. The fair value of the warrants was estimated using Black-Scholes with the following weighted-average assumptions: risk-free interest rate of 0.3%, an expected life of 4.1 years; an expected volatility factor of 109.5% and a dividend yield of 0.0%. The estimated value of these warrants was approximately $554,000. In connection with the August 16, 2011 securities purchase agreement, we agreed to extend the term of the remainder of our outstanding Series J Warrants until March 28, 2017. The estimated value assigned to the reduction in exercise price and extension of these warrants was approximately $86,000. As the terms of the Series J Warrants are classified as equity, as opposed to liability, there was no accounting impact as a result of the amendment to the Series J Warrant agreement.
On September 28, 2011, we entered into a securities purchase agreement and issued Series M Warrants to purchase up to 325,000 shares of common stock at an exercise price of $0.81 per share, which warrants are not exercisable until six months after issuance and have a term of 5½ years. The fair value of the warrants was estimated using Black-Scholes with the following weighted-average assumptions: risk-free interest rate of 0.4%, an expected life of 4.1 years; an expected volatility factor of 109.1% and a dividend yield of 0.0%. The estimated value of these warrants was approximately $193,000. In connection with the September 28, 2011 securities purchase agreement, we agreed to extend the term of the remainder of our outstanding Series L Warrants until March 28, 2017. The estimated value assigned to the reduction in exercise price and extension of these warrants was approximately $31,000. As the terms of the Series L Warrants are classified as equity, as opposed to liability, there was no accounting impact as a result of the amendment to the Series L Warrant agreement.
The following table summarizes the Warrant activity for the twelve months ending December 31, 2012 and 2011:
|
Warrants for Number of Shares
|
Weighted-Average Exercise Price
|
|||||||
|
Outstanding at January 1, 2012
|
1,503,997 | $ | 9.32 | |||||
|
Issued
|
2,758,269 | $ | 0.72 | |||||
|
Exercised
|
— | $ | — | |||||
|
Cancelled/expired
|
(156,250 | ) | $ | (5.36 | ) | |||
|
Outstanding at December 31, 2012
|
4,106,016 | $ | 3.57 | |||||
|
Issued
|
— | $ | — | |||||
|
Exercised
|
(472,222 | ) | $ | (0.60 | ) | |||
|
Cancelled/expired
|
(235,749 | ) | $ | (40.32 | ) | |||
|
Outstanding at December 31, 2012
|
3,398,045 | $ | 1.36 | |||||
14. Fair Value Measurement
We use a fair-value approach to value certain assets and liabilities. Fair value is the price that would be received to sell an asset or paid to transfer a liability in an orderly transaction between market participants at the measurement date. As such, fair value is a market-based measurement that should be determined based on assumptions that market participants would use in pricing an asset or liability. We use a fair value hierarchy, which distinguishes between assumptions based on market data (observable inputs) and an entity’s own assumptions (unobservable inputs). The hierarchy consists of three levels:
|
•
|
Level one — Quoted market prices in active markets for identical assets or liabilities;
|
|
•
|
Level two — Inputs other than level one inputs that are either directly or indirectly observable; and
|
|
•
|
Level three — Unobservable inputs developed using estimates and assumptions, which are developed by the reporting entity and reflect those assumptions that a market participant would use.
|
Determining which category an asset or liability falls within the hierarchy requires significant judgment. We evaluate our hierarchy disclosures each quarter. Assets and liabilities measured at fair value on a recurring basis are summarized as follows:
|
Liabilities
|
Level 1
|
Level 2
|
Level 3
|
December 31, 2012
|
||||||||||||
|
Fair value of common stock warrant liability
|
$ | — | $ | — | $ | 9 | $ | 9 | ||||||||
|
Accrued rent related to office closures
|
— | — | 8,657 | 8,657 | ||||||||||||
|
Total
|
$ | — | $ | — | $ | 8,666 | $ | 8,666 | ||||||||
|
Liabilities
|
Level 1
|
Level 2
|
Level 3
|
December 31, 2011
|
||||||||||||
|
Fair value of common stock warrant liability
|
$ | — | $ | — | $ | 317,490 | $ | 317,490 | ||||||||
|
Accrued rent related to office closures
|
— | — | 79,888 | 79,888 | ||||||||||||
|
Total
|
$ | — | $ | — | $ | 397,378 | $ | 397,378 | ||||||||
A discussion of the valuation techniques used to measure fair value for the common stock warrants is in Note 13. The accrued rent relates to a non-cash charge for the closure of our Anaheim, California location, calculated by discounting the future lease payments to their present value using a risk-free discount rate from 0.6%. The accrued rent is included within liabilities of discontinued operations and long-term liabilities of discontinued operations in our consolidated balance sheets.
The following table shows the changes in Level 3 liabilities measured at fair value on a recurring basis for the nine months ended December 31, 2012:
|
Other Liabilities*
|
Common Stock Warrant Liability
|
Total Level 3
|
||||||||||
|
Beginning balance – January 1, 2012
|
$ | 79,888 | $ | 317,490 | $ | 397,378 | ||||||
|
Total realized and unrealized gains or losses
|
354 | 416,526 | 416,880 | |||||||||
|
Repayments
|
(71,585 | ) | — | (71,585 | ) | |||||||
|
Transfers out of level 3 upon exercise or conversion
|
— | (734,007 | ) | (734,007 | ) | |||||||
|
Ending balance – December 31, 2012
|
$ | 8,657 | $ | 9 | $ | 8,666 | ||||||
* Represents the estimated fair value of the office closures included in accrued and other long-term liabilities.
15. Income Taxes
During the years ended December 31, 2012 and 2011, respectively, there was no income tax expense or benefit for federal and state income taxes in the accompanying consolidated statements of operations due to our net loss and a valuation allowance on the resulting deferred tax assets.
The actual tax expense differs from the “expected” tax expense for the years ended December 31, 2012 and 2011 (computed by applying the U.S. Federal Corporate tax rate of 34% to income before taxes) as follows:
|
December 31, 2012
|
December 31, 2011
|
|||||||
|
Tax at Federal Statutory Rate
|
$ | (2,936,000 | ) | $ | (1,536,000 | ) | ||
|
State taxes, net of Federal benefit
|
(454,000 | ) | (385,000 | ) | ||||
|
Research and Development Credits
|
— | (13,000 | ) | |||||
|
Fair Market Value of Warrants
|
142,000 | (882,000 | ) | |||||
|
Stock Based Compensation
|
145,000 | 218,000 | ||||||
|
Other permanent items
|
(7,000 | ) | 2,000 | |||||
|
Valuation allowance
|
3,110,000 | 2,596,000 | ||||||
|
Income Tax Provision
|
$ | — | $ | — | ||||
The tax effects of temporary differences that give rise to significant portions of deferred tax assets and liabilities at December 31, 2012 and 2011 are as follows:
|
December 31, 2012
|
December 31, 2011
|
|||||||
|
Deferred tax assets:
|
||||||||
|
Net operating loss and credit carryforwards
|
$ | 27,874,000 | $ | 24,978,000 | ||||
|
Stock-Based Compensation
|
1,190,000 | 1,113,000 | ||||||
|
Accruals
|
976,000 | 811,000 | ||||||
|
Basis difference for fixed assets and intangibles
|
190,000 | 224,000 | ||||||
|
Total gross deferred tax assets
|
30,230,000 | 27,126,000 | ||||||
|
Valuation allowance
|
(30,230,000 | ) | (27,126,000 | ) | ||||
|
Net deferred tax assets
|
$ | — | $ | — | ||||
A valuation allowance is provided when it is more likely than not that some portion of the deferred tax assets will not be realized. We established a 100% valuation allowance due to the uncertainty of realizing future tax benefits from its net operating loss carryforwards and other deferred tax assets. At December 31, 2012, we had useable net operating loss carryforwards of approximately $69.4 million for federal and $67.2 million for state income tax purposes available to offset future taxable income expiring through 2032 for both federal and California. At December 31, 2012, we had useable R & D credits of approximately $332,000 for federal and $231,000 for California. The federal credits expire through 2032 and the state credits have no expiration. The net change in the valuation allowance during the years ended December 31, 2012 and 2011 was an increase of approximately $3,100,000 primarily due to current year losses.
Internal Revenue Code Section 382 places a limitation (the "Section 382 Limitation") on the amount of taxable income, which can be offset by net operating loss carryforwards after a change in control (generally greater than a 50% change in ownership) of a loss corporation. Generally, after a control change, a loss corporation cannot deduct operating loss carryforwards in excess of the Section 382 Limitation. Due to these "change in ownership" provisions, utilization of the net operating loss and tax credit carryforwards may be subject to an annual limitation regarding their utilization against taxable income in future periods. The company has not concluded its analysis of Section 382 through December 31, 2012 but believes that these provisions will not limit the availability of losses to offset future income.
On January 1, 2007, we adopted ASC Topic 740—Income Taxes (“ASC 740”) FASB ASC 740, “Income Taxes—an interpretation of FASB Statement No. 109” (“FIN 48”). Due to net operating loss and research credit carryforwards, substantially all of our tax years remain open to U.S. federal and state tax examinations. We classify interest and penalties recognized pursuant to Interpretation 48 as part of income tax expense. No interest or penalties related to unrecognized tax benefits have been accrued for the year ended December 31, 2012. We anticipate our unrecognized tax benefits will increase in the next 12 months due to any additional research credits claimed.
The aggregate changes in the balance of gross unrecognized tax benefits were as follows (in thousands):
|
2012
|
2011
|
|||||||
|
Balance, beginning of year
|
$ | 136,000 | $ | 123,000 | ||||
|
Additions based on tax positions related to the current year
|
— | 13,000 | ||||||
|
Additions for tax positions related to prior years
|
4,000 | — | ||||||
|
Reductions for tax positions related to prior years
|
— | — | ||||||
|
Balance, end of year
|
$ | 140,000 | $ | 136,000 | ||||
In the event that any unrecognized tax benefits are recognized, the effective tax rate will be affected. Approximately $121,000 and $117,000 at December 31, 2012 and 2011 respectively, of unrecognized tax benefits would impact the effective rate, if recognized.
16. Commitments and Contingencies
Westinghouse License
On May 17, 2010, we entered into an exclusive worldwide agreement that permits us to manufacture, distribute and market our solar panels under the Westinghouse name. The agreement automatically renews on January 1, 2014, unless terminated by us upon written notification at least 120 days prior to termination. Future minimum payments due under this agreement are $1.0 million for the year ending December 31, 2013.
Non-Cancelable Operating Leases
The operating lease for our Campbell, California corporate office facility expires on December 31, 2013. The lease on our San Jose, California warehouse facility is month-to-month. Total rent paid for continuing operations amounted to approximately $203,000 and $200,000 for the years ended December 31, 2012 and 2011, respectively. Total rent paid for the years ended December 31, 2012 and 2011 for our discontinued installation operations amounted to approximately $90,000, offset by $23,000 in rental income, and $265,000, offset by $41,000 in rental income, respectively. During the year ended December 31, 2010, we took a non-cash charge of approximately $236,000 for future lease payments for office space in Anaheim, Clovis and San Diego, California. We do not occupy the Anaheim, Clovis and San Diego locations as a result of the discontinuation of our installation operations. Future minimum lease payments on operating leases at December 31, 2012 are as follows:
|
2013
|
$ | 115,059 | ||
|
2014
|
— | |||
|
2015
|
— | |||
|
2016
|
— | |||
|
2017
|
— | |||
|
Thereafter
|
— | |||
|
Total minimum lease payments
|
$ | 115,059 |
Litigation
On May 1, 2012, Suntech America, Inc., a Delaware corporation (Suntech America), filed a complaint for breach of contract, goods sold and delivered, account stated and open account against us in the Superior Court of the State of California, County of San Francisco. Suntech America alleged that it delivered products and did not receive full payment from us. On July 31, 2012, we and Suntech entered into a settlement of this dispute. Because of our inability to make scheduled settlement payments, on March 15, 2013, Suntech entered a judgment against us in the amount of $946,438. As of March 28, 2013, Suntech has not sought to enforce its judgment. As of December 31, 2012, we have included in our Condensed Consolidated Balance Sheets a balance due to Suntech America of 946,438.
On December 28, 2012, we filed a complaint against Lennar Homes, LLC (Lennar) in the United States District Court for the Southern District of Florida stating claims for breach of contract under a supply agreement. As previously disclosed, Lennar had agreed to purchase solar power systems from us for residential housing Lennar was developing and constructing. Under the agreement, Lennar had a 600 home order commitment by March 1, 2012, with stated penalty amounts payable for any shortfall below that minimum. Through December 28, 2012, Lennar had only ordered and paid for solar power systems for 234 new homes. Lennar filed a motion to dismiss the complaint which was denied by the Judge on March 6, 2013. The matter has been scheduled for trial on the Court’s two-week trial docket commencing December 29, 2013. The parties are presently in the discovery stage and on March 6, 2013, were ordered to attend a non-binding settlement conference in front of the Magistrate Judge. The non-binding settlement conference is scheduled for April 22, 2013.
We are also involved in other litigation from time to time in the ordinary course of business. In the opinion of management, the outcome of such proceedings will not materially affect our financial position, results of operations or cash flows.
17. Concentration of Risk in Customer and Supplier Relationships
Disruption of Supplier Relationships
Historically, we obtained virtually all of our solar panels from Suntech. On March 25, 2011, we entered into a volume supply agreement for a new generation of our solar panel products with Lightway, and in August 2011, we began purchasing solar panels from Lightway. Both Suntech and Lightway manufacture panels for us that are built to our unique specifications. We had a limited amount of remaining inventory on hand as of December 31, 2012, and although we are actively negotiating alternative sources of supply through other sources, including a CBD Energy Limited preferred supplier, the disruption and loss of our historical primary component supply relationships is severely disruptive to our operations. In recent periods, because of our cash position and liquidity constraints, we have been late in making payments to both of our panel suppliers. On March 30, 2012, pursuant to our Supply Agreement with Lightway, we issued 1,900,000 shares of our common stock to Lightway in partial payment of our past due account payable to them. At the time of issuance, the shares were valued at $1,045,000. On May 1, 2012, Suntech America filed a lawsuit against us for breach of contract, alleging that it delivered products to us and has not received full payment, and seeking payment of approximately $990,000. On July 31, 2012, we and Suntech entered into a settlement of this dispute, which allows and requires us make payment of the account balance over time, with the unpaid balance accruing interest at 10% per annum. As of December 31 2012, we have included in our Condensed Consolidated Balance Sheets, under accounts payable, a balance due to Suntech America of $870,000, plus accrued interest of $76,438, which is included in accrued liabilities in our Condensed Consolidated Balance Sheets. We do not anticipate that our prior supplies will make and further shipments to us, which is resulting in decreased sales and revenue for us, and adversely affecting our customer relationships. We currently do not have any unshipped orders for solar panel product pending with Suntech or Lightway and we have not received any shipments of panels since April 2012.
Concentration of Risk in Customer Relationships
The relative magnitude and the mix of revenue from our largest customers have varied significantly quarter to quarter. During the year ended December 31, 2012 and 2011, three customers have accounted for significant revenues, varying by period, to our company: Lennar Corporation (Lennar), a leading national homebuilder, Lennox International Inc. (Lennox), a global leader in the heating and air conditioning markets, and Lowe’s Companies, Inc. (Lowe’s), a nationwide home improvement retail chain. For the year ended December 31, 2012 and 2011, the percentages of sales to Lennar, Lennox and Lowe’s are as follows:
|
Twelve Months Ended December 31,
|
||||||||
|
2012
|
2011
|
|||||||
|
Lennar Corporation
|
8.8 | % | 21.5 | % | ||||
|
Lennox International Inc.
|
30.1 | % | 20.6 | % | ||||
|
Lowe’s Companies, Inc.
|
7.7 | % | 3.5 | % | ||||
We had no receivable balance from Lennar as of December 31, 2012 or December 31, 2011. Lennox accounted for 5.9% and 23.1% of our gross accounts receivable as of December 31, 2012 and 2011, respectively. Lowe’s accounted for 4.0% and 13.9% of our gross accounts receivable as of December 31, 2012 and 2011, respectively.
We maintain reserves for potential credit losses and such losses, in the aggregate, have generally not exceeded management’s estimates. Our top three vendors accounted for approximately 36.1% and 61.3% of materials purchased during the years ended December 31, 2012 and 2011, respectively. At December 31, 2012, accounts payable included amounts owed to these top three vendors of approximately $960,000. At December 31, 2011, accounts payable included amounts owed to the top three vendors of approximately $3.3 million.
18. Employee Benefit Plan
On December 14, 2007, the Board of Directors approved the 401(k) profit sharing plan (the “401(k) Plan”) effective January 1, 2008. Employees began deferring a portion of their compensation into the 401(k) Plan commencing on January 1, 2008. In 2011, we began making matching contributions equal to 10% of the employee contribution. For the year ended December 31, 2012, there was no accrual relating to this matching contribution. For the year ended December 31, 2011, approximately $13,000 was included in accrued liabilities related to this matching contribution.
19. Subsequent Events
On January 24, 2013, we provided to the Purchasers of our Series C Preferred Stock a draw down notice under the Purchase Agreement. The Purchasers agreed to accept the new draw down notice and thereby extend our right to exercise a “put” to sell additional Series C Preferred beyond the Securities Purchase Agreement’s prior expiration date of December 31, 2012. As a result of the draw down, we sold an aggregate of 75 additional shares of Series C Preferred to the Purchasers for aggregate proceeds of $75,000. Based on the closing price of our common stock as reported on the OTCQB Marketplace on January 24, 2013 (which was $0.05 per share), the 75 shares of Series C Preferred to be issued pursuant to the draw down would be convertible into 1,500,000 shares of our common stock.
As a result of the January 24, 2013 draw down notice, pursuant to the terms of the outstanding Series B 4% Convertible Preferred Stock (the “Series B Preferred”), the conversion price of the Series B Preferred was reduced from $0.08 per share of common stock to become equal to $0.05, and the conversion price of the Series C Preferred issued under the initial closing was reduced from $0.08 per share of common stock to become equal to $0.05. As a result of the contingent conversion feature on the Series C Preferred, which reduced the conversion price from $0.08 to $0.05 per share on the total 795 shares of Series C Preferred Stock issued and outstanding at January 24, 2013, and which resulted in an increase in the number of common shares issuable, we recognized additional preferred deemed dividends of $270,000. Since we are in an accumulated deficit position, the deemed dividend was charged against additional paid-in-capital for common shares, there being no retained earnings from which to declare a dividend. As of March 7, 2013, there were 2,209.686 shares of Series B Preferred that remain outstanding. With the January 24, 2013 draw down, and after recent conversions of our Series C Preferred, there are 310 shares of Series C Preferred that remain outstanding. After adjustment to the conversion prices as a result of the January 24th draw down, the outstanding Series B Preferred and Series C Preferred would be convertible into 39,774,348 shares and 6,200,000 shares, respectively, of our common stock.
On February 15, 2013, we entered into a securities purchase agreement with certain institutional accredited investors (the “Purchasers”) relating to the sale and issuance of up to 1,000 shares of our newly created Series D 8% Convertible Preferred Stock (Series D Preferred) at a price per share equal to the stated value, which is $1,000 per share, for aggregate proceeds of up to $1,000,000. At the initial closing, concurrent with entering the agreement, we issued 150 shares of Series D Preferred, for initial aggregate proceeds of $150,000. After the initial closing, the Securities Purchase Agreement permits the purchasers to exercise a “call” right to purchase additional Series D Preferred in multiple draw downs from time to time until December 31, 2013, subject to certain limits, terms and conditions. Subsequently, on March 21, 2013, we issued 167 shares of Series D Preferred for aggregate proceeds of $100,000.
Item 9. Changes in and Disagreements With Accountants on Accounting and Financial Disclosure.
None.
Item 9A. Controls and Procedures.
Evaluation of Disclosure Controls and Procedures
Our management, with the participation of our Chief Executive Officer and Chief Financial Officer, evaluated the effectiveness of our disclosure controls and procedures as of December 31, 2012. Based upon that evaluation, our Chief Executive Officer and Chief Financial Officer concluded that our disclosure controls and procedures were effective at the reasonable assurance level as of the end of the period covered by this report. In designing and evaluating our disclosure controls and procedures, we and our management recognize that any controls and procedures, no matter how well designed and operated, can provide only reasonable assurance of achieving the desired control objectives, and our management necessarily was required to apply its judgment in evaluating and implementing possible controls and procedures. In addition, the design of any control system is based in part upon certain assumptions about the likelihood of future events.
The term “disclosure controls and procedures,” as defined in Rules 13a-15(e) and 15d-15(e) under the Exchange Act, means controls and other procedures of a company that are designed to ensure that information required to be disclosed by a company in the reports that it files or submits under the Exchange Act is recorded, processed, summarized and reported, within the time periods specified in the SEC’s rules and forms. Disclosure controls and procedures include, without limitation, controls and procedures designed to ensure that information required to be disclosed by a company in the reports that it files or submits under the Exchange Act is accumulated and communicated to the company’s management, including its principal executive and principal financial officers, as appropriate to allow timely decisions regarding required disclosure.
Quarterly Evaluation of Changes in Internal Control Over Financial Reporting
Our management, with the participation of our Chief Executive Officer and Chief Financial Officer, also conducted an evaluation of our internal control over financial reporting (as defined in Rule 13a-15(f) under the Exchange Act) to determine whether any change occurred during the fourth quarter of 2012 that has materially affected, or is reasonably likely to materially affect, our internal control over financial reporting. Based on that evaluation, our management concluded that there was no such change during the fiscal quarter ended December 31, 2012.
Management’s Annual Report on Internal Control Over Financial Reporting
Our management is responsible for establishing and maintaining adequate internal control over financial reporting, as defined in Exchange Act Rule 13a-15(f). Our system of internal control over financial reporting is designed to provide reasonable assurance regarding the reliability of financial reporting and the preparation and fair presentation of financial statements for external purposes in accordance with generally accepted accounting principles.
Under the supervision and with the participation of our management, including our Chief Executive Officer and Chief Financial Officer, we conducted an evaluation of the effectiveness of our internal control over financial reporting based on the framework established by the Committee of Sponsoring Organizations of the Treadway Commission (COSO) as set forth in Internal Control. Based on our evaluation under the framework in Internal Control, our management concluded that our internal control over financial reporting was effective as of December 31, 2012.
This annual report does not include an attestation report of the company's registered public accounting firm regarding internal control over financial reporting. Management's report was not subject to attestation by the company's registered public accounting firm pursuant to temporary rules of the Securities and Exchange Commission that permit the company to provide only management's report in this annual report.
Because of its inherent limitations, internal control over financial reporting may not prevent or detect misstatements. It should be noted that any system of controls, however well designed and operated, can provide only reasonable, and not absolute, assurance that the objectives of the system will be met. In addition, the design of any control system is based in part upon certain assumptions about the likelihood of future events. Also, projections of any evaluation of effectiveness to future periods are subject to the risk that controls may become inadequate because of changes in conditions, or that the degree of compliance with the policies or procedures may deteriorate.
Item 9B. Other Information.
None
PART III
Item 10. Directors, Executive Officers and Corporate Governance.
Information required by Part III under Item 10 will be included in either our Proxy Statement for the 2013 Annual Meeting of Stockholders or an amendment to this Annual Report on Form 10-K, one of which will be filed with the SEC within 120 days after December 31, 2012, and is incorporated herein by reference.
Item 11. Executive Compensation.
Information required by Part III under Item 11 will be included in either our Proxy Statement for the 2013 Annual Meeting of Stockholders or an amendment to this Annual Report on Form 10-K, one of which will be filed with the SEC within 120 days after December 31, 2012, and is incorporated herein by reference.
Item 12. Security Ownership of Certain Beneficial Owners and Management, and Related Stockholder Matters.
Information required by Part III under Item 12 will be included in either our Proxy Statement for the 2013 Annual Meeting of Stockholders or an amendment to this Annual Report on Form 10-K, one of which will be filed with the SEC within 120 days after December 31, 2012, and is incorporated herein by reference.
Item 13. Certain Relationships and Related Transactions; and Director Independence.
Information required by Part III under Item 13 will be included in either our Proxy Statement for the 2013 Annual Meeting of Stockholders or an amendment to this Annual Report on Form 10-K, one of which will be filed with the SEC within 120 days after December 31, 2012, and is incorporated herein by reference.
Item 14. Principal Accountant Fees and Services.
Information required by Part III under Item 14 will be included in either our Proxy Statement for the 2013 Annual Meeting of Stockholders or an amendment to this Annual Report on Form 10-K, one of which will be filed with the SEC within 120 days after December 31, 2012, and is incorporated herein by reference.
|
Exhibit
Number
|
Description
|
||
| 2.1 |
Agreement of Merger and Plan of Reorganization, dated August 11, 2006, by and among Fairview Energy Corporation, Inc., ASI Acquisition Sub, Inc. and Westinghouse Solar, Inc. (incorporated herein by reference to Exhibit 2.1 to our Current Report on Form 8-K, dated August 11, 2006 (the “August 2006 8-K”))
|
||
| 2.2 |
Agreement and Plan of Merger, dated May 7 2012, by and among Westinghouse Solar, Inc., CBD Energy Limited and CBD-WS Merger Sub, Inc. (incorporated herein by reference to Exhibit 2.1 to our Current Report on Form 8-K, filed on May 9, 2012)
|
||
| 2.3 |
Amendment No. 1 to Waiver Agreement, by and among Capital Anstalt, Westinghouse Solar, Inc., and CBD Energy Limited, dated as of September 21, 2012 (incorporated by reference to Exhibit 2.1 to our Current Report on Form 8-K filed on September 27, 2012)
|
||
| 3.1 |
Certificate of Incorporation (incorporated herein by reference to Exhibit 3.1 to our Current Report on Form 8-K, dated August 3, 2006)
|
||
| 3.2 |
By-laws (incorporated herein by reference to Exhibit 3.2 to our Current Report on Form 8-K, dated August 3, 2006)
|
||
| 3.3 |
Certificate of Amendment to the Certificate of Incorporation (incorporated herein by reference to Exhibit 3.3 to the August 2006 8-K)
|
||
| 3.4 |
Certificate of Amendment to the Certificate of Incorporation (incorporated herein by reference to Exhibit 3.4 to our Current Report on Form 10-Q filed on July 30, 2010)
|
||
| 3.5 |
Certificate of Amendment to the Certificate of Incorporation as filed with the Delaware Secretary of State on April 6, 2011 (incorporated herein by reference to Exhibit 3.5 to our Current Report on Form 10-Q filed on May 10, 2011)
|
||
| 4.1 |
Form of Restricted Stock Agreement (incorporated herein by reference to Exhibit 4.1 to our Annual Report on Form 10-KSB filed with the SEC on March 29, 2007)
|
||
| 4.2 |
Form of Series E/F/G Warrants (incorporated by reference to Exhibit 4.1 to our Current Report on Form 8-K filed on February 26, 2009)
|
||
| 4.3 |
Form of Securities Purchase Warrant (incorporated by reference to Exhibit 4.6 to our Current Report on Form 8-K filed on October 22, 2009)
|
||
| 4.4 |
Form of Series I Common Stock Purchase Warrant (incorporated by reference to Exhibit 4.1 to our Current Report on Form 8-K filed on May 17, 2010)
|
||
| 4.5 |
Form of Series J Common Stock Purchase Warrant (incorporated by reference to Exhibit 4.1 to our Current Report on Form 8-K filed on October 8, 2010)
|
||
| 4.6 |
Form of Series K Common Stock Purchase Warrant (incorporated by reference to Exhibit 4.1 to our Current Report on Form 8-K filed on February 17, 2011)
|
||
| 4.7 |
Form of Series L Common Stock Purchase Warrant (incorporated by reference to Exhibit 4.1 to our Current Report on Form 8-K filed on August 17, 2011)
|
||
| 4.8 |
Form of Series M Common Stock Purchase Warrant (incorporated by reference to Exhibit 4.1 to our Current Report on Form 8-K filed on September 28, 2011)
|
||
| 4.9 |
Certificate of Designation of Preferences, Rights and Limitations with respect to Series B 4% Convertible Preferred Stock (the “Certificate of Designation”), as filed on February 17, 2011 (incorporated by reference to Exhibit 4.2 to our Current Report on Form 8-K filed on February 17, 2011)
|
||
| 4.10 |
Certificate of Amendment to the Certificate of Designation (incorporated by reference to Exhibit 3(i) to our Current Report on Form 8-K filed on August 24, 2011)
|
||
| 4.11 |
Certificate of Designation of Preferences, Rights and Limitations of Series C 8% Convertible Preferred Stock, as filed on February 17, 2011 (incorporated by reference to Exhibit 4.1 to our Current Report on Form 8-K filed on October 19, 2012)
|
||
| 4.12 |
Certificate of Amendment of the Certificate of Designation of Preferences, Rights and Limitations of the Series B 4% Convertible Preferred Stock, dated as of October 18, 2012 (incorporated by reference to Exhibit 4.1 to our Current Report on Form 8-K filed on October 19, 2012)
|
||
| 10.1 | ‡ |
Westinghouse Solar, Inc. 2006 Stock Incentive Plan (incorporated herein by reference to Exhibit 10.1 to the August 14, 2006 8-K)
|
|
| 10.1a | ‡ |
Westinghouse Solar, Inc. 2006 Stock Incentive Plan Form of Restricted Stock Agreement (incorporated herein by reference to Exhibit 10.11 to the August 14, 2006 8-K)
|
|
| 10.1b | ‡ |
Westinghouse Solar, Inc. 2006 Stock Incentive Plan Form of Nonqualified Stock Option Agreement (incorporated herein by reference to Exhibit 10.11 to the August 14, 2006 8-K)
|
|
| 10.2 | ‡ |
First Amendment to the Westinghouse Solar, Inc. 2006 Incentive Stock Plan (incorporated herein by reference to Exhibit 10.1 to our Current Report on Form 8-K, dated December 20, 2006)
|
|
| 10.3 |
Form of Subscription Agreement (incorporated herein by reference to Exhibit 10.2 to the August 2006 8-K)
|
||
| 10.4 |
Form of Registration Rights Agreement (incorporated herein by reference to Exhibit 10.3 to the August 2006 8-K)
|
||
| 10.5 |
Form of Lockup Agreement (incorporated herein by reference to Exhibit 10.4 to the August 2006 8-K)
|
||
| 10.6 | ‡ |
Restricted Stock Agreement, dated December 29, 2006, between the Company and Edward Roffman (incorporated herein by reference to Exhibit 10.8 to our Annual Report on Form 10-KSB filed with the SEC on March 29, 2007)
|
|
| 10.7 |
Form of Director and Officer Indemnification Agreement (incorporated herein by reference to Exhibit 10.9 to the August 2006 8-K)
|
||
| 10.8 | ‡ |
Second Amendment to the Westinghouse Solar, Inc. 2006 Incentive Stock Plan (incorporated herein by reference to Exhibit 10.11 to our Quarterly Report on Form 10-KSB filed with the SEC on March 19, 2008)
|
|
| 10.9 |
Standard Industrial/Commercial Single-Tenant Lease - Net, dated September 30, 2002, between Mattiuz Children’s Trust and the Company, as amended by First Addendum to Standard Industrial/Commercial Single-Tenant Lease — Net, dated April 26, 2004, Second Addendum Standard Industrial/Commercial Single-Tenant Lease — Net, dated April 30, 2005 and Third Addendum to Standard Industrial/Commercial Single-Tenant Lease, dated July 7, 2006 (incorporated herein by reference to Exhibit 10.11 to our Current Report on Form 8-K/A, dated August 11, 2006 (the “August 2006 8-K/A”))
|
||
| 10.10 |
Securities Purchase Agreement, dated March 8, 2007, between the Company and the purchasers signatory thereto (incorporated herein by reference to Exhibit 10.1 to the March 8, 2007 8-K)
|
||
| 10.11 |
Securities Purchase Agreement, dated May 25, 2007, between the Company and the purchasers signatory thereto (incorporated herein by reference to Exhibit 10.1 to our Current Report on Form 8-K, dated June 4, 2007)
|
||
| 10.12 |
Registration Rights Agreement (incorporated herein by reference to Exhibit 10.2 to our Current Report on Form 8-K, dated June 4, 2007)
|
||
| 10.13 |
Securities Purchase Agreement, dated November 1, 2007, between the Company and the investors signatory thereto (incorporated herein by reference to Exhibit 10.1 to our Current Report on Form 8-K, dated November 1, 2007)
|
||
| 10.14 |
Security Purchase Agreement by and among Westinghouse Solar, Inc. and the Purchaser(s) (as defined therein), dated as of February 26, 2009 (incorporated by reference to Exhibit 10.1 to our Current Report on Form 8-K filed on February 26, 2009)
|
| 10.15 |
Securities Purchase Agreement by and among Westinghouse Solar, Inc. and the Purchaser (as defined therein), dated as of October 21, 2009 (incorporated by reference to Exhibit 10.18 to our Current Report on Form 8-K filed on October 22, 2009)
|
||
| 10.16 | ‡ |
Third Amendment to the Westinghouse Solar, Inc. 2006 Incentive Stock Plan (incorporated by reference to Exhibit 10.17 to our Annual Report on Form 10-K filed on March 16, 2009)
|
|
| 10.17 |
Stock Purchase Agreement by and among Westinghouse Solar, Inc. and the Purchaser (as defined therein), dated as of May 17, 2010 (incorporated herein by reference to Exhibit 10.1 to our Current Report on Form 8-K filed on May 17, 2010)
|
||
| 10.18 |
Stock Purchase Agreement by and among Westinghouse Solar, Inc. and the Purchaser (as defined therein), dated as of October 7, 2010 (incorporated herein by reference to Exhibit 10.1 to our Current Report on Form 8-K filed on October 7, 2010)
|
||
| 10.19 |
Master Assignment and Assumption Agreement by and among Westinghouse Solar, Inc., Real Goods Energy Tech, Inc. and SunRun Inc., dated as of October 12, 2010 (incorporated herein by reference to Exhibit 10.2 to our Current Report on Form 10-Q filed on November 10, 2010)
|
||
| 10.20 |
Supply and Warranty Agreement by and between Westinghouse Solar, Inc. and Real Goods Energy Tech, Inc., dated as of October 7, 2010 (incorporated herein by reference to Exhibit 10.3 to our Current Report on Form 10-Q filed on November 10, 2010)
|
||
| 10.21 | µ |
Supply agreement by and among Akeena Solar, Inc. and Enphase Energy, dated on January 31, 2009 (incorporated herein by reference to Exhibit 10.26 to our Annual Report on Form 10-K/A filed on June 14, 2011)
|
|
| 10.22 | µ |
License Agreement by and among Akeena Solar, Inc. and Westinghouse Electric Corporation, dated on January 1, 2010.
|
|
| 10.23 |
Business Financing Agreement by and among Westinghouse Solar, Inc. its subsidiaries and Bridge Bank, National Association, dated February 15, 2011. (incorporated herein by reference to Exhibit 10.3 to our Current Report on Form 10-K filed on March 2, 2011)
|
||
| 10.24 |
Securities Purchase Agreement by and among Westinghouse Solar, Inc. and the Purchaser (as defined therein), dated as of February 17, 2011 (incorporated herein by reference to Exhibit 10.1 to our Current Report on Form 8-K filed on February 17, 2011)
|
||
| 10.25 |
Form of Registration Rights Agreement by and among Westinghouse Solar, Inc. and the Purchases (as defined therein) (incorporated herein by reference to Exhibit 10.2 to our Current Report on Form 8-K filed on February 17, 2011)
|
||
| 10.26 |
Securities Purchase Agreement by and among Westinghouse Solar, Inc. and the Purchaser (as defined therein), dated as of August 16, 2011 (incorporated herein by reference to Exhibit 10.1 to our Current Report on Form 8-K filed on August 17, 2011)
|
||
| 10.27 |
Securities Purchase Agreement by and among Westinghouse Solar, Inc. and the Purchaser (as defined therein), dated as of September 28, 2011 (incorporated herein by reference to Exhibit 10.1 to our Current Report on Form 8-K filed on September 28, 2011)
|
||
| 10.28 |
Securities Purchase Agreement by and among Westinghouse Solar, Inc. and the CBD Energy Limited, dated as of
December 30, 2011 (incorporated by reference to Exhibit 10.1 to our Current Report on Form 8-K filed on January 12, 2012)
|
||
| 10.29 |
Employment Agreement between Westinghouse Solar, Inc. and Margaret Randazzo, dated May 7, 2012 (incorporated herein by reference to Exhibit 10.1 to our Current Report on Form 10-Q, filed on August 14, 2012)
|
||
| 10.30 |
Securities Purchase Agreement by and among Westinghouse Solar, Inc. and the Purchaser (as defined therein), dated as of August 14, 2012 (incorporated by reference to Exhibit 10.1 to our Current Report on Form 8-K filed on August 14, 2012)
|
||
| 10.31 |
Securities Purchase Agreement by and among Westinghouse Solar, Inc. and the Purchaser (as defined therein), dated as of October 18, 2012 (incorporated by reference to Exhibit 10.1 to our Current Report on Form 8-K filed on October 19, 2012)
|
| 21.1 | * |
List of Subsidiaries
|
|
| 23.1 | * |
Consent of Independent Registered Accounting Firm Burr Pilger Mayer, Inc.
|
|
| 31 | * |
Section 302 Certification of Principal Executive and Financial Officer
|
|
| 32 | * |
Section 906 Certification of Principal Executive and Financial Officer
|
|
|
101.INS
|
* |
XBRL Taxonomy Extension Instance Document †
|
|
|
101.SCH
|
* |
XBRL Taxonomy Extension Schema Linkbase Document †
|
|
|
101.CAL
|
* |
XBRL Taxonomy Extension Calculation Linkbase Document †
|
|
|
101.DEF
|
* |
XBRL Taxonomy Extension Definition Linkbase Document †
|
|
|
101.LAB
|
* |
XBRL Taxonomy Extension Labels Linkbase Document †
|
|
|
101.PRE
|
* |
XBRL Taxonomy Extension Presentation Linkbase Document †
|
|
|
*
|
Filed herewith
|
|
**
|
The certification attached as Exhibits 32 accompany this annual report on Form 10-K pursuant to 18 U.S.C. Section 1350, as adopted pursuant to Section 906 of the Sarbanes-Oxley Act of 2002, and shall not be deemed “filed” by the Registrant for purposes of Section 18 of the Securities Exchange Act of 1934, as amended.
|
|
µ
|
Confidential treatment has been requested with respect to certain confidential portions of this exhibit pursuant to Rule 24b-2 under the Securities Exchange Act of 1934, which confidential portions have been omitted from the exhibit and filed separately with the Securities and Exchange Commission.
|
|
‡
|
Management contract or compensatory plan or arrangement.
|
|
†
|
Pursuant to Rule 406T of Regulation S-T, the Interactive Data Files in Exhibit 101 hereto are deemed not filed or part of a registration statement or prospectus for purposes of Sections 11 or 12 of the Securities Act of 1933, as amended, are deemed not filed for purposes of Section 18 of the Securities Exchange Act of 1934, as amended, and otherwise are not subject to liability under those sections.
|
SIGNATURES
Pursuant to the requirements of Section 13 or 15(d) of the Securities Exchange Act of 1934, the Registrant has duly caused this Report to be signed on its behalf by the undersigned, thereunto duly authorized.
Dated: March 27, 2013
|
WESTINGHOUSE SOLAR, INC.
|
||
|
|
|
|
|
/s/ Margaret R. Randazzo
|
||
|
Margaret R. Randazzo
|
||
|
President, Chief Executive Officer and Chief Financial Officer
|
||
|
(Principal Executive Officer)
|
||
Pursuant to the requirements of the Securities Exchange Act of 1934, this report has been signed below by the following persons on behalf of the Registrant and in the capacities and on March 27, 2013.
|
Signature
|
Title
|
|
/s/ Margaret R. Randazzo
|
Chief Executive Officer
|
|
Margaret R. Randazzo
|
(Principal Financial and Accounting Officer)
|
|
/s/ Edward L. Bernstein
|
Director
|
|
Edward L. Bernstein
|
|
|
/s/ Gary Effren
|
Director
|
|
Gary Effren
|
|
|
/s/ Mark L. Kalow
|
Director
|
|
Mark L. Kalow
|
|
|
/s/ Ron Kenedi
|
Director
|
|
Ron Kenedi
|
|
|
|
Director
|
|
Robert F. Kennedy, Jr.
|
|
|
/s/ Ed Roffman
|
Director
|
|
Ed Roffman
|
|
Exhibit Index
|
Exhibit
Number
|
Description
|
||
| 2.1 |
Agreement of Merger and Plan of Reorganization, dated August 11, 2006, by and among Fairview Energy Corporation, Inc., ASI Acquisition Sub, Inc. and Westinghouse Solar, Inc. (incorporated herein by reference to Exhibit 2.1 to our Current Report on Form 8-K, dated August 11, 2006 (the “August 2006 8-K”))
|
||
| 2.2 |
Agreement and Plan of Merger, dated May 7 2012, by and among Westinghouse Solar, Inc., CBD Energy Limited and CBD-WS Merger Sub, Inc. (incorporated herein by reference to Exhibit 2.1 to our Current Report on Form 8-K, filed on May 9, 2012)
|
||
| 2.3 |
Amendment No. 1 to Waiver Agreement, by and among Capital Anstalt, Westinghouse Solar, Inc., and CBD Energy Limited, dated as of September 21, 2012 (incorporated by reference to Exhibit 2.1 to our Current Report on Form 8-K filed on September 27, 2012)
|
||
| 3.1 |
Certificate of Incorporation (incorporated herein by reference to Exhibit 3.1 to our Current Report on Form 8-K, dated August 3, 2006)
|
||
| 3.2 |
By-laws (incorporated herein by reference to Exhibit 3.2 to our Current Report on Form 8-K, dated August 3, 2006)
|
||
| 3.3 |
Certificate of Amendment to the Certificate of Incorporation (incorporated herein by reference to Exhibit 3.3 to the August 2006 8-K)
|
||
| 3.4 |
Certificate of Amendment to the Certificate of Incorporation (incorporated herein by reference to Exhibit 3.4 to our Current Report on Form 10-Q filed on July 30, 2010)
|
||
| 3.5 |
Certificate of Amendment to the Certificate of Incorporation as filed with the Delaware Secretary of State on April 6, 2011 (incorporated herein by reference to Exhibit 3.5 to our Current Report on Form 10-Q filed on May 10, 2011)
|
||
| 4.1 |
Form of Restricted Stock Agreement (incorporated herein by reference to Exhibit 4.1 to our Annual Report on Form 10-KSB filed with the SEC on March 29, 2007)
|
||
| 4.2 |
Form of Series E/F/G Warrants (incorporated by reference to Exhibit 4.1 to our Current Report on Form 8-K filed on February 26, 2009)
|
||
| 4.3 |
Form of Securities Purchase Warrant (incorporated by reference to Exhibit 4.6 to our Current Report on Form 8-K filed on October 22, 2009)
|
||
| 4.4 |
Form of Series I Common Stock Purchase Warrant (incorporated by reference to Exhibit 4.1 to our Current Report on Form 8-K filed on May 17, 2010)
|
||
| 4.5 |
Form of Series J Common Stock Purchase Warrant (incorporated by reference to Exhibit 4.1 to our Current Report on Form 8-K filed on October 8, 2010)
|
||
| 4.6 |
Form of Series K Common Stock Purchase Warrant (incorporated by reference to Exhibit 4.1 to our Current Report on Form 8-K filed on February 17, 2011)
|
||
| 4.7 |
Form of Series L Common Stock Purchase Warrant (incorporated by reference to Exhibit 4.1 to our Current Report on Form 8-K filed on August 17, 2011)
|
||
| 4.8 |
Form of Series M Common Stock Purchase Warrant (incorporated by reference to Exhibit 4.1 to our Current Report on Form 8-K filed on September 28, 2011)
|
||
| 4.9 |
Certificate of Designation of Preferences, Rights and Limitations with respect to Series B 4% Convertible Preferred Stock (the “Certificate of Designation”), as filed on February 17, 2011 (incorporated by reference to Exhibit 4.2 to our Current Report on Form 8-K filed on February 17, 2011)
|
||
| 4.10 |
Certificate of Amendment to the Certificate of Designation (incorporated by reference to Exhibit 3(i) to our Current Report on Form 8-K filed on August 24, 2011)
|
||
| 4.11 |
Certificate of Designation of Preferences, Rights and Limitations of Series C 8% Convertible Preferred Stock, as filed on February 17, 2011 (incorporated by reference to Exhibit 4.1 to our Current Report on Form 8-K filed on October 19, 2012)
|
||
| 4.12 |
Certificate of Amendment of the Certificate of Designation of Preferences, Rights and Limitations of the Series B 4% Convertible Preferred Stock, dated as of October 18, 2012 (incorporated by reference to Exhibit 4.1 to our Current Report on Form 8-K filed on October 19, 2012)
|
||
| 10.1 | ‡ |
Westinghouse Solar, Inc. 2006 Stock Incentive Plan (incorporated herein by reference to Exhibit 10.1 to the August 14, 2006 8-K)
|
|
| 10.1a | ‡ |
Westinghouse Solar, Inc. 2006 Stock Incentive Plan Form of Restricted Stock Agreement (incorporated herein by reference to Exhibit 10.11 to the August 14, 2006 8-K)
|
|
| 10.1b | ‡ |
Westinghouse Solar, Inc. 2006 Stock Incentive Plan Form of Nonqualified Stock Option Agreement (incorporated herein by reference to Exhibit 10.11 to the August 14, 2006 8-K)
|
|
| 10.2 | ‡ |
First Amendment to the Westinghouse Solar, Inc. 2006 Incentive Stock Plan (incorporated herein by reference to Exhibit 10.1 to our Current Report on Form 8-K, dated December 20, 2006)
|
|
| 10.3 |
Form of Subscription Agreement (incorporated herein by reference to Exhibit 10.2 to the August 2006 8-K)
|
||
| 10.4 |
Form of Registration Rights Agreement (incorporated herein by reference to Exhibit 10.3 to the August 2006 8-K)
|
||
| 10.5 |
Form of Lockup Agreement (incorporated herein by reference to Exhibit 10.4 to the August 2006 8-K)
|
||
| 10.6 | ‡ |
Restricted Stock Agreement, dated December 29, 2006, between the Company and Edward Roffman (incorporated herein by reference to Exhibit 10.8 to our Annual Report on Form 10-KSB filed with the SEC on March 29, 2007)
|
|
| 10.7 |
Form of Director and Officer Indemnification Agreement (incorporated herein by reference to Exhibit 10.9 to the August 2006 8-K)
|
||
| 10.8 | ‡ |
Second Amendment to the Westinghouse Solar, Inc. 2006 Incentive Stock Plan (incorporated herein by reference to Exhibit 10.11 to our Quarterly Report on Form 10-KSB filed with the SEC on March 19, 2008)
|
|
| 10.9 |
Standard Industrial/Commercial Single-Tenant Lease - Net, dated September 30, 2002, between Mattiuz Children’s Trust and the Company, as amended by First Addendum to Standard Industrial/Commercial Single-Tenant Lease — Net, dated April 26, 2004, Second Addendum Standard Industrial/Commercial Single-Tenant Lease — Net, dated April 30, 2005 and Third Addendum to Standard Industrial/Commercial Single-Tenant Lease, dated July 7, 2006 (incorporated herein by reference to Exhibit 10.11 to our Current Report on Form 8-K/A, dated August 11, 2006 (the “August 2006 8-K/A”))
|
||
| 10.10 |
Securities Purchase Agreement, dated March 8, 2007, between the Company and the purchasers signatory thereto (incorporated herein by reference to Exhibit 10.1 to the March 8, 2007 8-K)
|
||
| 10.11 |
Securities Purchase Agreement, dated May 25, 2007, between the Company and the purchasers signatory thereto (incorporated herein by reference to Exhibit 10.1 to our Current Report on Form 8-K, dated June 4, 2007)
|
||
| 10.12 |
Registration Rights Agreement (incorporated herein by reference to Exhibit 10.2 to our Current Report on Form 8-K, dated June 4, 2007)
|
||
| 10.13 |
Securities Purchase Agreement, dated November 1, 2007, between the Company and the investors signatory thereto (incorporated herein by reference to Exhibit 10.1 to our Current Report on Form 8-K, dated November 1, 2007)
|
||
| 10.14 |
Security Purchase Agreement by and among Westinghouse Solar, Inc. and the Purchaser(s) (as defined therein), dated as of February 26, 2009 (incorporated by reference to Exhibit 10.1 to our Current Report on Form 8-K filed on February 26, 2009)
|
| 10.15 |
Securities Purchase Agreement by and among Westinghouse Solar, Inc. and the Purchaser (as defined therein), dated as of October 21, 2009 (incorporated by reference to Exhibit 10.18 to our Current Report on Form 8-K filed on October 22, 2009)
|
||
| 10.16 | ‡ |
Third Amendment to the Westinghouse Solar, Inc. 2006 Incentive Stock Plan (incorporated by reference to Exhibit 10.17 to our Annual Report on Form 10-K filed on March 16, 2009)
|
|
| 10.17 |
Stock Purchase Agreement by and among Westinghouse Solar, Inc. and the Purchaser (as defined therein), dated as of May 17, 2010 (incorporated herein by reference to Exhibit 10.1 to our Current Report on Form 8-K filed on May 17, 2010)
|
||
| 10.18 |
Stock Purchase Agreement by and among Westinghouse Solar, Inc. and the Purchaser (as defined therein), dated as of October 7, 2010 (incorporated herein by reference to Exhibit 10.1 to our Current Report on Form 8-K filed on October 7, 2010)
|
||
| 10.19 |
Master Assignment and Assumption Agreement by and among Westinghouse Solar, Inc., Real Goods Energy Tech, Inc. and SunRun Inc., dated as of October 12, 2010 (incorporated herein by reference to Exhibit 10.2 to our Current Report on Form 10-Q filed on November 10, 2010)
|
||
| 10.20 |
Supply and Warranty Agreement by and between Westinghouse Solar, Inc. and Real Goods Energy Tech, Inc., dated as of October 7, 2010 (incorporated herein by reference to Exhibit 10.3 to our Current Report on Form 10-Q filed on November 10, 2010)
|
||
| 10.21 | µ |
Supply agreement by and among Akeena Solar, Inc. and Enphase Energy, dated on January 31, 2009 (incorporated herein by reference to Exhibit 10.26 to our Annual Report on Form 10-K/A filed on June 14, 2011)
|
|
| 10.22 | µ |
License Agreement by and among Akeena Solar, Inc. and Westinghouse Electric Corporation, dated on January 1, 2010.
|
|
| 10.23 |
Business Financing Agreement by and among Westinghouse Solar, Inc. its subsidiaries and Bridge Bank, National Association, dated February 15, 2011. (incorporated herein by reference to Exhibit 10.3 to our Current Report on Form 10-K filed on March 2, 2011)
|
||
| 10.24 |
Securities Purchase Agreement by and among Westinghouse Solar, Inc. and the Purchaser (as defined therein), dated as of February 17, 2011 (incorporated herein by reference to Exhibit 10.1 to our Current Report on Form 8-K filed on February 17, 2011)
|
||
| 10.25 |
Form of Registration Rights Agreement by and among Westinghouse Solar, Inc. and the Purchases (as defined therein) (incorporated herein by reference to Exhibit 10.2 to our Current Report on Form 8-K filed on February 17, 2011)
|
||
| 10.26 |
Securities Purchase Agreement by and among Westinghouse Solar, Inc. and the Purchaser (as defined therein), dated as of August 16, 2011 (incorporated herein by reference to Exhibit 10.1 to our Current Report on Form 8-K filed on August 17, 2011)
|
||
| 10.27 |
Securities Purchase Agreement by and among Westinghouse Solar, Inc. and the Purchaser (as defined therein), dated as of September 28, 2011 (incorporated herein by reference to Exhibit 10.1 to our Current Report on Form 8-K filed on September 28, 2011)
|
||
| 10.28 |
Securities Purchase Agreement by and among Westinghouse Solar, Inc. and the CBD Energy Limited, dated as of
December 30, 2011 (incorporated by reference to Exhibit 10.1 to our Current Report on Form 8-K filed on January 12, 2012)
|
||
| 10.29 |
Employment Agreement between Westinghouse Solar, Inc. and Margaret Randazzo, dated May 7, 2012 (incorporated herein by reference to Exhibit 10.1 to our Current Report on Form 10-Q, filed on August 14, 2012)
|
||
| 10.30 |
Securities Purchase Agreement by and among Westinghouse Solar, Inc. and the Purchaser (as defined therein), dated as of August 14, 2012 (incorporated by reference to Exhibit 10.1 to our Current Report on Form 8-K filed on August 14, 2012)
|
||
| 10.31 |
Securities Purchase Agreement by and among Westinghouse Solar, Inc. and the Purchaser (as defined therein), dated as of October 18, 2012 (incorporated by reference to Exhibit 10.1 to our Current Report on Form 8-K filed on October 19, 2012)
|
| 21.1 | * |
List of Subsidiaries
|
|
| 23.1 | * |
Consent of Independent Registered Accounting Firm Burr Pilger Mayer, Inc.
|
|
| 31 | * |
Section 302 Certification of Principal Executive and Financial Officer
|
|
| 32 | * |
Section 906 Certification of Principal Executive and Financial Officer
|
|
|
101.INS
|
* |
XBRL Taxonomy Extension Instance Document †
|
|
|
101.SCH
|
* |
XBRL Taxonomy Extension Schema Linkbase Document †
|
|
|
101.CAL
|
* |
XBRL Taxonomy Extension Calculation Linkbase Document †
|
|
|
101.DEF
|
* |
XBRL Taxonomy Extension Definition Linkbase Document †
|
|
|
101.LAB
|
* |
XBRL Taxonomy Extension Labels Linkbase Document †
|
|
|
101.PRE
|
* |
XBRL Taxonomy Extension Presentation Linkbase Document †
|
|
|
*
|
Filed herewith
|
|
**
|
The certification attached as Exhibits 32 accompany this annual report on Form 10-K pursuant to 18 U.S.C. Section 1350, as adopted pursuant to Section 906 of the Sarbanes-Oxley Act of 2002, and shall not be deemed “filed” by the Registrant for purposes of Section 18 of the Securities Exchange Act of 1934, as amended.
|
|
µ
|
Confidential treatment has been requested with respect to certain confidential portions of this exhibit pursuant to Rule 24b-2 under the Securities Exchange Act of 1934, which confidential portions have been omitted from the exhibit and filed separately with the Securities and Exchange Commission.
|
|
‡
|
Management contract or compensatory plan or arrangement.
|
|
†
|
Pursuant to Rule 406T of Regulation S-T, the Interactive Data Files in Exhibit 101 hereto are deemed not filed or part of a registration statement or prospectus for purposes of Sections 11 or 12 of the Securities Act of 1933, as amended, are deemed not filed for purposes of Section 18 of the Securities Exchange Act of 1934, as amended, and otherwise are not subject to liability under those sections.
|
66