Attached files
| file | filename |
|---|---|
| EX-23.1 - EX-23.1 - SOLARCITY CORP | d508901dex231.htm |
| EX-3.2 - EX-3.2 - SOLARCITY CORP | d508901dex32.htm |
| EX-3.1 - EX-3.1 - SOLARCITY CORP | d508901dex31.htm |
| EX-31.2 - EX-31.2 - SOLARCITY CORP | d508901dex312.htm |
| EX-21.1 - EX-21.1 - SOLARCITY CORP | d508901dex211.htm |
| EX-32.1 - EX-32.1 - SOLARCITY CORP | d508901dex321.htm |
| EX-31.1 - EX-31.1 - SOLARCITY CORP | d508901dex311.htm |
| EX-32.2 - EX-32.2 - SOLARCITY CORP | d508901dex322.htm |
Table of Contents
UNITED STATES
SECURITIES AND EXCHANGE COMMISSION
Washington, D.C. 20549
FORM 10-K
(Mark One)
| x | ANNUAL REPORT PURSUANT TO SECTION 13 OR 15(d) OF THE SECURITIES EXCHANGE ACT OF 1934 |
For the fiscal year ended December 31, 2012
Or
| ¨ | TRANSITION REPORT PURSUANT TO SECTION 13 OR 15(d) OF THE SECURITIES EXCHANGE ACT OF 1934 |
For the transition period from to
Commission file number: 001-35758
SolarCity Corporation
(Exact name of registrant as specified in its charter)
| Delaware | 02-0781046 | |
| (State or other jurisdiction of incorporation or organization) |
(I.R.S. Employer Identification Number) |
3055 Clearview Way
San Mateo, California 94402
(Address of principal executive offices and zip code)
Registrant’s telephone number, including area code: (650) 638-1028
Securities registered pursuant to Section 12(b) of the Act:
| Title of each class |
Name of each exchange on which registered | |
| Common Stock, par value $0.0001 per share | The NASDAQ Stock Market LLC |
Securities registered pursuant to Section 12(g) of the Act:
None
Indicate by check mark if the registrant is a well-known seasoned issuer, as defined in Rule 405 of the Securities Act. Yes ¨ No x
Indicate by check mark if the registrant is not required to file reports pursuant to Section 13 or Section 15(d) of the Securities Exchange Act of 1934 (the “Exchange Act”). Yes ¨ No x
Indicate by check mark whether the registrant: (1) has filed all reports required to be filed by Section 13 or 15(d) of the Exchange Act during the preceding 12 months (or for such shorter period that the registrant was required to file such reports), and (2) has been subject to such filing requirements for the past 90 days. Yes x No ¨
Indicate by check mark whether the registrant has submitted electronically and posted on its corporate Web site, if any, every Interactive Data File required to be submitted and posted pursuant to Rule 405 of Regulation S-T (§232.405 of this chapter) during the preceding 12 months (or for such shorter period that the registrant was required to submit and post such files). Yes ¨ No ¨
Indicate by a check mark if disclosure of delinquent filers pursuant to Item 405 of Regulation S-K (§229.405 of this chapter) is not contained herein, and will not be contained, to the best of registrant’s knowledge, in definitive proxy or information statements incorporated by reference in Part III of this Form 10-K or any amendment to this Form 10-K. x
Indicate by check mark whether the registrant is a large accelerated filer, an accelerated filer, a non-accelerated filer, or a smaller reporting company. See the definitions of “large accelerated filer,” “accelerated filer” and “smaller reporting company” in Rule 12b-2 of the Exchange Act. (Check one):
| Large accelerated filer ¨ | Accelerated filer ¨ | |||
| Non-accelerated filer x (Do not check if a smaller reporting company) | Smaller reporting company ¨ | |||
Indicate by check mark whether the registrant is a shell company (as defined in Rule 12b-2 of the Exchange Act). Yes ¨ No x
The aggregate market value of voting stock held by non-affiliates of the registrant on December 13, 2012, based on the closing price of $11.79 for shares of the registrant’s common stock as reported by the NASDAQ Global Market, was approximately $176.3 million. The registrant has elected to use December 13, 2012 as the calculation date, which was the initial trading date of the registrant’s common stock on the NASDAQ Global Market, because on June 30, 2012 (the last business day of the registrant’s second fiscal quarter), the registrant was a privately-held company. Shares of common stock held by each executive officer, director, and holder of 5% or more of the outstanding common stock have been excluded in that such persons may be deemed to be affiliates. This determination of affiliate status is not necessarily a conclusive determination for other purposes.
On March 25, 2013, 75,239,827 shares of the registrant’s common stock, $0.0001 par value, were outstanding.
DOCUMENTS INCORPORATED BY REFERENCE
Portions of the information called for by Part III of this Form 10-K is hereby incorporated by reference from the definitive Proxy Statement for our annual meeting of stockholders, which will be filed with the Securities and Exchange Commission not later than 120 days after December 31, 2012.
Table of Contents
Table of Contents
SPECIAL NOTE REGARDING FORWARD-LOOKING STATEMENTS
The discussion in this annual report on Form 10-K contains forward-looking statements within the meaning of Section 27A of the Securities Act of 1933, as amended, or the Securities Act, and Section 21E of the Securities Exchange Act of 1934, as amended, or the Exchange Act. Forward-looking statements are any statements that look to future events and consist of, among other things, our business strategies; anticipated future financial results; expected trends in certain financial and operating metrics; our belief that tracking the aggregate megawatt, or MW, production capacity of the systems is an indicator of the growth rate of our solar energy systems business; projections on growth in the markets that we operate and our growth rates; the anticipated penetration of our SolarStrong project; pricing trends, including our ability to achieve economies of scale in both installation and capital costs; our belief that adequate surplus capacity of non-tariff solar panels is available to suit our future needs; projections relating to our use of and reliance on U.S. Treasury grants and federal, state and local incentives; the impact of the sequestration of federal spending that took effect in March 2013; expansion and hiring plans; product development efforts, including our belief that advances in battery storage technology, steep reductions in pricing and burgeoning policy changes that support energy storage hold significant promise for enabling deployments of grid-connected energy storage systems; customer preferences, including our belief that there is a strong overlap between customer demand for electric vehicles and solar energy; anticipated contract renewals; our marketing efforts; the payment of future dividends; and our belief as to the sufficiency of our existing cash and cash equivalents, funds available under secured credit facilities and funds available under existing financing funds to meet our working capital and operating resource requirements for the next 12 months.
In addition, forward-looking statements also consist of statements involving trend analyses and statements including such words as “may,” “believe,” “will,” “could,” “anticipate,” “would,” “might,” “potentially,” “estimate,” “continue,” “plan,” “expect,” “intend,” and similar expressions or the negative of these terms or other comparable terminology that convey uncertainty of future events or outcomes are intended to identify forward-looking statements. These forward-looking statements speak only as of the date of this annual report on Form 10-K and are subject to business and economic risks. As such, our actual results could differ materially from those set forth in the forward-looking statements as a result of a number of factors, including those set forth below in Part I, Item 1A, “Risk Factors,” and in our other reports filed with the U.S. Securities and Exchange Commission. Moreover, we operate in a very competitive and rapidly changing environment, and new risks emerge from time to time. It is not possible for our management to predict all risks, nor can we assess the impact of all factors on our business or the extent to which any factor, or combination of factors, may cause actual results to differ materially from those contained in any forward-looking statements we may make. In light of these risks, uncertainties, and assumptions, the forward-looking events and circumstances discussed in this report may not occur, and actual results could differ materially and adversely from those anticipated or implied in the forward-looking statements. We undertake no obligation to revise or publically release the results of any revision to these forward-looking statements, except as required by law. Given these risks and uncertainties, readers are cautioned not to place undue reliance on such forward-looking statements.
1
Table of Contents
PART I
Overview
We sell renewable energy to our customers at prices below utility rates. Our long-term agreements generate recurring customer payments and position us to provide our growing base of customers with other energy products and services that further lower their energy costs. We call this “Better Energy.”
The demand for Better Energy is allowing us to install more solar energy systems than any other company in the United States. We believe this significant demand for our energy solutions results from the following value propositions:
| • | We lower energy costs. Our customers buy renewable energy from us for less than they currently pay for electricity from utilities with little to no up-front cost. They are also able to lock in their energy costs for the long term and insulate themselves from rising energy costs. |
| • | We build long-term customer relationships. Most of our customers agree to a 20-year contract term, positioning us to provide them with additional energy-related solutions during this relationship to further lower their energy costs. At the end of the original contract term, we intend to offer our customers renewal contracts. |
| • | We make it easy. We perform the entire process, from permitting through installation, and make it simple for customers to switch to renewable energy. |
| • | We focus on quality. Our top priority is to provide value and quality service to our customers. We have assembled a highly skilled team of in-house professionals dedicated to the highest engineering standards, overall quality and customer service. |
We currently serve customers in 14 states, and we intend to expand our footprint internationally, operating in every market where distributed solar energy generation is a viable economic alternative to utility generation. We generate revenue from a mix of residential customers, commercial entities such as Walmart, eBay and Intel, and government entities such as the U.S. Military. Since our founding in 2006, we have provided or contracted to provide systems or services to more than 50,000 customers. Every five minutes of the working day a new customer makes the switch to Better Energy. In addition, aggregate contractual cash payments that our customers are obligated to pay over the term of our long-term customer agreements have grown at a compounded annual rate of 117% since 2009. We structure these customer agreements as either leases or power purchase agreements. Our lease customers pay a fixed monthly fee with an electricity production guarantee. Our power purchase agreement customers pay a rate based on the amount of electricity the solar energy system actually produces.
Our long-term lease and power purchase agreements create high-quality recurring customer payments, investment tax credits, accelerated tax depreciation and other incentives. Our financial strategy is to monetize these assets at the lowest cost of capital. We share the economic benefit of this lower cost of capital with our customers by lowering the price they pay for energy. Historically, we have monetized the assets created by substantially all of our leases and power purchase agreements via financing funds we have formed with fund investors. In general, we contribute the assets to the financing fund and receive upfront cash and retain a residual interest. The allocation among us and the fund investors of the economic benefits as well as the timing of receipt of such economic benefits varies depending on the structure of the financing fund. We use a portion of the cash received from the financing fund to cover our variable and fixed costs associated with installing the related solar energy systems. We invest the excess cash in the growth of our business. In the future, in addition to or in lieu of monetizing the value through financing funds, we may use debt, equity or other financing strategies to fund our operations.
2
Table of Contents
To date, we have raised $1.7 billion through 24 financing funds and related financing facilities established with banks and other large companies such as Credit Suisse, Google, PG&E Corporation and U.S. Bancorp, and we continue to create additional financing funds.
Most of our customer relationships begin when we enter into long-term energy contracts. These long-term energy contracts serve as a gateway for us to engage our residential customers in performing energy efficiency evaluations and energy efficiency upgrades. During an energy efficiency evaluation, our proprietary software enables us to capture, catalog and analyze all of the energy loads in a home to identify the most valuable and actionable solutions to lower energy costs. We then offer to perform the appropriate upgrades to improve the home’s energy efficiency. We also offer energy-related products such as electric vehicle charging stations and proprietary advanced monitoring software, and are expanding our product portfolio to include additional products such as on-site battery storage solutions. Approximately 48% of our new residential solar energy system customers in 2012 purchased additional energy products or services from us, and as our customers’ energy needs evolve over time, we believe we are well-positioned to be their provider of choice.
We are organized and operate in a single segment. See Note 2 to our consolidated financial statements included in Part II, Item 8 of this annual report on Form 10-K.
Our Approach
We have developed an integrated approach that allows our customers to lower their energy costs in a simple and efficient manner. We have disrupted the industry status quo by providing renewable energy directly to customers for less than they are currently paying for utility-generated energy. Unlike utilities, we sell energy with a predictable cost structure that does not rely on limited fossil fuels and is insulated from rising retail electricity prices. We also guarantee the electricity production of our solar energy systems to our customers. Our strategy is to focus on that portion of the solar energy value chain with the most potential: the energy consumer and the customer relationship. We believe we are the only distributed energy company that offers integrated sales, financing, engineering, installation, monitoring, maintenance and efficiency services without involving the services of multiple third-party participants.
The key elements of our integrated approach are illustrated below:
SolarCity’s Integrated Approach

| • | Sales. We market and sell our products and services through a national sales organization that includes a direct outside sales force, a call center, a channel partner network and a robust customer referral program. We have structured our sales organization to efficiently engage prospective customers, from initial interest through customized proposals and, ultimately, signed contracts. |
| • | Financing. Financing makes it possible to install our solar energy systems for little or no upfront cost. Through a streamlined process, we provide multiple pricing options to our customers to help make renewable, distributed energy accessible and affordable, either on a fixed monthly fee basis or a fee based on the amount of energy produced. |
3
Table of Contents
| • | Engineering. Our in-house engineering team custom designs a solar energy system for each of our customers. We have developed software that simplifies and expedites the design process and optimizes the design to maximize the energy production of each system. Our engineers complete a structural analysis of each building and produce a full set of structural design and electrical blueprints that contain the specifications for all system components. |
| • | Installation. Once we complete the design, we obtain all necessary building permits. Our customer care representatives coordinate the SolarCity team and keep our customers apprised of the project status every step of the way. We are a licensed contractor in every community we service, and we are responsible for every customer installation. For substantially all of our residential projects, we are the general contractor, construction manager and installer. For our commercial projects, we are the general contractor and construction manager. Once we complete installing the system, we schedule inspections with the local building department and arrange for interconnection to the power grid with the utility. By handling these logistics, we make the installation process simple for our customers. |
| • | Monitoring and Maintenance. Our proprietary monitoring software provides our customers with a real-time view of their energy generation and consumption. Through an easy-to-read graphical display available on smartphones and any device with a web browser, our monitoring systems collect, monitor and display critical performance data from our solar energy systems, including production levels, local weather, electricity usage and environmental impacts. These monitoring systems allow us to confirm the continuing proper operation of our solar energy systems, identify maintenance issues and provide our customers with a better understanding of their energy usage, allowing them the opportunity to modify their usage accordingly. |
| • | Complementary Products and Services. Through our comprehensive energy efficiency evaluations, we analyze our customers’ energy usage and identify opportunities for energy efficiency improvements. Using our proprietary software, our home energy evaluation consists of a detailed in-home diagnosis that identifies energy use and loss. After the evaluation is completed, we review the results with the customer and recommend current and future opportunities to improve energy efficiency and home comfort. We then offer to perform these upgrades. |
Competitive Strengths
We believe the following strengths enable us to deliver Better Energy to a diversified customer base that includes residential home owners, large and small businesses, and government entities:
| • | Lower cost energy. We sell energy to our customers at prices below utility rates. Our solar energy systems rely solely on the free energy produced by the sun, allowing our customers to generate their own energy and reduce the amount they purchase from utilities. We help put solar energy generation within the reach of our customers by providing a variety of pricing options that minimize or eliminate upfront costs. Our customers typically achieve a lower overall electricity bill immediately upon installation. As retail utility rates rise, our customers’ savings increase. |
| • | Easy to switch. We have developed an integrated approach that allows our customers to access distributed renewable energy generation simply and efficiently. By providing the sales, financing, engineering, installation, monitoring and maintenance ourselves, we are able to control and oversee the entire process while providing a superior experience to our customers. |
| • | Long-term customer relationships. Our business model enables us to develop long-term relationships with our customers. Under our standard customer agreements, our solar energy customers purchase energy from us for 20 years. This approach allows us to maintain an ongoing relationship with our solar energy customers through our receipt of payments and our real-time monitoring. We leverage these relationships to offer complementary energy efficiency services |
4
Table of Contents
| tailored to our customers’ needs, which we believe further reinforces our relationship, brand and value to the customer, and reduces our customer acquisition costs. Because our 20-year contracts with our customers exceed the average useful life of most major appliances (such as water heaters and furnaces), we believe we are well-positioned to assist them with future replacements and upgrades. In addition, because our solar energy systems have an estimated life of 30 years, we intend to offer our customers renewal contracts at the end of the original contract term. |
| • | Significant size and scale. Our size enables us to achieve economies of scale in both installation and capital costs, enabling us to offer our customers electricity at rates lower than the retail rate offered by the utility. We believe that our size provides our customers with confidence in our continuing ability to service their system and guarantee its performance over the duration of their long-term contract. |
| • | Innovative technology. We continually innovate and develop new technologies to facilitate our growth and to enhance the delivery of our products and services. For example, we have developed proprietary software that significantly reduces design time, speeds the permitting process and allows us to efficiently manage the installation of every project. |
| • | Brand recognition. Our ability to provide high-quality services, our dedication to best-in-class engineering efforts and our exceptional customer service have helped us establish a recognized and trusted national brand. For example, approximately 23% of our new residential projects in 2012 originated from existing customer referrals. We believe our brand is a meaningful factor for customers as they consider their energy alternatives. |
| • | Strong leadership team. We are led by a strong management team with demonstrated execution capabilities and an ability to adapt to rapidly changing market environments. Our senior leadership team, consisting of our co-founders, Lyndon R. Rive and Peter J. Rive, and our chairman, Elon Musk, are widely recognized entrepreneurs and thought leaders with track records of building successful businesses. Additionally, to support our integrated business model, we have developed in-house expertise through strong senior leadership on our engineering, structured finance, legal and government affairs teams. |
Our Innovative Products, Services and Technology
We deliver Better Energy to our customers through a portfolio of complementary products and services that enable more cost effective generation and reduced energy consumption. We have developed enabling technologies that allow us to simplify our customers’ experience and enhance our ability to deliver our products and services.
Solar Energy Product
| • | Solar Energy Systems. The major components of our solar energy systems include solar panels that convert sunlight into electrical current, inverters that convert the electrical output from the panels to a usable current compatible with the electric grid, racking that attaches the solar panels to the roof or ground and electrical hardware that connects the solar energy system to the electric grid and our monitoring device. We purchase our components from vendors, maintaining multiple sources for each major component to ensure competitive pricing and an adequate supply of materials. Though we typically install poly-crystalline silicon panels and string inverters, we have installed a wide variety of other technologies, including thin film panels and panel-level power optimizers. |
| • | SolarLease and Power Purchase Agreement Finance Products. Most of our solar energy customers choose to purchase energy from us pursuant to one of two payment structures: a SolarLease or a power purchase agreement. In both structures, we charge customers a monthly fee for the power |
5
Table of Contents
| produced by our solar energy systems. In the lease structure, this monthly payment is pre-determined and includes a production guarantee. In the power purchase agreement structure, we charge customers a fee per kilowatt hour, or kWh, based on the amount of electricity actually produced by the solar energy system. Under both the SolarLease and power purchase agreement, our customers also have the option to pay little or no upfront costs or to reduce the aggregate amount of their future payments by pre-paying a portion of their future payments. Over the term of the agreement, we own and operate the system and guarantee its performance. Our current standard SolarLeases and power purchase agreements have 20-year terms. Prior to 2010, our standard lease term was 15 years. In a limited number of utility districts, we continue to offer lease terms of less than 20 years to comply with applicable incentive programs. In addition, a limited number of our commercial customers have entered into power purchase agreements with terms of between 10 and 20 years. |
Energy Efficiency Products and Services
Our energy efficiency products and services enable our customers to save money on their energy bills by reducing their energy consumption. To date, we have completed over 16,000 home energy evaluations and performed more than 2,500 energy efficiency upgrades.
| • | Home Energy Evaluation. Our home energy evaluation is the threshold to the broad set of energy efficiency products and services we offer. We sell home energy efficiency evaluations to new solar energy system customers, existing customers, prospective solar energy system customers who are unable to adopt solar energy because of site conditions or credit, and to customers who want to start with energy efficiency improvements. Using our proprietary software, our home energy evaluation consists of a detailed in-home diagnosis that identifies energy use and loss. During the evaluation, we record details of the home’s construction and energy use, measurements of every major building surface, model numbers of appliances and other energy consuming equipment, and measure combustion efficiency and air leakage in the ducts and building envelope. We create a database of this information and review a report of the results with the customer outlining current and future opportunities to improve energy efficiency and home comfort. We then offer to perform these upgrades. |
| • | Energy Efficiency Upgrades. Based on the detailed analysis from the home energy evaluation, we work with customers to identify their priorities to improve the cost effectiveness, efficiency, health and comfort of their home by implementing appropriate upgrades. We generally handle every aspect of an energy efficiency improvement project for our customers including sales, engineering, permitting, procurement, installation, inspections and any supporting rebate or utility documentation. Our core energy efficiency upgrade products and services address heating and cooling, air sealing, duct sealing, water heating, insulation, high efficiency furnaces, weatherization, pool pumps and lighting. |
Other Energy Products and Services
| • | Electric Vehicle Charging. We believe there is a strong overlap between customer demand for electric vehicles, or EVs, and solar energy. As consumers switch to EVs, their electricity bills increase substantially, driving demand for lower cost electricity. We install EV charging equipment that we source from third parties. We market EV equipment to residential and commercial customers through retail partnerships with companies such as The Home Depot, and through EV manufacturers and dealerships, such as our preferred partnership with Tesla Motors, Inc. To date, we have sold over 1,950 charging stations. |
| • | Energy Storage. We are developing a proprietary battery management system built on our solar energy monitoring communications backbone. The battery management system is designed to enable remote, fully bidirectional control of distributed energy storage that can potentially provide |
6
Table of Contents
| significant benefits to our customers, utilities and grid operators. The benefits of energy storage coupled with a solar energy system to our customers may include back-up power, time-of-use energy arbitrage, rate arbitrage, peak demand shaving and demand response. We believe that advances in battery storage technology, steep reductions in pricing and burgeoning policy changes that support energy storage hold significant promise for enabling deployments of grid-connected energy storage systems. We currently have over 395 energy storage pilot projects under contract. |
Enabling Technologies
| • | SolarBid Sales Management Platform. SolarBid is our proprietary sales management platform that incorporates a database of rate information by utility, sun exposure, roof orientation and a variety of other factors to enable a detailed analysis and customized graphical presentation of each customer’s savings. SolarBid simplifies the sales process and automates pricing, system configuration and proposal generation. It also automatically prepares the customer agreements, incentive forms and utility paperwork required to complete a project. SolarBid is designed for maximum flexibility, allowing us to quickly add new products, services and geographies. |
| • | SolarWorks Customer Management Software. SolarWorks is the proprietary software platform we use to track and manage every project. SolarWorks’ embedded database and custom architecture enables reduced costs, improved quality and improved customer experience by supporting scheduling, budgeting and other project management functions as well as customer communications, inventory management and detailed project data. |
| • | Energy Designer. Energy Designer is a proprietary software application our field engineering auditors use to rapidly collect all pertinent site-specific design details on a tablet computer. This information then syncs with our design automation software, reducing design time and accelerating the permitting process. |
| • | Home Performance Pro. Home Performance Pro is our proprietary energy efficiency evaluation platform that incorporates the U.S. Department of Energy’s Energy Plus simulation engine. Home Performance Pro collects and stores details of a building’s construction and energy use and accurately simulates the reduction in energy use from energy efficiency upgrades. We use Home Performance Pro to identify opportunities to improve our customers’ energy efficiency. |
| • | SolarGuard and PowerGuide Proactive Monitoring Solutions. SolarGuard and PowerGuide provide our customers a real-time view of their home’s or business’s energy generation and consumption. Through easy-to-read graphical displays available on smartphones and any device with a web browser, our monitoring systems collect, monitor and display critical performance data from our solar energy systems, including production levels, local weather, electricity usage and environmental impacts such as carbon offset and pollution reduction. Our customer service team reviews system performance data using this proprietary monitoring software to confirm continuing efficient operation. |
Our Customers
Our customers buy electricity and other energy services from us that lower their overall energy costs. Because our customers are individuals or commercial businesses with high credit scores and government agencies, and because electricity is a necessity, we perceive our recurring customer payments as high-quality assets. Our customer base is comprised of the following key sectors:
| • | Residential. Our residential customers are individual homeowners and homeowners within communities who have participated in our community solar program that want to switch to cleaner, cheaper energy or reduce their home energy consumption through energy efficiency upgrades. Our |
7
Table of Contents
| community solar programs enable communities to collectively adopt clean energy in partnership with their local government or community organization without requiring any local government funds. We have helped more than 50 communities build more than 1,500 projects. |
| • | Commercial. Our commercial customers represent several business sectors, including technology, retail, manufacturing, agriculture, nonprofit and houses of worship. Our commercial customers include the world’s largest retailer, the world’s premier semiconductor chip maker and hundreds of other businesses. |
| • | Government. We have installed solar energy systems for several government entities including the U.S. Air Force, Army, Marines and Navy, and the Department of Homeland Security. In November 2011, SolarCity and Bank of America Merrill Lynch announced project SolarStrong, our five-year plan to build more than $1 billion in solar energy projects for privatized U.S. military housing communities across the country. We expect SolarStrong to ultimately create up to 300 MW of solar generation capacity that could provide energy to as many as 120,000 military housing units. If completed as anticipated, SolarStrong would be the largest residential solar project in American history. |
We generally group our commercial and governmental customers together for our internal customer management purposes. Based on cumulative megawatts deployed, our business is split approximately equally between our residential and commercial customers.
Our commercial and government customers include:
Why Customers Choose SolarCity
The following examples illustrate the experiences of residential, commercial and government customers and the reasons they select us to provide solar energy systems and related energy products and services.
Residential
| • | California Family. A California family contacted us to perform an evaluation of their home’s energy usage and costs. We recommended a combination of a solar energy system and energy efficiency products and services to reduce energy costs and consumption and to create a more comfortable home. The family decided to sign a 20-year lease with us for a solar energy system that saves them an average of more than $50 each month. Our energy efficiency evaluators also assessed that the home was losing 60% of its heating through leaks in ductwork and was using an inefficient air cooling system. We replaced the ductwork to reduce leakage and heating costs in the winter and installed a more efficient cooling system to reduce energy costs and increase comfort in the summer. The family now enjoys a more comfortable home and can expect to save thousands of dollars in future energy costs. |
| • | Maryland Homeowner. A Maryland homeowner sought a solar energy solution to reduce high summertime electricity bills and ultimately decided to lease a solar energy system from us. Over the |
8
Table of Contents
| 20-year term of the contract, he will pay us $29,746 and is projected to create a net savings of $8,305 compared to his projected utility bills. The solar energy system is expected to offset 240,024 pounds of greenhouse gas emissions over the contract term, the equivalent of planting approximately 130 trees. The solar energy system components, including panels, inverters and labor, cost approximately $18,276. |
Commercial
| • | Walmart Stores, Inc. Walmart, the world’s largest retail business, is pursuing an array of sustainability goals, including a long-term goal to be supplied by 100% renewable energy. Walmart’s goal is to purchase renewable solar energy at prices equal to or less than utility energy rates while also providing price certainty for a percentage of these stores’ electricity requirements against the volatility of fossil-based energy prices. Walmart has contracted with us to purchase solar-generated electricity from 180 systems throughout Arizona, California, Colorado, Maryland, New York, Ohio and Oregon, and thus far 147 systems have been installed and interconnected at 141 sites across these seven states. We started our first Walmart project in July 2010, and completed 57 projects by the end of 2011. Our solar energy systems typically offset between 10% and 30% of each Walmart location’s total electricity usage. |
| • | Granite Regional Park. Granite Regional Park is a private-public partnership between Regional Park Limited Partnership and the City of Sacramento. Regional Park developed the Granite Regional Park with the goal of advancing the City of Sacramento’s sustainability goals and providing additional public greenspace. The park is located on an old mining site and includes office buildings and recreation area. Regional Park will pay $2.6 million over 20 years for the solar electricity generated by the 901 kilowatt, or kW, solar energy system and is projected to create a net savings of $0.4 million compared to the park’s projected utility bills over this period. The installation is expected to offset more than 27 million pounds of greenhouse gas emissions over the contract period, the equivalent of taking approximately 2,500 cars off the road for a year, or planting approximately 15,000 trees. |
Government
| • | Soaring Heights Communities, Davis-Monthan Air Force Base. In mid-2009, we entered into a transaction with Soaring Heights Communities LLC, an affiliate of Lend Lease (US) Public Partnerships LLC, a leading developer of privatized military housing, to build what we believe to be the largest solar-powered community in the United States: Soaring Heights Communities at Davis-Monthan Air Force Base in Tucson, Arizona. The project includes approximately 6 MW of generation capacity, including approximately 3.28 MW of ground-mounted solar panel arrays and an additional 2.76 MW of roof-mounted systems, spread among 400 residential buildings. When construction began, the project was estimated to represent an increase of more than 15% over the state of Arizona’s grid-tied solar capacity. The solar electricity generated by the systems offsets the majority of the electricity used by the housing community’s over 900 single and multi-family residences. |
| • | Chico Unified School District. Chico Unified School District decided to explore solar power as a way to help meet the school district’s electricity needs, reduce its dependency on polluting power sources and reduce energy expenses. After a careful selection process, we were awarded the contract to build 1.6 MW of solar energy systems across five district sites. As a power purchase agreement customer, the school district avoided the upfront cost of installing solar and simply buys the power produced from our systems at a set rate. The school district’s solar electricity production is expected to offset 85% of the five sites’ collective, total electricity needs. The school district will pay $10.9 million for the solar electricity over a 20-year period, and the solar power is projected to create a net savings of $2.4 million compared to the school district’s projected utility bills over this period. The school district’s solar installations are expected to offset more than 57 million pounds of greenhouse gas emissions over the contract term, the equivalent of taking approximately 5,000 cars off the road for a year, or planting approximately 30,000 trees. |
9
Table of Contents
Sales and Marketing
We market and sell our products and services through a national sales organization that includes a direct outside sales force, a call center, a channel partner network and a robust customer referral program.
| • | Direct outside sales force. Our outside sales force typically resides and works within a market we serve. Our outside sales force allows us to sell to those customers who prefer a face-to-face interaction. |
| • | Call center. Our call center allows us to sell our energy products and services to customers without visiting their homes or businesses. Because every home or site is unique, we begin by talking with each prospective customer about their energy needs and savings goals. Then, using online satellite technology, our salesperson evaluates the suitability of the site for our products and services. If either a solar energy system or an energy efficiency evaluation is an appropriate solution, our salesperson briefs the customer on our full scope of products and services, collects preliminary utility usage data and site information, and ultimately, provides a preliminary estimate of costs, including rebate applicability. If the customer desires to work with us, contracts can then be executed with e-signatures. |
| • | Channel Partner Network |
| • | SolarCity Network. The SolarCity Network is a by-invitation business development program that pays referral fees to local professionals and businesses that refer customers to us. Typical network members include realtors, architects, contractors and insurance/financial services providers. |
| • | The Home Depot. Our products and services are available through The Home Depot stores located in Arizona, California, Colorado, Connecticut, Delaware, Maryland, Massachusetts, New Jersey, New York, Oregon and the District of Columbia. We are the exclusive solar provider in the stores we serve. We sell through point-of-purchase displays in the stores, through a team of field energy advisors that canvass the stores and speak to prospective customers, and through other direct marketing strategies including in-store flyers, seminars, promotions, search engine marketing campaigns, email campaigns, retail signage and displays, and a co-branded website. |
| • | Homebuilder partners. Our products and services are available through several new home builders, including Shea Homes. These partners market solar energy systems through a variety of strategies, including advertising within their model homes, signage within their communities, realtor emails, newspaper inserts, online banners and co-branded flyers. Certain of these partners pre-pay for the electricity that will be produced by the solar energy system installed on the new home they sell, using the benefit of free solar energy as a selling point. |
| • | Other channel partners. Our products and services also are available through Paramount Energy Solutions, LLC, dba Paramount Solar. Paramount Solar engages residential photovoltaic solar system customers through its own sales and marketing strategies. |
| • | Customer Referral Program. We believe that customer referrals are the most effective way to market our products and services. Approximately 23% of our new residential projects in 2012 originated from existing customer referrals. We offer cash awards to incentivize our current customers to refer their friends, family and colleagues to install solar energy systems or enroll in an energy efficiency evaluation performed. We also encourage our customers to host solar energy parties with their friends, family and colleagues, where one of our in-house solar consultants make an informal presentation. |
10
Table of Contents
We also market our products and services through a variety of direct marketing strategies designed to reach qualified homeowners and businesses, including radio ads and public radio sponsorships, newspaper and magazine ads, online banner ads, search engine marketing, direct mail, participation in trade shows, events and home shows, email marketing, public relations, social media, sweepstakes and promotions, newsletters, community programs and field marketing techniques such as door-to-door canvassing. Our in-house marketing team manages and coordinates our media buying and customizes our content for each region.
Operations and Suppliers
We purchase major components such as solar panels and inverters directly from multiple manufacturers. We screen these suppliers and components based on expected cost, reliability, warranty coverage, ease of installation and other ancillary costs. As of December 31, 2012, our primary solar panel suppliers were BenQ Corporation, Suniva Inc., Trina Solar Limited and Yingli Green Energy Holding Company Limited, among others, and our primary inverter suppliers were Power-One, Inc., SMA Solar Technology, AG, Schneider Electric SA, Fronius International GmbH and SolarEdge Technologies, among others. We typically enter into master contractual arrangements with our major suppliers that define the general terms and conditions of our purchases, including warranties, product specifications, indemnities, delivery and other customary terms. We typically purchase solar panels and inverters on an as-needed basis from our suppliers at then-prevailing prices pursuant to purchase orders issued under our master contractual arrangements. We generally do not have any supplier arrangements that contain long-term pricing or volume commitments, although at times in the past we have made limited purchase commitments to ensure sufficient supply of components.
The U.S. government has imposed tariffs on solar cells manufactured in China. Based on determinations by the U.S. government, the applicable anti-dumping tariff rates range from approximately 8%-239%. To the extent that U.S. market participants experience harm from Chinese pricing practices, an additional tariff of approximately 15%-16% will be applied. Because we currently purchase solar panels containing cells manufactured outside of China, we currently are not adversely impacted by the tariffs.
Our racking systems are manufactured by contract manufacturers in the United States using our design.
We generally source the hundreds of other products related to our solar energy systems and energy efficiency upgrades services, such as HVAC and water heating equipment, fasteners and electrical fittings, through a variety of distributors. In addition, we source our EV charging stations from Tesla Motors and others.
We currently operate in 14 states. We manage inventory through one of our six centralized storage and distribution facilities, and we distribute inventory to local warehouses weekly as needed. We maintain a fleet of over 700 trucks and other vehicles to support our installers and operations. This operational scale is fundamental to our business, as our field teams currently complete more than 1,000 residential installations solar energy system each month, while our project management teams simultaneously manage thousands of projects as they move through the stages of engineering, permitting, installation and monitoring.
We offer a range of warranties and performance guarantees for our solar energy systems. We generally provide warranties of between 10 to 20 years on the generating and nongenerating parts of the solar energy systems we sell, together with a pass-through of the inverter and module manufacturers’ warranties that generally range from 5 to 25 years. Where we sell the electricity generated by a solar energy system, we compensate customers if their system produces less energy than our guarantee in any given year by refunding overpayments. We also provide ongoing service and repair during the entire term of the customer relationship. Costs associated with such ongoing service and repair have not been material.
Securing Our Solar Energy Systems
Unless a customer fully prepays for its solar energy system, we file a uniform commercial code financing statement, or UCC-1, on the systems in the real property records where each system is located prior to
11
Table of Contents
or when the system is installed. We file the UCC-1 to put on notice anyone who might perform a title search on the address where the system is located that our property, the solar energy system, is installed on the building. This filing protects our rights as the system’s owner against any mortgage on the real property. If the lender that holds the mortgage on the real property forecloses on our customer’s home, the UCC-1 filing protects our interest in the solar energy system and prohibits the lender from taking ownership of our solar energy system. A UCC-1 fixture filing is not a lien against a customer’s home and does not entitle us to the proceeds of the sale of a home in foreclosure. Typically, when a foreclosed home is sold by the lender, we negotiate with the prospective buyer to assume the existing lease or power purchase agreement. We believe the prospective buyer is motivated to assume the existing agreement by the opportunity to purchase energy from us at a lower price than that available from the electric utility. To date, we have only had to repossess five systems. In every other case, we have successfully negotiated with the new buyer to assume the existing lease or power purchase agreement.
Competition
We believe that our primary competitors are the traditional utilities that supply energy to our potential customers. We compete with these traditional utilities primarily based on price, predictability of price, and the ease by which customers can switch to electricity generated by our solar energy systems. We believe that we compete favorably with traditional utilities based on these factors in the regions we service.
We also compete with companies that provide products and services in distinct segments of the downstream solar energy and energy efficiency value chain. For example, many solar companies only install solar energy systems, while others only provide financing for these installations. These distributed energy competitors typically work in contractual arrangements with third parties, leaving the customer in the position of having to deal with different companies for different aspects of their solar energy project. In the residential solar energy system installation market, our competitors include American Solar Electric, Inc., Astrum Solar, Inc., Petersen Dean, Inc., Real Goods Solar, Inc., REC Solar, Inc., Sungevity, Inc., Trinity Solar, Inc., Verengo, Inc. and many smaller local solar companies. In the commercial solar energy system installation market, our competitors include Chevron Corporation, SunPower Corporation and Team Solar, Inc. In the solar project financing market, our competitors include SunRun Inc. In the energy efficiency products and services market, our competitors include Ameresco, Inc.
We believe that we compete favorably with these companies because we take an integrated approach to Better Energy, including offering solar energy systems, energy efficiency offerings, electric vehicle charging stations and additional energy-related products and services, as well as in-house sales, financing, engineering, installation, monitoring, and operations and maintenance. Our competitors offer only a subset of the products and services we provide. Aside from simple cost efficiency, we offer distinct practical benefits as an all-in-one provider. We provide a single point of contact and accountability for our products and services during the relationship with our customers.
Intellectual Property
Our intellectual property is an essential element of our business, and our success depends, at least in part, on our ability to protect our core technology and intellectual property. To accomplish this, we rely on a combination of patent, trade secret, trademark, copyright and other intellectual property laws, confidentiality agreements and license agreements to establish and protect our intellectual property rights.
As of December 31, 2012, we had 6 patents issued and 17 pending applications with the U.S. Patent and Trademark Office. These patents and applications relate to our installation and mounting hardware, our finance products, our monitoring solutions and our software platforms. Our issued patents start expiring in 2028. We intend to continue to file additional patent applications. “SolarCity,” “SolarGuard,” “SolarLease” and “PowerGuide” are our registered trademarks in the United States and, in some cases, in certain other countries. Our other unregistered trademarks and service marks in the United States include: “Better Energy,” “SolarBid,” “SolarStrong” and “SolarWorks.”
12
Table of Contents
All of our employees and independent contractors are required to sign agreements acknowledging that all inventions, trade secrets, works of authorship, developments and other processes generated by them on our behalf are our property and assigning to us any ownership that they may claim in those works.
Government Regulation
We are not a “regulated utility” in the United States under applicable national, state or other local regulatory regimes where we conduct business. For our limited operations in Ontario, Canada, our subsidiary is subject to the regulations of the relevant energy regulatory agencies applicable to all producers of electricity under the relevant feed-in tariff, or FIT, regulations, including the FIT rates.
To operate our systems we obtain interconnection agreements from the applicable local primary electricity utility. Depending on the size of the solar energy system and local law requirements, interconnection agreements are between the local utility and either us or our customer. In almost all cases, interconnection agreements are standard form agreements that have been pre-approved by the local public utility commission or other regulatory body with jurisdiction over interconnection agreements. As such, no additional regulatory approvals are required once interconnection agreements are signed. We maintain a utility administration function, with primary responsibility for engaging with utilities and ensuring our compliance with interconnection rules.
Our operations are subject to stringent and complex federal, state and local laws and regulations governing the occupational health and safety of our employees and wage regulations. For example, we are subject to the requirements of the federal Occupational Safety and Health Act, as amended, or OSHA, and comparable state laws that protect and regulate employee health and safety. We have a robust safety department led by a safety professional, and we expend significant resources to comply with OSHA requirements and industry best practices.
Federal and/or state prevailing wage requirements, which generally apply to any “public works” construction project that receives public funds, may apply to installations of our solar energy systems on government facilities. The prevailing wage is the basic hourly rate paid on public works projects to a majority of workers engaged in a particular craft, classification or type of work within a particular area. Prevailing wage requirements are established and enforced by regulatory agencies. Our in-house prevailing wage expert monitors and coordinates our continuing compliance with these regulations.
Government Incentives
U.S. federal, state and local governments have established various incentives and financial mechanisms to reduce the cost of solar energy and to accelerate the adoption of solar energy. These incentives include tax credits, cash grants, tax abatements, rebates, and net energy metering, or net metering, programs. These incentives help catalyze private sector investments in solar energy and efficiency measures, including the installation and operation of residential and commercial solar energy systems.
The federal government provides an uncapped investment tax credit, or Federal ITC, that allows a taxpayer to claim a credit of 30% of qualified expenditures for a residential or commercial solar energy system that is placed in service on or before December 31, 2016. This credit is scheduled to reduce to 10% effective January 1, 2017. Solar energy systems that began construction prior to the end of 2011 are eligible to receive a 30% federal cash grant paid by the U.S. Treasury Department under section 1603 of the American Recovery and Reinvestment Act of 2009, or the U.S. Treasury grant, in lieu of the Federal ITC. The federal government also provides accelerated depreciation for eligible solar energy systems.
We have received U.S. Treasury grants with respect to the vast majority of the solar energy systems that we have installed, and we expect to receive U.S. Treasury grants with respect to many more solar energy systems that we will install in the near future. We have relied on, and will continue to rely in the near future on, U.S. Treasury grants to lower our cost of capital and to incent fund investors to invest in our funds. Also, the U.S. Treasury grants have enabled us to lower the price we charge customers for our solar energy systems.
13
Table of Contents
Approximately half of the states offer a personal and/or corporate investment or production tax credit for solar, that is additive to the Federal ITC. Further, more than half of the states, and many local jurisdictions, have established property tax incentives for renewable energy systems, that include exemptions, exclusions, abatements and credits.
Many state governments, utilities, municipal utilities and co-operative utilities offer a rebate or other cash incentive for the installation and operation of a solar energy system or energy efficiency measures. Capital costs or “up-front” rebates provide funds to solar customers based on the cost, size or expected production of a customer’s solar energy system. Performance-based incentives provide cash payments to a system owner based on the energy generated by their solar energy system during a pre-determined period, and they are paid over that time period. Some states also have established FIT programs that are a type of performance-based incentive where the system owner-producer is paid a set rate for the electricity their system generates over a set period of time.
Forty-three states and Washington, D.C. have a regulatory policy known as net metering. Each of the states where we currently serve customers has adopted a net metering policy except for Texas, where certain individual utilities have adopted net metering or a policy similar to net metering. Net metering typically allows our customers to interconnect their on-site solar energy systems to the utility grid and offset their utility electricity purchases by receiving a bill credit at the utility’s retail rate for energy generated by their solar energy system that is exported to the grid and not consumed on-site. At the end of the billing period, the customer simply pays for the net energy used or receives a credit at the retail rate if more energy is produced than consumed. Some states require utilities to provide net metering to their customers until the total generating capacity of net metered systems exceeds a set percentage of the utilities’ aggregate customer peak demand.
Many states also have adopted procurement requirements for renewable energy production. Twenty-nine states and Washington, D.C. have adopted a renewable portfolio standard policy that requires regulated utilities to procure a specified percentage of total electricity delivered to customers in the state from eligible renewable energy sources, such as solar energy systems, by a specified date. To prove compliance with such mandates, utilities typically must surrender renewable energy certificates, or RECs. System owners often are able to sell RECs to utilities directly or in REC markets.
Employees and Our Company Values
We take great pride in being a company built on values. Our values are an integral part of who we are and how we conduct business, and they provide the framework for delivering exceptional service to our customers. These values are:
| • | We are teammates. |
| • | We are innovators who welcome change. |
| • | We provide quality workmanship. |
| • | We act with integrity and honesty. |
| • | We strive to lower costs. |
| • | We are anchored in safety. |
| • | We strive to exceed customer expectations. |
| • | We change the world for the better. |
14
Table of Contents
We strive to attract, hire and retain the best employees and have designed programs to reward and incent our employees, including competitive salaries, equity ownership and substantial opportunities for career advancement.
As of December 31, 2012, we had 2,510 full-time employees, consisting of 661 in sales and marketing, 193 in engineering, 1,235 in installation, 248 in customer care and project controls and 173 others. Of our employees, 1,530 are located in California, including 616 located in our headquarters in San Mateo, California. Our remaining employees are located in offices or warehouses in nine other states and Washington, D.C.
Competition for qualified personnel in our industry is increasing, particularly for installers and other personnel involved in the installation of solar energy systems and the delivery of energy products and services. Because we are headquartered in the San Francisco Bay Area, we compete for a limited pool of technical and engineering resources, and this requires us to pay wages that are competitive with relatively high San Francisco Bay Area standards for employees employed in these fields. Further, as the industry continues to expand, we are increasingly subject to competition to hire the best salespeople and others who are keys to our growing business. We employ a team of full-time recruiters who are dedicated to identifying and qualifying prospective employees to support our growth.
Our employees are not currently represented by any labor union or subject to any collective bargaining agreement. We have not experienced any work stoppages, and we consider our relationship with our employees to be good.
Corporate Information
We were incorporated in June 2006 as a Delaware corporation. Our headquarters are located at 3055 Clearview Way, San Mateo, California 94402, and our telephone number is (650) 638-1028. You can access our website at www.solarcity.com. Information contained on our website is not a part of, and is not incorporated into, this annual report on Form 10-K, and the inclusion of our website address in this annual report on Form 10-K is an inactive textual reference only. Our annual report on Form 10-K, quarterly reports on Form 10-Q, current reports on Form 8-K and amendments to reports filed or furnished pursuant to Sections 13(a) and 15(d) of the Exchange Act are available free of charge on the Investors portion of our web site as soon as reasonably practicable after we electronically file such material with, or furnish it to, the SEC.
You should carefully consider the risks described below together with the other information set forth in this annual report on Form 10-K, which could materially affect our business, financial condition and future results. The risks described below are not the only risks facing our company. Risks and uncertainties not currently known to us or that we currently deem to be immaterial also may materially adversely affect our business, financial condition and operating results.
Risks Related to our Business
Existing electric utility industry regulations, and changes to regulations, may present technical, regulatory and economic barriers to the purchase and use of solar energy systems that may significantly reduce demand for our solar energy systems.
Federal, state and local government regulations and policies concerning the electric utility industry, and internal policies and regulations promulgated by electric utilities, heavily influence the market for electricity generation products and services. These regulations and policies often relate to electricity pricing and the interconnection of customer-owned electricity generation. In the United States, governments and utilities continuously modify these regulations and policies. These regulations and policies could deter customers from purchasing renewable energy, including solar energy systems. This could result in a significant reduction in the
15
Table of Contents
potential demand for our solar energy systems. For example, utilities commonly charge fees to larger, industrial customers for disconnecting from the electric grid or for having the capacity to use power from the electric grid for back-up purposes. These fees could increase our customers’ cost to use our systems and make them less desirable, thereby harming our business, prospects, financial condition and results of operations. In addition, depending on the region, electricity generated by solar energy systems competes most effectively with expensive peak-hour electricity from the electric grid, rather than the less expensive average price of electricity. Modifications to the utilities’ peak hour pricing policies or rate design, such as to a flat rate, would require us to lower the price of our solar energy systems to compete with the price of electricity from the electric grid.
In addition, any changes to government or internal utility regulations and policies that favor electric utilities could reduce our competitiveness and cause a significant reduction in demand for our products and services. For example, certain jurisdictions have proposed assessing fees on customers purchasing energy from solar energy systems or imposing a new charge that would disproportionately impact solar energy system customers who utilize net metering, either of which would increase the cost of energy to those customers and could reduce demand for our solar energy systems. Any similar government or utility policies adopted in the future could reduce demand for our products and services and adversely impact our growth.
We rely on net metering and related policies to offer competitive pricing to our customers in some of our key markets.
Forty-three states and Washington, D.C. have a regulatory policy known as net energy metering, or net metering. Each of the states where we currently serve customers has adopted a net metering policy except for Texas, where certain individual utilities have adopted net metering or a policy similar to net metering. Net metering typically allows our customers to interconnect their on-site solar energy systems to the utility grid and offset their utility electricity purchases by receiving a bill credit at the utility’s retail rate for energy generated by their solar energy system that is exported to the grid and not consumed on-site. At the end of the billing period, the customer simply pays for the net energy used or receives a credit at the retail rate if more energy is produced than consumed. Utilities operating in states without a net metering policy may receive solar electricity that is exported to the grid at times when there is no simultaneous energy demand by the customer to utilize the generation onsite without providing any compensation to the customer for this generation. Our ability to sell solar energy systems or the electricity they generate may be adversely impacted by the failure to expand existing limits on the amount of net metering in states that have implemented it, the failure to adopt a net metering policy where it currently is not in place or the imposition of new charges that only or disproportionately impact customers that utilize net metering. Our ability to sell solar energy systems or the electricity they generate also may be adversely impacted by the unavailability of expedited or simplified interconnection for grid-tied solar energy systems or any limitation on the number of customer interconnections or amount of solar energy that utilities are required to allow in their service territory or some part of the grid.
Limits on net metering, interconnection of solar energy systems and other operational policies in key markets could limit the number of solar energy systems installed there. For example, California utilities are currently required to provide net metering to their customers until the total generating capacity of net metered systems exceeds 5% of the utilities’ “aggregate customer peak demand.” This cap on net metering in California was increased to 5% in 2010 as utilities neared the prior cap of 2.5%. If the current net metering caps in California, or other jurisdictions, are reached, future customers will be unable to recognize the cost savings associated with net metering. We substantially rely on net metering when we establish competitive pricing for our prospective customers. The absence of net metering for new customers would greatly limit demand for our solar energy systems.
Our business currently depends on the availability of rebates, tax credits and other financial incentives. The expiration, elimination or reduction of these rebates, credits and incentives would adversely impact our business.
U.S. federal, state and local government bodies provide incentives to end users, distributors, system integrators and manufacturers of solar energy systems to promote solar electricity in the form of rebates, tax credits and other financial incentives such as system performance payments and payments for renewable energy
16
Table of Contents
credits associated with renewable energy generation. We rely on these governmental rebates, tax credits and other financial incentives to lower our cost of capital and to incent fund investors to invest in our funds. These incentives enable us to lower the price we charge customers for energy and for our solar energy systems. However, these incentives may expire on a particular date, end when the allocated funding is exhausted, or be reduced or terminated as solar energy adoption rates increase. These reductions or terminations often occur without warning.
The federal government currently offers a 30% investment tax credit under Section 48(a)(3) of the Internal Revenue Code, or the Federal ITC, for the installation of certain solar power facilities until December 31, 2016. This credit is due to adjust to 10% in 2017. Solar energy systems that began construction prior to the end of 2011 were eligible to receive a 30% federal cash grant paid by the U.S. Treasury Department under section 1603 of the “American Recovery and Reinvestment Act of 2009,” or the U.S. Treasury grant, in lieu of the Federal ITC. Pursuant to the Budget Control Act of 2011, U.S. Treasury grants are subject to sequestration beginning in 2013. Specifically, U.S. Treasury grants made on or after March 1, 2013 through September 30, 2013 will be reduced by 8.7%, regardless of when the Treasury received the application. As a result, we expect to suffer grant shortfalls of approximately $2.4 million associated with our financing funds. The sequestration reduction rate is subject to change at the federal government’s fiscal year end of September 30, 2013. In addition, applicable authorities may adjust or decrease incentives from time to time or include provisions for minimum domestic content requirements or other requirements to qualify for these incentives.
Reductions in, or eliminations or expirations of, governmental incentives could adversely impact our results of operations and ability to compete in our industry by increasing our cost of capital, causing us to increase the prices of our energy and solar energy systems, and reducing the size of our addressable market. In addition, this would adversely impact our ability to attract investment partners and to form new financing funds and our ability to offer attractive financing to prospective customers. For the year ended December 31, 2012, more than 90% of new customers chose to enter into financed lease or power purchase agreements rather than buying a solar energy system for cash.
Our business depends in part on the regulatory treatment of third-party owned solar energy systems.
Our leases and power purchase agreements are third-party ownership arrangements. Sales of electricity by third parties face regulatory challenges in some states and jurisdictions. Other challenges pertain to whether third-party owned systems qualify for the same levels of rebates or other non-tax incentives available for customer-owned solar energy systems, whether third-party owned systems are eligible at all for these incentives, and whether third-party owned systems are eligible for net metering and the associated significant cost savings. Reductions in, or eliminations of, this treatment of these third-party arrangements could reduce demand for our systems, adversely impact our access to capital and could cause us to increase the price we charge our customers for energy.
The Office of the Inspector General of the U.S. Department of Treasury has issued subpoenas to a number of significant participants in the rooftop solar energy installation industry, including us. The subpoena we received requires us to deliver certain documents in our possession relating to our participation in the U.S. Treasury grant program. These documents will be delivered to the Office of the Inspector General of the U.S. Department of Treasury, which is investigating the administration and implementation of the U.S. Treasury grant program.
In July 2012, we and other companies with significant market share, and other companies related to the solar industry, received subpoenas from the U.S. Department of Treasury’s Office of the Inspector General to deliver certain documents in our respective possession. In particular, our subpoena requested, among other things, documents dated, created, revised or referred to since January 1, 2007 that relate to our applications for U.S. Treasury grants or communications with certain other solar development companies or certain firms that appraise solar energy property for U.S. Treasury grant application purposes. The Inspector General is working
17
Table of Contents
with the Civil Division of the U.S. Department of Justice to investigate the administration and implementation of the U.S. Treasury grant program, including possible misrepresentations concerning the fair market value of the solar power systems submitted for grant under that program made in grant applications by companies in the solar industry, including us. We intend to cooperate fully with the Inspector General and the Department of Justice. We are continuing to produce documents as requested by the Inspector General, and anticipate at least six months will be required to complete the gathering and production of such materials, and that the Inspector General will require at least another year to conclude its review of those materials.
We are not aware of, and have not been made aware of, any specific allegations of misconduct or misrepresentation by us or our officers, directors or employees, and no such assertions have been made by the Inspector General or the Department of Justice. However, if at the conclusion of the investigation the Inspector General concludes that misrepresentations were made, the Department of Justice could decide to bring a civil action to recover amounts it believes were improperly paid to us. If it were successful in asserting this action, we could then be required to pay damages and penalties for any funds received based on such misrepresentations (which, in turn, could require us to make indemnity payments to certain of our fund investors). Such consequences could have a material adverse effect on our business, liquidity, financial condition and prospects. Additionally, the period of time necessary to resolve the investigation is uncertain, and this matter could require significant management and financial resources that could otherwise be devoted to the operation of our business.
The Internal Revenue Service recently notified us that it is conducting an income tax audit of two of our financing funds.
In October 2012, we were notified that the Internal Revenue Service was commencing income tax audits of two of our financing funds which audit will include a review of the fair market value of the solar power systems submitted for grant under the 1603 Grant Program. If, at the conclusion of the audits currently being conducted, the Internal Revenue Service determines that the valuations were incorrect and that our financing funds received U.S. Treasury grants in excess of the amounts to which they were entitled, we could be subject to tax liabilities, including interest and penalties, and we could be required to make indemnity payments to the fund investors.
If the Internal Revenue Service or the U.S. Treasury Department makes additional determinations that the fair market value of our solar energy systems is materially lower than what we have claimed, we may have to pay significant amounts to our financing funds or to our fund investors and such determinations could have a material adverse effect on our business, financial condition and prospects.
We and our fund investors claim the Federal ITC or the U.S. Treasury grant in amounts based on the fair market value of our solar energy systems. We have obtained independent appraisals to support the fair market values we report for claiming Federal ITCs and U.S. Treasury grants. The Internal Revenue Service and the U.S. Treasury Department review these fair market values. With respect to U.S. Treasury grants, the U.S. Treasury Department reviews the reported fair market value in determining the amount initially awarded, and the Internal Revenue Service and the U.S. Treasury Department may also subsequently audit the fair market value and determine that amounts previously awarded must be repaid to the U.S. Treasury Department. Such audits of a small number of our financing funds are ongoing. With respect to Federal ITCs, the Internal Revenue Service may review the fair market value on audit and determine that the tax credits previously claimed must be reduced. If the fair market value is determined in either of these circumstances to be less than we reported, we may owe the fund or our fund investors an amount equal to this difference, plus any costs and expenses associated with a challenge to that valuation. The U.S. Treasury Department has determined in some instances to award us U.S. Treasury grants for our solar energy systems at a materially lower value than we had established in our appraisals and, as a result, we have been required to pay our fund investors a true-up payment or contribute additional assets to the associated financing funds. For example, in the fourth quarter of 2011, we had discussions with representatives of the U.S. Treasury Department relating to U.S. Treasury grant applications for certain commercial solar energy systems submitted in the third and fourth quarters of 2011 and the appropriate U.S.
18
Table of Contents
Treasury grant valuation guidelines for such systems. We were unsuccessful in our attempts to have the U.S. Treasury Department reconsider its valuation for these systems, and while we maintained the accuracy of the contracted value to the financing fund, we elected at that time to receive the lower amounts communicated by the U.S. Treasury Department. Thereafter, other U.S. Treasury grant applications were accepted and the U.S. Treasury grant paid in full on the basis of the valuations submitted. On December 5, 2012, the U.S. Treasury Department notified one of our financing funds that it has established new guidelines for residential solar energy systems placed in service in California and Arizona on or after October 1, 2012. The new guidelines communicated are $6.00 per watt in California and $5.00 per watt in Arizona. Prior to this change, we had been reimbursed at $6.87 per watt in California and $6.20 per watt in Arizona. The U.S. Treasury Department has applied this new guidance to all residential solar energy systems placed in service in California and Arizona by us on or after October 1, 2012. As a result, based on the number of such systems that we have placed in service and that we plan to place in service using funds contributed by investors to our financing funds prior to December 31, 2012, and assuming that we contribute all such systems to our financing funds at the old guidelines and that we do not reallocate any systems to funds that claim Federal ITCs instead of U.S. Treasury grants, we estimate that we would be obligated to pay the investors approximately $8.2 million to compensate them for the anticipated shortfall in grants. Our investors are contributing to our financing funds at Treasury’s new guidelines to reduce or eliminate the need for the company to subsequently pay those investors true-up payments or contribute additional assets to the associated financing funds. If the Internal Revenue Service or the U.S. Treasury Department further disagrees now or in the future, as a result of any pending or future audit, the outcome of the Department of Treasury Inspector General investigation, the change in guidelines or otherwise, with the fair market value of more of our solar energy systems that we have constructed or that we construct in the future, including any systems for which grants have already been paid, and determines we have claimed too high of a fair market value, it could have a material adverse effect on our business, financial condition and prospects. For example, a hypothetical five percent downward adjustment in the fair market value in the approximately $398.0 million of U.S. Department of Treasury grant applications that we have submitted as of December 31, 2012 would obligate us to repay approximately $19.9 million to our fund investors. These amounts do not include the impact of the sequestration of federal government spending that is discussed in a separate risk factor above.
Our ability to provide solar energy systems to customers on an economically viable basis depends on our ability to finance these systems with fund investors who require particular tax and other benefits.
Our solar energy systems have been eligible for Federal ITCs or U.S. Treasury grants, as well as depreciation benefits. We have relied on, and will continue to rely on, financing structures that monetize a substantial portion of those benefits and provide financing for our solar energy systems. With the lapse of the U.S. Treasury grant program, we anticipate that our reliance on these tax-advantaged financing structures will increase substantially. If, for any reason, we were unable to continue to monetize those benefits through these arrangements, we may be unable to provide and maintain solar energy systems for new customers on an economically viable basis.
The availability of this tax-advantaged financing depends upon many factors, including:
| • | our ability to compete with other renewable energy companies for the limited number of potential fund investors, each of which has limited funds and limited appetite for the tax benefits associated with these financings; |
| • | the state of financial and credit markets; |
| • | changes in the legal or tax risks associated with these financings; and |
| • | non-renewal of these incentives or decreases in the associated benefits. |
19
Table of Contents
Under current law, the Federal ITC will be reduced from approximately 30% of the cost of the solar energy systems to approximately 10% for solar energy systems placed in service after December 31, 2016. In addition, U.S. Treasury grants are no longer available for new solar energy systems. Moreover, potential fund investors must remain satisfied that the structures we offer make the tax benefits associated with solar energy systems available to these investors, which depends both on the investors’ assessment of the tax law and the absence of any unfavorable interpretations of that law. Changes in existing law and interpretations by the Internal Revenue Service and the courts could reduce the willingness of fund investors to invest in funds associated with these solar energy system investments. We cannot assure you that this type of financing will be available to us. If, for any reason, we are unable to finance solar energy systems through tax-advantaged structures or if we are unable to realize or monetize depreciation benefits, we may no longer be able to provide solar energy systems to new customers on an economically viable basis. This would have a material adverse effect on our business, financial condition and results of operations.
We need to enter into additional substantial financing arrangements to facilitate our customers’ access to our solar energy systems, and if this financing is not available to us on acceptable terms, if and when needed, our ability to continue to grow our business would be materially adversely impacted.
Our future success depends on our ability to raise capital from third-party fund investors to help finance the deployment of our residential and commercial solar energy systems. In particular, our strategy is to seek to reduce the cost of capital through these arrangements to improve our margins or to offset future reductions in government incentives and to maintain the price competitiveness of our solar energy systems. If we are unable to establish new financing funds when needed, or upon desirable terms, to enable our customers’ access to our solar energy systems with little or no upfront cost, we may be unable to finance installation of our customers’ systems, or our cost of capital could increase, either of which would have a material adverse effect on our business, financial condition and results of operations. To date we have raised capital sufficient to finance installation of our customers’ solar energy systems from a number of financial institutions and other large companies. The contract terms in certain of our financing fund documents condition our ability to draw on financing commitments from the fund investors, including if an event occurs that could reasonably be expected to have a material adverse effect on the fund or in one case on us. If we do not satisfy such condition due to events related to our business or a specific financing fund or developments in our industry (including related to the Department of Treasury Inspector General investigation) or otherwise, and as a result we are unable to draw on existing commitments, it could have a material adverse effect on our business, liquidity, financial condition and prospects. If any of the financial institutions or large companies that currently invest in our financing funds decide not to invest in future financing funds to finance our solar energy systems due to general market conditions, concerns about our business or prospects, the pendency of the Department of Treasury Inspector General investigation or any other reason, or materially change the terms under which they are willing to provide future financing, we will need to identify new financial institutions and companies to invest in our financing funds and negotiate new financing terms.
In the past, we encountered challenges raising new funds, which caused us to delay deployment of a substantial number of solar energy systems for which we had signed leases or power purchase agreements with customers. For example, in late 2008 and early 2009, as a result of the state of the capital markets, our ability to finance the installation of solar energy systems was limited and resulted in a significant backlog of signed sales orders for solar energy systems. Our future ability to obtain additional financing depends on banks’ and other financing sources’ continued confidence in our business model and the renewable energy industry as a whole. It could also be impacted by the liquidity needs of such financing sources themselves. If we experience higher customer default rates than we currently experience in our existing financing funds or we lower the credit rating requirement for new customers, this could make it more difficult or costly to attract future financing. Solar energy has yet to achieve broad market acceptance and depends on continued support in the form of performance-based incentives, rebates, tax credits and other incentives from federal, state and foreign governments. If this support diminishes, our ability to obtain external financing on acceptable terms, or at all, could be materially adversely affected. In addition, we face competition for these investor funds. If we are unable
20
Table of Contents
to continue to offer a competitive investment profile, we may lose access to these funds or they may only be available on less favorable terms than our competitors. Our current financing sources may be inadequate to support the anticipated growth in our business plans. Our inability to secure financing could lead to cancelled projects and could impair our ability to accept new projects and customers. In addition, our borrowing costs could increase, which would have a material adverse effect on our business, financial condition and results of operations.
A material drop in the retail price of utility-generated electricity or electricity from other sources would harm our business, financial condition and results of operations.
We believe that a customer’s decision to buy renewable energy from us is primarily driven by their desire to pay less for electricity. The customer’s decision may also be affected by the cost of other renewable energy sources. Decreases in the retail prices of electricity from the utilities or from other renewable energy sources would harm our ability to offer competitive pricing and could harm our business. The price of electricity from utilities could decrease as a result of:
| • | the construction of a significant number of new power generation plants, including nuclear, coal, natural gas or renewable energy technologies; |
| • | the construction of additional electric transmission and distribution lines; |
| • | a reduction in the price of natural gas as a result of new drilling techniques or a relaxation of associated regulatory standards; |
| • | the energy conservation technologies and public initiatives to reduce electricity consumption; and |
| • | development of new renewable energy technologies that provide less expensive energy. |
A reduction in utility electricity prices would make the purchase of our solar energy systems or the purchase of energy under our lease and power purchase agreements less economically attractive. In addition, a shift in the timing of peak rates for utility-generated electricity to a time of day when solar energy generation is less efficient could make our solar energy system offerings less competitive and reduce demand for our products and services. If the retail price of energy available from utilities were to decrease due to any of these reasons, or others, we would be at a competitive disadvantage, we may be unable to attract new customers and our growth would be limited.
A material drop in the retail price of utility-generated electricity would particularly adversely impact our ability to attract commercial customers.
Commercial customers comprise a significant and growing portion of our business, and the commercial market for energy is particularly sensitive to price changes. Typically, commercial customers pay less for energy from utilities than residential customers. Because the price we are able to charge commercial customers is only slightly lower than their current retail rate, any decline in the retail rate of energy for commercial entities could have a significant impact on our ability to attract commercial customers. We may be unable to offer solar energy systems for the commercial market that produce electricity at rates that are competitive with the price of retail electricity on a non-subsidized basis. If this were to occur, we would be at a competitive disadvantage to other energy providers and may be unable to attract new commercial customers, and our business would be harmed.
Rising interest rates could adversely impact our business.
Changes in interest rates could have an adverse impact on our business by increasing our cost of capital. For example:
| • | rising interest rates would increase our cost of capital; and |
21
Table of Contents
| • | rising interest rates may negatively impact our ability to secure financing on favorable terms to facilitate our customers’ purchase of our solar energy systems or energy generated by our solar energy systems. |
The majority of our cash flows to date have been from solar energy systems under lease and power purchase agreements that have been monetized under various financing fund structures. One of the components of this monetization is the present value of the payment streams from the customers who enter into these leases and power purchase agreements. If the rate of return required by the fund investor rises as a result of a rise in interest rates, it will reduce the present value of the customer payment stream and consequently reduce the total value derived from this monetization. Rising interest rates could harm our business and financial condition.
We have guaranteed a minimum return to be received by an investor in certain of our financing funds and could be adversely affected if we are required to make any payments under those guarantees.
In two of our financing funds with one of our financing partners, with total investments of approximately $86.2 million, we guaranteed to annually distribute a minimum amount. For one of these funds, we have also guaranteed to make payments to the investor to compensate for payments that the investor would be required to make to a certain third party as a result of the investor not achieving a specified minimum internal rate of return in this fund, assessed annually. The amounts of potential future payments under these guarantees depends on the amounts and timing of future distributions to the investor from the funds and the tax benefits that accrue to the investor from the funds’ activities. Because of uncertainties associated with estimating the timing and amounts of distributions to the investor, we cannot determine the potential maximum future payments that we could have to make under these guarantees. We may agree to similar terms in the future if market conditions require it. Any significant payments that we may be required to make under our guarantees could adversely affect our financial condition.
In our lease pass-through financing funds, there is a one-time reset of the lease payments, and we may be obligated, in connection with the resetting of the lease payments at true up, to refund lease prepayments or to contribute additional assets to the extent the system sizes, costs, and timing are not consistent with the initial lease payment model.
In our lease pass-through financing funds, the models used to calculate the lease prepayments will be updated for each fund at a fixed date occurring after placement in service of all solar systems or an agreed upon date (typically within the first year of the applicable lease term) to reflect certain specified conditions as they exist at such date, including the ultimate system size of the equipment that was leased, how much it cost, and when it went into service. As a result of this true up, the lease payments are resized and we may be obligated to refund the investor’s lease prepayments or to contribute additional assets to the fund. Any significant refunds or capital contributions that we may be required to make could adversely affect our financial condition.
We are not currently regulated as a utility under applicable law, but we may be subject to regulation as a utility in the future.
Federal law and most state laws do not currently regulate us as a utility. As a result, we are not subject to the various federal and state standards, restrictions and regulatory requirements applicable to U.S. utilities. In the United States, we obtain federal and state regulatory exemptions by establishing “Qualifying Facility” status with the Federal Energy Regulatory Commission for all of our qualifying solar energy projects. In Canada, we also are generally subject to the regulations of the relevant energy regulatory agencies applicable to all producers of electricity under the relevant feed-in tariff regulations (including the feed-in tariff rates), however we are not currently subject to regulation as a utility. Our business strategy includes the continued development of larger solar energy systems in the future for our commercial and government customers, which has the potential to impact our regulatory position. Any local, state, federal or foreign regulations could place significant restrictions on our ability to operate our business and execute our business plan by prohibiting or otherwise restricting our
22
Table of Contents
sale of electricity. If we were subject to the same state, federal or foreign regulatory authorities as utilities in the United States or if new regulatory bodies were established to oversee our business in the United States or in foreign markets, then our operating costs would materially increase.
A failure to hire and retain a sufficient number of employees in key functions would constrain our growth and our ability to timely complete our customers’ projects.
To support our growth, we need to hire, train, deploy, manage and retain a substantial number of skilled employees. In particular, we need to continue to expand and optimize our sales infrastructure to grow our customer base and our business, and we plan to expand our direct sales force. Identifying and recruiting qualified personnel and training them requires significant time, expense and attention. It can take several months before a new salesperson is fully trained and productive. If we are unable to hire, develop and retain talented sales personnel or if new direct sales personnel are unable to achieve desired productivity levels in a reasonable period of time, we may not be able to realize the expected benefits of this investment or grow our business.
To complete current and future customer projects and to continue to grow our customer base, we need to hire a large number of installers in the relevant markets. Competition for qualified personnel in our industry is increasing, particularly for skilled installers and other personnel involved in the installation of solar energy systems and delivery of energy products and services. We also compete with the homebuilding and construction industries for skilled labor. As these industries recover and seek to hire additional workers, our cost of labor may increase. The unionization of our labor force could also increase our labor costs. Shortages of skilled labor could significantly delay a project or otherwise increase our costs. Because our profit on a particular installation is based in part on assumptions as to the cost of such project, cost overruns, delays or other execution issues may cause us to not achieve our expected margins or cover our costs for that project. In addition, because we are headquartered in the San Francisco Bay Area, we compete for a limited pool of technical and engineering resources that requires us to pay wages that are competitive with relatively high regional standards for employees in these fields.
If we cannot meet our hiring, retention and efficiency goals, we may be unable to complete our customers’ projects on time, in an acceptable manner or at all. Any significant failures in this regard would materially impair our growth, reputation, business and financial results. If we are required to pay higher compensation than we anticipate, these greater expenses may also adversely impact our financial results and the growth of our business.
It is difficult to evaluate our business and prospects due to our limited operating history.
Since our formation in 2006, we have focused our efforts primarily on the sales, financing, engineering, installation and monitoring of solar energy systems for residential, commercial and government customers. We launched our energy efficiency line of products and services in mid-2010, and revenue attributable to this line of business has not been material compared to revenue attributable to our solar energy systems. We may be unsuccessful in significantly broadening our customer base through installation of solar energy systems within our current markets or in new markets we may enter. Additionally, we cannot assure you that we will be successful in generating substantial revenue from our new energy efficiency products and services or from any additional energy-related products and services we may introduce in the future. Our limited operating history, combined with the rapidly evolving and competitive nature of our industry, may not provide an adequate basis for you to evaluate our operating and financing results and business prospects. In addition, we only have limited insight into emerging trends that may adversely impact our business, prospects and operating results. As a result, our limited operating history may impair our ability to accurately forecast our future performance.
We have incurred losses and may be unable to achieve or sustain profitability in the future.
We have incurred net losses in the past, and we had an accumulated deficit of $111.4 million as of December 31, 2012. We may incur net losses from operations as we increase our spending to finance the expansion of our operations, expand our installation, engineering, administrative, sales and marketing staffs, and
23
Table of Contents
implement internal systems and infrastructure to support our growth. We do not know whether our revenue will grow rapidly enough to absorb these costs, and our limited operating history makes it difficult to assess the extent of these expenses or their impact on our operating results. Our ability to achieve profitability depends on a number of factors, including:
| • | growing our customer base; |
| • | finding investors willing to invest in our financing funds; |
| • | maintaining and further lowering our cost of capital; |
| • | reducing the cost of components for our solar energy systems; and |
| • | reducing our operating costs by optimizing our design and installation processes and supply chain logistics. |
Even if we do achieve profitability, we may be unable to sustain or increase our profitability in the future.
We face competition from both traditional energy companies and renewable energy companies.
The solar energy and renewable energy industries are both highly competitive and continually evolving as participants strive to distinguish themselves within their markets and compete with large utilities. We believe that our primary competitors are the traditional utilities that supply energy to our potential customers. We compete with these utilities primarily based on price, predictability of price, and the ease by which customers can switch to electricity generated by our solar energy systems. If we cannot offer compelling value to our customers based on these factors, then our business will not grow. Utilities generally have substantially greater financial, technical, operational and other resources than we do. As a result of their greater size, these competitors may be able to devote more resources to the research, development, promotion and sale of their products or respond more quickly to evolving industry standards and changes in market conditions than we can. Utilities could also offer other value-added products or services that could help them to compete with us even if the cost of electricity they offer is higher than ours. In addition, a majority of utilities’ sources of electricity is non-solar, which may allow utilities to sell electricity more cheaply than electricity generated by our solar energy systems.
We also compete with solar companies in the downstream value chain of solar energy. For example, we face competition from purely finance driven organizations which then subcontract out the installation of solar energy systems, from installation businesses that seek financing from external parties, from large construction companies and utilities, and increasingly from sophisticated electrical and roofing companies. Some of these competitors specialize in either the residential or commercial solar energy markets, and some may provide energy at lower costs than we do. Many of our competitors also have significant brand name recognition and have extensive knowledge of our target markets. For us to remain competitive, we must distinguish ourselves from our competitors by offering an integrated approach that successfully competes with each level of products and services offered by our competitors at various points in the value chain. If our competitors develop an integrated approach similar to ours including sales, financing, engineering, installation, monitoring and efficiency services, this will reduce our marketplace differentiation.
We also face competition in the energy efficiency evaluation and upgrades market and we expect to face competition in additional markets as we introduce new energy-related products and services. As the solar industry grows and evolves, we will also face new competitors who are not currently in the market. Our failure to adapt to changing market conditions and to compete successfully with existing or new competitors will limit our growth and will have a material adverse effect on our business and prospects.
24
Table of Contents
If we fail to remediate deficiencies in our control environment or are unable to implement and maintain effective internal control over financial reporting in the future, the accuracy and timeliness of our financial reporting may be adversely affected.
In connection with the audits of our consolidated financial statements for 2010 and 2011 we identified material weaknesses in our internal control over financial reporting and inventory processes. A material weakness is a deficiency, or a combination of deficiencies, in internal control over financial reporting, such that there is a reasonable possibility that a material misstatement of a company’s annual or interim financial statements will not be prevented or detected on a timely basis. These material weaknesses resulted from an aggregation of deficiencies.
The accounting policies associated with our financing funds are complex, which contributed to the material weaknesses in our internal control over financial reporting. For our lease pass-through arrangements, we initially characterized funds received from investors as deferred revenue rather than financing obligations, which resulted in adjustments to our 2010 consolidated financial statements. For a particular sale-leaseback transaction, we did not initially defer the correct amount of gain associated with this arrangement, which was corrected in our 2010 consolidated financial statements. The foregoing resulted in restatement of our 2010 consolidated financial statements. In addition, deficiencies in the design and operation of our internal controls resulted in audit adjustments and delayed our financial statement close process for the years ended December 31, 2010 and 2011. We are in the process of implementing policies and processes to remediate these material weaknesses and improve our internal control over financial reporting.
We have not performed an evaluation of our internal control over financial reporting, pursuant to Section 404 of the Sarbanes-Oxley Act, nor have we engaged our independent registered public accounting firm to perform an audit of our internal control over financial reporting as of any balance sheet date or for any period reported in our financial statements. Had we performed such an evaluation or had our independent registered public accounting firm performed an audit of our internal control over financial reporting, material weaknesses, in addition to those discussed above, may have been identified. For so long as we qualify as an “emerging growth company” under the JOBS Act, which may be up to five years following our IPO, we will not have to provide an auditor’s attestation report on our internal controls in future annual reports on Form 10-K as otherwise required by Section 404(b) of the Sarbanes-Oxley Act. During the course of the evaluation, documentation or attestation, we or our independent registered public accounting firm may identify weaknesses and deficiencies that we may not otherwise identify in a timely manner or at all as a result of the deferred implementation of this additional level of review.
We have taken numerous steps to address the underlying causes of the control deficiencies referenced above, primarily through the development and implementation of policies, improved processes and documented procedures, and the hiring of additional accounting and finance personnel with technical accounting, inventory accounting and financial reporting experience. If we fail to remediate deficiencies in our control environment or are unable to implement and maintain effective internal control over financial reporting to meet the demands that will be placed upon us as a public company, we may be unable to accurately report our financial results, or report them within the timeframes required by law or exchange regulations.
We cannot assure you that we will be able to remediate our existing material weaknesses in a timely manner, if at all, or that in the future additional material weaknesses will not exist or otherwise be discovered, a risk that is significantly increased in light of the complexity of our business. If our efforts to remediate these material weaknesses are not successful or if other deficiencies occur, our ability to accurately and timely report our financial position, results of operations or cash flows could be impaired, which could result in late filings of our annual and quarterly reports under the Exchange Act, restatements of our consolidated financial statements, a decline in our stock price, suspension or delisting of our common stock by the NASDAQ Global Market, or other material adverse effects on our business, reputation, results of operations, financial condition or liquidity.
25
Table of Contents
Projects for our significant commercial or government customers involve concentrated project risks that may cause significant changes in our financial results.
During any given financial reporting period, we typically have ongoing significant projects for commercial and governmental customers that represent a significant portion of our potential financial results for such period. For example, Walmart is a significant customer for which we have installed a substantial number of solar energy systems. In November 2011, we announced SolarStrong, our five-year plan to build more than $1 billion in solar energy projects for privatized U.S. military housing communities across the country that we anticipate will involve a significant investment in resources and project management over time and will require additional financing funds to support the project. These larger projects create concentrated operating and financial risks. The effect of recognizing revenue or other financial measures on the sale of a larger project, or the failure to recognize revenue or other financial measures as anticipated in a given reporting period because a project is not yet completed under applicable accounting rules by period end, may materially impact our quarterly or annual financial results. In addition, if construction, warranty or operational issues arise on a larger project, or if the timing of such projects unexpectedly shifts for other reasons, such issues could have a material impact on our financial results. If we are unable to successfully manage these significant projects in multiple markets, including our related internal processes and external construction management, or if we are unable to continue to attract such significant customers and projects in the future, our financial results would be harmed.
We depend on a limited number of suppliers of solar panels and other system components to adequately meet anticipated demand for our solar energy systems. Any shortage, delay or component price change from these suppliers could result in sales and installation delays, cancellations and loss of market share.
We purchase solar panels, inverters and other system components from a limited number of suppliers, making us susceptible to quality issues, shortages and price changes. If we fail to develop, maintain and expand our relationships with these or other suppliers, we may be unable to adequately meet anticipated demand for our solar energy systems, or we may only be able to offer our systems at higher costs or after delays. If one or more of the suppliers that we rely upon to meet anticipated demand ceases or reduces production, we may be unable to quickly identify alternate suppliers or to qualify alternative products on commercially reasonable terms, and we may be unable to satisfy this demand. In particular, there are a limited number of inverter suppliers. Once we design a system for use with a particular inverter, if that type of inverter is not readily available at an anticipated price, we may incur additional delay and expense to redesign the system. There have also been periods of industry-wide shortage of key components, including solar panels, in times of rapid industry growth. The manufacturing infrastructure for some of these components has a long lead time, requires significant capital investment and relies on the continued availability of key commodity materials, potentially resulting in an inability to meet demand for these components. Any decline in the exchange rate of the U.S. dollar compared to the functional currency of our component suppliers could increase our component prices. In addition, the U.S. government has imposed tariffs on solar cells manufactured in China. Based on determinations by the U.S. government, the applicable anti-dumping tariff rates range from approximately 8%-239%. To the extent that U.S. market participants experience harm from Chinese pricing practices, an additional tariff of approximately 15%-16% will be applied. Because we currently purchase solar panels containing cells manufactured outside of China, we currently are not adversely impacted by the tariffs. However, if in the future we purchase solar panels containing cells manufactured in China, our purchase price would reflect the tariff penalties mentioned above. Any of these shortages, delays or price changes could limit our growth, cause cancellations or adversely affect our profitability, and result in loss of market share and damage to our brand.
Our operating results may fluctuate from quarter to quarter, which could make our future performance difficult to predict and could cause our operating results for a particular period to fall below expectations, resulting in a severe decline in the price of our common stock.
Our quarterly operating results are difficult to predict and may fluctuate significantly in the future. We have experienced seasonal and quarterly fluctuations in the past. However, given that we are an early-stage
26
Table of Contents
company operating in a rapidly growing industry, those fluctuations may be masked by our recent growth rates and thus may not be readily apparent from our historical operating results. As such, our past quarterly operating results may not be good indicators of future performance.
In addition to the other risks described in this “Risk Factors” section, the following factors could cause our operating results to fluctuate:
| • | the expiration or initiation of any rebates or incentives; |
| • | significant fluctuations in customer demand for our products and services; |
| • | our ability to complete installations in a timely manner due to market conditions resulting in inconsistently available financing; |
| • | our ability to continue to expand our operations, and the amount and timing of expenditures related to this expansion; |
| • | actual or anticipated changes in our growth rate relative to our competitors; |
| • | announcements by us or our competitors of significant acquisitions, strategic partnerships, joint ventures or capital-raising activities or commitments; |
| • | changes in our pricing policies or terms or those of our competitors, including utilities; and |
| • | actual or anticipated developments in our competitors’ businesses or the competitive landscape. |
For these or other reasons, the results of any prior quarterly or annual periods should not be relied upon as indications of our future performance. In addition, our actual revenue, key operating metrics and other operating results in future quarters may fall short of the expectations of investors and financial analysts, which could have a severe adverse effect on the trading price of our common stock.
Our business benefits from the declining cost of solar panels, and our financial results would be harmed if this trend reversed or did not continue.
The declining cost of solar panels and the raw materials necessary to manufacture them has been a key driver in the pricing of our solar energy systems and customer adoption of this form of renewable energy. If solar panel and raw materials prices increase or do not continue to decline, our growth could slow and our financial results would suffer. In addition, in the past we have purchased a significant portion of the solar panels used in our solar energy systems from manufacturers based in China, some of whom benefit from favorable foreign regulatory regimes and governmental support, including subsidies. If this support were to decrease or be eliminated, or if tariffs imposed by the U.S. government were to increase the prices of these solar panels, our ability to purchase these products on competitive terms or to access specialized technologies from those countries could be restricted. Any of those events could harm our financial results by requiring us to pay higher prices or to purchase solar panels or other system components from alternative, higher-priced sources. In addition, the U.S. government has imposed tariffs on solar cells manufactured in China. These tariffs will increase the price of solar panels containing these Chinese-manufactured cells, which may harm our financial results in the event we purchase such panels.
We act as the licensed general contractor for our customers and are subject to risks associated with construction, cost overruns, delays, regulatory compliance and other contingencies, any of which could have a material adverse effect on our business and results of operations.
We are a licensed contractor in every community we service, and we are responsible for every customer installation. For our residential projects, we are the general contractor, construction manager and installer. For our commercial projects, we are the general contractor and construction manager, and we typically rely on
27
Table of Contents
licensed subcontractors to install these commercial systems. We may be liable to customers for any damage we cause to their home or facility, belongings or property during the installation of our systems. For example, we frequently penetrate our customers’ roofs during the installation process and may incur liability for the failure to adequately weatherproof such penetrations following the completion of construction. In addition, shortages of skilled subcontractor labor for our commercial projects could significantly delay a project or otherwise increase our costs. Because our profit on a particular installation is based in part on assumptions as to the cost of such project, cost overruns, delays or other execution issues may cause us to not achieve our expected margins or cover our costs for that project.
In addition, the installation of solar energy systems and the evaluation and modification of buildings as part of our energy efficiency business is subject to oversight and regulation in accordance with national, state and local laws and ordinances relating to building codes, safety, environmental protection, utility interconnection and metering, and related matters. It is difficult and costly to track the requirements of every individual authority having jurisdiction over our installations and to design solar energy systems to comply with these varying standards. Any new government regulations or utility policies pertaining to our systems may result in significant additional expenses to us and our customers and, as a result, could cause a significant reduction in demand for our systems.
Compliance with occupational safety and health requirements and best practices can be costly, and noncompliance with such requirements may result in potentially significant monetary penalties, operational delays and adverse publicity.
The installation of solar energy systems requires our employees to work at heights with complicated and potentially dangerous electrical systems. The evaluation and modification of buildings as part of our energy efficiency business requires our employees to work in locations that may contain potentially dangerous levels of asbestos, lead or mold. We also maintain a fleet of more than 700 vehicles that our employees use in the course of their work. There is substantial risk of serious injury or death if proper safety procedures are not followed. Our operations are subject to regulation under the U.S. Occupational Safety and Health Act, or OSHA, and equivalent state laws. Changes to OSHA requirements, or stricter interpretation or enforcement of existing laws or regulations, could result in increased costs. If we fail to comply with applicable OSHA regulations, even if no work-related serious injury or death occurs, we may be subject to civil or criminal enforcement and be required to pay substantial penalties, incur significant capital expenditures, or suspend or limit operations. In the past, we have had workplace accidents and received citations from OSHA regulators for alleged safety violations, resulting in fines and operational delays for certain projects. Any such accidents, citations, violations, injuries or failure to comply with industry best practices may subject us to adverse publicity, damage our reputation and competitive position and adversely affect our business.
Problems with product quality or performance may cause us to incur warranty expenses and performance guarantee expenses, may lower the residual value of our solar energy systems and may damage our market reputation and cause our financial results to decline.
Our solar energy system warranties are lengthy. Customers who buy energy from us under leases or power purchase agreements are covered by warranties equal to the length of the term of these agreements—typically 20 years. Depending on the state where they live, customers who purchase our solar energy systems for cash are covered by a warranty up to 10 years in duration. We also make extended warranties available at an additional cost to customers who purchase our solar energy systems for cash. In addition, we provide a pass-through of the inverter and panel manufacturers’ warranties to our customers, which generally range from 5 to 25 years. One of these third-party manufacturers could cease operations and no longer honor these warranties, instead leaving us to fulfill these potential obligations to our customers. For example, Evergreen Solar, Inc., one of our former solar panel suppliers, filed for bankruptcy in August 2011. Further, we provide a performance guarantee with our leased solar energy systems that compensates a customer on an annual basis if their system does not meet the electricity production guarantees set forth in their lease.
28
Table of Contents
Because of the limited operating history of our solar energy systems, we have been required to make assumptions and apply judgments regarding a number of factors, including our anticipated rate of warranty claims, and the durability, performance and reliability of our solar energy systems. We have made these assumptions based on the historic performance of similar systems or on accelerated life cycle testing. Our assumptions could prove to be materially different from the actual performance of our systems, causing us to incur substantial expense to repair or replace defective solar energy systems in the future or to compensate customers for systems that do not meet their production guarantees. Product failures or operational deficiencies also would reduce our revenue from power purchase agreements because they are dependent on system production. Any widespread product failures or operating deficiencies may damage our market reputation and adversely impact our financial results.
In addition, we amortize costs of our solar energy systems over 30 years, which typically exceeds the period of the component warranties and the corresponding payment streams from our operating lease arrangements with our customers. In addition, we typically bear the cost of removing the solar energy systems at the end of the lease term. Furthermore, it is difficult to predict how future environmental regulations may affect the costs associated with the removal, disposal or recycling of our solar energy systems. Consequently, if the residual value of the systems is less than we expect at the end of the lease, after giving effect to any associated removal and redeployment costs, we may be required to accelerate all or some of the remaining unamortized expenses. This could materially impair our future operating results.
Product liability claims against us could result in adverse publicity and potentially significant monetary damages.
If one of our solar energy systems or other products injured someone we would be exposed to product liability claims. Because solar energy systems and many of our other current and anticipated products are electricity producing devices, it is possible that consumers could be injured by our products, whether by product malfunctions, defects, improper installation or other causes. We rely on our general liability insurance to cover product liability claims and have not obtained separate product liability insurance. Any product liability claim we face could be expensive to defend and divert management’s attention. The successful assertion of product liability claims against us could result in potentially significant monetary damages that could require us to make significant payments, as well as subject us to adverse publicity, damage our reputation and competitive position. Also, any product liability claims and any adverse outcomes may subject us to adverse publicity, damage our reputation and competitive position and adversely affect sales of our systems and other products.
Damage to our brand and reputation would harm our business and results of operations.
We depend significantly on our reputation for high-quality products and services, best-in-class engineering, exceptional customer service and the brand name “SolarCity” to attract new customers and grow our business. If we fail to continue to deliver our solar energy systems and our other energy products and services within the planned timelines, if our products and services do not perform as anticipated or if we damage any of our customers’ properties or cancel projects, our brand and reputation could be significantly impaired. In addition, if we fail to deliver, or fail to continue to deliver, high-quality products and services to our customers through our long-term relationships, our customers will be less likely to purchase future products and services from us, which is a key strategy to achieve our desired growth. We also depend greatly on referrals from existing customers for our growth, in addition to our other marketing efforts. Therefore, our inability to meet or exceed our current customers’ expectations would harm our reputation and growth through referrals.
If we fail to manage our recent and future growth effectively, we may be unable to execute our business plan, maintain high levels of customer service or adequately address competitive challenges.
We have experienced significant growth in recent periods, and we intend to continue to expand our business significantly within existing markets and in a number of new locations in the future. This growth has placed, and any future growth may place, a significant strain on our management, operational and financial
29
Table of Contents
infrastructure. In particular, we will be required to expand, train and manage our growing employee base. Our management will also be required to maintain and expand our relationships with customers, suppliers and other third-parties and attract new customers and suppliers, as well as to manage multiple geographic locations.
In addition, our current and planned operations, personnel, systems and procedures might be inadequate to support our future growth and may require us to make additional unanticipated investment in our infrastructure. Our success and ability to further scale our business will depend, in part, on our ability to manage these changes in a cost-effective and efficient manner. If we cannot manage our growth, we may be unable to take advantage of market opportunities, execute our business strategies or respond to competitive pressures. This could also result in declines in quality or customer satisfaction, increased costs, difficulties in introducing new products and services or other operational difficulties. Any failure to effectively manage growth could adversely impact our business and reputation.
We may not be successful in leveraging our customer base to grow our business through sales of other energy products and services.
To date, we have derived substantially all of our revenue and cash receipts from the sale of solar energy systems and the sale of energy under our long-term customer agreements. We launched our energy efficiency line of products and services in mid-2010, and revenue attributable to this line of business has not been material compared to revenue attributable to our solar energy systems. Customer demand for these offerings may be more limited than we anticipate. In addition, several of our other energy products and services, including our battery storage solutions, are in the early stages of testing and development. We may not be successful in completing development of these products as a result of research and development difficulties, technical issues, availability of third-party products or other reasons. Even if we are able to offer these or other additional products and services, we may not successfully generate meaningful customer demand to make these offerings viable. If we fail to deliver these additional products and services, if the costs associated with bringing these additional products and services to market is greater than we anticipate, or if customer demand for these offerings is smaller than we anticipate, our growth will be limited.
Our growth depends in part on the success of our strategic relationships with third parties.
A key component of our growth strategy is to develop or expand our strategic relationships with third parties. For example, we are investing resources in establishing relationships with industry leaders, such as trusted retailers and commercial homebuilders, to generate new customers. Identifying partners and negotiating relationships with them requires significant time and resources. If we are unsuccessful in establishing or maintaining our relationships with these third parties, our ability to grow our business could be impaired. Even if we are able to establish these relationships, we may not be able to execute on our goal of leveraging these relationships to meaningfully expand our business and customer base. This would limit our growth potential and our opportunities to generate significant additional revenue or cash receipts.
The loss of one or more members of our senior management or key employees may adversely affect our ability to implement our strategy.
We depend on our experienced management team, and the loss of one or more key executives could have a negative impact on our business. In particular, we are dependent on the services of our chief executive officer and co-founder, Lyndon R. Rive, and our chief operations officer, chief technology officer and co-founder, Peter J. Rive. We also depend on our ability to retain and motivate key employees and attract qualified new employees. Neither our founders nor our key employees are bound by employment agreements for any specific term, and we may be unable to replace key members of our management team and key employees in the event we lose their services. Integrating new employees into our management team could prove disruptive to our operations, require substantial resources and management attention and ultimately prove unsuccessful. An inability to attract and retain sufficient managerial personnel who have critical industry experience and relationships could limit or delay our strategic efforts, which could have a material adverse effect on our business, financial condition and results of operations.
30
Table of Contents
Our business may be harmed if we fail to properly protect our intellectual property.
We believe that the success of our business depends in part on our proprietary technology, including our software, information, processes and know-how. We rely on trade secret and patent protections to secure our intellectual property rights. We cannot be certain that we have adequately protected or will be able to adequately protect our proprietary technology, that our competitors will not be able to utilize our existing technology or develop similar technology independently, that the claims allowed with respect to any patents held by us will be broad enough to protect our technology or that foreign intellectual property laws will adequately protect our intellectual property rights. Moreover, we cannot be certain that our patents provide us with a competitive advantage. Despite our precautions, it may be possible for third parties to obtain and use our intellectual property without our consent. Unauthorized use of our intellectual property by third parties, and the expenses incurred in protecting our intellectual property rights, may adversely affect our business. In the future, some of our products could be alleged to infringe existing patents or other intellectual property of third parties, and we cannot be certain that we will prevail in any intellectual property dispute. In addition, any future litigation required to enforce our patents, to protect our trade secrets or know-how or to defend us or indemnify others against claimed infringement of the rights of others could harm our business, financial condition and results of operations.
The requirements of being a public company may strain our resources, divert management’s attention and affect our ability to attract and retain qualified board members and officers.
As a public company, we are subject to the reporting requirements of the Exchange Act, the listing requirements of the NASDAQ Global Market and other applicable securities rules and regulations. Compliance with these rules and regulations will increase our legal and financial compliance costs, make some activities more difficult, time-consuming or costly and increase demand on our systems and resources. The Exchange Act requires, among other things, that we file annual, quarterly and current reports with respect to our business and operating results and maintain effective disclosure controls and procedures and internal control over financial reporting. To maintain and, if required, improve our disclosure controls and procedures and internal control over financial reporting to meet this standard, significant resources and management oversight may be required. As a result, management’s attention may be diverted from other business concerns, which could harm our business and operating results. Although we have already hired additional employees to comply with these requirements, we may need to hire more employees in the future, which will increase our costs and expenses.
As a public company, we also expect that it will be more expensive for us to maintain director and officer liability insurance, and we may be required to accept reduced coverage or incur substantially higher costs to obtain coverage. These factors could also make it more difficult for us to attract and retain qualified executive officers and members of our board of directors, particularly to serve on our audit committee and compensation committee.
The production and installation of solar energy systems depends heavily on suitable meteorological conditions. If meteorological conditions are unexpectedly unfavorable, the electricity production from our solar energy systems may be substantially below our expectations and our ability to timely deploy new systems may be adversely impacted.
The energy produced and revenue and cash receipts generated by a solar energy system depend on suitable solar and weather conditions, both of which are beyond our control. Furthermore, components of our systems, such as panels and inverters, could be damaged by severe weather, such as hailstorms or tornadoes. In these circumstances, we generally would be obligated to bear the expense of repairing the damaged solar energy systems that we own. Sustained unfavorable weather also could unexpectedly delay our installation of solar energy systems, leading to increased expenses and decreased revenue and cash receipts in the relevant periods. Weather patterns could change, making it harder to predict the average annual amount of sunlight striking each location where we install. This could make our solar energy systems less economical overall or make individual systems less economical. Any of these events or conditions could harm our business, financial condition and results of operations.
31
Table of Contents
We typically bear the risk of loss and the cost of maintenance and repair on solar systems that are owned or leased by our fund investors.
We typically bear the risk of loss and are generally obligated to cover the cost of maintenance and repair on any solar systems that we sell or lease to our fund investors. At the time we sell or lease a solar system to a fund investor, we enter into a maintenance services agreement where we agree to operate and maintain the system for a fixed fee that is calculated to cover our future expected maintenance costs. If our solar systems require an above-average amount of repairs or if the cost of repairing systems were higher than our estimate, we would need to perform such repairs without additional compensation. If our solar systems, a majority of which are located in California, are damaged in the event of a natural disaster beyond our control, losses could be excluded, such as earthquake damage, or exceed insurance policy limits, and we could incur unforeseen costs that could harm our business and financial condition. We may also incur significant costs for taking other actions in preparation for, or in reaction to, such events. We purchase Property and Business Interruption insurance with industry standard coverage and limits approved by an investor’s third party insurance advisors to hedge against such risk, but such coverage may not cover our losses.
Any unauthorized disclosure or theft of personal information we gather, store and use could harm our reputation and subject us to claims or litigation.
We receive, store and use personal information of our customers, including names, addresses, e-mail addresses, credit information and other housing and energy use information. Unauthorized disclosure of such personal information, whether through breach of our systems by an unauthorized party, employee theft or misuse, or otherwise, could harm our business. If we were subject to an inadvertent disclosure of such personal information, or if a third party were to gain unauthorized access to customer personal information we possess, our operations could be seriously disrupted and we could be subject to claims or litigation arising from damages suffered by our customers. In addition, we could incur significant costs in complying with the multitude of federal, state and local laws regarding the unauthorized disclosure of personal information. Finally, any perceived or actual unauthorized disclosure of such information could harm our reputation, substantially impair our ability to attract and retain customers and have an adverse impact on our business.
We may have trouble refinancing our credit facilities or obtaining new financing for our working capital, equipment financing and other needs in the future or complying with the terms of existing credit facilities. If credit facilities are not available to us on acceptable terms, if and when needed, or if we are unable to comply with their terms, our ability to continue to grow our business would be adversely impacted.
We have entered into several secured credit agreements, including a $75.0 million working capital facility that matures in September 2014, a $58.5 million term loan credit facility for the purchase of inventory and working capital needs that matures in August 2013, and a $7.0 million term facility to finance the purchase of vehicles that matures in January 2015. Each facility requires us to comply with certain financial, reporting and other requirements. The timing of our commercial projects and other large projects has on occasion adversely affected our ability to satisfy certain financial covenants under these or prior facilities. While our lenders have given us waivers of certain covenants we have not satisfied in the past, there is no assurance that the lenders will waive or forbear from exercising their remedies with respect to any future defaults that might occur, which also could trigger defaults under our other credit agreements. For example, on April 30, 2012 and May 31, 2012, we did not meet a financial ratio covenant, and on June 30, 2012, we breached a financial covenant related to non-GAAP EBITDA under our prior working capital facility, which also resulted in a default under a separate vehicle financing facility with the same administrative bank agent. The bank waived these breaches, and in September 2012 we refinanced all amounts borrowed with the $75.0 million working capital facility that matures in September 2014. We believe that the financial and other covenants are generally more favorable to us than those in the prior facility, however we cannot assure you that we will not breach these covenants in the future.
Further, there is no assurance that we will be able to enter into new credit facilities on acceptable terms. If we are unable to satisfy financial covenants and other terms under existing or new facilities or obtain
32
Table of Contents
associated waivers or forbearance from our lenders or if we are unable to obtain refinancing or new financings for our working capital, equipment and other needs on acceptable terms if and when needed, our business would be adversely affected.
In the long term, we intend to expand our international activities, which will subject us to a number of risks.
Our long-term strategic plans include international expansion, and we intend to sell our solar energy products and services in international markets. Risks inherent to international operations include the following:
| • | inability to work successfully with third parties with local expertise to co-develop international projects; |
| • | multiple, conflicting and changing laws and regulations, including export and import restrictions, tax laws and regulations, environmental regulations, labor laws and other government requirements, approvals, permits and licenses; |
| • | changes in general economic and political conditions in the countries where we operate, including changes in government incentives relating to power generation and solar electricity; |
| • | political and economic instability, including wars, acts of terrorism, political unrest, boycotts, curtailments of trade and other business restrictions; |
| • | difficulties and costs in recruiting and retaining individuals skilled in international business operations; |
| • | international business practices that may conflict with U.S. customs or legal requirements; |
| • | financial risks, such as longer sales and payment cycles and greater difficulty collecting accounts receivable; |
| • | fluctuations in currency exchange rates relative to the U.S. dollar; and |
| • | inability to obtain, maintain or enforce intellectual property rights, including inability to apply for or register material trademarks in foreign countries. |
Doing business in foreign markets requires us to be able to respond to rapid changes in market, legal, and political conditions in these countries. The success of our business will depend, in part, on our ability to succeed in differing legal, regulatory, economic, social and political environments. We may not be able to develop and implement policies and strategies that will be effective in each location where we do business.
Risks Related to the Ownership of Our Common Stock
Our stock price has been and may continue to be volatile, and the value of your investment could decline.
The trading price of our common stock has been volatile since our initial public offering. Since shares of our common stock were sold in our initial public offering in December 2012 at a price of $8.00 per share, the reported high and low sales prices of our common stock has ranged from $9.20 to $20.38 per share, through March 20, 2013. The market price of our common stock may fluctuate widely in response to many risk factors listed in this section and others beyond our control, including:
| • | addition or loss of significant customers; |
| • | changes in laws or regulations applicable to our industry, products or services; |
| • | additions or departures of key personnel; |
33
Table of Contents
| • | actual or anticipated changes in expectations regarding our performance by investors or securities analysts; |
| • | price and volume fluctuations in the overall stock market; |
| • | volatility in the market price and trading volume of companies in our industry or companies that investors consider comparable; |
| • | share price and volume fluctuations attributable to inconsistent trading volume levels of our shares; |
| • | our ability to protect our intellectual property and other proprietary rights; |
| • | sales of our common stock by us or our stockholders; |
| • | the expiration of contractual lock-up agreements; |
| • | litigation involving us, our industry or both; |
| • | major catastrophic events; and |
| • | general economic and market conditions and trends. |
Further, the stock markets have experienced extreme price and volume fluctuations that have affected and continue to affect the market prices of equity securities of many companies. These fluctuations often have been unrelated or disproportionate to the operating performance of those companies. In addition, the stock prices of many renewable energy companies have experienced wide fluctuations that have often been unrelated to the operating performance of those companies. These broad market and industry fluctuations, as well as general economic, political and market conditions such as recessions, interest rate changes or international currency fluctuations, may cause the market price of our common stock to decline. In the past, companies that have experienced volatility in the market price of their stock have been subject to securities class action litigation. We may be the target of this type of litigation in the future. Securities litigation against us could result in substantial costs and divert our management’s attention from other business concerns, which could seriously harm our business.
As an emerging growth company within the meaning of the Securities Act, we will utilize certain modified disclosure requirements, and we cannot be certain if these reduced requirements will make our common stock less attractive to investors.
We are an emerging growth company within the meaning of the rules under the Securities Act. We have in this annual report on Form 10-K utilized, and we plan in future filings with the SEC to continue to utilize, the modified disclosure requirements available to emerging growth companies, including reduced disclosure about our executive compensation and omission of compensation discussion and analysis, and an exemption from the requirement of holding a nonbinding advisory vote on executive compensation. In addition, we will not be subject to certain requirements of Section 404 of the Sarbanes-Oxley Act, including the additional testing of our internal control over financial reporting as may occur when outside auditors attest as to our internal control over financial reporting, and we have elected to delay adoption of new or revised accounting standards applicable to public companies. As a result, our stockholders may not have access to certain information they may deem important.
In addition, Section 107 of the JOBS Act also provides that an emerging growth company can utilize the extended transition period provided in Section 7(a)(2)(B) of the Securities Act for complying with new or revised accounting standards. Thus, an emerging growth company can delay the adoption of certain accounting standards until those standards would otherwise apply to private companies. We have elected to utilize this extended transition period. Our financial statements may therefore not be comparable to those of companies that comply with such new or revised accounting standards as they become applicable to public companies. We cannot
34
Table of Contents
predict if investors will find our common stock less attractive because we will rely on these exemptions. If some investors find our common stock less attractive as a result, there may be a less active trading market for our common stock and our stock price may be more volatile.
We could remain an ‘‘emerging growth company’’ for up to five years, or until the earliest of (i) the last day of the first fiscal year in which our annual gross revenue exceed $1 billion, (ii) the date that we become a ‘‘large accelerated filer’’ as defined in Rule 12b-2 under the Exchange Act, which would occur if the market value of our common stock that is held by non-affiliates exceeds $700 million as of the last business day of our most recently completed second fiscal quarter or (iii) the date on which we have issued more than $1 billion in non-convertible debt during the preceding three-year period.
Our stock price could decline due to the large number of outstanding shares of our common stock eligible for future sale.
Sales of substantial amounts of our common stock in the public market, or the perception that these sales could occur, could cause the market price of our common stock to decline. These sales could also make it more difficult for us to sell equity or equity-related securities in the future at a time and price that we deem appropriate.
Upon expiration of the underwriters’ lock-up from our initial public offering, which is currently scheduled to be released on June 11, 2013, approximately 61.9 million shares of our outstanding common stock will become eligible for sale, subject in some cases to volume and other restrictions of Rules 144 and 701 under the Securities Act, as well as our insider trading policy. Holders of up to approximately 51.9 million of these shares of our common stock, or 69.2% of our total outstanding common stock, based on shares outstanding as of December 31, 2012, will be entitled to rights with respect to registration of these shares under the Securities Act pursuant to an investors’ rights agreement. If these holders of our common stock, by exercising their registration rights, sell a large number of shares, they could adversely affect the market price for our common stock. If we file a registration statement for the purposes of selling additional shares to raise capital and are required to include shares held by these holders pursuant to the exercise of their registration rights, our ability to raise capital may be impaired. Sales of substantial amounts of our common stock in the public market following the release of the lock-up or otherwise, or the perception that these sales could occur, could cause the market price of our common stock to decline.
Insiders have substantial control over us, which could limit your ability to influence the outcome of key transactions, including a change of control.
As of December 31, 2012, our directors, executive officers and each of our stockholders who own greater than 5% of our outstanding common stock and their affiliates, in the aggregate, owned approximately 77.7% of the outstanding shares of our common stock. As a result, these stockholders, if acting together, would be able to influence or control matters requiring approval by our stockholders, including the election of directors and the approval of mergers, acquisitions or other extraordinary transactions. They may have interests that differ from yours and may vote in a way with which you disagree and that may be adverse to your interests. This concentration of ownership may have the effect of delaying, preventing or deterring a change of control of our company, could deprive our stockholders of an opportunity to receive a premium for their common stock as part of a sale of our company and might affect the market price of our common stock.
Provisions in our certificate of incorporation and bylaws and under Delaware law might discourage, delay or prevent a change of control of our company or changes in our management and, therefore, depress the trading price of our common stock.
Our certificate of incorporation and bylaws contain provisions that could depress the trading price of our common stock by discouraging, delaying or preventing a change of control of our company or changes in our management that the stockholders of our company may believe advantageous. These provisions include:
| • | establishing a classified board of directors with three-year staggered terms, which could delay the ability of stockholders to change the membership of a majority of our board of directors; |
35
Table of Contents
| • | authorizing “blank check” preferred stock that our board of directors could issue to increase the number of outstanding shares to discourage a takeover attempt; |
| • | limiting the ability of stockholders to call a special stockholder meeting; |
| • | limiting the ability of stockholders to act by written consent; |
| • | providing that the board of directors is expressly authorized to make, alter or repeal our bylaws; and |
| • | establishing advance notice requirements for nominations for elections to our board of directors or for proposing matters that can be acted upon by stockholders at stockholder meetings. |
If securities or industry analysts do not publish or cease publishing research or reports about us, our business or our market, or if they change their recommendations regarding our stock adversely, our stock price and trading volume could decline.
The trading market for our common stock, to some extent, depends on the research and reports that industry or securities analysts may publish about us, our business, our market or our competitors. If any of the analysts who cover us change their recommendation regarding our stock adversely, or provide more favorable relative recommendations about our competitors, our stock price would likely decline. If any analyst who covers us were to cease coverage of our company or fail to regularly publish reports on us, we could lose visibility in the financial markets, which in turn could cause our stock price or trading volume to decline.
We do not intend to pay dividends for the foreseeable future.
We have never declared or paid any dividends on our common stock. We intend to retain any earnings to finance the operation and expansion of our business, and we do not anticipate paying any cash dividends in the future. As a result, you may only receive a return on your investment in our common stock if the market price of our common stock increases.
ITEM 1B. UNRESOLVED STAFF COMMENTS
Not applicable.
Our corporate headquarters and executive offices are located in San Mateo, California, where we occupy approximately 68,025 square feet of office space under a lease that expires in December 2016. Our other locations include sales offices and warehouses in Arizona, California, Colorado, Connecticut, Hawaii, Maryland, Massachusetts, New Jersey, New York, Oregon and Texas. We also maintain sales and support offices in Ontario, Canada.
We lease all of our facilities, and we do not own any real property. We believe that our existing facilities are adequate for our current needs and that we will be able to lease suitable additional or alternative space on commercially reasonable terms if and when we need it.
On February 13, 2012, SunPower Corporation filed an action in the United States District Court for the Northern District of California (Civil Action No. 12-00694). The complaint asserts 12 causes of action against six defendants: SolarCity, Thomas Leyden, Matt Giannini, Dan Leary, Felix Aguayo and Alice Cathcart, although only the following six causes of action are asserted against SolarCity: trade secret misappropriation;
36
Table of Contents
conversion; trespass to chattels; interference with prospective business advantage; unfair competition; and statutory unfair competition. Each of Messrs. Leyden, Giannini, Leary and Aguayo, and Ms. Cathcart, or the Individual Defendants, are former SunPower employees, and at the time SunPower filed the complaint, each was a SolarCity employee. The complaint’s claims generally relate to alleged unlawful access of SunPower computers by the Individual Defendants for the purpose of securing SunPower information, the alleged misappropriation of SunPower’s trade secret information for competitive advantage or in furtherance of recruiting some or all of the Individual Defendants to leave SunPower and join SolarCity. The complaint seeks preliminary and permanent injunctions, damages and attorney’s fees. In September 2011, we hired Mr. Leyden as our vice president of commercial sales; subsequently, his title was changed to vice president, project development. Mr. Leyden’s employment with us ceased on March 2, 2012. The parties reached a confidential agreement to settle the action on December 31, 2012, and the lawsuit was dismissed with prejudice on January 28, 2013. The terms and amount of the settlement are not material to the Company’s financial position or results of operation.
On August 17, 2012, Kevin Demattio, a former outside sales employee, filed a putative class action complaint against SolarCity in the Superior Court for the County of Los Angeles (Civil Action No. BC490482). Mr. Demattio purports to represent a class of certain current and former outside sales representatives, and those with a similar title, who worked for us in California for the four-year period prior to the filing of the complaint. The complaint alleges causes of action for failure to pay proper wages due under various commission pay plans; failure to properly pay the wages of terminated (or resigned) employees; failure to provide proper itemized wage statements because of an alleged failure to specify requisite information; failure to keep accurate time records; and related claims for unfair competition and a California state statute permitting individuals to pursue claims not pursued by a state agency. Mr. Demattio seeks unspecified damages for himself and affected class members, including all wages due and owing, applicable statutory penalties (including waiting time penalties), interest, attorneys’ fees and costs. On January 24, 2013, we answered the complaint and asserted a cross complaint against Mr. Demattio to recover commissions that he was paid, but not entitled to, along with the Company’s fees and costs in the litigation. Discovery has commenced, and we intend to defend ourselves against the complaint and pursue our own claims vigorously.
In July 2012, we and other companies with significant market share, and other companies related to the solar industry, received subpoenas from the U.S. Department of Treasury’s Office of the Inspector General to deliver certain documents in our respective possession. In particular, our subpoena requested, among other things, documents dated, created, revised or referred to since January 1, 2007 that relate to our applications for U.S. Treasury grants or communications with certain other solar development companies or certain firms that appraise solar energy property for U.S. Treasury grant application purposes. The Inspector General is working with the Civil Division of the U.S. Department of Justice to investigate the administration and implementation of the U.S. Treasury grant program, including possible misrepresentations concerning the fair market value of the solar power systems submitted for grant under that program made in grant applications by companies in the solar industry, including us. We intend to cooperate fully with the Inspector General and the Department of Justice. We are continuing to produce documents as requested by the Inspector General, and anticipate at least six months will be required to complete the gathering and production of such materials, and that the Inspector General will require at least another year to conclude its review of those materials. We are not aware of, and have not been made aware of, any specific allegations of misconduct or misrepresentation by us or our officers, directors or employees, and no such assertions have been made by the Inspector General or the Department of Justice.
From time to time, we may be involved in litigation relating to claims arising in the ordinary course of our business.
ITEM 4. MINE SAFETY DISCLOSURES
Not applicable.
37
Table of Contents
PART II
ITEM 5. MARKET FOR REGISTRANT’S COMMON EQUITY, RELATED STOCKHOLDER MATTERS AND ISSUER REPURCHASES OF EQUITY SECURITIES
Market Information
Our common stock, $0.0001 par value per share, began trading on the NASDAQ Global Market on December 13, 2012, where its prices are quoted under the symbol “SCTY.”
Holders of Record
As of December 31, 2012 there were 260 holders of record of our common stock. Because many of our shares of common stock are held by brokers and other institutions on behalf of stockholders, we are unable to estimate the total number of stockholders represented by these record holders.
Price Range of Our Common Stock
The following table sets forth the reported high and low sales prices of our common stock for the fourth quarter of fiscal 2012 from the date of our IPO, December 13, 2012, through December 31, 2012, as regularly quoted on the NASDAQ Global Market:
| Year Ended December 31, 2012 |
High | Low | ||||||
| Fourth Quarter (from December 13, 2012) |
$ | 13.00 | $ | 9.25 | ||||
Dividend Policy
We have never declared or paid cash dividends on our capital stock. We currently intend to retain all available funds and any future earnings for use in the operation of our business and do not anticipate paying any cash dividends in the foreseeable future. Any decision to declare and pay dividends in the future will be made at the discretion of our board of directors and will depend on, among other things, our results of operations, cash requirements, financial condition, contractual restrictions including compliance with covenants under our credit facilities and other factors that our board of directors may deem relevant.
38
Table of Contents
Stock Price Performance Graph
This performance graph shall not be deemed “filed” for purposes of Section 18 of the Exchange Act, or incorporated by reference into any filing of SolarCity Corporation under the Securities Act or the Exchange Act, except as shall be expressly set forth by specific reference in such filing.
This chart compares the cumulative total return on our common stock with that of the NASDAQ Composite Index and the NASDAQ Clean Edge U.S. Liquid Series Index (CELS). The chart assumes $100 was invested on December 13, 2012 in the common stock of SolarCity Corporation, the NASDAQ Composite Index and the NASDAQ Clean Edge U.S. Liquid Series Index, and assumes the reinvestment of any dividends. The stock price performance on the following graph is not necessarily indicative of future stock price performance.
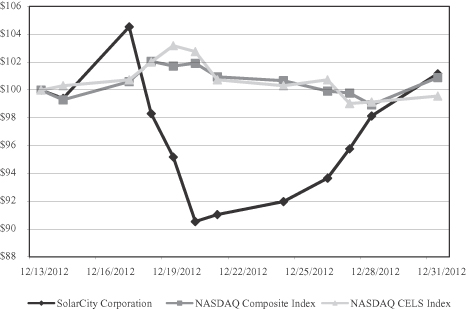
| Company/Index |
Base Period 12/13/2012 |
Indexed Returns Period ended 12/31/2012 |
||||||
| SolarCity Corporation |
$ | 100.00 | $ | 101.19 | ||||
| NASDAQ Composite Index |
$ | 100.00 | $ | 101.91 | ||||
| NASDAQ Clean Edge U.S. Liquid Series Index |
$ | 100.00 | $ | 99.57 | ||||
Recent Sales of Unregistered Securities
Since January 1, 2012, we have issued the following securities that were not registered under the Securities Act:
Sales of Capital Stock
| • | In February and March 2012, we issued 3,386,986 shares of Series G preferred stock to seven accredited investors at a price of $23.92 per share for aggregate gross proceeds of approximately $81.0 million. |
| • | In August 2012, we issued 112,835 shares of Series C preferred stock to two accredited investors upon exercise of outstanding warrants. |
39
Table of Contents
Option Issuances
| • | From January 1, 2012 through December 12, 2013, we issued and sold an aggregate of 840,298 shares of common stock upon the exercise of options issued to certain officers, directors, employees and consultants of the registrant under our 2007 Stock Plan at exercise prices per share ranging from $0.025 to $11.40, for aggregate consideration of approximately $1.6 million. |
| • | From January 1, 2012 through December 12, 2012, we granted direct issuances or stock options to purchase an aggregate of 2,584,910 shares of our common stock at exercise prices per share ranging from $10.74 to $18.48 share to employees, consultants, directors and other service providers under our 2007 Stock Plan. |
None of the foregoing transactions involved any underwriters, underwriting discounts or commissions, or any public offering. We believe the offers, sales, and issuances of the above securities were exempt from registration under the Securities Act by virtue of Section 4(2) of the Securities Act because the issuance of securities to the recipients did not involve a public offering or in reliance on Rule 701 because the transactions were pursuant to compensatory benefit plans or contracts relating to compensation as provided under such rule. The recipients of the securities in each of these transactions represented their intentions to acquire the securities for investment only and not with a view to or for sale in connection with any distribution thereof, and appropriate legends were placed upon the stock certificates issued in these transactions. All recipients had adequate access, through their relationships with us, to information about us. The sales of these securities were made without any general solicitation or advertising.
Use of Proceeds
We filed a Registration Statement on Form S-1 (File No. 333-184317) for an initial public offering of our common stock, which was declared effective by the Securities and Exchange Commission on December 12, 2012. The Registration Statement registered an aggregate of 13,225,000 shares of our common stock, including 1,725,000 shares registered for sale by us upon the exercise of the underwriters’ over-allotment option and 65,012 shares sold by the selling stockholders at the initial public offering price of $8.00 per share, for an aggregate gross offering price of $105,279,904 to us and $520,096 to the selling stockholders. Upon the completion of the sale of the shares referenced in the preceding sentence, the offering terminated.
The underwriters of that offering were Goldman, Sachs & Co., Credit Suisse Securities (USA) LLC, Merrill Lynch, Pierce, Fenner & Smith Incorporated, Needham & Company, LLC and Roth Capital Partners, LLC. We paid the underwriters underwriting discounts totaling approximately $7.1 million in connection with the offering. In addition, we incurred expenses of approximately $5.8 million in connection with the offering, which, when added to the underwriting discounts paid by us, amount to total expenses of approximately $12.9 million. Thus, the net offering proceeds to us, after deducting underwriting discounts and offering expenses, were approximately $92.4 million. No payments were made to our directors or officers or their associates, holders of 10% or more of any class of our equity securities or any affiliates.
There has been no material change in the planned use of proceeds from our initial public offering as described in our final prospectus dated December 12, 2012 filed with the SEC pursuant to Rule 424(b).
ITEM 6. SELECTED CONSOLIDATED FINANCIAL DATA
You should read the following selected consolidated financial data below in conjunction with “Management’s Discussion and Analysis of Financial Condition and Results of Operations” and the consolidated financial statements, related notes and other financial information included elsewhere in this annual report on Form 10-K. The selected consolidated financial data in this section are not intended to replace the consolidated financial statements and are qualified in their entirety by the consolidated financial statements and related notes included elsewhere in this annual report on Form 10-K.
40
Table of Contents
The consolidated statements of operations data for the years ended December 31, 2012, 2011 and 2010 and the consolidated balance sheet data as of December 31, 2012 and 2011 are derived from our audited consolidated financial statements included elsewhere in this annual report on Form 10-K. The consolidated statements of operations data for the years ended December 31, 2009 and 2008 and the consolidated balance sheet data as of December 31, 2010, 2009 and 2008 are derived from our audited consolidated financial statements not included in this annual report on Form 10-K. Our historical results are not necessarily indicative of the results that may be expected in any future period, and our interim results are not necessarily indicative of the results to be expected for the full fiscal year.
| Year Ended December 31, | ||||||||||||||||||||
| 2012 | 2011 | 2010 | 2009 | 2008 | ||||||||||||||||
| (in thousands, per share data) | ||||||||||||||||||||
| Consolidated statements of operations data: |
||||||||||||||||||||
| Revenue: |
||||||||||||||||||||
| Operating leases |
$ | 47,616 | $ | 23,145 | $ | 9,684 | $ | 3,212 | $ | 225 | ||||||||||
| Solar energy systems sales |
81,046 | 36,406 | 22,744 | 29,435 | 31,962 | |||||||||||||||
|
|
|
|
|
|
|
|
|
|
|
|||||||||||
| Total revenue |
128,662 | 59,551 | 32,428 | 32,647 | 32,187 | |||||||||||||||
| Cost of revenue: |
||||||||||||||||||||
| Operating leases |
13,346 | 5,718 | 3,191 | 1,911 | 96 | |||||||||||||||
| Solar energy systems |
62,429 | 41,418 | 26,953 | 28,971 | 33,212 | |||||||||||||||
|
|
|
|
|
|
|
|
|
|
|
|||||||||||
| Total cost of revenue |
77,775 | 47,136 | 30,144 | 30,882 | 33,308 | |||||||||||||||
|
|
|
|
|
|
|
|
|
|
|
|||||||||||
| Gross profit (loss) |
50,887 | 12,415 | 2,284 | 1,765 | (1,121 | ) | ||||||||||||||
| Net loss |
(91,575 | ) | (73,714 | ) | (47,074 | ) | (22,720 | ) | (26,233 | ) | ||||||||||
| Net income (loss) attributable to noncontrolling interests(1) |
(27,384 | ) | (117,230 | ) | (8,457 | ) | 3,507 | (12,272 | ) | |||||||||||
|
|
|
|
|
|
|
|
|
|
|
|||||||||||
| Net income (loss) attributable to stockholders(1) |
$ | (64,191 | ) | $ | 43,516 | $ | (38,617 | ) | $ | (26,227 | ) | $ | (13,961 | ) | ||||||
|
|
|
|
|
|
|
|
|
|
|
|||||||||||
| Net income (loss) per share attributable to common stock holders: |
||||||||||||||||||||
| Basic |
$ | (5.22 | ) | $ | 0.82 | $ | (4.50 | ) | $ | (3.13 | ) | $ | (1.70 | ) | ||||||
|
|
|
|
|
|
|
|
|
|
|
|||||||||||
| Diluted |
$ | (5.23 | ) | $ | 0.76 | $ | (4.50 | ) | $ | (3.13 | ) | $ | (1.70 | ) | ||||||
|
|
|
|
|
|
|
|
|
|
|
|||||||||||
| (1) | Under GAAP, we are required to present the impact of a hypothetical liquidation of our joint venture financing funds on our income statement. For a more detailed discussion of this accounting treatment, see “Management’s Discussion and Analysis of Financial Condition and Results of Operations—Components of Results of Operations—Net Income (Loss) Attributable to Stockholders.” |
| As of December 31, | ||||||||||||||||||||
| 2012 | 2011 | 2010 | 2009 | 2008 | ||||||||||||||||
| (in thousands) | ||||||||||||||||||||
| Consolidated balance sheet data: |
||||||||||||||||||||
| Cash and cash equivalents |
$ | 160,080 | $ | 50,471 | $ | 58,270 | $ | 37,912 | $ | 27,829 | ||||||||||
| Total current assets |
315,417 | 241,522 | 110,432 | 69,896 | 45,124 | |||||||||||||||
| Solar energy systems, leased and to be leased – net |
1,002,184 | 535,609 | 239,611 | 87,583 | 27,838 | |||||||||||||||
| Total assets |
1,361,842 | 813,173 | 371,264 | 164,154 | 78,800 | |||||||||||||||
| Total current liabilities |
213,617 | 246,886 | 81,958 | 52,012 | 19,539 | |||||||||||||||
| Long-term debt, net of current portion |
83,533 | 14,581 | — | 1,808 | 2,169 | |||||||||||||||
| Deferred revenue, net of current portion |
204,396 | 101,359 | 40,681 | 21,394 | 5,645 | |||||||||||||||
| Lease pass-through financing obligation, net of current portion |
125,884 | 46,541 | 53,097 | — | — | |||||||||||||||
| Sale-leaseback financing obligation, net of current portion |
14,755 | 15,144 | 15,758 | — | — | |||||||||||||||
| Other liabilities and deferred credits |
112,056 | 36,314 | 15,715 | 120 | — | |||||||||||||||
| Convertible redeemable preferred stock |
— | 125,722 | 101,446 | 80,042 | 56,184 | |||||||||||||||
| Total Stockholders’ equity (deficit) |
214,320 | (37,662 | ) | (87,488 | ) | (50,736 | ) | (25,377 | ) | |||||||||||
| Noncontrolling interests in subsidiaries |
100,607 | 122,646 | 123,514 | 56,036 | 19,573 | |||||||||||||||
41
Table of Contents
ITEM 7. MANAGEMENT’S DISCUSSION AND ANALYSIS OF FINANCIAL CONDITION AND RESULTS OF OPERATIONS
The following discussion and analysis of our financial condition and results of operations should be read in conjunction with our consolidated financial statements and the related notes to those statements included elsewhere in this annual report on Form 10-K. In addition to historical financial information, the following discussion and analysis contains forward-looking statements that involve risks, uncertainties and assumptions. Our actual results and timing of selected events may differ materially from those anticipated in these forward-looking statements as a result of many factors, including those discussed under “Risk Factors” and elsewhere in this annual report on Form 10-K.
Overview
We integrate the sales, engineering, installation, monitoring, maintenance and financing of our distributed solar energy systems with our energy efficiency products and services. This allows us to offer long-term energy solutions to residential, commercial and government customers. Our customers buy renewable energy from us for less than they currently pay for electricity from utilities with little to no up-front cost. Our long-term contractual arrangements typically generate recurring customer payments and enable our customers to have visibility into their future electricity costs and to minimize their exposure to rising retail electricity rates. Our customer relationships also position us to continue to grow our business through energy efficiency products and services offerings including energy efficiency evaluations, appliance upgrades, energy storage solutions and electric vehicle charging stations.
We offer our customers the option to either purchase and own solar energy systems or to purchase the energy that our solar energy systems produce through various financed arrangements. These financed arrangements include long-term contracts that we structure as leases and power purchase agreements. In both financed structures we install our solar energy system at our customer’s premises and charge the customer a monthly fee for the power that our system produces. In the lease structure, this monthly payment is fixed with a production guarantee. In the power purchase agreement structure, we charge customers a fee per kWh based on the amount of electricity the solar energy system actually produces. The leases and power purchase agreements are typically for 20 years, and generally when there is no upfront fee the specified fees are subject to annual escalations.
Our solar energy systems serve as a gateway for us to perform energy efficiency evaluations and energy efficiency upgrades for our residential customers. During an energy efficiency evaluation, we capture, catalog and analyze all of the energy loads in the home to specifically identify the most valuable and actionable solutions to lower energy cost. We then offer to perform the appropriate upgrades to improve the home’s energy efficiency. We offer our energy efficiency products and services to our solar energy systems customers and on a stand-alone basis. We launched our energy efficiency business in the second quarter of 2010. To date, revenue attributable to our energy efficiency products and services has not been material compared to revenue attributable to our solar energy systems.
Initially, we only offered our solar energy systems on an outright purchase basis. In mid-2008, we began offering leases and power purchase agreements. Our ability to offer leases and power purchase agreements depends in part on our ability to finance the installation of the solar energy systems by monetizing the resulting customer receivable and related investment tax credits, accelerated tax depreciation and other incentives. Currently, the majority of our residential energy customers enter into leasing arrangements, and the majority of our commercial customers and government organizations enter into power purchase agreements. We expect customers to continue to favor leases and power purchase agreements.
We compete mainly with the retail electricity rate charged by the utilities in the markets we serve, and our strategy is to price the energy we sell slightly below that rate. As a result, the price our customers pay to buy energy from us varies depending on the state where the customer is located and the local utility. The price we
42
Table of Contents
charge also depends on customer price sensitivity, the need to offer a compelling financial benefit and the price other solar energy companies charge in the region. Our commercial rates in a given region are also typically lower than our residential rates in that region because utilities’ commercial retail rates are generally lower than their residential retail rates.
We generally recognize revenue from solar energy systems sold to our customers when we install the solar energy system and it passes inspection by the utility or the authority having jurisdiction. We account for our leases and power purchase agreements as operating leases. We recognize the revenue these arrangements generate on a straight-line basis over the term for leases, or as we generate and deliver energy for power purchase agreements. We recognize revenue from our energy efficiency business when we complete the services. Substantially all of our revenue is attributable to customers located in the United States.
The amount of operating leases revenue that we recognize in a given period is dependent in part on the amount of energy generated by solar energy systems under power purchase agreements and by systems with energy output performance incentives, which in turn is dependent in part on the amount of sunlight. As a result, operating leases revenue has in the past been impacted by seasonally shorter daylight hours in winter months. As the relative percentage of our revenue attributable to power purchase agreements or performance-based incentives increases, this seasonality may become more significant.
Various state and local agencies offer incentive rebates for the installation and operation of solar energy systems. For solar energy systems we sell, we typically have the customer assign the incentive rebate to us. We record the incentive rebates as a component of proceeds from the system sale. For incentive rebates associated with solar energy systems under leases or power purchase agreements, we initially record the rebate as deferred revenue and recognize the deferred revenue as revenue over the term of the lease or power purchase agreement.
Component materials, third-party appliances and direct labor comprise the substantial majority of the costs of our solar energy systems and energy efficiency products and services. Under U.S. generally accepted accounting principles, or GAAP, the cost of revenue from our leases and power purchase agreements are primarily comprised of the depreciation of the cost of the solar energy systems, which are depreciated over the estimated useful life of 30 years, and the amortization of initial direct costs, which is amortized over the term of the lease or power purchase agreement.
Prior to our initial public offering, we classified our outstanding preferred stock warrants as a liability on our consolidated balance sheet. These warrants were subject to remeasurement to fair value at each reporting date, with any changes in fair value being recognized as a component of other income or expense, net, in our consolidated statement of operations. Any warrants that were not exercised and did not expire in connection with the closing of our initial public offering of common stock converted into warrants to purchase common stock. These common stock warrants are not classified as a liability but as a component of additional paid-in capital and accordingly are not subject to further remeasurement.
We have structured different types of financing funds to implement our asset monetization strategy. One such structure is a joint venture structure where we and our fund investors both contribute funds or assets into the joint venture. Under GAAP, we are required to present the impact of a hypothetical liquidation of these joint ventures on our income statement. Therefore, after we determine our consolidated net income (loss) for a given period, we are required to allocate a portion of our consolidated net income (loss) to the fund investors in our joint ventures (referred to as the “noncontrolling interests” in our consolidated financial statements) and allocate the remainder of the consolidated net income (loss) to our stockholders. These income or loss allocations, reflected on our consolidated statement of operations, can have a significant impact on our reported results of operations. For example, for the year ended December 31, 2012 and 2011, our consolidated net loss was $91.6 million and $73.7 million, respectively. However, after applying the required allocations, the net income (loss) attributable to our stockholders, the result was a loss of $64.2 million and income of $43.5 million in 2012 and 2011, respectively. For a more detailed discussion of this accounting treatment, see “—Components of Results of Operations—Net Income (Loss) Attributable to Stockholders.”
43
Table of Contents
Financing Funds
Our long-term lease and power purchase agreements create recurring customer payments, investment tax credits, accelerated tax depreciation and other incentives. Our financial strategy is to monetize these assets at the lowest cost of capital. We share the economic benefit of this lower cost of capital with our customers by lowering the price they pay for energy. Historically, we have monetized the assets created by substantially all of our leases and power purchase agreements via financing funds we have formed with fund investors. We contribute the assets to the financing fund and receive upfront cash and retain a residual interest. We use a portion of the cash received from the financing fund to cover our variable and fixed costs associated with installing the related solar energy systems. Because these recurring customer payments, investment tax credits, accelerated tax depreciation and other incentives are either paid by government agencies or individuals or commercial businesses with high credit scores, and because electricity is a necessity, our fund investors perceive these as high-quality assets with a relatively low loss rate. We invest the excess cash in the growth of our business. In the future, in addition to or in lieu of monetizing the value through financing funds, we may use debt, equity or other financing strategies to fund our operations.
We have established different types of financing funds to implement our asset monetization strategy, including joint ventures, lease pass-through and sale-leaseback structures, any of which may utilize debt that is non-recourse to us. We call these arrangements our financing funds. The allocation of the economic benefits among us and the fund investors and related accounting varies depending on the structure.
Joint Ventures. Under joint venture structures, we and our fund investors contribute funds into a joint venture. Then, the joint venture acquires solar energy systems from us and leases the solar energy systems to customers. Prior to the fund investor receiving its contractual rate of return, the fund investors receive substantially all of the value attributable to the long-term recurring customer payments, investment tax credits, accelerated tax depreciation and, in some cases, other incentives. After the fund investor receives its contractual rate of return, we receive substantially all of the value attributable to the long-term recurring customer payments and the other incentives.
We have determined that we are the primary beneficiary in these joint venture structures. Accordingly, we consolidate the assets and liabilities and operating results of these joint ventures, including the solar energy systems and operating lease revenue, in our consolidated financial statements. We recognize the fund investors’ share of the net assets of the joint ventures as noncontrolling interests in subsidiaries in our consolidated balance sheet. We recognize the amounts that are contractually payable to these investors in each period as distributions to noncontrolling interests in our consolidated statement of convertible redeemable preferred stock and equity. Our consolidated statement of cash flows reflects cash received from these fund investors as proceeds from investments by noncontrolling interests in subsidiaries. Our consolidated statement of cash flows also reflects cash paid to these fund investors as distributions paid to noncontrolling interests in subsidiaries. We reflect any unpaid distributions to these fund investors as distributions payable to noncontrolling interests in subsidiaries in our consolidated balance sheet.
Lease Pass-Through. Under lease pass-through structures, we lease solar energy systems to fund investors under a master lease agreement, and these investors in turn sublease the solar energy systems to customers. Depending upon the structure, we receive some or all of the value attributable to the accelerated tax depreciation and other incentives. The fund investors receive the value attributable to the investment tax credits and, for the duration of the master lease term, the long-term recurring customer payments. After the lease term, we receive the customer payments, if any. We record the solar energy systems on our consolidated balance sheet as a component of solar energy systems, leased and to be leased—net. The fund investors typically make significant upfront cash payments that we record on our consolidated balance sheet as lease pass-through financing obligations. We reduce these obligations by amounts received by the fund investors from U.S. Treasury Department grants, customer payments and the associated incentive rebates. We in turn recognize the incentive rebates and customer payments as revenue over the customer lease term and amortize U.S. Treasury Department grants as a reduction to depreciation of the associated solar energy systems over the estimated life of these systems.
44
Table of Contents
Sale-Leaseback. Under sale-leaseback structures, we generate cash through the sale of solar energy systems to our fund investors, and we then lease these systems back from the investors and sublease them to our customers. For the duration of the lease term, we may, for some of the structures, receive the value attributable to the incentives and the long-term recurring customer payments, and we make leaseback payments to the fund investors. The fund investors receive the customer payments after the lease term. They also receive the value attributable to the investment tax credits, accelerated depreciation and other incentives. At the end of the lease term, we have an option to purchase the solar energy systems from the fund investors. Typically, our customers make monthly lease payments that we recognize as revenue over the term of the subleases on a straight-line basis. Depending on the design, size and construction of the individual systems and the leaseback terms, we may recognize a portion of the revenue from the sale of the systems or we may treat the cash received from the sale as financing received from the fund investors and reflect the cash received as a sale-leaseback financing obligation on our consolidated balance sheet.
Key Operating Metrics
We regularly review a number of metrics, including the following key operating metrics, to evaluate our business, measure our performance, identify trends affecting our business, formulate financial projections and make strategic decisions.
Customers
We track the number of residential, commercial and government buildings where we have installed or contracted to install a solar energy system, or performed or contracted to perform an energy efficiency evaluation or other energy efficiency services. We have previously referred to the foregoing as “buildings” and have chosen to redefine these as “customers,” as we believe this is a more appropriate descriptor. We believe that the relationship we establish with building owners, together with energy-related information we obtain about the building, position us to provide the owner with additional energy-related solutions to further lower their energy costs. Our total number of customers increased 158% to 50,532 as of December 31, 2012 from 19,582 as of December 31, 2011, which in turn represented an 82% increase from 10,779 as of December 31, 2010.
Energy Contracts
We define an energy contract as a residential, commercial or government lease or power purchase agreement pursuant to which consumers use or will use energy generated by a solar energy system that we have installed or contracted to install. We previously referred to the foregoing as “solar energy system customers” who entered into leases or power purchase agreements and have chosen to redefine as we believe “energy contracts” is a more appropriate descriptor. For landlord-tenant structures, such as the Davis-Monthan Air Force Base, in which we contract with the landlord or development company, we maintain a direct relationship with the individual tenants and include each residence as an individual contract. For commercial customers with multiple locations, each location is deemed a contract if we maintain a separate contract for that location. For example, we view each Walmart store to be an individual contract as we maintain a contractual relationship for the individual store and have a direct relationship with the store manager. We track the number of energy contracts as of the end of a given period as an indicator of our historical growth and as an indicator of our rate of growth from period to period.
The following table sets forth our cumulative energy contracts as of the dates presented:
| As of December 31, | ||||||
| 2012 | 2011 | 2010 | ||||
| Cumulative energy contracts |
40,456 | 14,129 | 6,997 | |||
45
Table of Contents
Megawatts Deployed and Cumulative Megawatts Deployed
We track the electricity-generating production capacity of our solar energy systems as measured in megawatts. Because the size of solar energy systems varies greatly, we believe that tracking the aggregate megawatt production capacity of the systems is an indicator of the growth rate of our solar energy systems business. We track megawatts deployed in a given period as an indicator of asset growth in the period. We track cumulative megawatts deployed as of the end of a given period as an indicator of our historical growth and our future opportunity to provide customers with additional energy-related solutions to further lower their energy costs.
Megawatts deployed represents the aggregate megawatt production capacity of solar energy systems that have had all required inspections completed during the applicable period. Cumulative megawatts deployed represents the aggregate megawatt production capacity of operating solar energy systems subject to leases and power purchase agreements and solar energy systems we have sold to customers. Until we have begun the design process, the customer may terminate these contracts with little or no penalty.
The following sets forth the megawatt production capacity of solar energy systems we have deployed during the period presented and the cumulative megawatts deployed as of the end of each period presented:
| Year Ended December 31, | ||||||||||||
| 2012 | 2011 | 2010 | ||||||||||
| Megawatts deployed |
157 | 72 | 31 | |||||||||
| Cumulative megawatts deployed |
287 | 129 | 58 | |||||||||
Transactions for Other Energy Products and Services
We use the number of transactions for energy products and services other than the installation of solar energy systems as a key operating metric to evaluate our ability to generate incremental sales from our installed customer base and to expand our business to new customers. Our solar energy systems serve as a gateway for us to perform energy efficiency evaluations and energy efficiency upgrades for our residential customers. We also offer our energy efficiency products and services on a stand-alone basis. Our strategy is to expand our energy efficiency business to our commercial customers and to continue to invest in and develop complementary energy products and services.
Transactions for other energy products and services includes all transactions during the period when we perform or contract to perform a service or provide, install or contract to install a product. It excludes the outright sale or installation of a solar energy system under a lease or power purchase agreement and any related monitoring. For the years ended December 31, 2012, 2011 and 2010, we completed 15,425, 3,716 and 400 transactions for other energy products and services, respectively.
Nominal Contracted Payments
Our leases and power purchase agreements create long-term recurring customer payments. We use a portion of the value created by these contracts that we refer to as “nominal contracted payments,” together with the value attributable to investment tax credits, accelerated depreciation, Solar Renewable Energy Credits, performance-based incentives, state tax benefits and rebates, to cover the fixed and variable costs associated with installing solar energy systems.
We track the nominal contracted payments of our leases and power purchase agreements entered into as of specified dates. Nominal contracted payments equal the sum of the cash payments that the customer is obligated to pay over the term of the agreement. When calculating nominal contracted payments, we only include those leases and power purchase agreements that are signed. For a lease, we include the monthly fee and upfront fee as set forth in the lease. As an example, the nominal contracted payments for a 20-year lease with monthly payments of $200 and an upfront payment of $5,000 is $53,000. For a power purchase agreement, we multiply
46
Table of Contents
the contract price per kWh by the estimated annual energy output of the associated solar energy system to determine the nominal contracted payment. The nominal contracted payments of a particular lease or power purchase agreement decline as the payments are received by us or a fund investor. Aggregate nominal contracted payments include leases and power purchase agreements that we have contributed to financing funds. Currently, third-party investors in such financing funds have contractual rights to a portion of these nominal contracted payments.
Nominal contracted payments is a forward-looking number, and we use judgment in developing the assumptions used to calculate it. Those assumptions may not prove to be accurate over time. Underperformance of the solar energy systems, payment defaults by our customers, cancellation of signed contracts or other factors described under the heading “Risk Factors” could cause our actual results to differ materially from our calculation of nominal contracted payments.
The following table sets forth, with respect to our leases and power purchase agreements, the aggregate nominal contracted payments remaining as of the end of each period presented as of the dates presented:
| As of December 31, | ||||||||||||
| 2012 | 2011 | 2010 | ||||||||||
| (in thousands) | ||||||||||||
| Aggregate nominal contracted payments |
$ | 1,091,199 | $ | 485,780 | $ | 273,166 | ||||||
In addition to the nominal contracted payments, our long-term leases and power purchase agreements provide us with a significant post-contract renewal opportunity. Because our solar energy systems have an estimated life of 30 years, they will continue to have a useful life after the 20-year term of the lease or power purchase agreement. At the end of the original contract term, we intend to offer our customers renewal contracts. The solar energy systems will be already installed on the customer’s building, which facilitates customer acceptance of our renewal offer and results in limited additional costs to us.
Backlog
We define backlog as the aggregate megawatt capacity of solar energy systems not yet deployed as of the date specified pursuant to energy contracts and contracts for solar energy system direct sales executed as of such date. Backlog includes contracts that our customers may seek to cancel, contracts that we may choose to deactivate due to customer inactivity and contracts that are subject to contingencies outside of our control or our customers’ control. As a result, backlog is not necessarily an accurate indicator of our future business activity or financial results and is just one factor among many that we track in managing the growth of our business. As of February 28, 2013, our backlog was 194 MW.
Components of Results of Operations
Revenue
Operating leases. We classify and account for our leases and power purchase agreements as operating leases. We consider the proceeds from solar energy system rebate incentives offered by certain state and local governments to form part of the proceeds from our operating leases. We recognize revenue from our operating leases over the operating lease term either on a straight-line basis over the lease term for lease arrangements or as we generate and sell energy to customers under power purchase agreements. We typically bundle and charge for remote monitoring services as part of the lease or power purchase agreement and recognize the allocated amount as revenue over the term of the monitoring service. The term of our leases and power purchase agreements ranges between 10 and 20 years.
47
Table of Contents
Solar energy systems sales. Solar energy systems sales is comprised of revenue from the sale of solar energy systems directly to cash paying customers, revenue generated from long-term solar energy system sales contracts and revenue attributable to our energy efficiency products and services. We generally recognize revenue from solar energy systems sold to our customers when we install the solar energy system and it passes inspection by the utility or the authority having jurisdiction. We allocate a portion of the proceeds from the sale of the system to the remote monitoring service and recognize the allocated amount as revenue over the monitoring service term. We recognize revenue generated from long-term solar energy system sales contracts on a percentage-of-completion basis, based on the ratio of labor costs incurred to date to total project labor costs. We recognize revenue from our energy efficiency services when we complete the services.
During the years ended December 31, 2012 and 2011, less than 10% of our solar energy system installations were cash sales, measured by system capacities. However, because of our revenue recognition policy, these sales represented 63% and 61%, respectively, of our total revenue for those periods. We expect installations utilizing leases and power purchase agreements to continue to represent the vast majority of our installed systems. As a result, the number of systems sold for cash and delivered in a given financial reporting period will have a disproportionate effect on the total revenue reported for that period.
Cost of Revenue, Gross Profit and Gross Profit Margin
Operating Leases Cost of Revenue. Operating leases cost of revenue is primarily comprised of the depreciation of the cost of the solar energy systems and the amortization of initial direct costs. The depreciation of the cost of the solar energy systems is reduced by the amortization of any U.S. Treasury Department grant payment in lieu of the energy investment tax credit associated with these systems. Initial direct costs include allocated contract administration costs, sales commissions and customer acquisition referral fees. Contract administration costs include personnel costs, such as salary, bonus, employee benefit costs and stock-based compensation costs. Operating leases cost of revenue also includes direct and allocated costs associated with monitoring services for these systems.
Solar Energy Systems Cost of Revenue. The substantial majority of solar energy systems cost of revenue consists of the costs of solar energy systems component acquisition and personnel costs associated with system installations. We acquire the significant component parts of the solar energy systems directly from foreign and domestic manufacturers or distributors. Our employees install our residential solar energy systems and our project managers and construction managers oversee the subcontractors that install commercial systems. To a lesser extent, solar energy systems cost of revenue also includes personnel costs associated with performing our energy efficiency services and related materials. Solar energy systems cost of revenue also includes engineering and design costs, estimated warranty costs, freight charges, allocated corporate overhead costs such as facilities costs, vehicle depreciation costs and personnel costs associated with supply chain, logistics, operations management, safety and quality control. Personnel costs include salary, bonus, employee benefit costs and stock-based compensation costs.
We allocate to solar energy systems cost of revenue certain corporate overhead costs that include rental and operating costs for our corporate facilities, information technology costs, travel expenses and certain professional services to cost of solar energy systems, work in process, cost of sales, sales and marketing and general and administrative expenses using the relative proportions of direct payroll costs in each of these functions.
Sales and Marketing Expenses
Sales and marketing expenses include personnel costs such as salaries, benefits, bonuses, sales commissions and stock-based compensation as well as advertising, promotional and other marketing related expenses. Sales and marketing expenses also include certain customer referral fees, allocated corporate overhead costs related to facilities and information technology, travel and professional services. We expect sales and marketing costs to increase significantly in absolute dollars in future periods as we continue to grow our sales headcount and expand our marketing efforts to continue to grow our business.
48
Table of Contents
General and Administrative Expenses
General and administrative expenses include personnel costs such as salaries, bonuses and stock-based compensation and professional fees related to legal, human resources, accounting and structured finance services. General and administrative expenses also include allocated corporate overhead costs related to facilities and information technology, travel and professional services. We anticipate that we will incur additional administrative headcount costs to support the growth in our business, our financing fund arrangements and the additional costs of being a public reporting company.
Other Income and Expenses
Our other income and expenses consist principally of the change in fair value of warrants issued to certain fund investors to acquire our convertible redeemable preferred stock, which were converted into warrants to acquire shares of our common stock upon the closing of our initial public offering.
We account for changes in the fair value of warrants issued to acquire convertible redeemable preferred stock through other income or expenses. The warrants have been classified as liability instruments on the consolidated balance sheet. We record any changes in the fair value of these instruments between reporting dates as a component of other income or expense in the consolidated statement of operations.
Interest Income and Expense
Interest income and expense primarily consist of the interest charges associated with our secured credit revolver agreements, long-term debt facilities, financing obligations and capital lease obligations. Our credit revolver and certain of our long-term debt facilities are subject to variable interest rates. The interest charge on our financing obligations is fixed at the inception of the related transaction based on the incremental borrowing rate in effect on such date or the effective interest rate in the arrangement giving rise to the obligation. The interest charge on capital lease obligations is fixed at the inception of the related transaction based on the incremental borrowing rate in effect on such date. Interest income and expense also include the amortization of deferred financing costs associated with such secured credit revolvers or long-term debt facilities, partially offset by a nominal amount of interest income generated from our cash holdings in interest-bearing accounts.
Provision for Income Taxes
We are subject to taxation in the United States and Canada. We conduct our business primarily in the United States.
Our effective tax rates differ from the statutory rate primarily due to the valuation allowance on our deferred taxes, state taxes, foreign taxes, joint venture transactions and nondeductible compensation. Our tax expense is primarily composed of the amortization of prepaid tax expense as a result of sales of assets to joint ventures included in our consolidated financial statements.
As of December 31, 2012 and 2011, we had deferred tax assets of approximately $175.7 million and $102.7 million, respectively, and deferred tax liabilities of approximately $124.6 million and $53.0 million, respectively. During these periods, we maintained a net deferred tax asset and booked a valuation allowance against the net deferred tax assets.
Net Income (Loss) Attributable to Stockholders
We determine the net income (loss) attributable to stockholders by deducting from net income (loss) in a period the net income (loss) attributable to noncontrolling interests. The net income (loss) attributable to noncontrolling interests represents the joint venture fund investors’ allocable share in the results of the joint venture financing funds. We have determined that the provisions in the contractual arrangements represent substantive profit sharing arrangements. We have further determined that the appropriate methodology for
49
Table of Contents
calculating the noncontrolling interests balances that reflects the substantive profit sharing arrangements is a balance sheet approach using the hypothetical liquidation at book value method, or HLBV method. We therefore use the HLBV method to determine the allocable share of the results of the joint ventures attributable to the fund investors, which we record in the consolidated balance sheets as noncontrolling interests in subsidiaries. The HLBV method determines the fund investors’ allocable share of results of the joint venture by calculating the net change in the investors’ share in the consolidated net assets of the joint venture at the beginning and at the end of a period after adjusting for any transactions with the fund investor such as capital contributions or cash distributions.
Critical Accounting Policies and Estimates
Our discussion and analysis of our financial condition and results of operations are based upon our consolidated financial statements, which have been prepared in accordance with GAAP. GAAP require us to make estimates and judgments that affect the reported amounts of assets, liabilities, revenue and expenses, cash flow and related disclosure of contingent assets and liabilities. We base our estimates on historical experience and on various other assumptions that we believe to be reasonable under the circumstances. Actual results may differ from these estimates. Our future consolidated financial statements will be affected to the extent that our actual results materially differ from these estimates.
We believe that the assumptions and estimates associated with our principles of consolidation, revenue recognition, solar energy systems, leased and to be leased, warranties, deferred U.S. Treasury Department grant proceeds, stock-based compensation, inventory reserves for excess and obsolescence, income taxes and noncontrolling interests have the greatest potential impact on our consolidated financial statements. Therefore, we consider these to be our critical accounting policies and estimates. For further information on all of our significant policies, see Note 2 to our consolidated financial statements included elsewhere in this annual report on Form 10-K.
We are an emerging growth company within the meaning of the rules under the Securities Act, and we utilize certain exemptions from various reporting requirements that are applicable to public companies that are not emerging growth companies. For example, we do not have to provide an auditor’s attestation report on our internal controls in this annual report on Form 10-K as otherwise required by Section 404(b) of the Sarbanes-Oxley Act. In addition, Section 107 of the JOBS Act provides that an emerging growth company can utilize the extended transition period provided in Section 7(a)(2)(B) of the Securities Act for complying with new or revised accounting standards. Thus, an emerging growth company can delay the adoption of certain accounting standards until those standards would otherwise apply to private companies. We have elected to utilize this extended transition period. Our financial statements may therefore not be comparable to those of companies that comply with such new or revised accounting standards as they become applicable to public companies.
Principles of Consolidation
Our consolidated financial statements reflect our accounts and operations and those of our subsidiaries in which we have a controlling financial interest. In accordance with the provisions of Financial Accounting Standards Board, or FASB, Accounting Standards Codification, or ASC, 810, Consolidation, we consolidate any variable interest entity, or VIE, of which we are the primary beneficiary. The typical condition for a controlling financial interest ownership is holding a majority of the voting interests of an entity. However, a controlling financial interest may also exist in entities, such as VIEs, through arrangements that do not involve controlling voting interests. ASC 810 requires a variable interest holder to consolidate a VIE if (1) that party has the power to direct the activities of a VIE that most significantly impact the VIE’s economic performance and (2) the obligation to absorb losses of the VIE that could potentially be significant to the VIE or the right to receive benefits from the VIE that could potentially be significant to the VIE. This holder is considered the primary beneficiary. We do not consolidate a VIE in which we have a majority ownership interest if we are not considered the primary beneficiary. We have determined that we are the primary beneficiary in all of our VIEs
50
Table of Contents
and accordingly consolidate the assets and liabilities of such VIEs in our consolidated financial statements. We evaluate our relationships with our VIEs on an ongoing basis to determine whether we continue to be the primary beneficiary. All intercompany transactions and balances have been eliminated in consolidation.
Revenue Recognition
Our customers have the option to either purchase and own solar energy systems, to access solar energy systems through contractual arrangements that we account for as operating leases, or to purchase energy through power purchase agreements. We also offer ongoing monitoring services of the solar energy systems. In certain cases, we have entered into sale-leaseback arrangements with our fund investors. In a sale-leaseback arrangement, fund investors finance solar energy systems while enabling us to sublease the systems to our customers.
We also offer energy efficiency products and services aimed at improving residential energy efficiency and lowering overall residential energy costs.
In accordance with ASC 605-25, Revenue Recognition—Multiple-Element Arrangements, and ASC 605-10-S99, Revenue Recognition—Overall—SEC Materials, we recognize revenue when (i) persuasive evidence of an arrangement exists, (ii) delivery has occurred or services have been rendered, (iii) the sales price is fixed or determinable, and (iv) collection of the related receivable is reasonably assured. In instances where we have multiple deliverables in a single arrangement, we allocate the arrangement consideration to the various elements in the arrangement. ASC 605-25 requires the allocation of the arrangement consideration to each element to be based on the relative selling price method. ASC 605-25 also provides a hierarchy of selling price determination, starting with vendor-specific objective evidence, or VSOE, of selling price, if available; third-party evidence, or TPE, if available and if VSOE is not available; or the best estimate of selling price, or BESP, if neither VSOE nor TPE is available.
Solar Energy Systems Sales
For solar energy systems sold to customers, we recognize revenue, net of any applicable governmental sales taxes, when we install the solar energy system and it passes inspection by the utility or the authority having jurisdiction, provided all other revenue recognition criteria are met. Costs incurred on installations before the systems are completed are included in inventories as work in progress in the consolidated balance sheet. Solar energy systems sold to residential and small scale commercial customers typically take three to five months to install. Revenue attributable to the remote monitoring service is recognized over the period of the associated contract, which is generally 5 to 15 years.
We recognize revenue for solar energy systems constructed for large scale commercial customers according to ASC 605-35, Revenue Recognition, Construction-Type and Production Type Contracts. Revenue is recognized on a percentage-of-completion basis, based on the ratio of labor costs incurred to date to total projected labor costs, provided all other revenue recognition criteria are met. Solar energy systems sold to large-scale commercial customers may take up to six months to install.
Energy Efficiency Products and Services
We recognize revenue attributable to energy efficiency products and services when we complete the services, provided all other revenue recognition criteria are met. Typically, energy efficiency services take one to two months to complete. Energy efficiency products and services are sold on a stand-alone basis or bundled with the sale of solar energy systems or lease or power purchase agreements. When we bundle the sale of energy efficiency products and services with the sale of solar energy systems or lease or power purchase agreements, we allocate revenue to the energy efficiency products and services and the sale, lease or power purchase agreements using the relative selling price method provided by ASU 2009-13. The selling price of the energy efficiency
51
Table of Contents
products and services used in the allocation is determined by reference to the prices we charge for the products and services on a stand-alone basis. To date, the revenue generated from energy efficiency products and services has not been material and has been included as a component of solar energy systems sales revenue in the consolidated financial statements.
Operating Leases and Power Purchase Agreements
For solar energy systems under operating leases, we account for the leases in accordance with ASC 840, Leases, under which we are the lessor. We record operating lease revenue from minimum lease payments, including upfront rebates and incentives earned from such systems, on a straight-line basis over the life of the lease term, provided all other revenue recognition criteria are met. For incentives that are earned based on the amount of electricity the system generates, we record revenue as amounts are earned. The difference between the payments received and the revenue recognized is recorded as deferred revenue on the consolidated balance sheet. Initial direct costs from the origination of solar energy systems leased to customers are capitalized as an element of solar energy systems, leased and to be leased – net and amortized over the term of the related lease.
For solar energy systems where customers purchase electricity from us under power purchase agreements, we have determined that our power purchase agreements should be accounted for, in substance, as operating leases, pursuant to ASC 840. Revenue is recognized based upon the amount of electricity delivered as determined by remote monitoring equipment at rates specified under the contracts, assuming the other revenue recognition criteria are met. Initial direct costs from the origination of solar energy systems under power purchae agreements are capitalized as an element of solar energy systems, leased and to be leased – net and amortized over the term of the related power purchase agreement.
Sale-Leaseback
We are a party to sale-leaseback arrangements that provide for the sale of solar energy systems to the fund investor and simultaneous leaseback to us of the systems that we then sublease to our customers. In sale-leaseback arrangements, we first determine whether the solar energy system under the sale-leaseback arrangement is “integral equipment.” We determine a solar energy system to be integral equipment when the cost to remove the system from its existing location exceeds ten percent of the fair value of the solar energy system at the time of its original installation. The cost to remove a system from its existing location includes the cost of shipping and reinstallation of the system at a new site, as well as any diminution in fair value. When the leaseback arrangements expire, we have the option to purchase the solar energy system, and in most cases, the lessor has the option to sell the system back to us, though in some instances the lessor can only sell the system back to us prior to expiration of the arrangement.
For solar energy systems that we have determined to be integral equipment, we have concluded that these rights create a continuing involvement. Therefore, we use the financing method to account for the sale-leaseback of such solar energy systems. Under the financing method, we do not recognize as revenue any of the sale proceeds received from the lessor that contractually constitutes a payment to acquire the solar energy system. Instead, we treat any such sale proceeds received as financing capital to install and deliver the solar energy system and accordingly record the proceeds as a financing obligation in our consolidated balance sheet. We allocate the leaseback payments that we make to the lessor between interest expense and a reduction to the financing obligation. Interest on the financing obligation is calculated using our incremental borrowing rate at the inception of the arrangement on the outstanding financing obligation. We determine our incremental borrowing rate by reference to the interest rates that we would obtain in the financial markets to borrow amounts equal to the financing obligation over a term similar to the master lease term.
For solar energy systems that are not integral equipment, we determine if the leaseback is classified as a capital lease or an operating lease. For leasebacks classified as capital leases, we initially record a capital lease asset and capital lease obligation in our consolidated balance sheet equal to the lower of the present value of our future minimum leaseback payments or the fair value of the solar energy system. For capital leasebacks, we do
52
Table of Contents
not recognize any of the revenue but defer the gross profit comprising the net of revenue and cost of sale of the associated solar energy system. For leasebacks classified as operating leases, we recognize a portion of the revenue and the associated cost of sale, and defer the portion of revenue and cost of sale that represents the gross profit that is equal to the present value of the future minimum lease payments over the master leaseback term. For both capital and operating leasebacks, we record the deferred gross profit in our consolidated balance sheet as deferred income and amortize the deferred income over the master lease term as a reduction to the cost of operating lease revenue in our consolidated statement of operations.
Solar Energy Systems, Leased and To Be Leased
We are the operating lessor of the solar energy systems under leases that qualify as operating leases. We account for the leases in accordance with ASC 840, Leases. To determine lease classification, we evaluate the lease terms to determine whether there is a transfer of ownership or bargain purchase option at the end of the lease, whether the lease term is greater than 75% of the economic life of the solar energy system, or whether the present value of minimum lease payments exceed 90% of the fair value at lease inception. We utilize periodic appraisals to estimate useful life and fair values at lease inception, and residual values at lease termination. Solar energy systems are stated at cost, less accumulated depreciation and amortization.
Depreciation and amortization is calculated using the straight-line method over the estimated useful lives of the respective assets as follows:
| Useful Lives | ||
| Solar energy systems leased to customers |
30 years | |
| Initial direct costs related to solar energy systems leased to customers |
Lease term (10 to 20 years) |
Solar energy systems held for lease to customers are constructed systems pending interconnection with the respective utility and are depreciated as solar energy systems leased to customers when the respective systems have been interconnected and placed in service.
Presentation of cash flows associated with solar energy systems
We disclose cash flows associated with solar energy systems in accordance with ASC 230, Statement of Cash Flows (ASC 230). We determine the appropriate classification of cash payments related to solar energy systems depending on the activity that is likely to be the predominant source of cash flows for the item being paid for. Accordingly we present payments made in a period for costs incurred to install solar energy systems that will be leased to customers, including the payments for cost of the inventory that is utilized in such systems, as investing activities in the statement of cash flows. Payments made for inventory that is utilized for solar energy systems that will be sold to customers are presented as cash flows from operations in the statement of cash flows. We do not track payments for component parts at the individual component part level as they are not unique and can be used in either leased solar energy systems or solar energy systems that are sold to customers. Accordingly, we treat costs of raw material transferred to systems to be leased as if they were paid in the period they are transferred to the systems. During the years ended December 31, 2012, 2011 and 2010, we paid $588.4 million, $337.8 million and $192.4 million, respectively, for solar energy systems. Of these amounts, $440.7 million, $292.9 million and $156.5 million, have been disclosed as cash payments for leased systems and disclosed as investing activities in the years ended December 31, 2012, 2011 and 2010, respectively.
53
Table of Contents
Warranties
We warrant our products for various periods against defects in material or installation workmanship. We generally provide warranties of between 10 to 20 years on the generating and nongenerating parts of the solar energy systems that we sell. The manufacturers’ warranty on the components of the solar energy systems, which we typically pass through to our customers, has a warranty period ranging from 5 to 25 years depending upon the solar energy system component under warranty and the manufacturer. For the years ended December 31, 2012 and 2011, the changes in accrued warranty balance, recorded as a component of accrued liabilities on our consolidated balance sheets consisted of the following:
| Year Ended December 31, | ||||||||
| 2012 | 2011 | |||||||
| (in thousands) | ||||||||
| Balance—beginning of the period |
$ | 2,462 | $ | 1,704 | ||||
| Provision charged to warranty expense |
1,773 | 531 | ||||||
| Assumed obligations arising from business acquisitions |
— | 349 | ||||||
| Less warranty claims |
(216 | ) | (122 | ) | ||||
|
|
|
|
|
|||||
| Balance—end of the period |
$ | 4,019 | $ | 2,462 | ||||
|
|
|
|
|
|||||
Solar Energy Performance Guarantees
We guarantee that our leased solar energy systems will generate a minimum level of solar energy output. We monitor the systems to determine whether the solar energy systems are achieving these specified minimum outputs. If we determine that the guaranteed minimum energy output is not achieved, we record a liability for the estimated amounts payable. As of December 31, 2012 and 2011, we recorded liabilities of $0.6 million and $0, respectively, under accrued and other liabilities in the consolidated financial statements relating to these guarantees based on our assessment of the exposure.
Deferred U.S. Treasury Department Grant Proceeds
We have determined that certain of our solar energy systems constitute eligible property as defined under Section 1603 of the American Recovery and Reinvestment Act of 2009, as amended by the Tax Relief Unemployment Insurance Reauthorization and Job Creation Act of December 2010. We submit applications for grants receivable from the U.S. Treasury Department related to eligible property based on 30% of the tax basis of the solar energy systems as supported by independently appraised fair market values of the systems or guideline system values that have been posted by the U.S. Treasury Department on its website. To determine the fair market value of the systems, an independent appraiser considers various factors such as the cost of producing the systems, the estimated price that could be obtained in the market from the sale of the systems, and the present value of the economic benefits expected to be generated by the systems. We then present our appraised fair market value to the U.S. Treasury Department when we apply for grants on our solar energy systems. In a number of cases, the U.S. Treasury Department has determined that grants should be paid based on a lower value for the systems and has in such instances posted guideline system values on its website that should be used in the grant applications.
We initially record the grants receivable for leased solar energy systems as deferred income at the amounts that have been approved for payment by the U.S. Treasury Department and then amortize them on a straight-line basis over the estimated useful lives of the related solar energy systems. We record the amortization of the deferred income as a credit to depreciation expense in the consolidated statement of operations. We record a catch up adjustment in the period in which the grant is approved to recognize the portion of the grant that matches proportionally the amortization for the period between the date of placement in service of the solar energy systems and approval by the U.S. Treasury Department or receipt by the investor of the associated grant,
54
Table of Contents
in the case of lease pass-through financing funds. The catch up adjustments we have recorded to date have been immaterial. Some of our financing fund agreements obligate us to reimburse the fund investors based upon the difference between their anticipated benefit from U.S. Treasury grants at the formation of the funds and the benefit they receive from the amounts paid by the U.S. Treasury Department. For the joint venture financing funds where we are contractually obligated to reimburse investors for reductions in anticipated grants receivable, we record amounts we expect to pay the investors as distributions payable to noncontrolling interests in the consolidated balance sheet, and any impact to the consolidated statement of operations, which is determined using the HLBV method, is reflected in the net income or loss attributable to noncontrolling interests line item. For sale-leaseback financing funds where we are contractually obligated to reimburse investors for reductions in anticipated grants receivable, we record amounts we expect to pay the investors under accrued and other current liabilities and reduce the deferred gain on sale-leaseback transactions included within other liabilities in the consolidated balance sheet, with no impact to the consolidated statement of operations. For lease pass-through financing funds, all amounts received from the investors are recorded in the consolidated balance sheet as a lease pass-through financing obligation and the amounts we expect to reimburse investors for reductions in anticipated grants receivable would reduce the lease pass-through obligation with no impact on the consolidated statement of operations.
In the fourth quarter of 2011, we had discussions with representatives of the U.S. Treasury Department relating to U.S. Treasury grant applications for certain commercial solar energy systems submitted in the third and fourth quarters of 2011 and the appropriate U.S. Treasury grant valuation guidelines for such systems. We were unsuccessful in our attempts to have the U.S. Treasury Department reconsider its valuation for these systems, and while we maintained the accuracy of the contracted value to the financing fund, we elected at that time to receive the lower amounts communicated by the U.S. Treasury Department. As a result, the U.S. Treasury Department awarded grants in amounts lower than the appraised fair market values for these systems. In addition, on December 5, 2012, the U.S. Treasury Department notified us that it has established new guidelines for residential solar energy systems placed in service in California and Arizona on or after October 1, 2012. The new guidelines communicated are $6.00 per watt in California and $5.00 per watt in Arizona. Prior to this change, we had been reimbursed at $6.87 per watt in California and $6.20 per watt in Arizona. As a result of this updated guidance, we will be obligated to contribute additional solar energy systems to one financing fund so that the fund investors will recover a shortfall of approximately $0.2 million. Additionally, we are obligated to repay approximately $8.2 million to investors in funds affected by the updated guidance, based on capital contributions by the investor to these funds. We have appropriately reflected the financial impact of the anticipated reduction in our consolidated financial statements as of December 31, 2012.
We received no grants prior to 2010. The changes in deferred U.S. Treasury Department grant proceeds for the years ended December 31, 2010 and 2011 and 2012 were as follows:
| (in thousands) | ||||
| U.S. Treasury grant receipts during the year ended December 31, 2010 |
$ | 20,084 | ||
| Amortization during the year ended December 31, 2010 |
(744 | ) | ||
|
|
|
|||
| Balance as of December 31, 2010 |
19,340 | |||
| U.S. Treasury grant receipts and receivable during the year ended December 31, 2011 |
68,585 | |||
| U.S. Treasury grants receipts and receivable by investors under lease pass-through financing funds |
54,730 | |||
| Amortization during the year ended December 31, 2011 |
(5,221 | ) | ||
|
|
|
|||
| Balance as of December 31, 2011 |
137,434 | |||
| U.S. Treasury grant receipts and receivable during the nine months ended December 31, 2012 |
112,520 | |||
| U.S. Treasury grants receipts and receivable by investors under lease pass-through financing funds |
58,685 | |||
| Amortization during the year ended December 31, 2012 |
(10,379 | ) | ||
|
|
|
|||
| Balance as of December 31, 2012 |
$ | 298,260 | ||
|
|
|
|||
55
Table of Contents
Subsequent to December 31, 2012, the U.S. Department of Treasury announced that as a result of the sequestration of federal spending that took effect after the U.S. Congress was unable to agree on spending cuts required under the Budget Control Act of 2011, all Treasury grant awards made under Section 1603 of the American Recovery and Reinvestment Act of 2009 on or after March 1, 2013 through September 30, 2013 will be reduced by 8.7%, regardless of when the Treasury received the application. As a result, we expect to suffer grant shortfalls of approximately $2.4 million associated with our financing funds. We have concluded that the events giving rise to this shortfall have occurred after the balance sheet date and do not provide evidence about conditions that existed at the balance sheet date. Accordingly, we have not recognized the impact of these shortfalls in our consolidated financial statements as of December 31, 2012.
Stock-Based Compensation
We account for stock-based compensation costs under the provisions of ASC 718, Compensation—Stock Compensation, which requires the measurement and recognition of compensation expense related to the fair value of stock-based compensation awards that are ultimately expected to vest. Stock-based compensation expense recognized includes the compensation cost for all share-based payments granted to employees, including our executive officers and employee members of our board of directors, based on the grant date fair value estimated in accordance with the provisions of ASC 718. ASC 718 is also applied to awards modified, repurchased, or canceled during the periods reported.
We apply ASC 718 and FASB ASC Subtopic 505-50, Equity-Based Payments to Non Employees, to options and other stock-based awards issued to non-employees. In accordance with ASC 718 and ASC Subtopic 505-50, we use the Black-Scholes option-pricing model to measure the fair value of the options at the measurement date and each reporting period prior to that, as applicable.
Determining the fair value of stock-based awards at the grant date requires judgment. We use the Black-Scholes option-pricing model to determine the fair value of stock options. The determination of the grant date fair value of options using an option-pricing model is affected by our estimated common stock fair value as well as assumptions regarding a number of other complex and subjective variables. These variables include the fair value of our common stock, our expected stock price volatility over the expected term of the options, stock option exercise and cancellation behaviors, risk-free interest rates and expected dividends that are estimated as follows:
| • | Fair value of our common stock. Because our stock was not publicly traded when we issued stock options prior to our initial public offering, we estimated the common stock’s fair value as discussed below. Subsequent to our initial public offering, we determined the fair value of our common stock based on the trading price of the stock on the NASDAQ Global Market. |
| • | Expected term. The expected term represents the period that our stock-based awards are expected to be outstanding and was primarily determined using the simplified method in accordance with guidance provided by the SEC. The simplified method calculates the expected term as the average of the time-to-vesting and the contractual life of the awards. We will continue to utilize the simplified method for all standard awards until we have established a reasonable period of representative trading history as a public company, at which time we will determine the expected term based on the historical option exercise behavior of our employees, expectations about future option exercise behavior and post-vesting cancellations. |
| • | Volatility. Because there was no trading history for our common stock prior to our initial public offering and very limited history between that date and December 31, 2012, the expected stock price volatility for our common stock was estimated by taking the average historic price volatility for industry peers based on daily price observations over a period equivalent to the expected term of the stock option grants. Industry peers consist of several public companies in the solar energy industry similar in size, stage of life cycle and financial leverage. We did not rely on implied |
56
Table of Contents
| volatilities of traded options in our industry peers’ common stock because the volume of activity was relatively low. We intend to continue to consistently apply this process using the same or similar public companies until a sufficient amount of historical information regarding the volatility of our own common stock share price becomes available, or unless circumstances change such that the identified companies are no longer similar to us. If this occurs, more suitable companies whose share prices are publicly available would be utilized in the calculation. Higher volatility and longer expected lives would result in an increase to stock-based compensation expense determined on the grant date. |
| • | Risk-free rate. The risk-free interest rate is based on the yields of U.S. Treasury Department securities with maturities similar to the expected term of the options for each option group. |
| • | Dividend yield. We have never declared or paid any cash dividends and do not presently plan to pay cash dividends in the foreseeable future. Consequently, we used an expected dividend yield of zero. |
In addition to assumptions used in the Black-Scholes option-pricing model, we must also estimate a forfeiture rate to calculate the stock-based compensation for our awards. Our forfeiture rate is based on an analysis of our actual forfeitures since the adoption of our option plan. We routinely evaluate the appropriateness of the forfeiture rate based on actual forfeiture experience, analysis of employee turnover and expectations of future option exercise behavior. Quarterly changes in the estimated forfeiture rate can have a significant impact on our stock-based compensation expense as the cumulative effect of adjusting the forfeiture rate is recognized in the period the forfeiture estimate is changed. If a revised forfeiture rate is higher than the previously estimated forfeiture rate, an adjustment is made that will result in a decrease to the stock-based compensation expense recognized in the consolidated financial statements. If a revised forfeiture rate is lower than the previously estimated forfeiture rate, an adjustment is made that will result in an increase to the stock-based compensation expense recognized in the consolidated financial statements.
We will continue to use judgment in evaluating the expected term, expected volatility and forfeiture rate related to our stock-based compensation on a prospective basis. As we continue to accumulate additional data related to our common stock, we may have refinements to the estimates of our expected volatility, expected terms and forfeiture rates, which could materially impact our future stock-based compensation expense as it relates to the future grants of our stock-based awards.
The following table presents the weighted-average assumptions used to estimate the fair value of options granted during the periods presented:
| Year Ended December 31, | ||||||||||||
| 2012 | 2011 | 2010 | ||||||||||
| Expected term (in years) |
6.19 | 6.09 | 5.98 | |||||||||
| Volatility |
89.52 | % | 87.26 | % | 88.49 | % | ||||||
| Risk-free interest rate |
1.07 | % | 1.95 | % | 2.50 | % | ||||||
| Dividend yield |
— | — | — | |||||||||
Stock-based compensation totaled $10.7 million, $5.1 million and $1.8 million, respectively, in 2012, 2011, and 2010. As of December 31, 2012 and 2011, we had $30.0 million and $24.7 million, respectively, of unrecognized stock-based compensation expense, which will be recognized over the weighted average remaining vesting period of 2.62 years and 3.01 years, respectively.
Nonemployee Stock-Based Compensation
We account for stock options issued to nonemployees based on the estimated fair value of the awards using the Black-Scholes option pricing model. The measurement of stock-based compensation is subject to quarterly adjustments as the underlying equity instruments vest and the resulting change in fair value is recognized in our consolidated statement of operations during the period the related services are rendered.
57
Table of Contents
Inventory Reserves
Inventories include solar energy system components, including photovoltaic panels, inverters, mounting hardware and miscellaneous electrical components, and work-in-process, including solar energy system components that are partially installed and direct and indirect capitalized installation costs. Historically, we have purchased materials and appliances used in our energy efficiency business as they are needed. Accordingly, inventories related to energy efficiency products and services have not been material. Raw materials and work-in-process are stated at the lower of cost or market on a first in – first out basis.
We evaluate our inventory reserves on a quarterly basis and write down the value of inventories for estimated excess and obsolete inventories based upon assumptions about future demand and market conditions.
Provision for Income Taxes
We use the asset and liability method in accounting for income taxes. Under this method, deferred income tax assets and liabilities are determined on the difference between financial reporting and tax basis of assets and liabilities and are measured using the enacted tax rates and laws that will be in effect when the differences are expected to reverse.
The calculation of our tax assets and liabilities involves uncertainties in the application of complex tax regulations. We recognize liabilities for uncertain tax positions based on the two-step process prescribed by applicable accounting principles. The first step is to evaluate the tax position for recognition by determining if the weight of available evidence indicates that it is more likely than not that the position will be sustained on audit, including resolution of any related appeals or litigation processes. The second step requires us to estimate and measure the tax benefit as the largest amount that is more likely than not of being realized upon ultimate settlement. It is inherently difficult and subjective to estimate such amounts, as this requires us to determine the probability of various possible outcomes. We reevaluate these uncertain tax positions on a quarterly basis. This evaluation is based on factors including changes in facts or circumstances, changes in tax law, effectively settled issues under audit, and new audit activity. Such a change in recognition or measurement could result in the recognition of a tax benefit or an additional charge to the tax provision in the relevant period.
As of December 31, 2012 and 2011, we had no material uncertain tax positions.
As of December 31, 2012 and 2011, we had deferred tax assets of approximately $175.7 million and $102.7 million, respectively, and deferred tax liabilities of approximately $124.6 million and $53.0 million, respectively. During these periods the company maintained a net deferred tax asset and booked a valuation allowance against the net deferred tax assets.
Deferred tax assets primarily relate to net operating loss carryforwards, accelerated gains for tax purposes and deferred revenue. As of December 31, 2012 and 2011, we had federal net operating loss carryforwards of approximately $205.1 million and $97.0 million, respectively. In addition, we had net operating losses for California income tax purposes of approximately $56.2 million and $37.0 million, as of December 31, 2012 and 2011, respectively, which expire at various dates beginning in 2020 if not utilized. We also had net operating losses for other state income tax purposes of approximately $14.5 million and $2.7 million as of December 31, 2012 and 2011, respectively, which expire at various dates beginning in 2015 if not utilized.
Our valuation allowance increased by approximately $1.5 million for the year ended December 31, 2012 and by approximately $10.5 million for the year ended December 31, 2011. The valuation allowance is determined in accordance with the provisions of ASC 740, Income Taxes, which requires an assessment of both negative and positive evidence when measuring the need for a valuation allowance. As of December 31, 2012 and 2011, based on our history of losses, we continued to provide a valuation allowance against our deferred tax assets, net of the expected income from the reversal of the deferred tax liabilities.
58
Table of Contents
We make estimates and judgments about our future taxable income that are based on assumptions that are consistent with our plans and estimates. The amount of our valuation allowance could be materially affected should the actual amounts differ from our estimates. Any adjustment to the deferred tax asset valuation allowance would be recorded in the statement of operations in the periods when the adjustment is determined to be required.
We apply any limitations as a result of the Internal Revenue Code, or the Code, Section 382, when determining the amount of net operating loss that is available for future use. Based on this analysis, we have undergone two ownership changes as defined in Section 382 of the Code. The first ownership change occurred on July 7, 2006, and the second ownership change occurred on August 8, 2007. We have updated our Section 382 analysis through the year ended December 31, 2012 and do not have any additional limitations.
We have agreements to sell solar energy systems to the financing funds structured as joint ventures. The gain on the sale of the assets has been eliminated in the consolidated financial statements. These transactions are treated as inter-company sales and as such, tax is not recognized on the sale until we no longer benefit from the underlying asset. Because the systems remain within the consolidated group, the tax expense incurred related to these sales is being deferred and amortized over the life of the underlying systems, estimated to be 30 years. As of December 31, 2012 and 2011, we recorded a long-term prepaid tax expense of $2.0 million and $3.3 million net of amortization, respectively.
As a result of our acquisition of the non-controlling interest in certain of our joint venture financing funds on December 31, 2012, we accounted for the direct impact of the transactions as an adjustment to other paid in capital, while the indirect impacts of the transactions were accounted for in the statement of operations. Since we now own 100% of these funds, the financing fund partnerships were treated as terminated for income tax purposes. Due to the deemed liquidation of the partnerships, we recognized $2.5 million of taxable income resulting from the liquidating distributions of cash and assets. This income was offset by the current year net operating losses, resulting in a net zero impact to the statement of operations. We also recognized a net deferred tax liability of $17.3 million resulting mainly from accelerated depreciation previously taken for tax purposes not for book purposes. The impact of setting up this deferred tax liability was offset by a release of valuation allowance, resulting in a net zero impact to the statement of operations.
Noncontrolling Interests
Our noncontrolling interests represent fund investors’ interest in the net assets of certain joint venture funding structures, which we consolidate, that we have entered into to finance the costs of solar energy systems under operating leases. We have determined that the provisions in the contractual agreements of the funding arrangements represent substantive profit sharing arrangements. We have further determined that the appropriate methodology for calculating the noncontrolling interests balances that reflects the substantive profit sharing arrangements is a balance sheet approach using the HLBV method. We therefore determine the noncontrolling interest balance at each balance sheet date using the HLBV method and record it on our consolidated balance sheet as noncontrolling interests in subsidiaries. Under the HLBV method, the amounts reported as noncontrolling interests in the consolidated balance sheet represent the amounts the fund investors would hypothetically receive at each balance sheet date under the liquidation provisions of the contractual agreements of these structures, assuming the net assets of these funding structures were liquidated at recorded amounts determined in accordance with GAAP. The fund investors’ interest in the results of operations of these funding structures is determined as the difference in noncontrolling interests in the consolidated balance sheets at the start and end of each reporting period, after taking into account any capital transactions between the fund and the fund investors. The noncontrolling interests’ balance is reported as a component of equity in the consolidated balance sheets.
59
Table of Contents
Results of Operations
The following table sets forth selected consolidated statements of operations data for each of the periods indicated.
| Year Ended December 31, | ||||||||||||
| 2012 | 2011 | 2010 | ||||||||||
| (in thousands, except share and per share data) | ||||||||||||
| Consolidated statement of operations data: |
||||||||||||
| Revenue: |
||||||||||||
| Operating leases |
$ | 47,616 | $ | 23,145 | $ | 9,684 | ||||||
| Solar energy systems sales |
81,046 | 36,406 | 22,744 | |||||||||
|
|
|
|
|
|
|
|||||||
| Total revenue |
128,662 | 59,551 | 32,428 | |||||||||
|
|
|
|
|
|
|
|||||||
| Cost of revenue: |
||||||||||||
| Operating leases |
13,346 | 5,718 | 3,191 | |||||||||
| Solar energy systems |
64,429 | 41,418 | 26,953 | |||||||||
|
|
|
|
|
|
|
|||||||
| Total cost of revenue |
77,775 | 47,136 | 30,144 | |||||||||
|
|
|
|
|
|
|
|||||||
| Gross profit |
50,887 | 12,415 | 2,284 | |||||||||
| Operating expenses: |
||||||||||||
| Sales and marketing |
69,392 | 42,004 | 22,404 | |||||||||
| General and administrative |
50,355 | 31,664 | 19,227 | |||||||||
|
|
|
|
|
|
|
|||||||
| Total operating expenses |
119,747 | 73,668 | 41,631 | |||||||||
|
|
|
|
|
|
|
|||||||
| Loss from operations |
(68,860 | ) | (61,253 | ) | (39,347 | ) | ||||||
| Interest expense, net |
20,142 | 9,272 | 4,901 | |||||||||
| Other expenses, net |
2,519 | 3,097 | 2,761 | |||||||||
|
|
|
|
|
|
|
|||||||
| Loss before income taxes |
(91,521 | ) | (73,622 | ) | (47,009 | ) | ||||||
| Income tax provision |
(54 | ) | (92 | ) | (65 | ) | ||||||
|
|
|
|
|
|
|
|||||||
| Net loss |
(91,575 | ) | (73,714 | ) | (47,074 | ) | ||||||
| Net loss attributable to noncontrolling interests |
(27,384 | ) | (117,230 | ) | (8,457 | ) | ||||||
|
|
|
|
|
|
|
|||||||
| Net income (loss) attributable to stockholders |
$ | (64,191 | ) | $ | 43,516 | $ | (38,516 | ) | ||||
|
|
|
|
|
|
|
|||||||
| Net income (loss) per share attributable to common stockholders: |
||||||||||||
| Basic |
$ | (5.22 | ) | $ | 0.82 | $ | (4.50 | ) | ||||
|
|
|
|
|
|
|
|||||||
| Diluted |
$ | (5.23 | ) | $ | 0.76 | $ | (4.50 | ) | ||||
|
|
|
|
|
|
|
|||||||
| Weighted average common shares outstanding: |
||||||||||||
| Basic |
14,240,187 | 9,977,646 | 8,583,772 | |||||||||
|
|
|
|
|
|
|
|||||||
| Diluted |
14,267,767 | 14,523,734 | 8,583,772 | |||||||||
|
|
|
|
|
|
|
|||||||
Revenue
| Year Ended December 31, | Change 2012 vs. 2011 | Change 2011 vs. 2010 | ||||||||||||||||||||||||||
| (Dollars in thousands) | 2012 | 2011 | 2010 | $ | % | $ | % | |||||||||||||||||||||
| Operating leases |
$ | 47,616 | $ | 23,145 | $ | 9,684 | $ | 24,471 | 106% | $ | 13,461 | 139% | ||||||||||||||||
| Solar energy systems sales |
81,046 | 36,406 | 22,744 | 44,640 | 123% | 13,662 | 60% | |||||||||||||||||||||
|
|
|
|
|
|
|
|
|
|
|
|||||||||||||||||||
| Total revenue |
$ | 128,662 | $ | 59,551 | $ | 32,428 | $ | 69,111 | 116% | $ | 27,123 | 84% | ||||||||||||||||
60
Table of Contents
2012 Compared to 2011
Total revenue increased by $69.1 million, or 116%, for the year ended December 31, 2012 as compared to the year ended December 31, 2011.
Operating leases revenue increased by $24.5 million, or 106%, for the year ended December 31, 2012 as compared to the year ended December 31, 2011. This increase was attributable to an increased number of solar energy systems under leases and power purchase agreements that are in service, the aggregate of which increased by 147% to December 31, 2012 from December 31, 2011. This significant growth was attributable to our continued success in the installation and operation of solar energy systems under lease and power purchase agreements in new and existing markets. Operating leases revenue for the year ended December 31, 2012 included $18.2 million in revenue attributable to rebates and incentives, representing an increase of $8.6 million compared to the year ended December 31, 2011.
Revenue from sales of solar energy systems increased by $44.6 million, or 123%, for the year ended December 31, 2012 as compared to the year ended December 31, 2011. This increase was primarily due to a $14.9 million increase in large commercial solar energy system sales, a $11.0 million increase in revenue from long-term solar energy system sales contracts, a $10.2 million increase in revenue from sales of solar energy systems to the government, and an $8.6 million increase in revenue from sales to a specific commercial customer during the year ended December 31, 2012. In addition, revenue from sales of energy efficiency products and services increased by $6.0 million to $7.8 million for the year ended December 31, 2012 from $1.8 million for the year ended December 31, 2011. This increase was offset in part by a lower average sales price of solar energy systems sold for the year ended December 31, 2012 as compared to the year ended December 31, 2011, including a $5.7 million decrease in residential solar energy system sales. The decline in the average sales price was due to a decrease in the cost of the solar energy system components that in turn led to a downward impact on the competitive market price of solar energy systems sold. We expect that the continuing decline in the cost of solar energy system components will continue to similarly impact our average sales price.
2011 Compared to 2010
Total revenue increased by approximately $27.1 million, or 84%, for the year ended December 31, 2011 as compared to the year ended December 31, 2010.
Operating leases revenue increased by approximately $13.5 million, or 139%, for the year ended December 31, 2011 as compared to the year ended December 31, 2010. The increase is attributable to an increased number of solar energy systems under leases and power purchase agreements in service and generating revenue. The number of solar energy systems under leases and power purchase agreements increased by 135% during the year ended December 31, 2011 compared to the prior year. This significant growth was attributable to our continued success in the installation of solar energy systems under lease and power purchase agreements in new and existing markets and the more rapid deployment of solar energy systems under these agreements. There was no significant change in the pricing of the leases or power purchase agreements in 2011 compared to 2010. Additionally, during the year ended December 31, 2011, we expanded our operations into new territories such as the East Coast and continued our sales penetration within existing territories. Operating leases revenue for the year ended December 31, 2011 included $9.6 million in revenue attributable to rebates and incentives, representing an increase of $5.8 million compared to the year ended December 31, 2010.
Revenue from sale of solar energy systems increased by approximately $13.7 million, or 60%, for the year ended December 31, 2011 as compared to the year ended December 31, 2010. This increase was primarily due to a $14.7 million increase in large commercial solar energy system sales compared to the prior year. This increase in revenue was offset in part by lower average selling prices of solar energy systems sold in the year 2011. The decline in the average sales price was due to a decrease in the cost of the solar energy system components that in turn led to a downward impact on the competitive market price of solar energy systems sold.
61
Table of Contents
Cost of Revenue, Gross Profit, and Gross Profit Margin
| Year Ended December 31, | Change 2012 vs. 2011 | Change 2011 vs. 2010 | ||||||||||||||||||||||||||
| (Dollars in thousands) | 2012 | 2011 | 2010 | $ | % | $ | % | |||||||||||||||||||||
| Operating leases |
$ | 13,346 | $ | 5,718 | $ | 3,191 | $ | 7,628 | 133 | % | $ | 2,527 | 79 | % | ||||||||||||||
| Gross profit of operating leases |
34,270 | 17,427 | 6,493 | 16,843 | 97 | % | 10,934 | 168 | % | |||||||||||||||||||
| Gross profit margin of operating lease revenue |
72 | % | 75 | % | 67 | % | ||||||||||||||||||||||
| Solar energy systems |
$ | 64,429 | $ | 41,418 | $ | 26,953 | $ | 23,011 | 56 | % | $ | 14,465 | 54 | % | ||||||||||||||
| Gross (loss) profit of solar energy systems |
16,617 | (5,012 | ) | (4,209 | ) | 21,629 | 432 | % | (803 | ) | (19 | )% | ||||||||||||||||
| Gross (loss) profit margin of solar energy systems |
21 | % | (14 | )% | (19 | )% | ||||||||||||||||||||||
| Total cost of revenue |
$ | 77,775 | $ | 47,136 | $ | 30,144 | $ | 30,639 | 65 | % | $ | 16,992 | 56 | % | ||||||||||||||
| Total gross profit |
50,887 | 12,415 | 2,284 | 38,472 | 310 | % | 10,131 | 444 | % | |||||||||||||||||||
| Total gross profit margin |
40 | % | 21 | % | 7 | % | ||||||||||||||||||||||
2012 Compared to 2011
Cost of operating leases revenue increased by $7.6 million, or 133%, for the year ended December 31, 2012 as compared to the year ended December 31, 2011. This increase was primarily due to an increase in the aggregate number of solar energy systems placed under operating leases that were interconnected and being depreciated in the year ended December 31, 2012 and lower cost of operating leases revenue in the second quarter of 2011 from recognizing a catch-up adjustment on the amortization of U.S. Treasury grants related to our financing funds amounting to $1.4 million, offset in part by the declining cost of solar energy system components. This resulted in a lower gross profit margin of operating leases revenue in the year ended December 31, 2012 as compared to the year ended December 31, 2011.
Cost of sales of solar energy systems increased by $23.0 million, or 56%, for the year ended December 31, 2012 as compared to the year ended December 31, 2011. This increase was due to increased costs associated with the rise in sales of solar energy systems, offset in part by the declining cost of solar energy system components. The increase in the gross margin from a gross loss of 14% to a gross profit of 21% was primarily due to the increase in the volume of sales recognized for the year ended December 31, 2012 as compared to the year ended December 31, 2011. Due to the increased volume of sales, we were able to allocate overhead costs to more units, leading to a lower cost per unit.
The cost of our solar energy system components could increase in the future as a result of the U.S. government’s imposition of tariffs on solar cells manufactured in China. Based on determinations by the U.S. government, the applicable anti-dumping tariff rates range from 8%-239%. To the extent that U.S. market participants experience harm from Chinese pricing practices, an additional tariff of 15%-16% would be applied. Because we currently purchase solar panels containing solar cells manufactured outside of China, we currently are not adversely impacted by the tariffs. We believe there is adequate surplus capacity of non-tariff solar panels available. In addition, we expect the cost of solar panels to continue to decline, although we expect the rate of decline to decrease as component prices approach the cost of manufacture.
2011 Compared to 2010
Cost of operating lease revenue increased by $2.5 million, or 79%, in the year ended December 31, 2011 as compared to the year ended December 31, 2010. The increase was primarily due to the increase in the aggregate number of solar energy systems placed under operating leases that were interconnected in the year ended December 31, 2011, offset in part by declining costs of solar energy system components.
62
Table of Contents
Cost of sales of solar energy systems increased by approximately $14.5 million, or 54%, in the year ended December 31, 2011 as compared to the year ended December 31, 2010. The change was due to rising costs associated with the increase in commercial solar energy system sales in 2011 and an increase in the aggregate amount of operational overhead costs allocated to these systems attributable to the growth in operational costs that we incurred to support our growth in current and new territories. These overhead costs increased by $15.7 million from $18.3 million in 2010 to $34.0 million in 2011. While we expect these allocated overhead costs to increase in the future, we expect the installation volume to increase at a greater rate than the increase in the overhead costs. Accordingly, the allocated overhead cost per installed system is expected to decrease in the future. The increase was also due to a $2.6 million charge recorded in the year ended December 31, 2011 to adjust the cost of certain raw material inventory to market value and a $0.1 million charge for slow moving inventory.
Operating Expenses
| Year Ended December 31, | Change 2012 vs. 2011 | Change 2011 vs. 2010 | ||||||||||||||||||||||||||
| (Dollars in thousands) | 2012 | 2011 | 2010 | $ | % | $ | % | |||||||||||||||||||||
| Sales and marketing expense |
$ | 69,392 | $ | 42,004 | $ | 22,404 | $ | 27,388 | 65% | $ | 19,600 | 87% | ||||||||||||||||
| General and administrative expense |
50,355 | 31,664 | 19,227 | 18,691 | 59% | 12,437 | 65% | |||||||||||||||||||||
|
|
|
|
|
|
|
|
|
|
|
|||||||||||||||||||
| Total operating expenses |
$ | 119,747 | $ | 73,668 | $ | 41,631 | $ | 46,079 | 63% | $ | 32,037 | 77% | ||||||||||||||||
2012 Compared to 2011
Sales and marketing expense increased by $27.4 million, or 65%, for the year ended December 31, 2012 as compared to the year ended December 31, 2011. This increase was primarily driven by increased promotional and marketing activities in the year ended December 31, 2012 as we continued to broaden our sales and marketing efforts in new and existing markets. Promotional marketing expenses increased by $3.9 million from 2011 to 2012. In addition, we increased our total number of personnel allocated to sales and marketing departments from 319 as of December 31, 2011 to 693 as of December 31, 2012. As a result of this growth in headcount, payroll costs increased by $20.5 million from 2011 to 2012.
General and administrative expense increased by $18.7 million, or 59%, for the year ended December 31, 2012 as compared to the year ended December 31, 2011. This increase was primarily due to an increase in the number of personnel allocated to general and administrative departments from 155 as of December 31, 2011 to 254 as of December 31, 2012. As a result of this growth in headcount, payroll costs increased by $12.6 million from 2011 to 2012. In addition, the larger number of financing funds contributed to an increase in legal, audit, and professional fees of $2.6 million from 2011 to 2012.
2011 Compared to 2010
Sales and marketing expenses increased by approximately $19.6 million, or 87%, in the year ended December 31, 2011 as compared to the year ended December 31, 2010. This increase was driven primarily by increased marketing activities in 2011 as promotional marketing costs increased by $11.6 million to $23.0 million in 2011 compared to $11.4 million in 2010, as we continued to broaden our marketing efforts to develop our backlog and increase our sales in new and existing sales territories. In line with the broader marketing efforts, we increased the total number of our sales and marketing personnel from 137 as of December 31, 2010 to 319 as of December 31, 2011. The increase in personnel headcount resulted in an increase of $4.2 million in payroll costs that increased from $8.6 million in 2010 to $12.8 million in 2011.
General and administrative expenses increased by approximately $12.4 million, or 65%, in the year ended December 31, 2011 as compared to the year ended December 31, 2010. The increase in general and administrative expenses was due to an increase in the number of our administrative and management personnel from 102 as of December 31, 2010 to 155 as of December 31, 2011. The increase in personnel headcount resulted in an increase in payroll costs of $4.1 million from $6.9 million in 2010 to $11.0 million in 2011. The increased administrative overhead costs associated with a larger number of financing funds and additional legal and professional fees resulted in an increase of $3.7 million in expenses, which increased from $2.4 million in 2010 to $6.1 million in 2011.
63
Table of Contents
Other Income and Expenses
| Year Ended December 31, | Change 2012 vs. 2011 | Change 2011 vs. 2010 | ||||||||||||||||||||||||||
| (Dollars in thousands) | 2012 | 2011 | 2010 | $ | % | $ | % | |||||||||||||||||||||
| Interest expense, net |
$ | 20,142 | $ | 9,272 | 4,901 | $ | 10,870 | 117 | % | 4,371 | 89 | % | ||||||||||||||||
| Other expenses, net |
2,519 | 3,097 | 2,761 | (578 | ) | (19 | )% | 336 | 12 | % | ||||||||||||||||||
|
|
|
|
|
|
|
|
|
|
|
|
|
|
|
|||||||||||||||
| Total interest and other expenses, net |
$ | 22,661 | $ | 12,369 | 7,662 | $ | 10,292 | 83 | % | 4,707 | 61 | % | ||||||||||||||||
2012 Compared to 2011
Interest expense, net, increased by $10.9 million, or 117%, for the year ended December 31, 2012 as compared to the year ended December 31, 2011. Interest expense, net, is comprised of imputed interest on financing obligations of $12.0 million and $7.4 million for year ended December 31, 2012 and 2011, and interest on bank borrowings, net of interest income on cash balances, of $8.1 million and $1.9 million for the year ended December 31, 2012 and 2011, respectively. This increase was in line with higher balances of financing obligations and bank debt in the year ended December 31, 2012 as compared to the year ended December 31, 2011.
Other expenses, net, decreased by $0.6 million, or 19%, for the year ended December 31, 2012 as compared to the year ended December 31, 2011. This decrease was primarily due to a higher loss on disposal of property and equipment of $0.3 million in the year ended December 31, 2011.
2011 Compared to 2010
Interest expense, net, increased by approximately $4.4 million, or 89%, in the year ended December 31, 2011 as compared to the year ended December 31, 2010. The increase is in line with higher balances of financing obligations and outstanding balance of bank debt in 2011 compared to 2010.
Other expenses, net, increased by approximately $0.3 million, or 12%, in the year ended December 31, 2011 as compared to the year ended December 31, 2010. The increase was primarily due to a change in value of warrants outstanding to acquire our convertible redeemable preferred stock that we issued mainly to fund investors, which were converted to warrants to acquire our common stock upon the closing of our initial public offering.
Provision for Income Taxes
| Year Ended December 31, | Change 2012 vs. 2011 | Change 2011 vs. 2010 | ||||||||||||||||||||||||||
| (Dollars in thousands) | 2012 | 2011 | 2010 | $ | % | $ | % | |||||||||||||||||||||
| Income tax provision |
$ | 54 | $ | 92 | $ | 65 | $ | (38 | ) | 41 | % | $ | 27 | 42 | % | |||||||||||||
2012 Compared to 2011
Income tax expense decreased by approximately $0.04 million, or 41%, for the year ended December 31, 2012 as compared to the year ended December 31, 2011. As of December 31, 2012, we had incurred a total of $2.2 million of income tax expense in connection with sales of solar energy systems to the financing funds. Because no gain on the sales of the solar energy systems was recognized in our consolidated financial statements, the associated income tax expense was deferred and is being recognized as income tax expense over the estimated useful life of the solar energy systems.
2011 Compared to 2010
Income tax expense increased by approximately $0.03 million in the year ended December 31, 2011 as compared to the year ended December 31, 2010. As of December 31, 2011 we had incurred a total of $3.4 million of income tax expense in connection with sales of solar energy systems to the financing funds. Because no gain on the sale of the solar energy systems was recognized in our consolidated financial statements, the tax expense was deferred and is being recognized as tax expense over the estimated useful life of the solar energy systems.
64
Table of Contents
Net Loss Attributable to Noncontrolling Interests
| Year Ended December 31, | Change 2012 vs. 2011 | Change 2011 vs. 2010 | ||||||||||||||||||||||||||
| (Dollars in thousands) | 2012 | 2011 | 2010 | $ | % | $ | % | |||||||||||||||||||||
| Net loss attributable to noncontrolling interests | $ | (27,384 | ) | $ | (117,230 | ) | $ | (8,457 | ) | $ | 89,846 | 77% | $ | (108,773 | ) | (1,286)% | ||||||||||||
The net loss attributable to noncontrolling interests represents the share of net loss that was allocated to the investors in the joint venture financing funds. This amount was determined as the change in the investors’ interests in the joint venture financing funds between the beginning and end of each reported period calculated using the HLBV method, less any capital contributions net of any capital distributions. The calculation depends on the specific contractual liquidation provisions of each joint venture financing fund and is generally affected by, among other factors, the tax attributes allocated to the investors including tax bonus depreciation and investment tax credits or U.S. Treasury grants in lieu of the investment tax credits, the existence of guarantees of minimum returns to the investors by us, and the allocation of tax income or losses including provisions that govern the level of deficits that can be funded by the investors in a liquidation scenario. The calculation is also affected by the cost of the assets sold to the joint venture financing funds, which forms the book basis of the net assets allocated to the investors assuming a liquidation scenario. Generally, significant loss allocations to the investors have arisen in situations where there was a significant difference between the fair value and the cost of the assets sold to the joint venture financing funds in a particular period accompanied by the absence of guarantees of minimum returns to the investors by us, since the capital contributions by the investors were based on the fair value of the assets while the calculation is based on the cost of the assets. The existence of guarantees of minimum returns to the investors by us and limits on the level of deficits that the investors are contractually obligated to fund in a liquidation scenario reduce the amount of losses that could be allocated to the investors.
2012 compared to 2011
The net loss attributable to noncontrolling interests was $89.8 million, or 77%, lower in the year ended December 31, 2012 as compared to the year ended December 31, 2011 mainly due to a $71.1 million higher loss allocation in 2011 to an investor in a financing fund into which we had sold assets with a larger excess of fair value over cost in 2011 as compared to 2012, and a $25.2 million higher loss allocation in 2011 to an investor in two financing funds into which we had contributed assets, and we did not contribute any assets into these funds in 2012. These were offset in part by $10.3 million of net loss allocations to the investors in new financing funds formed in 2012.
2011 compared to 2010
The net loss attributable to noncontrolling interests of $117.2 million reported in 2011 is attributable to a decrease in the noncontrolling interest’s balance between December 31, 2010 and 2011 of $0.9 million less capital contributions net of distributions of $116.3 million.
The net loss attributable to noncontrolling interests of $8.5 million reported in 2010 is attributable to an increase in the noncontrolling interest’s balance between December 31, 2009 and 2010 of $67.5 million less capital contributions net of distributions of $76.0 million.
This significant loss allocation in 2011 was attributable mainly to the excess of fair value over cost of assets of $122.9 million sold into two funds in which the investors have no guaranteed minimum return. The loss allocation in 2010 is attributable mainly to the excess of fair value over cost of the assets of $6.4 million that were sold into a fund in which the investor had no guaranteed minimum return. The net income allocation in 2009 is attributable to sales of assets in 2009 to funds which had a guaranteed minimum return to the investors.
65
Table of Contents
Quarterly Results of Operations
The following table sets forth selected unaudited quarterly consolidated statement of operations data for each of the quarters indicated. The consolidated financial statements for each of these quarters have been prepared on a basis consistent with the audited consolidated financial statements included elsewhere in this annual report on Form 10-K and, in the opinion of management, include all adjustments necessary for the fair presentation of the consolidated results of operations for these periods. You should read this information together with our consolidated financial statements and related notes included elsewhere in this annual report on Form 10-K. These quarterly operating results are not necessarily indicative of the results for any future period.
| Three Months Ended | ||||||||||||||||||||||||||||||||
| December 31, 2012 |
September 30, 2012 |
June 30, 2012 |
March 31, 2012 |
December 31, 2011 |
September 30, 2011 |
June 30, 2011 |
March 31, 2011 |
|||||||||||||||||||||||||
| (in thousands, except share and per share amounts) | ||||||||||||||||||||||||||||||||
| Revenue: |
||||||||||||||||||||||||||||||||
| Operating leases |
$ | 14,032 | $ | 13,917 | $ | 11,528 | $ | 8,139 | $ | 7,042 | $ | 7,004 | $ | 5,682 | $ | 3,417 | ||||||||||||||||
| Solar energy systems sales |
11,241 | 18,057 | 35,046 | 16,702 | 13,700 | 11,527 | 7,352 | 3,827 | ||||||||||||||||||||||||
|
|
|
|
|
|
|
|
|
|
|
|
|
|
|
|
|
|||||||||||||||||
| Total revenue |
25,273 | 31,974 | 46,574 | 24,841 | 20,742 | 18,531 | 13,034 | 7,244 | ||||||||||||||||||||||||
|
|
|
|
|
|
|
|
|
|
|
|
|
|
|
|
|
|||||||||||||||||
| Cost of revenue: |
||||||||||||||||||||||||||||||||
| Operating leases |
4,731 | 2,323 | 3,710 | 2,582 | 2,429 | 1,892 | 52 | 1,345 | ||||||||||||||||||||||||
| Solar energy systems |
6,505 | 13,900 | 31,899 | 12,125 | 10,003 | 15,076 | 12,002 | 4,337 | ||||||||||||||||||||||||
|
|
|
|
|
|
|
|
|
|
|
|
|
|
|
|
|
|||||||||||||||||
| Total cost of revenue |
11,236 | 16,223 | 35,609 | 14,707 | 12,432 | 16,968 | 12,054 | 5,682 | ||||||||||||||||||||||||
|
|
|
|
|
|
|
|
|
|
|
|
|
|
|
|
|
|||||||||||||||||
| Gross profit |
14,037 | 15,751 | 10,965 | 10,134 | 8,310 | 1,563 | 980 | 1,562 | ||||||||||||||||||||||||
| Operating expenses: |
||||||||||||||||||||||||||||||||
| Sales and marketing |
19,416 | 18,145 | 15,700 | 16,131 | 14,758 | 12,003 | 8,653 | 6,590 | ||||||||||||||||||||||||
| General and administrative |
18,451 | 12,554 | 10,788 | 8,562 | 7,538 | 8,669 | 8,816 | 6,641 | ||||||||||||||||||||||||
|
|
|
|
|
|
|
|
|
|
|
|
|
|
|
|
|
|||||||||||||||||
| Total operating expenses |
37,867 | 30,699 | 26,488 | 24,693 | 22,296 | 20,672 | 17,469 | 13,231 | ||||||||||||||||||||||||
|
|
|
|
|
|
|
|
|
|
|
|
|
|
|
|
|
|||||||||||||||||
| Loss from operations |
(23,830 | ) | (14,948 | ) | (15,523 | ) | (14,559 | ) | (13,986 | ) | (19,109 | ) | (16,489 | ) | (11,669 | ) | ||||||||||||||||
| Interest expense, net |
5,220 | 6,587 | 4,841 | 3,494 | 1,756 | 2,119 | 3,186 | 2,211 | ||||||||||||||||||||||||
| Other expenses (Income), net |
(15,376 | ) | 7,466 | 1,455 | 8,974 | 1,213 | 51 | 685 | 1,148 | |||||||||||||||||||||||
|
|
|
|
|
|
|
|
|
|
|
|
|
|
|
|
|
|||||||||||||||||
| Loss before income taxes |
(13,674 | ) | (29,001 | ) | (21,819 | ) | (27,027 | ) | (16,955 | ) | (21,279 | ) | (20,360 | ) | (15,028 | ) | ||||||||||||||||
| Income tax provision |
53 | (42 | ) | (30 | ) | (35 | ) | (30 | ) | 13 | (51 | ) | (24 | ) | ||||||||||||||||||
|
|
|
|
|
|
|
|
|
|
|
|
|
|
|
|
|
|||||||||||||||||
| Net loss |
(13,621 | ) | (29,043 | ) | (21,849 | ) | (27,062 | ) | (16,985 | ) | (21,266 | ) | (20,411 | ) | (15,052 | ) | ||||||||||||||||
| Net income (loss) attributable to noncontrolling interests |
(10,578 | ) | 9,028 | 3,984 | (29,818 | ) | (31,058 | ) | (38,779 | ) | (25,694 | ) | (21,699 | ) | ||||||||||||||||||
|
|
|
|
|
|
|
|
|
|
|
|
|
|
|
|
|
|||||||||||||||||
| Net income (loss) attributable to stockholders |
$ | (3,043 | ) | $ | (38,071 | ) | $ | (25,833 | ) | $ | 2,756 | $ | 14,073 | $ | 17,513 | $ | 5,283 | $ | 6,647 | |||||||||||||
|
|
|
|
|
|
|
|
|
|
|
|
|
|
|
|
|
|||||||||||||||||
| Net income (loss) attributable to common stockholders |
||||||||||||||||||||||||||||||||
| Basic |
$ | (13,134 | ) | $ | (38,071 | ) | $ | (25,833 | ) | $ | 453 | $ | 2,710 | $ | 3,319 | $ | 961 | $ | 1,228 | |||||||||||||
| Diluted |
$ | (27,950 | ) | $ | (38,071 | ) | $ | (25,833 | ) | $ | 656 | $ | 3,673 | $ | 4,529 | $ | 1,257 | $ | 1,540 | |||||||||||||
| Net income (loss) per share attributable to common stockholders |
||||||||||||||||||||||||||||||||
| Basic |
$ | (0.54 | ) | $ | (3.41 | ) | $ | (2.37 | ) | $ | 0.04 | $ | 0.26 | $ | 0.33 | $ | 0.10 | $ | 0.13 | |||||||||||||
| Diluted |
$ | (1.10 | ) | $ | (3.41 | ) | $ | (2.37 | ) | $ | 0.04 | $ | 0.24 | $ | 0.30 | $ | 0.09 | $ | 0.12 | |||||||||||||
| Weighted average shares used to compute net income (loss) per share attributable to common stockholders |
||||||||||||||||||||||||||||||||
| Basic |
24,283,731 | 11,161,789 | 10,897,198 | 10,503,931 | 10,374,820 | 10,073,249 | 9,798,381 | 9,659,797 | ||||||||||||||||||||||||
| Diluted |
25,310,651 | 11,161,789 | 10,897,198 | 17,076,717 | 15,413,884 | 15,071,509 | 13,865,019 | 12,919,519 | ||||||||||||||||||||||||
66
Table of Contents
Liquidity and Capital Resources
The following table summarizes our consolidated cash flows:
| Year Ended December 31, | ||||||||||||
| 2012 | 2011 | 2010 | ||||||||||
| (in thousands, except share and per share data) | ||||||||||||
| Consolidated cash flow data: |
||||||||||||
| Net cash provided by (used in) operating activities |
$ | 60,333 | $ | 18,082 | $ | (3,818 | ) | |||||
| Net cash used in investing activities |
(449,059 | ) | (304,252 | ) | (162,862 | ) | ||||||
| Net cash provided by financing activities |
498,335 | 278,371 | 187,038 | |||||||||
|
|
|
|
|
|
|
|||||||
| Net increase (decrease) in cash and cash equivalents |
$ | 109,609 | $ | (7,799 | ) | $ | 20,358 | |||||
|
|
|
|
|
|
|
|||||||
We finance our operations, including the costs of acquisition and installation of solar energy systems, mainly through a variety of financing fund arrangements that we have formed with fund investors, credit facilities from banks, preferred stock equity offerings and cash generated from our operations. As described below under —Financing Activities—Financing Fund Commitments, as of December 31, 2012 we had $592.8 million of available commitments from our fund investors, including a $347.2 million financing fund structured as a debt facility, that could be drawn down through our asset monetization strategy.
While we have reported operating losses for the year ended December 31, 2012, we believe that our existing cash and cash equivalents, funds available under a secured credit facility and funds available in our existing financing funds that can be drawn down through our assets monetization strategy will be sufficient to meet our cash requirements for at least the next 12 months.
Operating Activities
In the year ended December 31, 2012, we generated approximately $60.3 million in net cash from operations. This cash inflow primarily resulted from an increase in deferred revenue of approximately $121.0 million relating to upfront lease payments received from customers and solar energy system incentive rebate payments received from various state and local governments, a decrease in inventories of $54.8 million, an increase in accrued and other liabilities of $67.1 million and a decrease in prepaid and other current assets of $7.9 million. The cash inflow was offset in part by a decrease in accounts payable of $99.6 million, an increase in incentive rebates receivable of $3.8 million, an increase in accounts receivable of $14.5 million, and a net loss of approximately $91.6 million, reduced by non-cash items such as depreciation and amortization of approximately $21.0 million, stock-based compensation of approximately $10.7 million, interest on lease pass-through obligation of $12.0 million, changes in fair value of convertible redeemable preferred stock warrants of approximately $1.9 million and increased by a reduction in lease pass-through obligation of approximately $16.2 million.
In the year ended December 31, 2011, we generated approximately $18.1 million in net cash from operations. This cash inflow primarily resulted from an increase in deferred revenue of approximately $68.3 million relating to upfront lease payments received from customers and solar energy system incentive rebate payments received from various state and local governments, an increase in customer deposits of $10.9 million and an increase in accounts payable of $118.9 million. The cash inflow was offset in part by an increase in incentive rebates receivable of $4.9 million, an increase in inventories of $111.2 million, and a net loss of approximately $73.7 million, reduced by non-cash items such as depreciation and amortization of approximately $12.3 million, stock-based compensation of approximately $5.1 million, interest on lease pass-through obligation of $7.4 million, changes in fair value of convertible redeemable preferred stock warrants of approximately $2.1 million and increased by a reduction in lease pass-through obligation of approximately $23.5 million. In addition, the increase in other liabilities resulted in additional net inflows of cash, which were partially offset by increased other assets. The sizeable increase in inventories and accounts payable was due to a $106.1 million year-end
67
Table of Contents
purchase of inverters and modules that are expected to be used in 2012 in the construction of solar energy systems eligible for the U.S. Treasury cash grant program, the program rules of which required that the cost of the equipment be incurred by December 31, 2011.
In the year ended December 31, 2010, we utilized approximately $3.8 million in operating activities. This cash outflow primarily resulted from a net loss in the year of $47.1 million, reduced by non-cash items such as depreciation and amortization of approximately $5.7 million, stock-based compensation of approximately $1.8 million, interest on lease pass-through obligation of $3.3 million, changes in fair value of convertible redeemable preferred stock warrants of approximately $2.0 million and increased by a reduction in lease pass-through obligation of approximately $7.4 million. The outflow was offset in part by an increase in deferred revenue of approximately $22.2 million relating to upfront lease payments received from customers and solar energy system incentive rebate payments received from various state and local governments and an increase in customer deposits of $2.5 million. The cash outflow was also offset in part by a decrease in incentive rebates receivable of $3.3 million. In addition, unpaid accounts payable and other liabilities resulted in additional net inflows of cash, which were partially offset by increased inventory and other assets.
Investing Activities
Our investing activities consist primarily of capital expenditures.
In the year ended December 31, 2012, we used approximately $449.1 million in investing activities. Of this amount, we used $440.7 million on the design, acquisition and installation of solar energy systems under operating leases with our customers and $8.4 million in the acquisition of vehicles, office equipment, leasehold improvements and furniture.
In the year ended December 31, 2011, we used approximately $304.3 million in investing activities. Of this amount, we used $292.9 million on the design, acquisition and installation of solar energy systems under operating leases with our customers. We also used $8.8 million in the acquisition of vehicles, office equipment, leasehold improvements and furniture and invested approximately $2.5 million in the acquisitions of related businesses.
In the year ended December 31, 2010, we used approximately $162.9 million in investing activities. Of this amount, we used $156.5 million on the design, acquisition and installation of solar energy systems under operating leases with our customers. We also used $6.3 million in the acquisition of vehicles, office equipment, leasehold improvements and furniture.
Financing Activities
In the year ended December 31, 2012, we generated approximately $498.3 million from financing activities. We raised $92.4 million, net of underwriting discounts, commissions, and issuance costs, from the initial public offering of our common stock. We received approximately $80.9 million, net of transaction costs, from the issuance of convertible redeemable preferred stock. We received an additional $133.4 million, net of lender fees, from long-term debt and $19.4 million from our revolving line of credit and repaid $52.3 million of long-term debt and $25.0 million on our revolving line of credit. We also repaid $28.4 million of our capital lease obligation. We received approximately $113.6 million from U.S. Treasury Department grants associated with solar energy systems that we had leased to customers. We received $145.8 million from fund investors in our lease pass-through financing funds. We also generated approximately $161.4 million from proceeds from investments by various fund investors in our joint ventures and paid distributions to fund investors of approximately $144.5 million.
In the year ended December 31, 2011, we generated approximately $278.4 million from financing activities. We generated approximately $208.0 million of this amount from proceeds from investments by various fund investors in our joint ventures, partially offset by distributions paid to fund investors of approximately $88.6 million. We received approximately $65.5 million from U.S. Treasury Department grants associated with solar energy systems that
68
Table of Contents
we had leased to customers. We received $64.1 million from fund investors in our lease pass-through financing funds. We also received approximately $19.7 million, net of transaction costs, from the issuance of convertible redeemable preferred stock and approximately $1.3 million from the issuance of warrants to acquire convertible redeemable preferred stock. We received an additional $17.3 million from long-term debt and $5.6 million from our revolving line of credit and repaid $3.2 million of long-term debt and $4.5 million of revolving line of credit.
In the year ended December 31, 2010, we generated approximately $187.0 million from financing activities. We generated approximately $97.1 million of this amount from proceeds from investments by fund investors in our joint ventures, partially offset by distributions paid to the fund investors of approximately $25.0 million. We received $61.1 million from fund investors in our lease pass-through financing funds. We received approximately $21.4 million, net of transaction costs, from the issuance of convertible redeemable preferred stock and approximately $1.4 million from the issuance of warrants to acquire convertible redeemable preferred stock warrants, which converted by their terms into warrants to purchase shares of our common stock in connection with our initial public offering. We received approximately $20.1 million from U.S. Treasury Department grants associated with solar energy systems that we had leased to customers. We received approximately $18.3 million from financing obligations related to sales of solar energy systems to a fund investor under a sale-leaseback transaction that was accounted for as financing, which was partially offset by a repayment of the financing obligation of approximately $7.6 million. Finally, we received an additional $1.3 million from long-term debt and repaid $1.0 million of long-term debt.
Secured Credit Agreements
In February 2013, one of our subsidiaries entered into an agreement with a bank for a term loan of $10 million. The loan proceeds were used to finance our acquisition of a fund investor’s interests in three of our financing funds, discussed in Note 12, Solar Financing Funds. The loan bears interest at an annual rate equal to the lower of (i) the sum of LIBOR plus 3.25% and (ii) an interest rate cap of 6.50%. The loan is secured by the assets of certain of our subsidiaries. The loan is nonrecourse to our other assets and matures on January 31, 2015. Under the terms of the agreement, the borrower subsidiary is required to meet various restrictive covenants, including meeting certain reporting requirements, such as the completion and presentation of consolidated financial statements.
In September 2012, we entered into a revolving credit agreement with Bank of America, N.A., an affiliate of Merrill Lynch, Pierce, Fenner & Smith Incorporated, as administrative agent, and a syndicate of banks, including Credit Suisse AG, Cayman Islands Branch, to obtain funding for working capital, letters of credit and general corporate needs. This revolving credit agreement has a $75.0 million committed facility, of which $70.0 million was initially available pursuant to the facility’s terms. The borrowed funds bear interest at a rate of 3.875% plus LIBOR or, at our option, at a rate equal to 2.875%, plus the higher of (A) the federal funds rate plus 0.5%, (B) Bank of America’s published “prime rate,” or (C) LIBOR plus 1%. The fee for letters of credit is 3.875% per annum, and the fee for undrawn commitments is 0.375% per annum. The facility is secured by certain of our machinery and equipment, accounts receivables, inventory and other assets, excluding certain inventory pledged to other lenders. This facility matures in September 2014, which date may be extended by an additional year if we satisfy certain financial conditions. As of December 31, 2012, $68.0 million was borrowed and outstanding under this revolving credit agreement, of which we used approximately $25.0 million to fully repay our prior revolving credit facility described below.
Under the terms of this revolving credit agreement, we are required to meet various restrictive covenants, including meeting certain reporting requirements, such as the completion and presentation of audited consolidated financial statements. We are also required to maintain a debt service coverage ratio, as defined in the credit agreement, of at least 1.25:1.00 for the trailing 12 months measured at the end of each fiscal quarter, and to maintain unencumbered liquidity, as defined in the credit agreement, of at least $50.0 million, measured at the end of each month on and after December 31, 2012; provided, however, in each case, an event of default shall not have been deemed to occur unless (i) the unencumbered liquidity is below the foregoing applicable threshold for two consecutive months or (ii) the unencumbered liquidity is less than $40.0 million. As of December 31, 2012, we were in compliance with the covenants.
69
Table of Contents
In May 2008, we entered into a loan and security agreement with a commercial bank for working capital and equipment financing needs. This facility was subsequently modified to include a revolving line of credit facility and equipment financing facility. Borrowings under the revolving line of credit facility, as modified, bore interest at a rate of 1.5% plus the greater of 5% or the bank’s prime rate and were collateralized by all of our assets other than intellectual property. We borrowed $4.5 million under the revolving line of credit in 2009 and repaid the facility in full in April 2011.
The equipment financing facility, as modified, had a commitment of $1.0 million and was available in two tranches. The first tranche was available to be drawn down through January 13, 2010, and the second tranche was available to be drawn down through April 13, 2010. Interest under the equipment financing facility is payable monthly at a rate of 8% per annum. The principal amount is payable for the first tranche in 57 equal installments plus accrued interest beginning on December 10, 2009, and the principal amount for the second tranche is payable in 57 equal installments plus accrued interest beginning on March 10, 2010. This equipment financing facility was repaid in full in April 2011.
In April 2011, we entered into a revolving credit agreement with a commercial bank to obtain funding for working capital and general corporate needs. This revolving credit agreement had a $25.0 million committed facility. Borrowed funds bore interest at a rate of 2.5% plus LIBOR. The facility was secured by our accounts receivables, inventory and other assets, excluding certain inventory pledged to other lenders. As of December 31, 2011, $5.6 million was borrowed and outstanding under this revolving credit agreement. In January 2012, we borrowed the remainder of this facility. In September 2012, we repaid this facility in connection with entering into a new $75.0 million working capital facility.
In January 2011, we entered into a $7.0 million term facility that bears interest at a rate of 2.5% plus LIBOR. The term facility is secured by the vehicles financed by the facility.
In March 2012, we entered into a term loan credit agreement with Bank of America, N.A., an affiliate of Merrill Lynch, Pierce, Fenner & Smith Incorporated, as administrative agent, Merrill Lynch, Pierce, Fenner & Smith Incorporated as sole lead arranger and sole book manager and Bank of America, N.A., an affiliate of Goldman, Sachs & Co. and Credit Suisse AG, Cayman Islands Branch as lenders to obtain funding for the purchase of certain inventory and other working capital needs. This credit agreement has an approximately $58.5 million committed facility. We borrowed $58.5 million under this term loan facility as of December 31, 2012, from which we paid $1.5 million as fees to the lenders. Of the amounts borrowed, $17.2 million was outstanding as of December 31, 2012 and is included in our consolidated balance sheet under current portion of long-term debt. The facility is secured by certain of our inventory. Interest on the borrowed funds bears interest at a rate of 3.75% plus LIBOR.
Under the terms of the inventory term loan facility we are required to meet various financial covenants, including completion and presentation of financial statements. We are also required to maintain (i) a loan coverage ratio, as defined in the debt agreement, of 2.5 at the end of each quarter, (ii) liquidity, as defined in the debt agreement, of $20.0 million if the debt, as defined in the debt agreement, is at least $35.0 million or $15.0 million if debt is less than $35.0 million, in each case at the end of each month and (iii) minimum debt service coverage ratio, as defined in the debt agreement, of 1.25 at the end of each quarter. We were in compliance with these covenants as of December 31, 2012.
In addition to the instruments described above, we have entered into various other loan agreements consisting of motor vehicles and other assets financing with various financial institutions. Borrowings under these loans as of December 31, 2012 and 2011 under these agreements aggregated to $7.7 million and $5.1 million outstanding, respectively, with interest rates between 0.0% and 11.31%. The loans are secured by the underlying property and equipment.
70
Table of Contents
Financing Fund Commitments
We have financing fund commitments from several fund investors that we can draw upon in the future upon the achievement of specific funding criteria. As of December 31, 2012, we had entered into 24 financing funds that had a total of $592.8 million of undrawn committed capital, including a $347.2 million financing fund structured as a debt facility discussed below, to be used to partially fund our SolarStrong initiative. From our significant customer backlog we allocate to our financing funds leases and power purchase agreements and related economic benefits associated with solar energy systems in accordance with the criteria of the specific funds. Upon such allocation and upon our satisfaction of the conditions precedent to drawing upon such commitments, we are able to draw down on the financing fund commitments. Once received, these proceeds provide working capital to deliver solar energy systems to our customers and form part of our general working capital. A significant portion of these commitments can be used only for solar energy systems that commenced construction during 2011 (either physically or through incurrence of sufficient project costs) in order to qualify for the U.S. Treasury grant. As our supply of such solar energy systems decreases, we may not be able to satisfy the drawing conditions for all such commitments.
In November 2011, one of our subsidiaries entered into a credit agreement with a bank, whereby the bank would provide this subsidiary with a credit facility to be used to partially fund our SolarStrong initiative, which is a five-year plan to build solar power projects for privatized U.S. military housing communities across the country. The credit facility will be drawn down in tranches as defined in the credit facility agreement, with the interest rates to be determined as the amounts are drawn down. The credit facility will be collateralized by assets of the SolarStrong initiative and is non-recourse to our other assets. As of December 31, 2012 we had $347.2 million available for drawdown under this facility, as mentioned above.
In May 2010, one of our subsidiaries entered into a financing agreement with a commercial bank to obtain funding for working capital. The amount that may be borrowed under this agreement was determined based on the estimated present value of expected future lease rentals to be generated by equipment owned by the subsidiary and leased to a customer, up to a maximum of $16.3 million. The loan was funded in four tranches and was drawn down by March 31, 2011. The loan tranches bear interest at an average blended rate of 2%. The loan is secured by substantially all the assets of the subsidiary and is non-recourse to our other assets. We borrowed $13.3 million under this working capital financing facility in March 2011, of which $11.1 million and $12.1 million was outstanding as of December 31, 2012 and December 31, 2011. Under the working capital financing arrangement, our subsidiary is required to meet various restrictive covenants, including meeting certain reporting requirements, such as the completion and presentation of financial statements. We were in compliance with the covenants as of December 31, 2012.
On December 5, 2012, the U.S. Treasury Department notified one of our financing funds that it has established new guidelines for residential solar energy systems placed in service in California and Arizona on or after October 1, 2012. As a result of this updated guidance, we will be obligated to contribute additional solar energy systems to this financing fund so that the fund investors will recover a shortfall of approximately $200,000 and if other financing funds are similarly notified we may be required to true-up those funds. See “—Critical Accounting Policies and Estimates—Deferred U.S. Treasury Department Grant Proceeds.”
71
Table of Contents
Contractual Obligations
Set forth below is information concerning our contractual commitments and obligations as of December 31, 2012:
| Total | Less Than 1 Year |
1-3 Years | 3-5 Years | More than 5 Years |
||||||||||||||||
| Long-term debt obligations |
$ | 106,687 | $ | 21,412 | $ | 74,278 | $ | 2,379 | $ | 8,618 | ||||||||||
| Financing obligations |
15,144 | 389 | 866 | 996 | 12,893 | |||||||||||||||
| Interest(1) |
16,231 | 4,840 | 5,060 | 2,675 | 3,656 | |||||||||||||||
| Operating lease obligations |
67,599 | 9,842 | 16,649 | 11,897 | 29,211 | |||||||||||||||
| Performance guarantee |
630 | 630 | — | — | — | |||||||||||||||
|
|
|
|
|
|
|
|
|
|
|
|||||||||||
| Total |
$ | 206,291 | $ | 37,113 | $ | 96,853 | $ | 17,947 | $ | 54,378 | ||||||||||
|
|
|
|
|
|
|
|
|
|
|
|||||||||||
| (1) | Represents obligations for interest payments on long-term debt and financing obligations, and includes projected interest on variable rate long-term debt, based upon 2012 year end rates. |
Off-Balance Sheet Arrangements
We include in our consolidated financial statements all assets and liabilities and results of operations of financing fund arrangements that we have entered into. We have not entered into any other transactions that have generated relationships with unconsolidated entities or financial partnerships or special purpose entities. Accordingly, we do not have any off-balance sheet arrangements.
Recent Accounting Pronouncements
In May 2011, the FASB issued ASU No. 2011-04, Fair Value Measurement (Topic 820): Amendments to Achieve Common Fair Value Measurement and Disclosure Requirements in U.S. GAAP and IFRSs (ASU 2011-04), to provide a consistent definition of fair value and ensure that the fair value measurement and disclosure requirements are similar between GAAP and International Financial Reporting Standards. The ASU changes certain fair value measurement principles and enhances the disclosure requirements particularly for Level 3 fair value measurements. The ASU is effective for interim and annual periods beginning on or after December 15, 2011, with early adoption prohibited. We adopted the ASU, and our adoption did not have a significant impact on our consolidated financial statements.
In June 2011, the FASB issued ASU No. 2011-05, Comprehensive Income (Topic 220): Presentation of Comprehensive Income (ASU 2011-05), to require an entity to present the total of comprehensive income or loss, the components of net income or loss, and the components of other comprehensive income or loss either in a single continuous statement of comprehensive income or loss or in two separate but consecutive statements. The ASU is effective for fiscal years, and interim periods within those years, beginning after December 15, 2011. We adopted the ASU, and our adoption did not have a significant impact on our consolidated financial statements.
In February 2013, the FASB issued ASU No. 2013-02, Comprehensive Income (Topic 220): Reporting of Amounts Reclassified Out of Accumulated Other Comprehensive Income (ASU 2013-02), to require reporting of the impact of significant reclassifications out of accumulated other comprehensive income or loss on the line items on the statement of operations, if a reclassification is required in its entirety in one reporting period. The ASU is effective for interim and annual periods beginning after December 15, 2012. Our adoption of the ASU is not expected to have a significant impact on our consolidated financial statements.
72
Table of Contents
ITEM 7A. QUANTITATIVE AND QUALITATIVE DISCLOSURES ABOUT MARKET RISK
We are exposed to certain market risks as part of our ongoing business operations. Primary exposure includes changes in interest rates because borrowings under our revolving credit agreement bears interest at floating rates based on the LIBOR rate plus a specified margin. We manage our interest rate risk by balancing our amount of fixed-rate and floating-rate debt. For fixed-rate debt, interest rate changes do not affect our earnings or cash flows. Conversely, for floating-rate debt, interest rate changes generally impact our earnings and cash flows, assuming other factors are held constant.
Changes in economic conditions could result in higher interest rates, thereby increasing our interest expense and other operating expenses and reducing our funds available for capital investment, operations or other purposes. In addition, we must use a substantial portion of our cash flow to service debt, which may affect our ability to make future acquisitions or capital expenditures. We may experience economic loss and a negative impact on earnings or net assets as a result of interest rate fluctuations. A hypothetical 10% change in our interest rate would have changed interest incurred for the year ended December 31, 2012 and December 31, 2011 by $0.2 million and $0.2 million, respectively.
73
Table of Contents
ITEM 8. FINANCIAL STATEMENTS AND SUPPLEMENTARY DATA
SOLARCITY CORPORATION
INDEX TO CONSOLIDATED FINANCIAL STATEMENTS
| Page | ||||
| 75 | ||||
| 76 | ||||
| 78 | ||||
| Consolidated Statements of Convertible Redeemable Preferred Stock and Equity |
79 | |||
| 80 | ||||
| 82 | ||||
The supplementary data required by Item 8 is presented under Part II, Item 7 and is incorporated herein by reference.
74
Table of Contents
Report of Independent Registered Public Accounting Firm
The Board of Directors and Stockholders
SolarCity Corporation
We have audited the accompanying consolidated balance sheets of SolarCity Corporation as of December 31, 2012 and 2011, and the related consolidated statements of operations, convertible redeemable preferred stock and equity, and cash flows for each of the three years in the period ended December 31, 2012. These financial statements are the responsibility of the Company’s management. Our responsibility is to express an opinion on these financial statements based on our audits.
We conducted our audits in accordance with the standards of the Public Company Accounting Oversight Board (United States). Those standards require that we plan and perform the audit to obtain reasonable assurance about whether the financial statements are free of material misstatement. We were not engaged to perform an audit of the Company’s internal control over financial reporting. Our audits included consideration of internal control over financial reporting as a basis for designing audit procedures that are appropriate in the circumstances, but not for the purpose of expressing an opinion on the effectiveness of the Company’s internal control over financial reporting. Accordingly, we express no such opinion. An audit also includes examining, on a test basis, evidence supporting the amounts and disclosures in the financial statements, assessing the accounting principles used and significant estimates made by management, and evaluating the overall financial statement presentation. We believe that our audits provide a reasonable basis for our opinion.
In our opinion, the financial statements referred to above present fairly, in all material respects, the consolidated financial position of SolarCity Corporation as of December 31, 2012 and 2011, and the consolidated results of its operations and its cash flows for each of the three years in the period ended December 31, 2012, in conformity with U.S. generally accepted accounting principles.
/s/ Ernst & Young LLP
Redwood City, California
March 27, 2013
75
Table of Contents
Consolidated Balance Sheets
(In Thousands, Except Share Par Values)
| December 31, | ||||||||
| 2012 | 2011 | |||||||
| Assets |
||||||||
| Current assets: |
||||||||
| Cash and cash equivalents |
$ | 160,080 | $ | 50,471 | ||||
| Restricted cash |
7,516 | 1,796 | ||||||
| Accounts receivable (net of allowances for doubtful accounts of $220 and $176 as of December 31, 2012 and 2011, respectively) |
25,145 | 10,651 | ||||||
| Rebates receivable |
17,501 | 13,684 | ||||||
| Inventories |
87,903 | 142,742 | ||||||
| Deferred income tax asset |
5,770 | 4,306 | ||||||
| Prepaid expenses and other current assets |
11,502 | 17,872 | ||||||
|
|
|
|
|
|||||
| Total current assets |
315,417 | 241,522 | ||||||
| Restricted cash |
2,810 | 3,764 | ||||||
| Solar energy systems, leased and to be leased – net |
1,002,184 | 535,609 | ||||||
| Property and equipment – net |
18,635 | 14,421 | ||||||
| Other assets |
22,796 | 17,857 | ||||||
|
|
|
|
|
|||||
| Total assets(1) |
$ | 1,361,842 | $ | 813,173 | ||||
|
|
|
|
|
|||||
| Liabilities and equity |
||||||||
| Current liabilities: |
||||||||
| Accounts payable |
$ | 62,986 | $ | 162,586 | ||||
| Distributions payable to noncontrolling interests |
12,028 | 6,216 | ||||||
| Current portion of deferred U.S. Treasury grants income |
11,376 | 5,430 | ||||||
| Accrued and other current liabilities |
52,334 | 30,574 | ||||||
| Customer deposits |
8,753 | 13,933 | ||||||
| Current portion of deferred revenue |
31,516 | 13,504 | ||||||
| Borrowings under bank line of credit |
— | 5,582 | ||||||
| Current portion of long-term debt |
20,613 | 2,640 | ||||||
| Current portion of lease pass-through financing obligation |
13,622 | 6,060 | ||||||
| Current portion of sale-leaseback financing obligation |
389 | 361 | ||||||
|
|
|
|
|
|||||
| Total current liabilities |
213,617 | 246,886 | ||||||
| Deferred revenue, net of current portion |
204,396 | 101,359 | ||||||
| Long-term debt, net of current portion |
83,533 | 14,581 | ||||||
| Long-term deferred tax liability |
5,790 | 4,313 | ||||||
| Lease pass-through financing obligation, net of current portion |
125,884 | 46,541 | ||||||
| Sale-leaseback financing obligation, net of current portion |
14,755 | 15,144 | ||||||
| Deferred U.S. Treasury grants income, net of current portion |
286,884 | 132,004 | ||||||
| Convertible redeemable preferred stock warrant liabilities |
— | 5,325 | ||||||
| Other liabilities and deferred credits |
112,056 | 36,314 | ||||||
|
|
|
|
|
|||||
| Total liabilities(1) |
1,046,915 | 602,467 | ||||||
| Commitments and contingencies (Note 21) |
||||||||
| Convertible redeemable preferred stock: |
||||||||
| Convertible redeemable preferred stock, $0.0001 par value – authorized, 100,000 and 47,042 shares as of December 31, 2012 and 2011, respectively; issued and outstanding, 0 and 41,893 as of December 31, 2012 and 2011, respectively; aggregate liquidation value of $0 and $122,751 as of December 31, 2012 and 2011, respectively |
— | 125,722 | ||||||
| Stockholders’ equity: |
||||||||
| Common stock, $0.0001 par value – authorized, 1,000,000 and 75,000 shares as of December 31, 2012 and 2011, respectively; issued and outstanding, 74,913 and 10,465 as of December 31, 2012 and 2011, respectively |
7 | 1 | ||||||
| Additional paid-in capital |
325,705 | 9,538 | ||||||
| Accumulated deficit |
(111,392 | ) | (47,201 | ) | ||||
|
|
|
|
|
|||||
| Total stockholders’ equity (deficit) |
214,320 | (37,662 | ) | |||||
| Noncontrolling interests in subsidiaries |
100,607 | 122,646 | ||||||
|
|
|
|
|
|||||
| Total equity |
314,927 | 84,984 | ||||||
|
|
|
|
|
|||||
| Total liabilities, convertible redeemable preferred stock and equity |
$ | 1,361,842 | $ | 813,173 | ||||
|
|
|
|
|
|||||
76
Table of Contents
| (1) | The Company’s consolidated assets as of December 31, 2012 and 2011 include $562,531 and $317,225, respectively, being assets of variable interest entities, or VIEs, that can only be used to settle obligations of the VIEs. These assets include solar energy systems, leased and to be leased, net, of $530,230 and $301,573 as of December 31, 2012 and 2011, respectively; cash and cash equivalents of $16,065 and $7,070 as of December 31, 2012 and 2011; accounts receivable, net, of $1,681 and $632 as of December 31, 2012 and 2011; prepaid expenses and other assets of $2,603 and $5,056 as of December 31, 2012 and 2011; rebates receivable of $8,985 and $2,894 as of December 31, 2012 and 2011. The Company’s consolidated liabilities as of December 31, 2012 and 2011 included $19,853 and $9,840, respectively, being liabilities of VIEs whose creditors have no recourse to the Company. These liabilities include distributions payable to noncontrolling interests of $12,028 and $6,216 as of December 31, 2012 and 2011; customer deposits of $4,162 and $2,804 as of December 31, 2012 and 2011; accounts payable of $9 and $31 as of December 31, 2012 and 2011; accrued and other payables of $938 and $789 as of December 31, 2012 and 2011 and bank borrowings of $2,716 and $0 as of December 31, 2012 and 2011. |
| See further description in Note 12, Solar Financing Funds. |
See accompanying notes.
77
Table of Contents
Consolidated Statements of Operations
(In Thousands, Except Share and Per Share Amounts)
| Year Ended December 31, | ||||||||||||
| 2012 | 2011 | 2010 | ||||||||||
| (in thousands, except share and per share data) | ||||||||||||
| Revenue: |
||||||||||||
| Operating leases |
$ | 47,616 | $ | 23,145 | $ | 9,684 | ||||||
| Solar energy systems sales |
81,046 | 36,406 | 22,744 | |||||||||
|
|
|
|
|
|
|
|||||||
| Total revenue |
128,662 | 59,551 | 32,428 | |||||||||
| Cost of revenue: |
||||||||||||
| Operating leases |
13,346 | 5,718 | 3,191 | |||||||||
| Solar energy systems |
64,429 | 41,418 | 26,953 | |||||||||
|
|
|
|
|
|
|
|||||||
| Total cost of revenue |
77,775 | 47,136 | 30,144 | |||||||||
|
|
|
|
|
|
|
|||||||
| Gross profit |
50,887 | 12,415 | 2,284 | |||||||||
| Operating expenses: |
||||||||||||
| Sales and marketing |
69,392 | 42,004 | 22,404 | |||||||||
| General and administrative |
50,355 | 31,664 | 19,227 | |||||||||
|
|
|
|
|
|
|
|||||||
| Total operating expenses |
119,747 | 73,668 | 41,631 | |||||||||
|
|
|
|
|
|
|
|||||||
| Loss from operations |
(68,860 | ) | (61,253 | ) | (39,347 | ) | ||||||
| Interest expense, net |
20,142 | 9,272 | 4,901 | |||||||||
| Other expense, net |
2,519 | 3,097 | 2,761 | |||||||||
|
|
|
|
|
|
|
|||||||
| Loss before income taxes |
(91,521 | ) | (73,622 | ) | (47,009 | ) | ||||||
| Income tax provision |
(54 | ) | (92 | ) | (65 | ) | ||||||
|
|
|
|
|
|
|
|||||||
| Net loss |
(91,575 | ) | (73,714 | ) | (47,074 | ) | ||||||
| Net loss attributable to noncontrolling interests |
(27,384 | ) | (117,230 | ) | (8,457 | ) | ||||||
|
|
|
|
|
|
|
|||||||
| Net (loss) income attributable to stockholders |
$ | (64,191 | ) | $ | 43,516 | $ | (38,617 | ) | ||||
|
|
|
|
|
|
|
|||||||
| Net income (loss) attributable to common stockholders |
||||||||||||
| Basic |
$ | (74,282 | ) | $ | 8,225 | $ | (38,617 | ) | ||||
| Diluted |
$ | (74,559 | ) | $ | 10,989 | $ | (38,617 | ) | ||||
| Net income (loss) per share attributable to common stockholders |
||||||||||||
| Basic |
$ | (5.22 | ) | $ | 0.82 | $ | (4.50 | ) | ||||
| Diluted |
$ | (5.23 | ) | $ | 0.76 | $ | (4.50 | ) | ||||
| Weighted average shares used to compute net income (loss) per share attributable to common stockholders |
||||||||||||
| Basic |
14,240,187 | 9,977,646 | 8,583,772 | |||||||||
| Diluted |
14,267,767 | 14,523,734 | 8,583,772 | |||||||||
See accompanying notes.
78
Table of Contents
Consolidated Statements of Convertible Redeemable Preferred Stock and Equity
(In Thousands, Except Per Share Amounts)
| Convertible Redeemable Preferred Stock |
Common Stock | Additional Paid-In Capital |
Accumulated Deficit |
Total Stockholders’ Deficit |
Noncontrolling Interests in Subsidiaries |
Total Equity |
||||||||||||||||||||||||||||||
| Shares | Amount | Shares | Amount | |||||||||||||||||||||||||||||||||
| Balance, January 1, 2010 |
36,011 | 80,042 | 8,493 | — | 1,364 | (52,100 | ) | (50,736 | ) | 56,036 | 5,300 | |||||||||||||||||||||||||
| Issuance of common stock upon exercise of stock options for cash |
— | — | 450 | — | 92 | — | 92 | — | 92 | |||||||||||||||||||||||||||
| Contributions from noncontrolling interests |
— | — | — | — | — | — | — | 97,082 | 97,082 | |||||||||||||||||||||||||||
| Vested portion of restricted common stock issued to a board member |
— | — | 6 | — | — | — | — | — | — | |||||||||||||||||||||||||||
| Stock-based compensation expense |
— | — | — | — | 1,773 | — | 1,773 | — | 1,773 | |||||||||||||||||||||||||||
| Issuance of Series E-1 convertible redeemable preferred stock at $6.25 per share, net of issuance cost of $96 |
3,440 | 21,404 | — | — | — | — | — | — | — | |||||||||||||||||||||||||||
| Net loss |
— | — | — | — | — | (38,617 | ) | (38,617 | ) | (8,457 | ) | (47,074 | ) | |||||||||||||||||||||||
| Distributions to noncontrolling interests |
— | — | — | — | — | — | — | (21,147 | ) | (21,147 | ) | |||||||||||||||||||||||||
|
|
|
|
|
|
|
|
|
|
|
|
|
|
|
|
|
|
|
|||||||||||||||||||
| Balance, December 31, 2010 |
39,451 | 101,446 | 8,949 | — | 3,229 | (90,717 | ) | (87,488 | ) | 123,514 | 36,026 | |||||||||||||||||||||||||
| Issuance of common stock upon exercise of stock options for cash |
— | — | 1,489 | 1 | 1,089 | — | 1,090 | — | 1,090 | |||||||||||||||||||||||||||
| Contributions from noncontrolling interests |
— | — | — | — | — | — | — | 207,970 | 207,970 | |||||||||||||||||||||||||||
| Issuance of common stock to a consultant |
— | — | 7 | — | 12 | — | 12 | — | 12 | |||||||||||||||||||||||||||
| Donations of common stock to a charitable organization |
— | — | 20 | — | 119 | — | 119 | — | 119 | |||||||||||||||||||||||||||
| Stock-based compensation expense |
— | — | — | — | 5,039 | — | 5,039 | — | 5,039 | |||||||||||||||||||||||||||
| Income tax effect of stock-based compensation |
— | — | — | — | 50 | — | 50 | — | 50 | |||||||||||||||||||||||||||
| Issuance of Series C convertible redeemable preferred stock upon exercise of warrants |
375 | 4,576 | — | — | — | — | — | — | — | |||||||||||||||||||||||||||
| Issuance of Series F convertible redeemable preferred stock at $9.68 per share, net of issuance cost of $93 |
2,067 | 19,700 | — | — | — | — | — | — | — | |||||||||||||||||||||||||||
| Net income (loss) |
— | — | — | — | — | 43,516 | 43,516 | (117,230 | ) | (73,714 | ) | |||||||||||||||||||||||||
| Distributions to noncontrolling interests |
— | — | — | — | — | — | — | (91,608 | ) | (91,608 | ) | |||||||||||||||||||||||||
|
|
|
|
|
|
|
|
|
|
|
|
|
|
|
|
|
|
|
|||||||||||||||||||
| Balance, December 31, 2011 |
41,893 | $ | 125,722 | 10,465 | $ | 1 | $ | 9,538 | $ | (47,201 | ) | $ | (37,662 | ) | $ | 122,646 | $ | 84,984 | ||||||||||||||||||
| Issuance of common stock upon exercise of stock options for cash |
— | — | 902 | — | 1,724 | — | 1,724 | — | 1,724 | |||||||||||||||||||||||||||
| Contributions from noncontrolling interests |
— | — | — | — | — | — | — | 161,426 | 161,426 | |||||||||||||||||||||||||||
| Stock-based compensation expense |
— | — | — | — | 10,734 | — | 10,734 | — | 10,734 | |||||||||||||||||||||||||||
| Issuance of Series C convertible redeemable preferred stock upon exercise of warrants |
113 | 1,480 | — | — | — | — | — | — | — | |||||||||||||||||||||||||||
| Issuance of Series F convertible redeemable preferred stock upon exercise of warrants |
8 | 150 | — | — | — | — | — | — | — | |||||||||||||||||||||||||||
| Issuance of Series G convertible redeemable preferred stock at $23.92 per share, net of issuance cost of $132 |
3,387 | 81,218 | — | — | — | — | — | — | — | |||||||||||||||||||||||||||
| Issuance of common stock from initial public offering of common stock, net of underwriters discount and commissions and issuance cost of $12,895 |
— | — | 13,160 | 1 | 92,385 | — | 92,386 | — | 92,386 | |||||||||||||||||||||||||||
| Conversion of convertible redeemable preferred stock to common stock upon initial public offering of common stock |
(45,401 | ) | (208,570 | ) | 50,386 | 5 | 208,565 | — | 208,570 | — | 208,570 | |||||||||||||||||||||||||
| Conversion of convertible redeemable preferred stock warrants to common warrants upon initial public offering of common stock |
— | — | — | — | 5,821 | — | 5,821 | — | 5,821 | |||||||||||||||||||||||||||
| Net loss |
— | — | — | — | — | (64,191 | ) | (64,191 | ) | (27,384 | ) | (91,575 | ) | |||||||||||||||||||||||
| Distributions to noncontrolling interests |
— | — | — | — | — | — | — | (150,305 | ) | (150,305 | ) | |||||||||||||||||||||||||
| Acquisition of noncontrolling interest in subsidiaries |
— | — | — | — | (3,062 | ) | — | (3,062 | ) | (5,776 | ) | (8,838 | ) | |||||||||||||||||||||||
|
|
|
|
|
|
|
|
|
|
|
|
|
|
|
|
|
|
|
|||||||||||||||||||
| Balance, December 31, 2012 |
— | — | 74,913 | $ | 7 | $ | 325,705 | $ | (111,392 | ) | $ | 214,320 | $ | 100,607 | $ | 314,927 | ||||||||||||||||||||
|
|
|
|
|
|
|
|
|
|
|
|
|
|
|
|
|
|
|
|||||||||||||||||||
See accompanying notes.
79
Table of Contents
Consolidated Statements of Cash Flows
(In Thousands)
| Year Ended December 31, | ||||||||||||
| 2012 | 2011 | 2010 | ||||||||||
| Operating activities: |
||||||||||||
| Net loss |
$ | (91,575 | ) | $ | (73,714 | ) | $ | (47,074 | ) | |||
| Adjustments to reconcile net loss to net cash provided by (used in) operating activities: |
||||||||||||
| Loss on disposal of property and equipment |
17 | 336 | 26 | |||||||||
| Depreciation and amortization net of amortization of deferred U.S. Treasury grant income |
21,008 | 12,338 | 5,733 | |||||||||
| Interest on lease pass-through financing obligation |
12,001 | 7,373 | 3,285 | |||||||||
| Stock-based compensation |
10,734 | 5,101 | 1,773 | |||||||||
| Donations of common stock to a charitable organization |
— | 119 | — | |||||||||
| Revaluation of convertible redeemable preferred stock warrants |
1,898 | 2,050 | 1,998 | |||||||||
| Revaluation of preferred stock forward contract |
350 | — | — | |||||||||
| Deferred income taxes |
13 | 7 | — | |||||||||
| Reduction in lease pass-through financing obligation |
(16,159 | ) | (23,528 | ) | (7,421 | ) | ||||||
| Changes in operating assets and liabilities: |
||||||||||||
| Restricted cash |
(864 | ) | (3,018 | ) | (1,842 | ) | ||||||
| Accounts receivable |
(14,494 | ) | (7,172 | ) | (1,259 | ) | ||||||
| Rebates receivable |
(3,817 | ) | (4,933 | ) | 3,339 | |||||||
| Inventories |
54,839 | (111,150 | ) | (15,964 | ) | |||||||
| Prepaid expenses and other current assets |
7,914 | (6,945 | ) | (5,417 | ) | |||||||
| Other assets |
(4,939 | ) | (6,361 | ) | (7,989 | ) | ||||||
| Accounts payable |
(99,600 | ) | 118,875 | 19,999 | ||||||||
| Accrued and other liabilities |
67,138 | 29,460 | 22,365 | |||||||||
| Customer deposits |
(5,180 | ) | 10,943 | 2,478 | ||||||||
| Deferred revenue |
121,049 | 68,301 | 22,152 | |||||||||
|
|
|
|
|
|
|
|||||||
| Net cash provided by (used in) operating activities |
60,333 | 18,082 | (3,818 | ) | ||||||||
| Investing activities: |
||||||||||||
| Payments for the cost of solar energy systems, leased and to be leased |
(440,692 | ) | (292,933 | ) | (156,495 | ) | ||||||
| Purchase of property and equipment |
(8,367 | ) | (8,772 | ) | (6,300 | ) | ||||||
| Acquisition of business, net of cash acquired |
— | (2,547 | ) | (67 | ) | |||||||
|
|
|
|
|
|
|
|||||||
| Net cash used in investing activities |
(449,059 | ) | (304,252 | ) | (162,862 | ) | ||||||
| Financing activities: |
||||||||||||
| Investment fund financings and bank borrowings: |
||||||||||||
| Borrowings under long-term debt |
133,386 | 17,270 | 1,292 | |||||||||
| Repayments of long-term debt |
(52,299 | ) | (3,158 | ) | (1,014 | ) | ||||||
| Borrowings under bank line of credit |
19,418 | 5,582 | — | |||||||||
| Repayments of bank line of credit |
(25,000 | ) | (4,495 | ) | — | |||||||
| Proceeds from sale-leaseback financing obligation |
— | — | 18,266 | |||||||||
| Repayments of sale-leaseback financing obligation |
(361 | ) | (574 | ) | (7,603 | ) | ||||||
| Proceeds from lease pass-through financing obligation |
145,846 | 64,135 | 61,106 | |||||||||
| Repayment of capital lease obligations |
(28,442 | ) | (7,323 | ) | — | |||||||
| Proceeds from investment by noncontrolling interests in subsidiaries |
161,426 | 207,970 | 97,082 | |||||||||
| Distributions paid to noncontrolling interest in a subsidiary |
(144,493 | ) | (88,636 | ) | (25,039 | ) | ||||||
| Proceeds from U.S. Treasury grants |
113,648 | 65,513 | 20,084 | |||||||||
|
|
|
|
|
|
|
|||||||
| Net cash provided by financing activities before equity issuances |
323,129 | 256,284 | 164,174 | |||||||||
| Equity issuances: |
||||||||||||
| Proceeds from issuance of common stock |
92,386 | — | — | |||||||||
| Proceeds from exercise of stock options |
1,724 | 1,090 | 92 | |||||||||
| Proceeds from exercise of convertible redeemable preferred stock warrants |
228 | — | — | |||||||||
| Proceeds from issuance of convertible redeemable preferred stock warrants |
— | 1,297 | 1,368 | |||||||||
| Proceeds from issuance of convertible redeemable preferred stock |
80,868 | 19,700 | 21,404 | |||||||||
|
|
|
|
|
|
|
|||||||
| Net cash provided by equity issuances |
175,206 | 22,087 | 22,864 | |||||||||
|
|
|
|
|
|
|
|||||||
| Net cash provided by financing activities |
498,335 | 278,371 | 187,038 | |||||||||
|
|
|
|
|
|
|
|||||||
| Net increase (decrease) in cash and cash equivalents |
109,609 | (7,799 | ) | 20,358 | ||||||||
| Cash and cash equivalents, beginning of period |
50,471 | 58,270 | 37,912 | |||||||||
|
|
|
|
|
|
|
|||||||
| Cash and cash equivalents, end of period |
$ | 160,080 | $ | 50,471 | $ | 58,270 | ||||||
|
|
|
|
|
|
|
|||||||
80
Table of Contents
| Year Ended December 31, | ||||||||||||
| 2012 | 2011 | 2010 | ||||||||||
| Supplemental disclosures of cash flow information |
||||||||||||
| Cash paid during the period for interest |
$ | 6,710 | $ | 2,841 | $ | 1,474 | ||||||
|
|
|
|
|
|
|
|||||||
| Cash paid during the period for taxes |
$ | 2,689 | $ | 91 | $ | 3,018 | ||||||
|
|
|
|
|
|
|
|||||||
| Noncash investing and financing activities |
||||||||||||
| Conversion of convertible redeemable preferred stock warrants to convertible redeemable preferred stock |
$ | — | $ | 4,576 | $ | — | ||||||
|
|
|
|
|
|
|
|||||||
| Conversion of convertible redeemable preferred stock upon initial public offering of common stock |
$ | 208,570 | $ | — | $ | — | ||||||
|
|
|
|
|
|
|
|||||||
| Conversion of convertible redeemable preferred stock warrants to common stock warrants upon initial public offering of common stock |
$ | 5,821 | $ | — | $ | — | ||||||
|
|
|
|
|
|
|
|||||||
See accompanying notes.
81
Table of Contents
Notes to Consolidated Financial Statements
1. Organization
SolarCity Corporation, or “the Company”, was incorporated as a Delaware corporation on June 21, 2006. The Company is engaged in the design, installation and sale or lease of solar energy systems to residential and commercial customers, or sale of electricity generated by solar energy systems to customers. The Company also offers energy efficiency solutions and services aimed at improving residential energy efficiency and lowering overall residential energy costs to its customers. The Company’s headquarters are located in San Mateo, California.
2. Summary of Significant Accounting Policies and Procedures
Basis of Presentation and Principles of Consolidation
The consolidated financial statements have been prepared in conformity with U.S. generally accepted accounting principles, or GAAP, and reflect the accounts and operations of the Company and those of its subsidiaries in which the Company has a controlling financial interest. In accordance with the provisions of Financial Accounting Standards Board, or FASB, Accounting Standards Codification Section 810, or ASC, 810, Consolidation, the Company consolidates any variable interest entity, or VIE, of which it is the primary beneficiary. The typical condition for a controlling financial interest ownership is holding a majority of the voting interests of an entity; however, a controlling financial interest may also exist in entities, such as variable interest entities, through arrangements that do not involve controlling voting interests. ASC 810 requires a variable interest holder to consolidate a VIE if that party has the power to direct the activities of a VIE that most significantly impact the VIE’s economic performance, and the obligation to absorb losses of the VIE that could potentially be significant to the VIE or the right to receive benefits from the VIE that could potentially be significant to the VIE. The Company does not consolidate a VIE in which it has a majority ownership interest when the Company is not considered the primary beneficiary. The Company has determined that it is the primary beneficiary in a number of VIEs—refer to Note 12, Solar Financing Funds. The Company evaluates its relationships with the VIEs on an ongoing basis to ensure that it continues to be the primary beneficiary. All intercompany transactions and balances have been eliminated in consolidation.
Use of Estimates
The preparation of the consolidated financial statements requires management to make estimates and assumptions that affect the amounts reported in the consolidated financial statements and accompanying notes. The Company regularly makes significant estimates and assumptions including, but not limited to, the estimates which affect the estimated selling price of undelivered elements for revenue recognition purposes, the collectibility of accounts receivable, the valuation of inventories, the estimated total costs for long-term contracts used as a basis of determining percentage of completion for such contracts, the estimated fair value and residual values of solar energy systems subject to leases, the useful lives of solar energy systems, property and equipment and intangible assets, the determination of accrued liabilities, accounting for business combinations, the valuation of convertible redeemable preferred stock warrants, the valuation of stock-based compensation, and the determination of valuation allowances associated with deferred tax assets. The Company bases its estimates on historical experience and on various other assumptions believed to be reasonable, the results of which form the basis for making judgments about the carrying values of assets and liabilities. Actual results could differ materially from those estimates.
Cash and Cash Equivalents
The Company considers all highly liquid investments with maturities of three months or less at the time of purchase to be cash equivalents. The Company maintains cash and cash equivalents, which consist principally of demand deposits with high-credit-quality financial institutions. The Company has exposure to credit risk to the
82
Table of Contents
SolarCity Corporation
Notes to Consolidated Financial Statements (continued)
extent cash and cash equivalent balances, including restricted cash, exceed amounts covered by federal deposit insurance. The Company believes that its credit risk is not significant.
Restricted Cash
Restricted cash represents balances collateralizing standby letters of credit, outstanding credit card borrowing facilities and obligations under certain operating leases. Restricted cash also includes cash received by the Company on behalf of certain investors that is yet to be remitted to the investors.
Accounts Receivable
Accounts receivable primarily represent trade receivables from sales of residential and commercial customers recorded at net realizable value. The Company maintains an allowance for doubtful accounts to reserve for potentially uncollectible accounts receivable. The Company reviews its accounts receivable by aging category to identify significant customers with known disputes or collection issues. In determining the allowance, the Company makes judgments about the creditworthiness of a majority of its customers based on ongoing credit evaluations. The Company also considers its historical level of credit losses and current economic trends that might impact the level of future credit losses. The Company writes off accounts receivable when they are deemed uncollectible.
Rebates Receivable
Rebates receivable represent rebates due from utility companies and government agencies. These receivables include rebates that have been assigned to the Company by its cash customers on state-approved solar energy system installations sold to the customers, and also uncollected incentives from state and local government agencies for solar energy system installations that have been leased to customers or are used to generate and sell electricity to customers under power purchase agreements. For the rebates assigned to the Company by its customers, the Company assumes the responsibility for collection of the rebate. The processing cycle for these rebates and incentives involves a multi-step process in which the Company accumulates and submits information required by the utility company or state agency necessary for the collection of the rebate. The entire process typically can take up to several months to complete. The Company recognizes rebates receivable upon the solar energy system passing inspection by the responsible city department after completion of system installation.
Concentrations of Risk
Financial instruments which potentially subject the Company to concentrations of credit risk consist primarily of cash and cash equivalents, accounts receivable, and rebates receivable. The associated risk of concentration for cash and cash equivalents is mitigated by banking with creditworthy institutions. At certain times, amounts on deposit exceed Federal Deposit Insurance Corporation insurance limits. The Company does not require collateral or other security to support accounts receivable. To reduce credit risk, management performs periodic credit evaluations and ongoing evaluations of its customers’ financial condition. Rebates receivable are due from various states and local governments as well as various utility companies. The Company considers the risk of uncollectability of such amounts to be low.
Fair Value of Financial Instruments
ASC 820, Fair Value Measurements, clarifies that fair value is an exit price, representing the amount that would be received to sell an asset or paid to transfer a liability in an orderly transaction between market participants. As such, fair value is a market-based measurement that should be determined based on assumptions that market participants would use in pricing an asset or liability.
83
Table of Contents
SolarCity Corporation
Notes to Consolidated Financial Statements (continued)
ASC 820 requires that the valuation techniques used to measure fair value must maximize the use of observable inputs and minimize the use of unobservable inputs. ASC 820 establishes a three tier value hierarchy, which prioritizes inputs that may be used to measure fair value as follows:
| • | Level 1—Observable inputs that reflect quoted prices for identical assets or liabilities in active markets. |
| • | Level 2—Observable inputs other than Level 1 prices, such as quoted prices for similar assets or liabilities; quoted prices in markets that are not active; or other inputs that are observable or can be corroborated by observable market data for substantially the full term of the assets or liabilities. |
| • | Level 3—Unobservable inputs that are supported by little or no market activity and that are significant to the fair value of the assets or liabilities. |
As of December 31, 2012 and 2011, there were no nonrecurring fair value measurements of assets and liabilities subsequent to initial recognition.
The following table sets forth the fair value of the Company’s financial assets and liabilities measured at fair value on a recurring basis as of December 31, 2012 and 2011, based on the three-tier fair value hierarchy (in thousands):
| Level 1 | Level 2 | Level 3 | Total | |||||||||||||
| As of December 31, 2012: |
||||||||||||||||
| Liabilities: |
||||||||||||||||
| Convertible redeemable preferred stock warrants |
$ | — | $ | — | $ | — | $ | — | ||||||||
|
|
|
|
|
|
|
|
|
|||||||||
| As of December 31, 2011: |
||||||||||||||||
| Liabilities: |
||||||||||||||||
| Convertible redeemable preferred stock warrants |
$ | — | $ | — | $ | 5,325 | $ | 5,325 | ||||||||
|
|
|
|
|
|
|
|
|
|||||||||
The fair value of the convertible redeemable preferred stock warrants is based on unobservable inputs. Such instruments are generally classified within Level 3 of the fair value hierarchy. The Company estimated the fair value of the warrants using an option-pricing model incorporating assumptions that market participants would use in their estimates of fair value. Some of these assumptions include estimates for interest rates, expected dividends, and the fair value of the underlying preferred stock. The estimated fair value of the underlying preferred stock is itself determined using an option-pricing method. Under this method, the fair value of an enterprise’s common stock is estimated as the net value of a series of call options, representing the present value of the expected future returns to the stockholders.
Upon the closing of the Company’s initial public offering of its common stock on December 18, 2012, the outstanding Series E convertible redeemable preferred stock warrants converted into common stock warrants, and the fair value of these warrants was credited to equity, while the outstanding Series F convertible redeemable preferred stock warrants expired unexercised.
Refer to Convertible Redeemable Preferred Stock Warrant Liabilities section of this Note 2 for the reconciliation of beginning and ending fair value balances.
The Company’s other financial instruments include customer deposits, distributions payable to noncontrolling interests, borrowings under lines of credit and long-term debt facilities. The carrying values of its financial instruments other than its long-term debt approximate their fair values due to the fact that they are short-term in nature at December 31, 2012 and 2011 (Level 1). The Company estimates the fair value of its long-term debt based upon rates currently offered for debt of similar maturities and terms (Level 3). The Company has estimated the fair value of its long-term debt to approximate its carrying value.
84
Table of Contents
SolarCity Corporation
Notes to Consolidated Financial Statements (continued)
Inventories
Inventories include raw materials that include photovoltaic panels, inverters, and mounting hardware as well as miscellaneous electrical components, and work in process that includes raw materials partially installed, along with direct and indirect capitalized installation costs. Raw materials and work-in-process are stated at the lower of cost or market (on a first-in-first-out basis). Work-in-process primarily relates to solar energy systems that will be sold to customers, which are under construction and are yet to pass inspection.
The Company also evaluates its inventory reserves on a quarterly basis and writes down the value of inventories for estimated excess and obsolete inventories based upon assumptions about future demand and market conditions.
Solar Energy Systems, Leased and To Be Leased
The Company is the operating lessor of the solar energy systems under leases that qualify as operating leases. The Company accounts for the leases in accordance with ASC 840, Leases. To determine lease classification, the Company evaluates lease terms to determine whether there is a transfer of ownership or bargain purchase option at the end of the lease, whether the lease term is greater than 75% of the useful life, or whether the present value of minimum lease payments exceed 90% of the fair value at lease inception. The Company utilizes periodic appraisals to estimate useful life and fair values at lease inception, and residual values at lease termination. Solar energy systems are stated at cost, less accumulated depreciation and amortization.
Depreciation and amortization is calculated using the straight-line method over the estimated useful lives of the respective assets as follows.
| Useful Lives | ||
| Solar energy systems leased to customers |
30 years | |
| Initial direct costs related to solar energy systems leased to customers |
Lease term (10 to 20 years) |
Solar energy systems held for lease to customers are installed systems pending interconnection with the respective utility companies and will be depreciated as solar energy systems leased to customers when the respective systems have been interconnected and placed in service.
Solar energy systems under construction represents systems that are under installation, which will be depreciated as solar energy systems leased to customers when the respective systems are completed, interconnected and subsequently leased to customers.
Initial direct costs related to solar energy systems leased to customers are capitalized and amortized over the term of the related customer lease agreements.
Presentation of Cash Flows Associated with Solar Energy Systems
The Company discloses cash flows associated with solar energy systems in accordance with ASC 230, Statement of Cash Flows. The Company determines the appropriate classification of cash payments related to solar energy systems depending on the activity that is likely to be the predominant source of cash flows for the item being paid for. Accordingly, the Company presents payments made in a period for costs incurred to install solar energy systems that will be leased to customers, including the payments for cost of the inventory that is utilized in such systems, as investing activities in the consolidated statement of cash flows. Payments made for inventory that will be utilized for solar energy systems that will be sold to customers are presented as cash flows from operations in the consolidated statement of cash flows.
85
Table of Contents
SolarCity Corporation
Notes to Consolidated Financial Statements (continued)
Property and Equipment
Property and equipment, including leasehold improvements, are stated at cost, less accumulated depreciation and amortization.
Depreciation and amortization is calculated using the straight-line method over the estimated useful lives of the respective assets as follows.
| Useful Lives | ||
| Furniture and fixtures |
7 years | |
| Vehicles |
5 years | |
| Computer hardware and software |
5 years |
Leasehold improvements are amortized over the shorter of the lease term or their estimated useful lives, currently seven years.
Repairs and maintenance costs are expensed as incurred.
Upon disposition, the cost and related accumulated depreciation of the assets are removed from property and equipment and the resulting gain or loss is reflected in the consolidated statements of operations.
Impairment of Long-Lived Assets
In accordance with ASC 360, Property, Plant, and Equipment, the Company evaluates long-lived assets for impairment whenever events or changes in circumstances indicate that the carrying amount of an asset or group of assets, as appropriate, may not be recoverable. When the sum of the undiscounted future net cash flows expected to result from the use and the eventual disposition is less than the carrying amounts, an impairment loss would be measured based on the discounted cash flows compared to the carrying amounts. There was no impairment charge recorded for the years ended December 31, 2012, 2011 or 2010.
Capitalization of Software Costs
For costs incurred in development of internal use software, the Company capitalizes costs incurred during the application development stage. Costs related to preliminary project activities and post implementation activities are expensed as incurred. Internal-use software is amortized on a straight-line basis over its estimated useful life. The Company evaluates the useful lives of these assets on an annual basis and tests for impairment whenever events or changes in circumstances occur that could impact the recoverability of these assets. To date the Company has not incurred any significant costs on internally developed software and all costs incurred to date have been expensed as incurred.
86
Table of Contents
SolarCity Corporation
Notes to Consolidated Financial Statements (continued)
Warranties
The Company warrants its products for various periods against defects in material or installation workmanship. The Company generally provides a warranty on the generating and nongenerating parts of the solar energy systems it sells of typically between five to twenty years. The manufacturer’s warranty on the solar energy systems components, which is typically passed through to these customers, has a warranty period ranging from one to twenty five years. The changes in accrued warranty balance, recorded as a component of accrued liabilities on the consolidated balance sheets consisted of the following (in thousands):
| As of and for
the Year Ended December 31, |
||||||||
| 2012 | 2011 | |||||||
| Balance – beginning of the period |
$ | 2,462 | $ | 1,704 | ||||
| Provision charged to warranty expense |
1,773 | 531 | ||||||
| Assumed warranty obligation arising from business acquisitions (Note 3) |
— | 349 | ||||||
| Less warranty claims |
(216 | ) | (122 | ) | ||||
|
|
|
|
|
|||||
| Balance – end of the period |
$ | 4,019 | $ | 2,462 | ||||
|
|
|
|
|
|||||
Solar Energy Systems Performance Guarantees
The Company guarantees certain specified minimum solar energy production output for systems leased to customers. The Company monitors the solar energy systems to ensure that these outputs are being achieved. The Company evaluates if any amounts are due to its customers. As of December 31, 2012 and 2011, the Company recorded liabilities of $0.6 million and $0, respectively, as accrued and other current liabilities in the consolidated financial statements relating to these guarantees based on the Company’s assessment of its exposure.
87
Table of Contents
SolarCity Corporation
Notes to Consolidated Financial Statements (continued)
Convertible Redeemable Preferred Stock Warrant Liabilities
Freestanding warrants to acquire shares that may be redeemable are accounted for in accordance with ASC 480, Distinguishing Liabilities from Equity. Under ASC 480, freestanding warrants to purchase the Company’s convertible redeemable preferred stock were classified as a liability on the consolidated balance sheets and carried at fair value because the warrants may conditionally obligate the Company to transfer assets at some point in the future. The Company initially measured the warrants at fair value on issuance. The warrants were subject to remeasurement to fair value at each balance sheet date, and any change in their fair value is recognized as a component of other expense, net, in the consolidated statements of operations. The Company continued to adjust the liability for changes in fair value until the closing of the Company’s initial public offering of its common stock, upon which the outstanding convertible redeemable preferred stock warrants either expired unexercised or converted to common stock warrants. The fair value of the preferred stock warrants that converted to common stock warrants was transferred to additional paid in capital. The changes in the value of the convertible redeemable preferred stock warrant liabilities were as follows (in thousands):
| Fair value as of January 1, 2010 |
3,188 | |||
| Issuances |
1,368 | |||
| Change in fair value |
1,998 | |||
|
|
|
|||
| Fair value as of December 31, 2010 |
6,554 | |||
| Issuances |
1,297 | |||
| Exercises |
(4,576 | ) | ||
| Change in fair value |
2,050 | |||
|
|
|
|||
| Fair value as of December 31, 2011 |
5,325 | |||
| Exercises |
(1,402 | ) | ||
| Change in fair value |
1,898 | |||
| Conversion to common stock warrants |
(5,821 | ) | ||
|
|
|
|||
| Fair value as of December 31, 2012 |
$ | — | ||
|
|
|
88
Table of Contents
SolarCity Corporation
Notes to Consolidated Financial Statements (continued)
Deferred U.S. Treasury Grant Income
The Company is eligible for U.S. Treasury grants received or receivable on eligible property as defined under Section 1603 of the American Recovery and Reinvestment Act of 2009, as amended by the Tax Relief Unemployment Insurance Reauthorization and Job Creation Act of December 2010, which includes solar energy system installations, upon approval by the U.S. Treasury Department. For solar energy systems under lease pass-through arrangements as described in Note 13, the Company reduces the financing obligation and records deferred income for the U.S. Treasury grants which are paid directly to the investors upon receipt of the grants by the investors. The benefit of the U.S. Treasury grants is recorded as deferred income and is amortized on a straight-line basis over the estimated useful lives of the related solar energy systems of 30 years. The amortization of the deferred income is recorded as a reduction to depreciation expense which is a component of the cost of revenue of operating leases in the consolidated statement of operations. A catch up adjustment is recorded in the period in which the grant is approved by the U.S. Treasury Department or received by lease pass-through investors to recognize the portion of the grant that matches proportionally the amortization for the period between the date of placement in service of the solar energy systems and approval by the U.S. Treasury Department or receipt by lease pass-through investors of the associated grant. The changes in deferred U.S. Treasury grant income during the year were as follows (in thousands):
| U.S. Treasury grant receipts in 2010 |
$ | 20,084 | ||
| Amortized during the year as a credit to depreciation expense |
(744 | ) | ||
|
|
|
|||
| Balance as of December 31, 2010 |
19,340 | |||
| U.S. Treasury grants received and receivable by the Company |
68,585 | |||
| U.S. Treasury grants received by investors under lease pass-through arrangements |
54,730 | |||
| Amortized during the year as a credit to depreciation expense |
(5,221 | ) | ||
|
|
|
|||
| Balance as of December 31, 2011 |
137,434 | |||
| U.S. Treasury grants received and receivable by the company |
112,520 | |||
| U.S. Treasury grants received by investors under lease pass-through arrangements |
58,685 | |||
| Amortized during the period as a credit to depreciation expense |
(10,379 | ) | ||
|
|
|
|||
| Balance as of December 31, 2012 |
$ | 298,260 | ||
|
|
|
There were no U.S. Treasury grants received or receivable prior to 2010. Of the balance outstanding as of December 31, 2012 and 2011, $286,884 and $132,004, respectively, are disclosed as noncurrent deferred Treasury grants income in the consolidated balance sheets.
Deferred Revenue
The Company records as deferred revenue any amounts that are collected from customers, including lease prepayments, in excess of revenue recognized. Deferred revenue also includes the portion of rebates and incentives received from utility companies and various local and state government agencies, which are recognized as revenue over the lease term, as well as the remote monitoring fee, which is recognized as revenue ratably over the respective contract term. As of December 31, 2012 and 2011, deferred revenue from rebates and incentives included in the deferred revenue balance in the consolidated balance sheet amounted to $114.1 million and $80.2 million, respectively.
Revenue Recognition
The Company provides design, installation, and ongoing remote monitoring services of solar energy systems to residential and commercial customers. Residential customers generally purchase solar energy systems from the Company under fixed-price contracts or lease Company-owned solar energy systems under lease agreements, which also include monitoring services. Commercial customers generally purchase solar energy systems from the Company
89
Table of Contents
SolarCity Corporation
Notes to Consolidated Financial Statements (continued)
under fixed-price contracts, purchase electricity generated by Company-owned solar energy systems under power purchase agreements, or lease Company-owned solar energy systems under lease agreements. The Company also earns rebates that have been assigned to the Company by its cash customers on state-approved system installations sold to the customers, as well rebates and incentives from utility companies and state and local governments on systems leased to customers or used to sell electricity to customers under power purchase agreements. The Company considers the proceeds from the rebates to comprise a portion of the proceeds from the sale or lease of the solar energy systems. The Company also offers energy efficiency solutions aimed at improving residential energy efficiency and lowering overall residential energy costs. The energy efficiency services comprise energy efficiency evaluations and upgrades to homes and household appliances to improve energy efficiency.
Solar Energy Systems Sales
For solar energy systems sold to customers, the Company recognizes revenue, net of any applicable governmental sales taxes, in accordance with ASC 605-25, Revenue Recognition—Multiple-Element Arrangements, and ASC 605-10-S99, Revenue Recognition—Overall—SEC Materials. Revenue from installation of a system is recognized when (1) persuasive evidence of an arrangement exists, (2) delivery has occurred or services have been rendered, (3) the sales price is fixed or determinable, and (4) collection of the related receivable is reasonably assured. The Company recognizes revenue upon the solar energy system passing an inspection by the responsible city department after completion of system installation for residential installations. Costs incurred on residential installations before the systems are completed are included in inventories as work in progress in the accompanying consolidated balance sheets.
The Company recognizes revenue for solar energy systems constructed for large scale commercial customers in accordance with ASC 605-35, Revenue Recognition, Construction—Type and Production Type Contracts. Revenue is recognized on the percentage-of-completion basis, based on the ratio of costs incurred to date to total projected costs. Provisions are made for the full amount of any anticipated losses on a contract-by-contract basis. The Company recognized $4.0 million and $3.2 million in total losses for these types of contracts in 2012 and 2011, respectively. No losses had been recognized in periods prior to 2011. Costs in excess of billings are recorded where costs recognized are in excess of amounts billed to customers of purchased commercial solar energy systems. Costs in excess of billings as of December 31, 2012 and 2011 amounted to $0.1 million and $1.2 million, respectively, and are included in prepaid expenses and other current assets in the consolidated balance sheets. Billings in excess of costs as of December 31, 2012 and 2011 amounted to $0.2 million and $0.7 million, respectively, and are included in deferred revenue in the consolidated balance sheets.
Operating Leases and Power Purchase Agreements
The Company is the lessor under lease agreements for solar energy systems, which are accounted for as operating leases in accordance with ASC 840. The Company records operating lease revenue from minimum lease payments, including upfront rebates and incentives earned from such systems, on a straight-line basis over the life of the lease term, assuming all other revenue recognition criteria are met. For incentives that are earned based on amount of electricity generated by the system, the Company records revenue as the amounts are earned.
The difference between the payments received and the revenue recognized is recorded as deferred revenue on the accompanying consolidated balance sheets.
For solar energy systems where customers purchase electricity from the Company under power purchase agreements, the Company has determined that these agreements should be accounted for, in substance, as operating leases pursuant to ASC 840. Revenue is recognized based upon the amount of electricity delivered as determined by remote monitoring equipment at rates specified under the contracts, assuming all other revenue recognition criteria are met.
90
Table of Contents
SolarCity Corporation
Notes to Consolidated Financial Statements (continued)
The portion of rebates and incentives recognized within operating leases revenue for the years ended December 31, 2012, 2011 and 2010 amounted to $18.2 million, $9.6 million and $3.8 million, respectively.
Initial direct costs from the origination of solar energy systems leased to customers (the incremental cost of contract administration, referral fees and sales commissions) are capitalized as an element of solar energy systems and amortized over the term of the related lease or power purchase agreement, which generally ranges from ten to twenty years. Refer to Note 6 for summary of initial direct costs from origination of solar energy systems leased and to be leased to customers.
Remote Monitoring Services
The Company provides solar energy systems remote monitoring services which are generally bundled with either the sale or lease of solar energy systems. For systems that the Company sells to customers, the Company provides remote monitoring services over the contractual term specified in the contractual agreements or over the warranty period if not specified in the contracts. For leased systems the Company provides remote monitoring services over the lease term. The Company allocates revenue to the remote monitoring services and other elements in the arrangement using the relative selling price method. The selling price used in the allocation is determined by reference to the prices charged by third parties for similar services. The relative selling prices of solar energy systems and leases used in the allocation is based on the Company’s best estimate of the prices that the Company would charge its customers to sell or lease solar energy systems on a standalone basis. For remote monitoring services bundled with the sale of solar energy systems, the Company recognizes revenue attributable to the remote monitoring services over the term of the associated contract or warranty period, if the contract does not specify the service term. For remote monitoring services bundled with the lease of solar energy systems, the Company recognizes revenue attributable to the remote monitoring services over the lease term. To date the remote monitoring services revenue has not been material and is included in the consolidated statements of operations under either revenue from operating leases when these services are bundled with leases or revenue from solar energy system sales when these services are bundled with sale of solar energy systems.
Energy Efficiency Services
For energy efficiency services, the Company recognizes revenue upon completion of the services, provided all other revenue recognition criteria are met. Typically the energy efficiency services take less than a month to complete. The energy efficiency services are either sold on a standalone basis or bundled with the sale or lease of solar energy systems. When the sale of energy efficiency services has been bundled with the sale or lease of solar energy systems, the Company allocates revenue to the energy efficiency services and the sale or lease of energy system using the relative selling price method. The relative selling prices of the energy efficiency services and the sale or lease of solar energy systems used in the allocation is determined by reference to the prices the Company charges for these products on a standalone basis. To date, the revenue generated from energy efficiency services has not been material and has been included as a component of solar energy systems sales revenue in the consolidated statements of operations.
Sale-Leaseback
The Company is party to master lease agreements that provide for the sale of solar energy systems to third parties and the simultaneous leaseback of the systems, which the Company then subleases to customers. In sale-leaseback arrangements, the Company first determines whether the solar energy system under the sale-leaseback arrangement is “integral equipment.” A solar energy system is determined to be integral equipment when the cost to remove the system from its existing location, including the shipping and reinstallation costs of
91
Table of Contents
SolarCity Corporation
Notes to Consolidated Financial Statements (continued)
the solar energy system at the new site, including any diminution in fair value, exceeds ten percent of the fair value of the solar energy system at the time of its original installation. When the leaseback arrangements expire, the Company has the option to purchase the solar energy system, and in most cases, the lessor has the option to sell the system back to the Company, though in some instances the lessor can only sell the system back to the Company prior to expiration of the arrangement.
For solar energy systems that the Company has determined to be integral equipment, the Company has concluded that these rights create a continuing involvement. Therefore, the Company uses the financing method to account for the sale-leaseback of such solar energy systems. Under the financing method, the Company does not recognize as revenue any of the sale proceeds received from the lessor that contractually constitutes a payment to acquire the solar energy system. Instead, the Company treats any such sale proceeds received as financing capital to install and deliver the solar energy system and accordingly records the proceeds as a sale-leaseback financing obligation in the consolidated balance sheets. The Company allocates the leaseback payments made to the lessor between interest expense and a reduction to the sale-leaseback financing obligation. Interest on the financing obligation is calculated using the Company’s incremental borrowing rate at the inception of the arrangement on the outstanding financing obligation. The Company determines its incremental borrowing rate by reference to the interest rates that it would obtain in the financial markets to borrow amounts equal to the sale-leaseback financing obligation over a term similar to the master lease term.
For solar energy systems that the Company has determined not to be integral equipment, the Company determines if the leaseback is classified as a capital lease or an operating lease. For leasebacks classified as capital leases, the Company initially records a capital lease asset and capital lease obligation in the consolidated balance sheets equal to the lower of the present value of the future minimum leaseback payments or the fair value of the solar energy system. For capital leasebacks, the Company does not recognize any revenue but defers the gross profit comprising of the net of the revenue and the associated cost of sale. For leasebacks classified as operating leases, the Company recognizes a portion of the revenue and the associated cost of sale, and defers the portion of revenue and cost of sale that represents the gross profit that is equal to the present value of the future minimum lease payments over the master leaseback term. For both capital and operating leasebacks, the Company records the deferred gross profit in the consolidated balance sheets as deferred income and amortizes the deferred income over the leaseback term as a reduction to the leaseback rental expense included in the cost of operating lease revenue in the consolidated statement of operations.
Cost of Revenue
Operating leases cost of revenue is primarily made up of depreciation of the cost of leased solar energy systems, reduced by amortization of U.S. Treasury grants income and amortization of initial direct costs associated with those systems.
Solar energy systems cost of revenue includes direct and indirect material and labor costs, warehouse rent, freight, warranty expense, depreciation on vehicles, amortization of initial direct costs and depreciation related to solar energy systems leased to customers, and other overhead costs.
Advertising Costs
Advertising costs are expensed as incurred and are included as an element of sales and marketing expense in the accompanying consolidated statements of operations. The Company incurred advertising costs of $3.8 million, $9.5 million and $5.5 million for the years ended December 31, 2012, 2011 and 2010, respectively.
92
Table of Contents
SolarCity Corporation
Notes to Consolidated Financial Statements (continued)
Income Taxes
The Company accounts for income taxes under an asset and liability approach. Deferred income taxes reflect the impact of temporary differences between assets and liabilities recognized for financial reporting purposes and the amounts recognized for income tax reporting purposes, net operating loss carryforwards, and other tax credits measured by applying currently enacted tax laws. A valuation allowance is provided when necessary to reduce deferred tax assets to an amount that is more likely than not to be realized.
The Company determines whether a tax position is more likely than not to be sustained upon examination, including resolution of any related appeals or litigation processes, based on the technical merits of the position. The Company uses a two-step approach to recognizing and measuring uncertain tax positions. The first step is to evaluate the tax position for recognition by determining if the weight of available evidence indicates that it is more likely than not that the position will be sustained upon tax authority examination, including resolution of related appeals or litigation processes, if any. The second step is to measure the tax benefit as the largest amount that is more than 50% likely of being realized upon ultimate settlement.
The Company’s policy is to include interest and penalties related to unrecognized tax benefits, if any, within the provision for taxes in the consolidated statements of operations.
Comprehensive Income (Loss)
The Company accounts for comprehensive income (loss) in accordance with ASC 220, Comprehensive Income. Under ASC 220, the Company is required to report comprehensive income (loss), which includes the Company’s net loss, as well as changes in other comprehensive loss items. There were no differences between comprehensive loss as defined by ASC 220 and net loss as reported in the Company’s accompanying consolidated statements of operations for the periods presented.
Stock-Based Compensation
The Company accounts for stock-based compensation costs under the provisions of ASC 718, Compensation—Stock Compensation, which requires the measurement and recognition of compensation expense related to the fair value of stock-based compensation awards that are ultimately expected to vest. Stock-based compensation expense recognized includes the compensation cost for all share-based payments granted to employees based on the grant date fair value estimated in accordance with the provisions of ASC 718. ASC 718 is also applied to awards modified, repurchased, or canceled during the periods reported.
The Company applies ASC 718 and ASC Subtopic 505-50, Equity-Based Payments to Non Employees, to options and other stock-based awards issued to nonemployees. In accordance with ASC 718 and ASC Subtopic 505-50, the Company uses the Black-Scholes option-pricing model to measure the fair value of the options at the measurement date.
Noncontrolling Interests
Noncontrolling interests represent third party interests in the net assets under certain funding arrangements, or the Funds, that the Company has entered into to finance the cost of solar energy systems under operating leases. The Company has determined that the contractual-provisions in the funding arrangements represent substantive profit sharing arrangements. The Company has further determined that the appropriate methodology for calculating the noncontrolling interests balances that reflects the substantive profit sharing arrangements is a balance sheet approach using the hypothetical liquidation at book value, method or the HLBV, method. The Company therefore determines the amount of the noncontrolling interests in the net assets at each balance sheet date using the HLBV method which is presented on the consolidated balance sheets as
93
Table of Contents
SolarCity Corporation
Notes to Consolidated Financial Statements (continued)
noncontrolling interests in subsidiaries. Under the HLBV method, the amounts reported as noncontrolling interests in the consolidated balance sheets represent the amounts the third parties would hypothetically receive at each balance sheet date under the liquidation provisions of the Funding arrangements, assuming the net assets of the Funds were liquidated at recorded amounts determined in accordance with GAAP and distributed to the investors. The third parties interest in the results of operations of these Funds is determined as the difference in noncontrolling interests in the consolidated balance sheets at the start and end of each operating period, after taking into account any capital transactions between the Fund and the third parties. The noncontrolling interests balance in these Funds is reported as a component of equity in the consolidated balance sheets.
Segment Information
Operating segments are defined as components of a company about which separate financial information is available that is evaluated regularly by the chief operating decision maker, or decision making group, in deciding how to allocate resources and in assessing performance. The Company’s chief operating decision maker is the executive team, comprising the chief executive officer, the chief operating officer, chief revenue officer and the chief financial officer. Based on the financial information presented to and reviewed by the chief operating decision maker in deciding how to allocate the resources and in assessing the performance of the Company, the Company has determined that it has a single operating and reporting segment, solar energy and energy efficiency products and services. The Company’s principal operations, revenue and decision-making functions are located in the United States.
Basic and Diluted Net Income (Loss) Per Share
The Company’s basic net income (loss) per share attributable to common stockholders is calculated by dividing the net income (loss) attributable to common stockholders by the weighted average number of shares of common stock outstanding for the period. Prior to the Company’s initial public offering of its common stock, the Company’s convertible redeemable preferred stock was entitled to receive dividends of up to $0.01 per share when and if dividends are declared on the common stock and thereafter participate pro rata on an as converted basis with the common stock holders on any distributions to common stockholders. They were therefore participating securities. As a result, the Company calculates the net income (loss) per share using the two-class method. Accordingly, the net income (loss) attributable to common stockholders is derived from the net income (loss) for the period and, in periods in which the Company has net income attributable to common stockholders, an adjustment is made for the noncumulative dividends and allocations of earnings to participating securities based on their outstanding shareholder rights. Under the two-class method, the net loss attributable to common stockholders is not allocated to the convertible redeemable preferred stock as the convertible redeemable preferred stock did not have a contractual obligation to share in the Company’s losses.
The diluted net income (loss) per share attributable to common stockholders is computed by giving effect to all potential common stock equivalents outstanding for the period determined using the treasury stock method or the as-if converted method as applicable. In periods when the Company incurred a net loss attributable to common stockholders, convertible redeemable preferred stock, stock options, restricted stock units, warrants to purchase common stock, and warrants to purchase convertible redeemable preferred stock were considered to be common stock equivalents but have been excluded from the calculation of diluted net loss per share attributable to common stockholders as their effect is antidilutive.
Recently Issued Accounting Standards
In May 2011, the FASB issued ASU No. 2011-04, Fair Value Measurement (Topic 820): Amendments to Achieve Common Fair Value Measurement and Disclosure Requirements in U.S. GAAP and IFRSs (ASU 2011-04), to provide a consistent definition of fair value and ensure that the fair value measurement and
94
Table of Contents
SolarCity Corporation
Notes to Consolidated Financial Statements (continued)
disclosure requirements are similar between accounting principles generally accepted in the United States of America (U.S. GAAP) and International Financial Reporting Standards (IFRS). The ASU changes certain fair value measurement principles and enhances the disclosure requirements particularly for Level 3 fair value measurements. The ASU is effective for interim and annual periods beginning on or after December 15, 2011, with early adoption prohibited. The adoption of the ASU did not have a significant impact on the Company’s consolidated financial statements.
In June 2011, the FASB issued ASU No. 2011-05, Comprehensive Income (Topic 220): Presentation of Comprehensive Income (ASU 2011-05), to require an entity to present the total of comprehensive income or loss, the components of net income or loss, and the components of other comprehensive income or loss either in a single continuous statement of comprehensive income or loss or in two separate but consecutive statements. The ASU is effective for fiscal years, and interim periods within those years, beginning after December 15, 2011. The adoption of the ASU did not have a significant impact on the Company’s consolidated financial statements.
In February 2013, the FASB issued ASU No. 2013-02, Comprehensive Income (Topic 220): Reporting of Amounts Reclassified Out of Accumulated Other Comprehensive Income (ASU 2013-02), to require reporting of the impact of significant reclassifications out of accumulated other comprehensive income or loss on the line items on the statement of operations, if a reclassification is required in its entirety in one reporting period. The ASU is effective for interim and annual periods beginning after December 15, 2012. The adoption of the ASU is not expected to have a significant impact on the Company’s consolidated financial statements.
3. Acquisitions
Clean Currents
Pursuant to the asset purchase agreement dated January 19, 2011, between the Company and Clean Currents, Inc., and Clean Currents Solar of the Mid Atlantic, LLC (collectively “Clean Currents”), the Company purchased certain assets and assumed certain liabilities from Clean Currents. In consideration for the assets and liabilities acquired, the Company paid $0.4 million. The Company has accounted for the acquisition under ASC 805, Business Combinations, and has included the results of operations in the consolidated statements of operations from the acquisition date and recorded the related assets and liabilities based upon their fair values at the date of acquisition.
The acquisition was intended to extend the Company’s geographic reach to the East Coast of the United States with a goal to increase the customer base.
The following table summarizes the accounting for this acquisition (in thousands):
| Inventory |
$ | 219 | ||
| Fixed assets |
14 | |||
| Other assets |
98 | |||
| Warranty obligation |
(32 | ) | ||
| Other liabilities |
(296 | ) | ||
| Intangible assets: |
||||
| Orders backlog |
335 | |||
| Goodwill |
44 | |||
|
|
|
|||
| Total purchase price |
$ | 382 | ||
|
|
|
95
Table of Contents
SolarCity Corporation
Notes to Consolidated Financial Statements (continued)
groSolar
Pursuant to the asset purchase agreement dated February 16, 2011, between the Company and Global Resource Options, Inc., Chesapeake Solar LLC, and groSolar CalMass Inc. (collectively “groSolar”), the Company purchased certain assets and assumed certain liabilities from groSolar. In consideration for the assets and liabilities acquired, the Company paid $1.9 million. The Company has accounted for the acquisition under ASC 805, Business Combinations, and included the results of operations in the consolidated statements of operations from the acquisition date and recorded the related assets and liabilities based upon their fair values at the date of acquisition.
The acquisition was intended to extend the Company’s geographic reach to the East Coast of the United States with a goal to increase the customer base.
The following table summarizes the accounting for this acquisition (in thousands):
| Inventory |
$ | 1,155 | ||
| Fixed assets |
419 | |||
| Vehicle loans |
(164 | ) | ||
| Warranty obligation |
(317 | ) | ||
| Other liabilities |
(99 | ) | ||
| Intangible assets: |
||||
| Orders backlog |
401 | |||
| Goodwill |
469 | |||
|
|
|
|||
| Total purchase price |
$ | 1,864 | ||
|
|
|
Pro Forma Financial Information
The pro forma financial information has not been presented as the acquisitions individually and in the aggregate are not material to the Company’s consolidated financial statements.
4. Noncancelable Operating Lease Payments Receivable
As of December 31, 2012, future minimum lease payments to be received from customers under noncancelable operating leases for each of the next five years and thereafter are as follows (in thousands):
| 2013 |
$ | 24,019 | ||
| 2014 |
19,716 | |||
| 2015 |
19,956 | |||
| 2016 |
20,202 | |||
| 2017 |
20,459 | |||
| Thereafter |
217,360 | |||
|
|
|
|||
| Total |
$ | 321,712 | ||
|
|
|
The Company enters into power purchase agreements with its customers which are accounted for, in substance, as leases. These customers are charged solely based on actual power produced by the installed solar energy system at a predefined power rate per kWh of power produced. The payments from such arrangements are not included in the table above as they are a function of the power that will be generated by the related solar systems in the future.
96
Table of Contents
SolarCity Corporation
Notes to Consolidated Financial Statements (continued)
Included in revenue for the years ended December 31, 2012, 2011 and 2010, was $20.2, $5.0 million, $1.3 million, respectively, which have been accounted for as contingent rentals. The contingent rentals comprise of customer payments under power purchase agreements and performance-based incentives receivable by the Company from various utility companies.
5. Inventories
As of December 31, 2012 and 2011, inventories consist of the following (in thousands):
| December 31, | ||||||||
| 2012 | 2011 | |||||||
| Raw materials |
$ | 69,726 | $ | 126,517 | ||||
| Work in progress |
18,177 | 16,225 | ||||||
|
|
|
|
|
|||||
| Total |
$ | 87,903 | $ | 142,742 | ||||
|
|
|
|
|
|||||
Work in progress represents costs incurred on solar energy systems that are undergoing installation for sale to customers and are yet to be commissioned.
Raw materials comprise component parts that include photovoltaic panels, inverters and other electrical components that will be deployed to solar energy systems that will either be sold or to solar energy systems, leased and to be leased. Work in progress comprise installations in progress and include component parts, labor and other overhead costs incurred up to the balance sheet date on systems that will be sold to customers and for which binding sales contracts have already been executed. For solar energy systems, leased and to be leased, the Company commences transferring component parts from inventory to construction in progress, a component of solar energy systems, leased and to be leased, once a lease contract with a lease customer has been executed and installation initiated. Additional costs incurred on the leased systems, including labor and overhead, are recorded within construction in progress.
The changes in inventories consisted of the following (in thousands):
| As of and for the Year Ended December 31, |
||||||||
| 2012 | 2011 | |||||||
| Balance – beginning of period |
$ | 142,742 | $ | 30,217 | ||||
| Inventory receipts |
165,012 | 256,109 | ||||||
| Direct costs attributable to systems to be sold at the balance sheet date |
50,019 | 22,166 | ||||||
| Transfers to solar energy systems sales and long-term contracts |
(61,463 | ) | (29,950 | ) | ||||
| Transfers to systems sold under sale-leaseback transactions |
(25,362 | ) | (8,252 | ) | ||||
| Transfers to solar energy systems, leased and to be leased |
(178,653 | ) | (127,659 | ) | ||||
| Changes in overhead costs allocated to systems to be sold at the balance sheet date |
1,531 | 3,866 | ||||||
| Inventory write-offs and other adjustments |
(5,923 | ) | (3,755 | ) | ||||
|
|
|
|
|
|||||
| Balance – end of period |
$ | 87,903 | $ | 142,742 | ||||
|
|
|
|
|
|||||
The transfers in a period to solar energy systems sales and long-term contracts, transfers to systems sold under sale leaseback transactions and transfers to solar energy systems, leased and to be leased, include material and direct costs. Overhead is allocated to work in progress at the end of each reporting period. The table above reflects changes in the overhead capitalized to work in progress at the end of the reporting period from the balance at the beginning of the period.
97
Table of Contents
SolarCity Corporation
Notes to Consolidated Financial Statements (continued)
6. Solar Energy Systems, Leased and To Be Leased, Net
As of December 31, 2012 and 2011, leased assets consist of the following (in thousands):
| December 31, | ||||||||
| 2012 | 2011 | |||||||
| Solar energy systems leased to customers |
$ | 895,020 | $ | 441,165 | ||||
| Initial direct costs related to solar energy systems leased to customers |
54,095 | 24,029 | ||||||
|
|
|
|
|
|||||
| 949,115 | 465,194 | |||||||
| Less accumulated depreciation and amortization |
(43,024 | ) | (17,797 | ) | ||||
|
|
|
|
|
|||||
| 906,091 | 447,397 | |||||||
| Solar energy systems under construction |
43,747 | 57,998 | ||||||
| Solar energy systems held for lease to customers |
52,346 | 30,214 | ||||||
|
|
|
|
|
|||||
| Solar energy systems, leased and to be leased, net |
$ | 1,002,184 | $ | 535,609 | ||||
|
|
|
|
|
|||||
Included under solar energy systems leased to customers as of December 31, 2012 and 2011 is $66.4 million and $14.5 million, respectively, relating to capital leased assets, with an accumulated depreciation of $2.6 and $0.2 million, respectively. As of December 31, 2012, future minimum annual lease payments to be paid to the lessor under this lease arrangement for each of the next five years and thereafter are as follows (in thousands):
| 2013 |
$ | 2,787 | ||
| 2014 |
2,314 | |||
| 2015 |
2,327 | |||
| 2016 |
2,339 | |||
| 2017 |
2,353 | |||
| Thereafter |
25,822 | |||
|
|
|
|||
| Total |
$ | 37,942 | ||
|
|
|
As of December 31, 2012, future minimum annual lease receipts to be paid to the Company by sublessees under this lease arrangement for each of the next five annual periods ending December 31, and thereafter are as follows (in thousands):
| 2013 |
$ | 2,402 | ||
| 2014 |
2,402 | |||
| 2015 |
2,429 | |||
| 2016 |
2,457 | |||
| 2017 |
2,486 | |||
| Thereafter |
39,413 | |||
|
|
|
|||
| Total |
$ | 51,589 | ||
|
|
|
The amounts in the table above are also included as part of the noncancelable operating lease payments from customers disclosed in Note 4.
98
Table of Contents
SolarCity Corporation
Notes to Consolidated Financial Statements (continued)
7. Property and Equipment, Net
As of December 31, 2012 and 2011, property and equipment consist of the following (in thousands):
| December 31, | ||||||||
| 2012 | 2011 | |||||||
| Vehicles |
$ | 17,669 | $ | 11,943 | ||||
| Computer hardware and software |
5,232 | 3,720 | ||||||
| Furniture and fixtures |
1,787 | 1,394 | ||||||
| Leasehold improvements |
6,942 | 5,424 | ||||||
|
|
|
|
|
|||||
| 31,630 | 22,481 | |||||||
| Less accumulated depreciation and amortization |
(12,995 | ) | (8,060 | ) | ||||
|
|
|
|
|
|||||
| Property and equipment, net |
$ | 18,635 | $ | 14,421 | ||||
|
|
|
|
|
|||||
8. Accrued and Other Current Liabilities
As of December 31, 2012 and 2011, accrued and other current liabilities consist of the following (in thousands):
| December 31, | ||||||||
| 2012 | 2011 | |||||||
| Accrued compensation |
$ | 14,804 | $ | 8,890 | ||||
| Accrued expenses |
28,357 | 15,761 | ||||||
| Accrued warranty |
4,019 | 2,462 | ||||||
| Income taxes payable |
— | 1,552 | ||||||
| Current portion of deferred gain on sale-leaseback transactions |
3,182 | 1,538 | ||||||
| Current portion of capital lease obligation |
1,972 | 371 | ||||||
|
|
|
|
|
|||||
| Total |
$ | 52,334 | $ | 30,574 | ||||
|
|
|
|
|
|||||
9. Other Liabilities
As of December 31, 2012 and 2011, other liabilities consist of the following (in thousands):
| December 31, | ||||||||
| 2012 | 2011 | |||||||
| Deferred gain on sale-leaseback transactions, net of current portion |
$ | 59,243 | $ | 24,597 | ||||
| Deferred rent expense |
4,443 | 4,567 | ||||||
| Capital lease obligation |
28,688 | 6,837 | ||||||
| Liability for receipts from Investor |
18,111 | — | ||||||
| Other noncurrent liabilities |
1,571 | 313 | ||||||
|
|
|
|
|
|||||
| Total |
$ | 112,056 | $ | 36,314 | ||||
|
|
|
|
|
|||||
99
Table of Contents
SolarCity Corporation
Notes to Consolidated Financial Statements (continued)
10. Long-Term Debt
Equipment Financing Facility
In May 2008, the Company entered into a loan and security agreement with a bank for working capital and equipment financing needs, whereby borrowings were collateralized by all of the Company’s assets other than intellectual property and assets under financing funds discussed in Notes 12, 13, 14 and 15. This facility was modified in 2009 and 2010. Under the facility, the bank provided a total of $2.0 million in committed borrowings available through April, 2010. Interest under the equipment facility is payable monthly at a rate of 8% per annum. Borrowings under this facility were paid in full in April 2011.
Working Capital Financing
On May 26, 2010, a subsidiary of the Company entered into a financing agreement with a bank to obtain funding for working capital. The amount to be borrowed under the financing agreement is determined based on the estimated present value of expected future lease rentals to be generated by solar energy systems owned by the subsidiary and leased to a customer, but shall not exceed $16.3 million. The loan was funded in four tranches and was available for drawdown up to March 31, 2011.
Through December 31, 2012, the Company has borrowed an aggregate of $13.3 million under this working capital financing facility. Of the amounts borrowed, $11.1 million and $12.1 million was outstanding as of December 31, 2012 and 2011, respectively, of which $10.0 million and $11.1 million is included in the consolidated balance sheet under long-term debt, net of current portion as of December 31, 2012 and 2011, respectively. Each loan tranche bears interest at a rate of 2% plus the swap rate applicable to the average life of the scheduled rent receipts for the tranche. For the amounts borrowed as of December 31, 2012, the interest rates ranged between 5.48% and 5.65%. The loan is secured by substantially all the assets of the subsidiary, and matures on December 31, 2024.
Under the financing agreement with the bank, the Company’s subsidiary is required to meet various restrictive covenants, including meeting certain reporting requirements, such as the completion and presentation of financial statements. The bank has no recourse to the general credit of the Company. The Company was in compliance with debt covenants as of December 31, 2012.
Vehicle and Other Loans
During the years ended 2010 and prior, the Company had entered into various loan agreements consisting of vehicle and other loans with various financial institutions. The principal amounts for these vehicle and other loans mature over the next four years, until 2015.
In January 2011, the Company entered into an additional $7.0 million term loan facility with a bank to finance the purchase of vehicles. This term loan facility bears interest at a rate of 2.5% plus LIBOR and is secured by the vehicles financed under this facility. As of December 31, 2012, the interest rate for this facility was 2.75%. The term loan facility matures in January 2015. As of December 31, 2012, the Company had drawn $5.9 million of the available amount. In March 2012, the Company and the bank amended this term loan to allow the Company to incur additional secured financing from another bank.
Total other loans payable as of December 31, 2012 and 2011, amounted to $7.7 million and $5.1 million, respectively, with interest rates between 0.0% and 11.31%. Of the amounts outstanding, $3.0 million and $1.6 million were classified as short term as of December 31, 2012 and 2011, respectively. The loans are secured by the underlying property and equipment. The Company was in compliance with the debt covenants as of December 31, 2012.
100
Table of Contents
SolarCity Corporation
Notes to Consolidated Financial Statements (continued)
Inventory Term Loan Facility
On March 8, 2012, the Company entered into a $58.5 million term loan facility with a syndicate of banks to finance the purchase of inventory. Interest on the borrowed funds bears interest at a rate of 3.75% plus LIBOR and is secured by the Company’s inventory as described in the credit agreement. As of December 31, 2012, the interest rate for this facility was 3.94%. The term loan facility matures in August 2013. The Company borrowed $58.5 million under this term loan facility as of December 31, 2012, from which the Company paid $1.5 million as fees to the lenders. Of the amounts borrowed, $17.2 million was outstanding as of December 31, 2012 and is included in consolidated balance sheet under current portion of long-term debt.
Under this arrangement, the Company is required to meet various financial covenants, including completion and presentation of consolidated financial statements. The Company is also required to maintain (i) a loan coverage ratio, as defined in the debt agreement, of 2.5 at the end of each quarter, (ii) liquidity, as defined in the debt agreement, of $20.0 million if the debt, as defined in the debt agreement, is at least $35.0 million or $15.0 million if debt is less than $35.0 million in each case at the end of each month, and (iii) minimum debt service coverage ratio, as defined in the debt agreement, of 1.25 at the end of each quarter. The Company was in compliance with these covenants as of December 31, 2012.
Schedule of Principal Maturities of Long-Term Debt
The scheduled principal maturities of long-term debt including working capital financing and vehicle and other loans as of December 31, 2012, are as follows (in thousands):
| Principal due: |
||||
| 2013 |
$ | 21,412 | ||
| 2014 |
72,265 | |||
| 2015 |
2,013 | |||
| 2016 |
1,303 | |||
| 2017 |
1,076 | |||
| Thereafter |
8,618 | |||
|
|
|
|||
| Total |
$ | 106,687 | ||
|
|
|
11. Borrowings Under Bank Lines of Credit
Working Capital Facility
Under the 2008 bank loan and security agreement, as modified, (Note 10) is a revolving line of credit facility with a commitment of $5.0 million. This facility was paid in full in April 2011. The interest rate under the line of credit facility was 6.5% as of December 31, 2009 and 2010.
Revolving Credit Agreement
In April 2011, the Company entered into a revolving credit agreement with the same bank the Company had entered into the $7.0 million term loan discussed in Note 10, to obtain funding for working capital and general corporate needs. This revolving credit agreement had a $25.0 million committed facility. Interest on the borrowed funds bore interest at a rate of 2.5% plus LIBOR. The facility was secured by the Company’s accounts receivables, inventory and other assets as described in the revolving credit agreement, excluding certain inventory pledged to other lenders. The Company had borrowed $5.6 million under this financing arrangement, which was outstanding as of December 31, 2011 and is disclosed in the consolidated balance sheet under
101
Table of Contents
SolarCity Corporation
Notes to Consolidated Financial Statements (continued)
borrowings under bank line of credit. At December 31, 2011, the interest rate for this facility was 2.77%. In January 2012, the Company borrowed $19.4 million, which represented the remainder of this facility. The facility was repaid in 2012, in connection with entering into a new $75.0 million working capital revolving credit facility.
Credit Facility for SolarStrong
On November 21, 2011, a subsidiary of the Company and a bank entered into a credit agreement, whereby the bank would provide this subsidiary with a credit facility for up to $350 million. This facility would be used to partially fund the Company’s SolarStrong initiative and will be non-recourse to the other assets of the Company. The SolarStrong initiative is a five-year plan to build solar power projects for privatized U.S. military housing communities across the country. The credit facility will be drawn down in tranches as defined in the credit facility agreement, with the interest rates to be determined as the amounts are drawn down. The credit facility will be collateralized by assets of the SolarStrong initiative. As of December 31, 2012, the Company’s subsidiary had borrowed $2.7 million. The debt principal and interest are payable in semi-annual installments over a 20-year term ending in 2032 and bears interest rates between 6.78% and of 7.27%. Under this facility, the Company’s subsidiary is required to comply with various financial and non-financial covenants. As of December 31, 2012, the Company was in compliance with these covenants.
Revolving Credit Facility
In September 2012, the Company entered into a revolving credit agreement with a syndicate of banks to obtain funding for working capital, letters of credit and general corporate needs. This revolving credit agreement has a $75.0 million committed facility, of which $70.0 million was initially available pursuant to the facility’s terms. The borrowed funds bear interest, which is payable monthly, at a rate of 3.875% plus LIBOR or, at the Company’s option, at a rate equal to 2.875%, plus the higher of the federal funds rate plus 0.5%, or Bank of America’s published “prime rate,” or LIBOR plus 1%. The fee for letters of credit is 3.875% per annum, and the fee for undrawn commitments is 0.375% per annum. The facility is secured by certain of the Company’s machinery and equipment, accounts receivables, inventory and other assets, excluding certain inventory pledged to other lenders. This facility matures and is payable in full in September 2014, which date may be extended by an additional year if the Company satisfies certain financial conditions. As of December 31, 2012, $66.4 million, net of lender fees, was borrowed and outstanding under this revolving credit agreement, of which the Company used approximately $25.0 million to fully repay a prior revolving credit facility. The outstanding balance is included under long-term debt.
Under the terms of this revolving credit agreement, the Company is required to meet various restrictive covenants, including meeting certain reporting requirements, such as the completion and presentation of audited consolidated financial statements. The Company is also required to maintain a debt service coverage ratio, as defined in the credit agreement, of at least 1.25:1.00 for the trailing 12 months measured at the end of each fiscal quarter, and to maintain unencumbered liquidity, as defined in the credit agreement, of at least $50.0 million, measured at the end of each month on and after December 31, 2012; provided, however, in each case, an event of default shall not have been deemed to occur unless (i) the unencumbered liquidity is below the foregoing applicable threshold for two consecutive months or (ii) the unencumbered liquidity is less than $40.0 million. As of December 31, 2012, the Company was in compliance with these covenants.
12. Solar Financing Funds
The Company has entered into various arrangements with investors to facilitate funding and monetization of solar energy systems. These arrangements include those described in this Note 12, Solar Financing Funds, as well as those described in Note 13, Lease Pass-through Financing Obligation, Note 14, Sale-Leaseback Arrangements, and Note 15, Sale-Leaseback Financing Obligation.
102
Table of Contents
SolarCity Corporation
Notes to Consolidated Financial Statements (continued)
VIE Arrangements
Since 2008, wholly owned subsidiaries of the Company and fund investors formed and contributed cash or assets to various solar financing funds and entered into related agreements. As of December 31, 2012, the VIE investors had contributed $542.3 million into the VIEs.
The Company has determined it is the primary beneficiary of these VIEs by reference to the power and benefits criterion under ASC 810, Consolidation. The Company has considered the provisions within the contractual arrangements, which grant it power to manage and make decisions that affect the operation of these VIEs, including determining the solar energy systems and associated customer leases to be sold or contributed to the VIE, preparation and approval of budgets. The Company considers that the rights granted to the other investors under the contractual arrangements are more protective in nature rather than participating rights.
As the primary beneficiary of these VIEs, the Company consolidates in its financial statements the financial position, results of operations, and cash flows of these funds, and all intercompany balances and transactions between the Company and the financing funds are eliminated in the consolidated financial statements.
Under the related agreements, cash distributions of income and other receipts by the fund, net of agreed-upon expenses and estimated expenses, tax benefits and detriments of income and loss, and tax benefits of tax credits are allocated to the fund investor and Company’s subsidiary as specified in contractual arrangements. Generally, the Company’s subsidiary has the option to acquire the investor’s equity interest at the higher of market value or an amount based upon a formula specified in the contractual agreements.
In 2008, the Company issued warrants to a fund investor to purchase shares of Series C convertible redeemable preferred stock. The Company also issued warrants in 2010 to a fund investor to purchase shares of Series E convertible redeemable preferred stock. The Company issued additional warrants to this fund investor pursuant to amending and restating the contractual arrangements to increase the funding commitment of this fund in 2011 from $120 million to $218 million.
On December 31, 2012, the Company acquired the total equity stake of one investor’s interest in three separate funds for a total cash consideration of $8.8 million. This amount is included within accrued and other liabilities in the consolidated balance sheet and was paid subsequent to the end of the year. In these three funds, the Company was contractually required to make payments to the investor to ensure that the investor achieved a specified minimum internal rate of return upon occurrence of certain events. Upon the purchase of the investor’s stake in these funds, this obligation was satisfied.
As of December 31, 2012, the Company was contractually required to make payments to an investor in one of the VIE funds to ensure the investor was projected to achieve a specified minimum return annually. The amounts of potential future payments under these guarantees is dependent on the amounts and timing of future distributions to the investor from the funds, the tax benefits that accrue to the investor from the funds activities and the timing and amounts that the Company would pay to the investor if the Company purchased the investor’s stake in the funds, or timing and amounts of the distributions to the investor upon liquidation of the funds. Due to uncertainties associated with estimating the timing and amount of distributions to the investor and the possibility for and timing of the liquidation of the funds, the Company is unable to determine the potential maximum future payments that it would have to make under these guarantees.
Upon the sale or liquidation of the fund, distributions would occur in the order and priority specified in the contractual agreements.
103
Table of Contents
SolarCity Corporation
Notes to Consolidated Financial Statements (continued)
Pursuant to management services, maintenance, and warranty arrangements, the Company has been contracted to provide services such as warranty support, accounting, lease servicing, and performance reporting. In some instances the Company has guaranteed payments to the fund investors as specified in the contractual agreements. The funds’ creditors have no recourse to the general credit of the Company or to that of other funds. As of December 31, 2012, the assets of one of the VIEs with a carrying value of $16.0 million have been pledged as collateral for the VIE’s borrowings under the SolarStrong facility. None of the assets of the other VIEs have been pledged as collateral for the VIEs’ obligations.
The Company reports the solar energy systems in the VIEs under the solar energy systems, leased and to be leased, net, line item in the consolidated balance sheets.
The Company has aggregated the financial information of the financing funds in the table below. The aggregate carrying value of these funds’ assets and liabilities (after elimination of intercompany transactions and balances) in the Company’s consolidated balance sheets as of December 31, 2012 and 2011, are as follows (in thousands):
| December 31, | ||||||||
| 2012 | 2011 | |||||||
| Assets |
||||||||
| Current assets |
||||||||
| Cash and cash equivalents |
$ | 16,065 | $ | 7,070 | ||||
| Restricted cash, short term |
167 | — | ||||||
| Accounts receivable, net |
1,681 | 632 | ||||||
| Prepaid expenses and other assets |
2,603 | 5,056 | ||||||
| Rebates receivable |
8,985 | 2,894 | ||||||
|
|
|
|
|
|||||
| Total current assets |
29,501 | 15,652 | ||||||
| Solar energy systems, leased and to be leased, net |
530,230 | 301,573 | ||||||
| Deferred lease asset |
2,800 | — | ||||||
|
|
|
|
|
|||||
| Total assets |
$ | 562,531 | $ | 317,225 | ||||
|
|
|
|
|
|||||
| Liabilities |
||||||||
| Current liabilities |
||||||||
| Accounts payable |
$ | 9 | $ | 31 | ||||
| Customer deposits |
4,162 | 2,804 | ||||||
| Distributions payable to noncontrolling interests |
12,028 | 6,216 | ||||||
| Current portion of deferred U.S. Treasury grants income |
6,710 | 2,877 | ||||||
| Current portion of deferred revenue |
11,324 | 5,796 | ||||||
| Accrued and other liabilities |
938 | 789 | ||||||
| Current portion of bank borrowings |
131 | — | ||||||
|
|
|
|
|
|||||
| Total current liabilities |
35,302 | 18,513 | ||||||
| Bank borrowings, net of current portion |
2,585 | — | ||||||
| Deferred revenue, net of current portion |
160,093 | 78,486 | ||||||
| Deferred U.S. Treasury grant income, net of current portion |
184,470 | 82,208 | ||||||
|
|
|
|
|
|||||
| Total liabilities |
$ | 382,450 | $ | 179,207 | ||||
|
|
|
|
|
|||||
The Company is contractually obligated to make certain VIE investors whole for losses that the investors may suffer in certain limited circumstances resulting from the disallowance or recapture of tax credits or U.S. Treasury grants in lieu of tax credits, including in the event that the U.S. Treasury awards cash grants for the solar energy systems in the VIEs that are less than the amounts initially anticipated. The Company accounts for distributions due to the VIE investors that may arise from the reduction in anticipated U.S. Treasury grants under distributions payable noncontrolling interests in the consolidated balance sheets. Through December 31,
104
Table of Contents
SolarCity Corporation
Notes to Consolidated Financial Statements (continued)
2012, the Company has returned $4.3 million and will return an additional $5.3 million which is accrued as a distribution payable as at December 31, 2012 related to these obligations.
For one VIE fund the Company estimated a reduction in the U.S. Treasury grants to be received of approximately $19.5 million through December 31, 2012. In this particular VIE fund the Company was obligated to contribute additional capital in the form of solar energy systems or cash to purchase additional solar energy systems. As of December 31, 2012, the Company had contributed solar energy systems to cover substantially all of the reduction in U.S. Treasury grants, with an outstanding balance of $0.2 million.
13. Lease Pass-Through Financing Obligation
During the years 2012, 2011, 2010 and 2009, the Company entered into seven transactions referred to as “lease pass-through fund arrangements.” Under these arrangements the Company’s wholly owned subsidiaries finance the cost of solar energy systems with investors for an initial term ranging between 10 and 25 years. These solar energy systems are subject to lease or power purchase agreements with customers with an initial term not exceeding 20 years. These solar energy systems are reported under the line item solar energy systems, leased and to be leased, net, in the consolidated balance sheets. The cost of the solar energy systems under the lease pass-through arrangements as of December 31, 2012 and 2011 was $258.0 million and $128.2 million, respectively. The accumulated depreciation related to these assets as of December 31, 2012 and 2011 amounted to $10.2 million and $3.9 million, respectively.
The investors make a large upfront payment to the lessor, which is a subsidiary of the Company, and in some cases, subsequent smaller quarterly payments. The Company accounts for the payments received from the investors under the arrangement as a borrowing by recording the proceeds received as a lease pass-through financing obligation, which would be repaid from U.S. Treasury grants (where applicable), customer payments and incentive rebates that would be received by the investors. Under this approach the Company continues to account for the arrangement with the customers in its consolidated financial statements, whether the cash generated from the customer arrangements is received by the Company or paid directly to the investor. A portion of the amounts received by the investors from U.S. Treasury grants (where applicable), customer payments and incentive rebates associated with the leases assigned to the lease pass-through investor is applied to reduce the lease pass-through financing obligation, and the balance allocated to interest expense. The incentive rebates and host customer payments are recognized into revenue consistent with the Company’s revenue recognition accounting policy. The U.S. Treasury grants are initially recorded as deferred U.S. Treasury grants income and subsequently recognized as a reduction to the depreciation expense, consistent with the Company’s accounting policy for recognition of U.S. Treasury grant income. Interest is calculated on the financing obligation using the effective interest rate method. The effective interest rate is the interest rate that equates the present value of the cash amounts to be received by an investor over the master lease term with the present value of the cash amounts paid by the investor to the Company, adjusted for any payments made by the Company. The lease pass-through obligation is nonrecourse once the associated assets have been placed in service and all the contractual arrangements have been assigned to the investor.
As of December 31, 2012, future minimum lease payments to be received from the investors under the lease pass-through fund arrangements for each of the next five years and thereafter are as follows (in thousands):
| 2013 |
$ | 6,878 | ||
| 2014 |
3,578 | |||
| 2015 |
3,129 | |||
| 2016 |
2,810 | |||
| 2017 |
2,838 | |||
| Thereafter |
15,413 | |||
|
|
|
|||
| Total |
$ | 34,646 | ||
|
|
|
105
Table of Contents
SolarCity Corporation
Notes to Consolidated Financial Statements (continued)
Concurrent with entering into one of the lease pass-through arrangements, the Company entered into an agreement to issue warrants to the investor to acquire Series E convertible redeemable preferred stock in the Company if it committed to provide more than a specified threshold in total funding as specified in the contractual agreements, through this or other future funding arrangements. The warrants were issued during 2010 when the Company entered into the second lease pass-through arrangement with the investor. These warrants were converted to common stock warrants upon the closing of the Company’s initial public offering of its common stock.
For two of the lease pass-through arrangements, the Company’s subsidiary has pledged its assets to the investor as security for its obligations under the contractual agreements.
For each of the lease pass-through arrangements, the Company is required to comply with certain financial covenants specified in the contractual arrangements, which the Company had met as of December 31, 2012 and 2011.
Under these arrangements, the Company’s subsidiaries are responsible for services such as warranty support, accounting, lease servicing and performance reporting. The performance of the obligations of the Company’s subsidiary is guaranteed by the Company. As part of the warranty and performance guarantee with the host customers, the Company guarantees certain specified minimum annual solar energy production output for the solar energy systems leased to the customers.
Under the contractual terms of the lease pass-through arrangements there is a one-time future lease payment reset mechanism that is set to occur after the installation of all the solar energy systems in a fund. This reset date occurs when the installed capacity of the solar energy systems and in service placement dates are known or on an agreed upon date. As part of this reset process, the lease prepayment will be updated to reflect certain specified conditions as they exist at such date, including the ultimate system size of the equipment that was leased, how much it cost and when it went into service. As a result of this reset, the Company may be obligated to refund a portion of the investor’s lease prepayments or may be entitled to receive an additional lease prepayment from the investor. Additional payments by the investor would be recorded as additional lease pass-through financing obligation, while refunds of lease prepayments would reduce the lease pass-through financing obligation.
14. Sale-Leaseback Arrangements
In 2010, the Company executed a sale-leaseback arrangement with an existing investor, under which a wholly owned subsidiary of the Company entered into a 15-year master leaseback arrangement. The assets sold to the investor were valued at $25.2 million. The Company’s subsidiary leased the solar energy systems to end-user customers. The obligations of the Company’s subsidiary to the investor for this arrangement together with a funding arrangement entered into in 2009 with the same investor are guaranteed by the Company and supported by a $1.25 million restricted cash escrow. The amount in escrow is reduced by $0.25 million per annum in each of the first four years commencing in 2010, and the remaining balance remains in place until the end of the master lease period. Under this arrangement, the Company’s subsidiary is responsible for services such as warranty support, accounting, lease servicing and performance reporting.
As of December 31, 2012 and 2011, the Company had contributed assets with a cost of $46.6 million and $10.3 million, respectively, to its wholly owned subsidiary that in turn sold the assets to a new investor and then executed a 15-year master leaseback agreement with the investor. Under this arrangement, the tax benefits from investment tax credits or Treasury grants in lieu of tax credits inure to the investor as the owner of the assets. A total of $100 million in financing is available from the investor under this fund arrangement in the form of proceeds from the sale of the assets. The investor committed to further increase the funding commitment to
106
Table of Contents
SolarCity Corporation
Notes to Consolidated Financial Statements (continued)
$280 million, subject to certain conditions being met as set out in the contractual agreements. As of December 31, 2012, the Company had utilized $100 million under this arrangement.
The Company has committed to make certain investors that have executed sale-leaseback arrangements with the Company whole for any reductions in the tax credit or U.S. Treasury awards resulting from changes in the tax basis submitted. The Company accrues any such payments due to these investors. Through December 31, 2012, the Company had recorded a total $0.7 million refundable to a single sale-leaseback investor.
The Company has accounted for these sale-leaseback arrangements in accordance with the Company’s accounting policy as described in Note 2.
15. Sale-Leaseback Financing Obligation
In November 2009, the Company entered into an arrangement with an investor to finance the development, construction and installation of a ground mounted solar system that was leased to a customer. The Company also entered into an agreement to sell the system to the investor for a cash consideration of $27.2 million, of which $23.7 million was received prior to December 31, 2012 and the balance of $3.5 million is receivable at the end of the lease period and accrues interest at an annual rate of 4.37%. Concurrent with the sale, a subsidiary of the Company entered into an agreement with the investor to lease back the solar energy system from the investor with lease payments being made on a quarterly basis. The Company’s subsidiary has the option to purchase the system at the end of the lease term of 10 years for a price which is the greater of the fair market value or a predetermined agreed upon value. Additionally, the investor has the option to put its interest in the solar system to the Company within two years following the expiry of six years after placement in service of the solar system, for a value that is the greater of the fair value or a predetermined agreed upon value. As a result of these put and call options, the Company has concluded that it has a continuing involvement with the solar energy system.
The Company has determined that the ground mounted solar energy system qualifies as integral equipment and therefore as a real estate transaction under ASC 360-20, Real Estate Sales, and has been accounted for as a financing. Under the financing method, the receipts from the tax equity investor are reflected as a sale-leaseback financing obligation on the consolidated balance sheets, and the Company retains the solar energy system asset on the consolidated balance sheets within solar energy systems and depreciates the solar energy system over its estimated useful life of 30 years. The Company also continues to report all of the results of the operations of the system, with the revenue and expenses from the system operations being presented on the consolidated statements of operations on a “gross” basis. As of December 31, 2012, the balance of sale-leaseback financing obligation outstanding was $15.2 million of which $0.4 million has been classified as current and the balance of $14.8 million has been classified as noncurrent. As of December 31, 2011, the balance of sale-leaseback financing obligation outstanding was $15.5 million, of which $0.4 million has been classified as current and the balance of $15.1 million has been classified as noncurrent.
As of December 31, 2012, future minimum annual rentals to be received from the customer for each of the next five years and thereafter are as follows (in thousands):
| 2013 |
$ | 457 | ||
| 2014 |
466 | |||
| 2015 |
475 | |||
| 2016 |
485 | |||
| 2017 |
494 | |||
| Thereafter |
3,746 | |||
|
|
|
|||
| Total |
$ | 6,123 | ||
|
|
|
107
Table of Contents
SolarCity Corporation
Notes to Consolidated Financial Statements (continued)
The amounts in the table above are also included as part of the noncancelable operating lease payments from customers disclosed in Note 4.
As of December 31, 2012, future minimum annual payments to be paid to the investor under the financing arrangement for each of the next five years and thereafter are as follows (in thousands):
| 2013 |
$ | 1,245 | ||
| 2014 |
1,251 | |||
| 2015 |
1,257 | |||
| 2016 |
1,264 | |||
| 2017 |
1,270 | |||
| Thereafter |
2,560 | |||
|
|
|
|||
| Total |
$ | 8,847 | ||
|
|
|
The obligations of the Company’s subsidiary to the investor together with the obligations of the Company’s subsidiary under the sale-leaseback fund arrangements discussed in Note 14, are guaranteed by the Company and supported by a $1.25 million restricted cash escrow that reduces by $0.25 million per annum for the first four years, and remains in place until the end of the master lease period. As of December 31, 2012, $0.5 million was held as restricted cash.
16. Convertible Redeemable Preferred Stock, Warrant Liability and Stockholders’ Equity
Stock Split
The Company’s stockholders approved a 2-for-1 forward stock split of each share of the Company’s common stock and preferred stock that became effective on March 27, 2012. The stockholders also approved a proportionate increase in the authorized number of shares of the Company’s common stock, preferred stock and each series of preferred stock and also approved proportionate adjustments to the conversion prices, dividend rates, original issue prices and liquidation preferences of each series of the Company’s preferred stock. The number of the Company’s pre-split common stock covered by stock options issued under the Company’s stock options plans were also proportionately increased to reflect the stock split. The share information and the per share amounts in these financial statements have been retroactively adjusted to reflect the impact of the stock split.
Convertible Redeemable Preferred Stock
Prior to its initial public offering of common stock, the Company had 12.0 million shares designated Series A convertible redeemable preferred stock, 5.0 million shares designated Series B convertible redeemable preferred stock, 9.2 million shares designated Series C convertible redeemable preferred stock, 5.8 million shares designated Series D convertible redeemable preferred stock, 4.4 million shares designated Series E convertible redeemable preferred stock, 3.4 million shares designated Series E-1 convertible redeemable preferred stock, 2.1 million shares designated Series F convertible redeemable preferred stock and 3.4 million shares designated Series G convertible redeemable preferred stock. All outstanding shares of preferred stock converted to 50.4 million shares of common stock upon the closing of the Company’s initial public offering of common stock on December 18, 2012.
Preferred Stock Warrant Liability
In connection with the issuance of the convertible bridge notes in July 2007, in August 2007 the Company issued warrants to the note holders to purchase 124,924 shares of the Company’s Series C convertible redeemable preferred stock at $2.40 per share. The warrants were to expire at the earlier of five years from the date of their issuance or any change of control, or the initial public offering of the Company’s common stock. These warrants were exercised in August 2012.
108
Table of Contents
SolarCity Corporation
Notes to Consolidated Financial Statements (continued)
During 2008, the Company issued warrants to a fund investor to purchase up to 2.70 million shares (subsequently adjusted pursuant to its terms to 3.12 million shares) of Series C convertible redeemable preferred stock at an exercise price equal to $2.88 per share (subsequently adjusted pursuant to its terms to $3.80 per share), of which warrants to purchase 2.08 million shares were vested as of December 31, 2010. In February 2011, the fund investor exercised its Series C convertible redeemable preferred stock warrants and was issued 375,200 shares of Series C convertible redeemable preferred stock.
During 2010, the Company issued warrants to a fund investor to purchase 995,006 shares of Series E convertible redeemable preferred stock at an exercise price equal to $5.41 per share, in connection with solar financing funds (Note 12). In 2011, in connection with the amendment of this funding arrangement to increase the amount that would be contributed by the tax equity investor from $120 million to $218 million, and to extend the time period to complete the construction and placement in service of the solar energy systems, the Company issued warrants to the fund investor to purchase a further 490,004 shares of Series E convertible redeemable preferred stock at an exercise price equal to $5.41 per share. These warrants were converted to common stock warrants upon the closing of the Company’s initial public offering of its common stock on December 18, 2012 and continue with the same terms.
In June 2011, in connection with the issuance of 2.0 million shares of Series F convertible redeemable preferred stock, the Company issued warrants to the investors to acquire 0.2 million shares of Series F convertible redeemable preferred stock, with an exercise price of $9.68. In November 2012, warrants to acquire 8,076 shares of Series F convertible redeemable preferred stock were exercised by an investor, while the remaining warrants expired unexercised upon the closing of the Company’s initial public offering of its common stock on December 18, 2012.
As discussed in Note 2, the Company accounts for the warrants in accordance with ASC 480 as a liability carried at fair value. The warrants were subject to revaluation at each balance sheet date and any change in fair value was recognized as a component of other expense. The Company determined the fair value of these warrants using the Black-Scholes option-pricing model. The Company adjusted the warrant liability for changes in fair value until the earlier of the exercise of the warrants or upon the conversion of the preferred stock warrants into common stock warrants.
Common Stock
At the inception of the Company in June 2006, the founders were issued four million shares of common stock at an issuance price of $0.0001 per share.
On December 18, 2012, the Company closed its initial public offering of its common stock and issued 11,434,988 shares of common stock at a price of $8.00 per share. On December 20, 2012, the Company issued an additional 1,725,000 shares of common stock at a price of $8.00 per share pursuant to the underwriters’ exercise of their over-allotment option. The net proceeds realized was $92.4 million net of underwriters discounts and commissions and offering costs of $12.9 million.
Restricted Stock Units
On September 17, 2012, the Company awarded a special, one-time grant of restricted stock units covering 16,991 shares of common stock to a board member. The restricted stock units vest over four years: 25% after one year of service and the remaining in equal monthly installments over the following 36 months of service. As of December 31, 2012, none of the restricted stock units have vested.
109
Table of Contents
SolarCity Corporation
Notes to Consolidated Financial Statements (continued)
Shares Reserved for Future Issuance
As of December 31, 2012 and 2011, the Company has reserved shares of common stock for issuance as follows (in thousands):
| December 31, | ||||||||
| 2012 | 2011 | |||||||
| Series A convertible redeemable preferred stock |
— | 12,039 | ||||||
| Series B convertible redeemable preferred stock |
— | 5,010 | ||||||
| Series C convertible redeemable preferred stock |
— | 9,120 | ||||||
| Series D convertible redeemable preferred stock |
— | 5,781 | ||||||
| Series E convertible redeemable preferred stock |
— | 4,436 | ||||||
| Series E-1 convertible redeemable preferred stock |
— | 3,440 | ||||||
| Series F convertible redeemable preferred stock |
— | 2,067 | ||||||
| Series G convertible redeemable preferred stock |
— | — | ||||||
| Share-based compensation plans: |
||||||||
| Shares available for grant |
8,490 | 1,040 | ||||||
| Options outstanding |
14,903 | 13,873 | ||||||
| Restricted stock units outstanding |
17 | — | ||||||
| Employee Stock Purchase Plan |
1,300 | — | ||||||
| Warrants to purchase Series C convertible redeemable preferred stock |
— | 3,246 | ||||||
| Warrants to purchase Series E convertible redeemable preferred stock |
— | 2,750 | ||||||
| Warrants to purchase Series F convertible redeemable preferred stock |
— | 206 | ||||||
| Warrants to acquire common stock |
1,485 | — | ||||||
|
|
|
|
|
|||||
| Total |
26,195 | 63,008 | ||||||
|
|
|
|
|
|||||
17. Stock Option Plans
Under the Company’s 2007 Stock Plan, the Company may grant options to purchase or directly issue incentive stock options and nonstatutory stock options, respectively, of common stock to employees, directors, and consultants. Incentive stock options may be granted at a price per share not less than 100% of the fair market value at date of grant. If the incentive stock option is granted to a 10% stockholder, then the purchase or exercise price per share shall not be less than 110% of the fair market value per share of common stock on the grant date. Nonstatutory stock options may be granted at a price per share, not less than 100% of the fair market value at date of grant. Options granted are exercisable over a maximum term of 10 years from the date of grant and generally vest over a period of four years.
In September 2012, the Company adopted a director compensation plan for future non-employee directors. Under the director compensation plan, each individual who joins the board of directors as a non-employee director following the adoption of the plan will receive an initial stock option grant to purchase 30,000 shares of common stock at the time of initial election or appointment and additional triennial stock option grants to purchase 15,000 shares of common stock, as well as an annual cash retainer of $15,000, all of which are subject to continued service on the board of directors. Such non-employee directors who serve on committees of the board of directors will receive various specified additional equity awards and cash retainers.
110
Table of Contents
SolarCity Corporation
Notes to Consolidated Financial Statements (continued)
A summary of stock option activity is as follows (in thousands, except per share amounts):
| Options | Weighted- Average Exercise Price |
Weighted- Average Remaining Contractual Term |
Aggregate Intrinsic Value |
|||||||||||||
| Outstanding – January 1, 2010 |
6,628 | $ | 1.12 | 8.54 | $ | 1,684 | ||||||||||
| Granted (weighted-average fair value of $1.98) |
3,888 | 1.98 | — | — | ||||||||||||
| Exercised |
(450 | ) | 0.205 | — | — | |||||||||||
| Canceled |
(320 | ) | 1.62 | — | — | |||||||||||
|
|
|
|
|
|
|
|
|
|||||||||
| Outstanding – December 31, 2010 |
9,746 | $ | 1.49 | 7.39 | $ | 18,570 | ||||||||||
| Granted (weighted-average fair value of $5.035) |
7,043 | 5.035 | — | — | ||||||||||||
| Exercised |
(1,489 | ) | 0.73 | — | — | |||||||||||
| Canceled |
(1,427 | ) | 2.435 | — | — | |||||||||||
|
|
|
|
|
|
|
|
|
|||||||||
| Outstanding – December 31, 2011 |
13,873 | $ | 3.28 | 8.22 | $ | 37,606 | ||||||||||
| Granted (weighted-average fair value of $11.08) |
3,082 | 11.08 | — | — | ||||||||||||
| Exercised |
(902 | ) | 1.91 | — | — | |||||||||||
| Canceled |
(1,150 | ) | 5.55 | — | — | |||||||||||
|
|
|
|
|
|
|
|
|
|||||||||
| Outstanding – December 31, 2012 |
14,903 | $ | 4.80 | 7.67 | $ | 107,653 | ||||||||||
|
|
|
|
|
|
|
|
|
|||||||||
| Options vested and exercisable – December 31, 2010 |
3,810 | $ | 1.02 | 6.15 | $ | 9,055 | ||||||||||
|
|
|
|
|
|
|
|
|
|||||||||
| Options vested and exercisable – December 31, 2011 |
5,044 | $ | 1.85 | 7.45 | $ | 20,823 | ||||||||||
|
|
|
|
|
|
|
|
|
|||||||||
| Options vested and exercisable – December 31, 2012 |
7,374 | $ | 2.73 | 6.89 | $ | 67,864 | ||||||||||
|
|
|
|
|
|
|
|
|
|||||||||
| Options vested and expected to vest – December 31, 2010 |
8,992 | $ | 1.455 | 7.30 | $ | 17,463 | ||||||||||
|
|
|
|
|
|
|
|
|
|||||||||
| Options vested and expected to vest – December 31, 2011 |
13,834 | $ | 3.27 | 8.21 | $ | 37,502 | ||||||||||
|
|
|
|
|
|
|
|
|
|||||||||
| Options vested and expected to vest – December 31, 2012 |
13,940 | $ | 4.61 | 7.60 | $ | 103,187 | ||||||||||
|
|
|
|
|
|
|
|
|
|||||||||
The aggregate intrinsic value of options exercised during the years ended December 31, 2012 and 2011, was (in thousands) $8,988 and $5,437, respectively. The grant date fair market value of options that vested in the years ended December 31, 2012, 2011 and 2010 was (in thousands) $13,313, $3,897 and $1,939, respectively.
As of December 31, 2012 and 2011, there was approximately $30.0 million and $24.7 million, respectively, of total unrecognized stock-based compensation expense, net of estimated forfeitures related to nonvested stock options, which are expected to be recognized over the weighted average period of 2.62 and 3.01, respectively.
111
Table of Contents
SolarCity Corporation
Notes to Consolidated Financial Statements (continued)
Under ASC 718, the Company estimates the fair value of stock options granted on each grant date using the Black-Scholes option valuation model and applies the straight-line method of expense attribution. The fair values were estimated on each grant date for the years ended December 31, 2012, 2011 and 2010, with the following weighted-average assumptions:
| December 31, | ||||||
| 2012 | 2011 | 2010 | ||||
| Dividend yield |
0% | 0% | 0% | |||
| Annual risk-free rate of return |
1.07% | 1.95% | 2.50% | |||
| Expected volatility |
89.52% | 87.26% | 88.49% | |||
| Expected term (years) |
6.19 | 6.09 | 5.98 | |||
The expected volatility was calculated based on the average historical volatilities of publicly traded peer companies, determined by the Company. The risk free interest rate used was based on the U.S. Treasury yield curve in effect at the time of grant for the expected term of the stock options to be valued. The expected dividend yield was zero, as the Company does not anticipate paying a dividend within the relevant time frame. The expected term has been estimated using the simplified method allowed under ASC 718.
As part of the requirements of ASC 718, the Company is required to estimate potential forfeitures of stock grants and adjust stock-based compensation expense accordingly. The estimate of forfeitures will be adjusted over the requisite service period to the extent that actual forfeitures differ, or are expected to differ, from such estimates. Changes in estimated forfeitures will be recognized in the period of change and will also impact the amount of stock-based compensation expenses to be recognized in future periods.
The amount of stock-based compensation expense recognized during the years ended December 31, 2012, 2011 and 2010 was (in thousands) $10,734, $5,051 and $1,773, respectively. The Company capitalized costs of (in thousands) $2,770, $1,417 and $417, in the years ended December 31, 2012, 2011 and 2010, respectively, as a component of work-in-progress, within solar energy systems leased to customers and solar energy systems held for lease to customers.
This expense was included in cost of revenue and in operating expenses as follows (in thousands):
| Year Ended December 31, | ||||||||||||
| 2012 | 2011 | 2010 | ||||||||||
| Cost of revenue |
$ | 441 | $ | 151 | $ | 144 | ||||||
| Sales and marketing |
1,316 | 443 | 233 | |||||||||
| General and administrative |
6,207 | 3,040 | 979 | |||||||||
18. Income Taxes
The Company accounts for income taxes using the asset and liability method. Under this method, deferred income tax assets and liabilities are determined based upon the difference between the consolidated financial statement carrying amounts and the tax basis of assets and liabilities and are measured using the enacted tax rate expected to apply to taxable income in the years in which the differences are expected to be reversed.
112
Table of Contents
SolarCity Corporation
Notes to Consolidated Financial Statements (continued)
The following table presents domestic and foreign components of income (loss) before income taxes for the periods presented (in thousands):
| Year Ended December 31, | ||||||||||||
| 2012 | 2011 | 2010 | ||||||||||
| United States |
$ | (64,319 | ) | $ | 43,595 | $ | (38,552 | ) | ||||
| Noncontrolling interest |
(27,384 | ) | (117,230 | ) | (8,457 | ) | ||||||
| Foreign |
56 | 13 | — | |||||||||
|
|
|
|
|
|
|
|||||||
| Total |
$ | (91,647 | ) | $ | (73,622 | ) | $ | (47,009 | ) | |||
|
|
|
|
|
|
|
|||||||
The income tax provision (benefit) is composed of the following (in thousands):
| Year Ended December 31, | ||||||||||||
| 2012 | 2011 | 2010 | ||||||||||
| Current: |
||||||||||||
| Federal |
$ | 10 | $ | (26 | ) | $ | 10 | |||||
| State |
16 | 107 | 55 | |||||||||
| Foreign |
15 | 4 | — | |||||||||
|
|
|
|
|
|
|
|||||||
| Total Current Provision |
41 | 85 | 65 | |||||||||
|
|
|
|
|
|
|
|||||||
| Deferred: |
||||||||||||
| Federal |
12 | $ | 7 | — | ||||||||
| State |
1 | — | — | |||||||||
| Foreign |
— | — | — | |||||||||
|
|
|
|
|
|
|
|||||||
| Total Deferred Provision |
13 | 7 | — | |||||||||
|
|
|
|
|
|
|
|||||||
| Total provision for income taxes |
$ | 54 | $ | 92 | $ | 65 | ||||||
|
|
|
|
|
|
|
|||||||
The following table presents a reconciliation of the statutory federal rate and the Company’s effective tax rate for the periods presented:
| Year Ended December 31, | ||||||||||||
| 2012 | 2011 | 2010 | ||||||||||
| Tax provision (benefit) at federal statutory rate |
(34.00)% | (34.00)% | (34.00)% | |||||||||
| State income taxes (net of federal benefit) |
(0.87) | (4.59) | (5.86) | |||||||||
| NCI adjustment |
(38.93) | 19.38 | 11.07 | |||||||||
| Investment in solar funds |
42.20 | 6.34 | 5.89 | |||||||||
| Stock-based compensation |
2.49 | 1.48 | 1.25 | |||||||||
| ASC 810 prepaid tax expense |
0.00 | 0.16 | 0.09 | |||||||||
| Purchase accounting adjustment |
26.29 | 0.00 | 0.00 | |||||||||
| Other |
1.30 | 1.11 | 1.91 | |||||||||
| Change in valuation allowance |
1.59 | 10.24 | 19.78 | |||||||||
|
|
|
|
|
|
|
|||||||
| Effective tax rate |
0.07% | 0.12% | 0.13% | |||||||||
|
|
|
|
|
|
|
|||||||
113
Table of Contents
SolarCity Corporation
Notes to Consolidated Financial Statements (continued)
Deferred income taxes reflect the net tax effects of temporary differences between the carrying amounts of assets and liabilities for financial reporting purposes and the amounts used for income tax purposes. The following table presents significant components of the Company’s deferred tax assets and liabilities for the periods presented (in thousands):
| December 31, | ||||||||
| 2012 | 2011 | |||||||
| Deferred tax assets: |
||||||||
| Accruals and reserves |
$ | 9,483 | $ | 8,216 | ||||
| Net operating losses |
72,549 | 34,399 | ||||||
| Accelerated gain on assets |
28,389 | 14,302 | ||||||
| Investment in solar funds |
24,135 | 18,346 | ||||||
| Tax rebate revenue |
39,739 | 27,021 | ||||||
| Other credits |
1,404 | 450 | ||||||
|
|
|
|
|
|||||
| Gross deferred tax assets |
175,699 | 102,734 | ||||||
| Valuation allowance |
(51,149 | ) | (49,692 | ) | ||||
|
|
|
|
|
|||||
| Net deferred tax assets |
124,550 | 53,042 | ||||||
| Deferred tax liabilities: |
||||||||
| Depreciation and amortization |
(82,925 | ) | (44,052 | ) | ||||
| Investment in solar funds |
(21,878 | ) | (148 | ) | ||||
| Other deferred tax liabilities |
(19,767 | ) | (8,849 | ) | ||||
|
|
|
|
|
|||||
| Gross deferred tax liabilities |
(124,570 | ) | (53,049 | ) | ||||
|
|
|
|
|
|||||
| Net deferred taxes |
$ | (20 | ) | $ | (7 | ) | ||
|
|
|
|
|
|||||
An analysis of current and noncurrent deferred tax assets and liabilities is as follows:
| December 31, | ||||||||
| 2012 | 2011 | |||||||
| Current: |
||||||||
| Deferred tax assets |
$ | 8,583 | $ | 8,809 | ||||
| Less: valuation allowance |
(2,813 | ) | (4,503 | ) | ||||
| Net current deferred tax assets |
$ | 5,770 | $ | 4,306 | ||||
| Noncurrent: |
||||||||
| Deferred tax assets |
$ | 166,151 | $ | 93,449 | ||||
| Deferred tax liabilities |
(123,605 | ) | (52,573 | ) | ||||
| Total noncurrent gross deferred tax assets |
42,546 | 40,876 | ||||||
| Less: valuation allowance |
(48,336 | ) | (45,189 | ) | ||||
|
|
|
|
|
|||||
| Net noncurrent deferred tax liabilities |
$ | (5,790 | ) | $ | (4,313 | ) | ||
|
|
|
|
|
|||||
As of December 31, 2012 and 2011, the Company had federal net operating loss carryforwards of approximately $205.1 million and $97.0 million, respectively. The net operating loss carryforwards expire at various dates beginning in 2027 if not utilized. In addition, the Company had net operating losses for California income tax purposes of approximately $56.2 million and $37.0 million, as of December 31, 2012 and 2011, respectively, which expire at various dates beginning in 2020 if not utilized. The Company also had net operating losses for other state income tax purposes of approximately $14.5 million and $2.7 million, as of December 31,
114
Table of Contents
SolarCity Corporation
Notes to Consolidated Financial Statements (continued)
2012 and 2011. As of December 31, 2012 and 2011, the Company had federal investment tax credit carryforwards of approximately $0.63 million and $0.15 million, respectively. The net investment tax credit carryforward begins to expire in 2028 if not utilized.
The Company’s valuation allowance increased by approximately $1.5 million for the year ended December 31, 2012 and by approximately $10.5 million for the year ended December 31, 2011. The increase in the valuation allowance was primarily related to the operating losses. The valuation allowance is determined in accordance with the provisions of ASC 740, Income Taxes, which requires an assessment of both negative and positive evidence when measuring the need for a valuation allowance. Based on the available objective evidence and the Company’s history of losses, management believes it is more likely than not that the net deferred tax assets will not be realized. As of December 31, 2012 and 2011, the Company has applied a valuation allowance against its deferred tax assets net of the expected income from the reversal of the deferred tax liabilities.
Utilization of the net operating loss carryforwards and credits may be subject to a substantial annual limitation due to the ownership change limitations provided by the Internal Revenue Code of 1986, as amended, and similar state provisions. The annual limitation may result in the expiration of net operating losses and credits before utilization. The Company completed a Section 382 analysis through December 2011 and determined that an ownership change, as defined under Section 382 of the Internal Revenue Code, occurred in prior years. Based on the analysis, the Company has undergone two ownership changes. The first ownership change occurred on July 7, 2006, and the second ownership change occurred on August 8, 2007. The Company has updated its Section 382 analysis through the year ended December 31, 2012 and does not have any additional limitations. Net Operating Loss carryforwards presented have accounted for any limited and potential lost attributes due to the ownership changes and expiration dates.
As part of the assets monetization strategy, the Company has agreements to sell solar energy systems to the solar financing fund joint ventures. The gain on the sale of the assets has been eliminated in the consolidated financial statements. These transactions are treated as inter-company sales and as such, tax is not recognized on the sale until the Company no longer benefits from the underlying asset. Since the systems remain within the consolidated group, the tax expense incurred related to these sales is being deferred and amortized over the estimated useful life of the underlying systems which has been estimated to be 30 years. The deferral of the tax expense results in recording of a prepaid tax expense that is included in the consolidated balance sheets as other assets. As of December 31, 2012 and 2011 the Company recorded a long-term prepaid tax expense of $2.0 million and $3.3 million, respectively, net of amortization. The amortization of the prepaid tax expense in each period makes up the major component of the tax expense.
As a result of the Company’s acquisition of the non-controlling interest in certain of its financing partnership funds on December 31, 2012, the Company accounted for the direct impacts of the acquisition as an adjustment to other paid in capital, while the indirect impacts of the transaction were accounted for in the statement of operations. Since the Company owns 100% of these financing funds, the partnerships were treated as terminated for U.S. income tax purposes. Due to the deemed liquidation of these partnerships the Company recognized $2.5 million of taxable income resulting from liquidating distributions of cash and assets. This taxable income was offset by the current year net operating losses, resulting in a net zero impact to the statement of operations. The Company also recognized a net deferred tax liability of $17.3 million resulting mainly from accelerated depreciation previously taken for tax purposes not for book purposes. The impact of setting up this deferred tax liability was offset by a release of valuation allowance, resulting in a net zero impact to the statement of operations.
It is the intention of the Company to reinvest the earnings of its non-U.S. subsidiary in foreign operations. The Company does not provide for U.S. income taxes on the earnings of foreign subsidiary as such
115
Table of Contents
SolarCity Corporation
Notes to Consolidated Financial Statements (continued)
earnings are to be reinvested indefinitely. As of December 31, 2012, there is $0.1 million of cumulative earnings upon which U.S. income taxes have not been provided.
Uncertain Tax Positions
As of December 31, 2012 and 2011, the Company had no amount of unrecognized tax benefits.
The interest expense and penalties for uncertain tax positions will be classified in the consolidated financial statements as income tax expense. There was no interest and penalties accrued for any uncertain tax positions as of December 31, 2012 and 2011.
The Company does not have any tax positions for which it is reasonably possible the total amount of gross unrecognized benefits will increase or decrease within 12 months of the year ended December 31, 2012.
The Company is subject to taxation and files income tax returns in the U.S., various state, local, and foreign jurisdictions. Due to the Company’s net losses, substantially all of its federal, state, local, and foreign income tax returns since inception are still subject to audit.
19. Defined Contribution Plan
In January 2007, the Company established a 401(k) Retirement Plan, or “the Retirement Plan”, available to employees who meet the plan’s eligibility requirements. Participants may elect to contribute a percentage of their compensation to the Retirement Plan up to a statutory limit. Participants are fully vested in their contributions. The Company may make discretionary contributions to the Retirement Plan as a percentage of participant contributions, subject to established limits. The Company did not make any contributions to the Retirement Plan during the years ended December 31, 2012, 2011 and 2010.
20. Related Party Transactions
The Company’s operations for the years ended December 31, 2012, 2011 and 2010, include the following related party transactions (in thousands):
| December 31, | ||||||||||||
| 2012 | 2011 | 2010 | ||||||||||
| Net Revenue, Systems: |
||||||||||||
| Installation of electric vehicle charging stations to a related party |
$ | 937 | $ | — | $ | — | ||||||
| Expenditures: |
||||||||||||
| Purchase of inventory from an investor |
$ | — | $ | — | $ | 9,259 | ||||||
| Payment of consulting fees and sales commissions to another investor (included in sales and marketing) |
— | — | 79 | |||||||||
The investor from whom the Company purchased inventory as noted above ceased to be an investor in the Company in December 2010.
Related party balances as of December 31,2012 and 2011, comprise (in thousands):
| December 31, | ||||||||
| 2012 | 2011 | |||||||
| Due from a related party (included in accounts receivable) |
$ | 932 | $ | — | ||||
116
Table of Contents
SolarCity Corporation
Notes to Consolidated Financial Statements (continued)
21. Commitments and Contingencies
Noncancelable Operating Leases
The Company leases office and warehouse facilities under noncancelable operating leases primarily for its United States based warehouse locations. In addition, the Company leases equipment under noncancelable operating leases. Aggregate rent expense for facilities and equipment for the years ended December 31, 2012, 2011 and 2010, was $4.2 million, $2.9 million and $1.6 million, respectively.
Future minimum lease payments under noncancelable operating leases as of December 31, 2012, are as follows (in thousands):
| 2013 |
$ | 9,842 | ||
| 2014 |
8,743 | |||
| 2015 |
7,906 | |||
| 2016 |
6,527 | |||
| 2017 |
5,370 | |||
| Thereafter |
29,211 | |||
|
|
|
|||
| Total minimum payments |
$ | 67,599 | ||
|
|
|
Indemnification and Guaranteed Returns
As disclosed in Notes 12 and 14, the Company has contractually committed to compensate certain fund investors for losses that the fund investors may suffer in certain limited circumstances resulting from reductions in the tax credit or U.S. Treasury grants resulting from changes in the tax basis submitted that results in the reduction of tax credits or U.S. Treasury grants in lieu of tax credits. The Company has recognized in the consolidated financial statements as of December 31, 2012, the potential exposure of these obligations based on all the information available as of that date, including guidelines from the U.S. Treasury on solar energy systems valuations for purposes of Treasury grants payments. The Company believes that any other payments to its fund investors arising from these obligations were not probable based on facts known as of December 31, 2012. As mentioned in Note 23, Subsequent Events, the Company will have to make additional payments to certain investors under these obligations due to certain events arising after December 31, 2012.
As disclosed in Note 12, as of December 31, 2012 the Company is contractually required to make payments to an investor in one of its funds to ensure the investor achieves a specified minimum internal rate of return. The investor in this fund has already received a significant portion of the projected economic benefits from U.S. Treasury grant distributions and tax depreciation benefits. The contractual provisions of this fund state that the fund has an indefinite term unless the members agree to dissolve the fund. Based on the Company’s current financial projections regarding the amount and timing of future distributions to the investor, the Company does not expect to make any payments as a result of this guarantee and has not accrued any liabilities relating to this guarantee. The amounts of potential future payments under this guarantee is dependent on the amounts and timing of future distributions to the investor from the fund, and the tax benefits that accrue to the investor from the fund activities. Due to uncertainties surrounding estimating the amounts of these factors, the Company is unable to estimate the maximum potential payments that could be payable under these guarantees. As of December 31, 2012, the investors had achieved the annual minimum as determined in accordance with the contractual provisions of the fund.
As discussed in Note 13, under the lease pass-through financing funds is a one-time lease payment reset mechanism that is set to occur after the installation of all the solar energy systems in a fund. As a result of this mechanism, the Company may be required to refund master lease prepayments previously received from investors. Any refunds of lease prepayments would reduce the lease pass-through financing obligation.
117
Table of Contents
SolarCity Corporation
Notes to Consolidated Financial Statements (continued)
22. Basic and Diluted Net Income (Loss) Per Share
The following table sets for the computation of the Company’s basic and diluted net income (loss) per share during the years ended December 31, 2012, 2011, and 2010 (in thousands, except share and per share amounts):
| Year Ended December 31, | ||||||||||||
| 2012 | 2011 | 2010 | ||||||||||
| Net income (loss) attributable to stockholders |
$ | (64,191 | ) | $ | 43,516 | $ | (38,617 | ) | ||||
| Noncumulative dividends on convertible redeemable preferred stock(1) |
— | (1,633 | ) | — | ||||||||
| Undistributed earnings allocated to convertible redeemable preferred stockholders(2) |
— | (33,658 | ) | — | ||||||||
| Deemed dividend to Series G convertible redeemable preferred stock prior to conversion(3) |
(10,091 | ) | — | — | ||||||||
|
|
|
|
|
|
|
|||||||
| Net income (loss) attributable to common stockholders, basic |
$ | (74,282 | ) | $ | 8,225 | $ | (38,617 | ) | ||||
|
|
|
|
|
|
|
|||||||
| Adjustment to revaluation of convertible redeemable preferred stock warrants(4) |
(277 | ) | — | — | ||||||||
| Adjustment to undistributed earnings allocated to convertible redeemable preferred stockholders(5) |
— | 2,764 | — | |||||||||
|
|
|
|
|
|
|
|||||||
| Net income (loss) attributable to common stockholders, diluted |
$ | (74,559 | ) | $ | 10,989 | $ | (38,617 | ) | ||||
|
|
|
|
|
|
|
|||||||
| Weighted average shares used to compute net income (loss) per share attributable to common stockholders, basic |
14,240,187 | 9,977,646 | 8,583,772 | |||||||||
| Weighted average of dilutive convertible redeemable preferred stock warrants outstanding |
27,580 | — | — | |||||||||
| Dilutive effect of common stock options |
— | 4,546,088 | — | |||||||||
|
|
|
|
|
|
|
|||||||
| Weighted average shares used to compute net income (loss) per share attributable to common stockholders, diluted |
14,267,767 | 14,523,734 | 8,583,772 | |||||||||
|
|
|
|
|
|
|
|||||||
| Net income (loss) per share attributable to common stockholders, basic |
$ | (5.22 | ) | $ | 0.82 | $ | (4.50 | ) | ||||
|
|
|
|
|
|
|
|||||||
| Net income (loss) per share attributable to common stockholders, diluted |
$ | (5.23 | ) | $ | 0.76 | $ | (4.50 | ) | ||||
|
|
|
|
|
|
|
|||||||
| (1) | Noncumulative dividends payable on convertible redeemable preferred stock represents a $0.01 noncumulative preferred dividend that would be payable to convertible redeemable preferred stockholders prior to any other allocations to preferred and common stockholders if all the earnings for each period were distributed. |
| (2) | Undistributed earnings allocated to convertible redeemable preferred stockholders represents the share of available undistributed earnings as adjusted for noncumulative preferred dividends that would be allocated to convertible redeemable preferred stockholders on an as-converted basis. |
| (3) | Deemed dividend to Series G convertible redeemable preferred stock prior to conversion represents the value attributable to a beneficial conversion feature associated with the Series G convertible redeemable preferred stock. The amount was calculated based upon the initial public offering price of $8.00 per share. Upon the closing of the offering, each outstanding share of Series G convertible redeemable preferred stock converted automatically into a number of shares of common stock equal to the quotient obtained by dividing |
118
Table of Contents
SolarCity Corporation
Notes to Consolidated Financial Statements (continued)
| (A) the original issue price of $23.92 per share by (B) the greater of (i) 60% of the initial public offering price (before deducting underwriting discounts and commissions) and (ii) $9.68 (the conversion price of the Series F convertible redeemable preferred stock). As a result of this calculation, and based upon the initial public offering price of $8.00 per share, the 3,386,986 shares of Series G convertible redeemable preferred stock converted into 8,372,065 shares of common stock. The deemed dividend was calculated as the difference between the product of the number of shares of common stock issued upon conversion of the Series G convertible redeemable preferred stock multiplied by the estimated fair value of a share of common stock when the Series G convertible redeemable preferred stock was issued, less the proceeds that were realized upon the issuance of the Series G convertible redeemable preferred stock. The fair value of common stock used for this calculation was determined at each of the three closing dates of the issuance of Series G convertible redeemable preferred stock in February and March 2012. The fair value of common stock was estimated between $10.84 to $10.93 per share, based on an interpolation between the fair values the Company previously determined as of January 31, 2012 and March 12, 2012. |
| (4) | Adjustment to revaluation of convertible redeemable preferred stock warrants represents the impact of no revaluation of convertible redeemable preferred stock warrants, as discussed in Note 2, to reflect the potential impact of dilutive securities. |
| (5) | Adjustment to undistributed earnings allocated to convertible redeemable preferred stockholders represents the impact of reallocation of undistributed earnings allocated to convertible redeemable preferred stockholders, as described in (2) above, to reflect the potential impact of dilutive securities. |
The following outstanding shares of common stock equivalents were excluded from the computation of diluted net income (loss) per share for the periods presented because including them would have been antidilutive:
| Year Ended December 31, | ||||||||||||
| 2012 | 2011 | 2010 | ||||||||||
| Convertible redeemable preferred stock |
42,488,627 | 41,893,046 | 39,450,660 | |||||||||
| Preferred stock warrants and common stock warrants |
835,698 | 1,816,650 | 3,204,748 | |||||||||
| Common stock options |
14,623,766 | 3,678,225 | 9,746,200 | |||||||||
23. Subsequent Events
2013 Solar Financing Funds
During 2013, the Company has entered into a new solar financing fund and amended the contractual terms of an existing solar financing fund to increase available funding, for a total of $105 million in additional available financing.
Term Loan Agreement
On February 8, 2013, a subsidiary of the Company entered into an agreement with a bank for a term loan of $10 million. The loan proceeds were used to finance the Company’s acquisition of a tax equity investor’s interests in three of its financing funds, discussed in Note 12, Solar Financing Funds. The loan bears interest at an annual rate equal to the lower of (i) the sum of LIBOR plus 3.25% and (ii) an interest rate cap of 6.50%. The loan is secured by the assets of certain of the Company’s subsidiaries. The loan is nonrecourse to the Company’s other assets and matures on January 31, 2015. Under the terms of the agreement, the borrower subsidiary is required to meet various restrictive covenants, including meeting certain reporting requirements, such as the completion and presentation of consolidated financial statements.
119
Table of Contents
SolarCity Corporation
Notes to Consolidated Financial Statements (continued)
Federal Government Spending Cuts
In March 2013, the U.S. Department of Treasury announced that as a result of the sequestration of federal spending that took effect after the U.S. Congress was unable to agree on spending cuts required under the Budget Control Act of 2011, all Treasury grant awards made under Section 1603 of the American Recovery and Reinvestment Act of 2009 on or after March 1, 2013 through September 30, 2013 will be reduced by 8.7%, regardless of when the Treasury received the application. As a result, the Company expects to suffer grant shortfalls of approximately $2.4 million associated with its financing funds. The Company considers the events giving rise to this shortfall to have occurred after the balance sheet date and did not provide evidence about conditions that existed at the balance sheet date. Accordingly, the Company has not recognized the impact of these shortfalls in its consolidated financial statement as of December 31, 2012.
120
Table of Contents
ITEM 9. CHANGES IN AND DISAGREEMENTS WITH ACCOUNTANTS ON ACCOUNTING AND FINANCIAL DISCLOSURE
None.
ITEM 9A. CONTROLS AND PROCEDURES
Evaluation of Disclosure Controls and Procedures
Our management is responsible for establishing and maintaining adequate internal control over financial reporting. Management, with the participation of our chief executive officer and our chief financial officer, evaluated the effectiveness of our disclosure controls and procedures as of December 31, 2012. The term “disclosure controls and procedures,” as defined in Rules 13a-15(e) and 15d-15(e) under the Exchange Act, means controls and other procedures of a company that are designed to ensure that information required to be disclosed by a company in the reports that it files or submits under the Exchange Act is recorded, processed, summarized and reported, within the time periods specified in the SEC’s rules and forms. Disclosure controls and procedures include, without limitation, controls and procedures designed to ensure that information required to be disclosed by a company in the reports that it files or submits under the Exchange Act is accumulated and communicated to the company’s management, including its principal executive and principal financial officers, as appropriate to allow timely decisions regarding required disclosure. Management recognizes that any controls and procedures, no matter how well designed and operated, can provide only reasonable assurance of achieving their objectives, and management necessarily applies its judgment in evaluating the cost-benefit relationship of possible controls and procedures. Based on the evaluation of our disclosure controls and procedures as of December 31, 2012, our chief executive officer and chief financial officer concluded that, as of such date, our disclosure controls and procedures were effective at the reasonable assurance level.
Management’s Annual Report on Internal Control Over Financial Reporting
This report does not include a report of management’s assessment regarding internal control over financial reporting or an attestation report of our registered public accounting firm due to a transition period established by rules of the Securities and Exchange Commission for newly public companies.
Changes in Internal Control over Financial Reporting
There were no changes in our internal control over financial reporting identified in connection with the evaluation required by Rule 13a-15(d) and 15d-15(d) of the Exchange Act that occurred during the quarter ended December 31, 2012 that have materially affected, or are reasonably likely to materially affect, our internal control over financial reporting.
None.
121
Table of Contents
PART III
ITEM 10. DIRECTORS, EXECUTIVE OFFICERS, AND CORPORATE GOVERNANCE
The information required by this Item 10 of Form 10-K that is found in our 2012 Proxy Statement to be filed with the SEC in connection with the solicitation of proxies for our 2013 Annual Meeting of Stockholders (2012 Proxy Statement) is incorporated by reference to our 2012 Proxy Statement. The 2012 Proxy Statement will be filed with the SEC within 120 days after the end of the fiscal year to which this report relates.
ITEM 11. EXECUTIVE COMPENSATION
The information required by this Item 11 of Form 10-K that is found in our 2012 Proxy Statement is incorporated by reference to our 2012 Proxy Statement.
ITEM 12. SECURITY OWNERSHIP OF CERTAIN BENEFICIAL OWNERS AND MANAGEMENT AND RELATED STOCKHOLDER MATTERS
The information required by this Item 12 of Form 10-K that is found in our 2012 Proxy Statement is incorporated by reference to our 2012 Proxy Statement.
ITEM 13. CERTAIN RELATIONSHIPS AND RELATED TRANSACTIONS, AND DIRECTOR INDEPENDENCE
The information required by this Item 13 of Form 10-K that is found in our 2012 Proxy Statement is incorporated by reference to our 2012 Proxy Statement.
ITEM 14. PRINCIPAL ACCOUNTANT FEES AND SERVICES
The information required by this Item 14 of Form 10-K that is found in our 2012 Proxy Statement is incorporated by reference to our 2012 Proxy Statement.
122
Table of Contents
PART IV
ITEM 15. EXHIBITS AND FINANCIAL STATEMENT SCHEDULES
Documents filed as part of this report are as follows:
1. Financial Statements
Our Consolidated Financial Statements are listed in the “Index to Consolidated Financial Statements” under Part II, Item 8 of this report.
2. Financial Statement Schedules
The required information is included elsewhere in this report, not applicable, or not material.
3. Exhibits
The exhibits listed in the accompanying “Index to Exhibits” are filed or incorporated by reference as part of this report.
123
Table of Contents
Pursuant to the requirements of Section 13 or 15(d) of the Securities and Exchange Act of 1934, the Registrant has duly caused this report to be signed on its behalf by the undersigned, thereunto duly authorized, on March 27, 2013.
| SOLARCITY CORPORATION | ||
| By: | /s/ Lyndon R. Rive | |
| Lyndon R. Rive | ||
| Chief Executive Officer | ||
124
Table of Contents
POWER OF ATTORNEY
KNOW ALL MEN BY THESE PRESENTS, that each person whose signature appears below constitutes and appoints Lyndon R. Rive and Robert D. Kelly, and each of them, as his true and lawful attorney-in-fact and agent, with full power of substitution and resubstitution, for him and in his name, place and stead, in any and all capacities, to sign any and all amendments (including post-effective amendments) to this Annual Report on Form 10-K, and to file the same, with all exhibits thereto, and other documents in connection therewith, with the Securities and Exchange Commission, granting unto said attorneys-in-fact and agents, and each of them, full power and authority to do and perform each and every act and thing requisite and necessary to be done in connection therewith, as fully to all intents and purposes as he might or could do in person, hereby ratifying and confirming all that said attorneys-in-fact and agents, or any of them, or their or his substitutes, may lawfully do or cause to be done by virtue thereof.
Pursuant to the requirements of the Securities Exchange Act of 1934, this report has been signed below by the following persons on behalf of the Company and in the capacities and on the dates indicated:
| Signature |
Title |
Date | ||
| /s/ Lyndon R. Rive Lyndon R. Rive |
Founder, Chief Executive Officer and Director (Principal Executive Officer) | March 27, 2013 | ||
| /s/ Robert D. Kelly Robert D. Kelly |
Chief Financial Officer (Principal Accounting and Financial Officer) | March 27, 2013 | ||
| /s/ Peter J. Rive Peter J. Rive |
Founder, Chief Operations Officer, Chief Technology Officer and Director | March 27, 2013 | ||
| /s/ Elon Musk Elon Musk |
Chairman of the Board of Directors | March 27, 2013 | ||
| /s/ Raj Atluru Raj Atluru |
Director | March 27, 2013 | ||
| /s/ John H. N. Fisher John H. N. Fisher |
Director | March 27, 2013 | ||
| /s/ Antonio J. Gracias Antonio J. Gracias |
Director | March 27, 2013 | ||
| /s/ Donald R. Kendall, Jr. Donald R. Kendall, Jr. |
Director | March 27, 2013 | ||
| /s/ Nancy E. Pfund Nancy E. Pfund |
Director | March 27, 2013 | ||
| /s/ Jeffrey B. Straubel Jeffrey B. Straubel |
Director | March 27, 2013 | ||
125
Table of Contents
EXHIBIT INDEX
| Exhibit |
Exhibit Description |
Form | File No. | Incorporated by Reference |
Exhibit Filing Date | |||||
| 3.1 | Amended and Restated Certificate of Incorporation of the Registrant | |||||||||
| 3.2 | Amended and Restated Bylaws of the Registrant | |||||||||
| 4.1 | Form of Common Stock Certificate of the Registrant | S-1/A | 333-184317 | 4.1 | November 27, 2012 | |||||
| 4.2 | Form of Warrant | S-1 | 333-184317 | 4.2 | October 5, 2012 | |||||
| 4.3 | Seventh Amended and Restated Investor’s Rights Agreement by and among the Registrant and certain stockholders of the Registrant, dated February 24, 2012 | S-1 | 333-184317 | 4.4 | October 5, 2012 | |||||
| 10.1* | Form of Indemnification Agreement for directors and executive officers | S-1 | 333-184317 | 10.1 | October 5, 2012 | |||||
| 10.2* | 2007 Stock Plan and form of agreements used thereunder | S-1 | 333-184317 | 10.2 | October 5, 2012 | |||||
| 10.3* | 2012 Equity Incentive Plan and form of agreements used thereunder | S-1 | 333-184317 | 10.3 | October 5, 2012 | |||||
| 10.4* | 2012 Employee Stock Purchase Plan and form of agreements used thereunder | S-1 | 333-184317 | 10.4 | October 5, 2012 | |||||
| 10.5 | Office Lease Agreement, between Locon San Mateo, LLC and the Registrant, dated as of July 30, 2010 | S-1 | 333-184317 | 10.5 | October 5, 2012 | |||||
| 10.5a | First Amendment to Lease, between Locon San Mateo, LLC and the Registrant, dated as of November 15, 2010 | S-1 | 333-184317 | 10.5a | October 5, 2012 | |||||
| 10.5b | Second Amendment to Lease, between Locon San Mateo, LLC and the Registrant, dated as of March 31, 2011 | S-1 | 333-184317 | 10.5b | October 5, 2012 | |||||
| 10.6 | Term Loan Agreement between the Registrant and U.S. Bank National Association, dated as of January 24, 2011 | S-1 | 333-184317 | 10.6 | October 5, 2012 | |||||
| 10.6a | First Amendment to Term Loan Agreement between the Registrant and U.S. Bank National Association, dated as of May 1, 2011 | S-1 | 333-184317 | 10.6a | October 5, 2012 | |||||
| 10. 6b | Second Amendment to Term Loan Agreement between the Registrant and U.S. Bank National Association, dated as of October 19, 2011 | S-1 | 333-184317 | 10.6b | October 5, 2012 | |||||
| 10.6c | Third Amendment to Term Loan Agreement between the Registrant and U.S. Bank National Association, dated as of March 6, 2012 | S-1 | 333-184317 | 10.6c | October 5, 2012 |
126
Table of Contents
| Exhibit |
Exhibit Description |
Form | File No. | Incorporated by Reference |
Exhibit Filing Date | |||||
| 10.6d | Revolving Credit Agreement among the Registrant, U.S. Bank National Association and other banks and financial institutions party thereto, dated as of April 1, 2011 | S-1 | 333-184317 | 10.6d | October 5, 2012 | |||||
| 10.7 | Revolving Credit Agreement among the Registrant, U.S. Bank National Association and other banks and financial institutions party thereto, dated as of April 1, 2011 | S-1 | 333-184317 | 10.7 | October 5, 2012 | |||||
| 10.7a | First Amendment to Revolving Credit Agreement among the Registrant, U.S. Bank National Association and other banks and financial institutions party thereto, dated as of October 19, 2011 | S-1 | 333-184317 | 10.7ac | October 5, 2012 | |||||
| 10.7b | Second Amendment to Revolving Credit Agreement among the Registrant, U.S. Bank National Association and other banks and financial institutions party thereto, dated as of March 6, 2012 | S-1 | 333-184317 | 10.7b | October 5, 2012 | |||||
| 10.7c | Third Amendment and Waiver to Revolving Credit Agreement among the Registrant, U.S. Bank National Association and other banks and financial institutions party thereto, dated as of June 28, 2012 | S-1 | 333-184317 | 10.7c | October 5, 2012 | |||||
| 10.8 | Credit Agreement among the Registrant, Bank of America, N.A., Goldman Sachs Bank USA, Credit Suisse AG and Merrill Lynch, Pierce, Fenner & Smith Incorporated, dated as of March 8, 2012 | S-1 | 333-184317 | 10.8 | October 5, 2012 | |||||
| 10.9* | Offer Letter between the Registrant and Robert D. Kelly, dated October 6, 2011 | S-1 | 333-184317 | 10.9 | October 5, 2012 | |||||
| 10.10** | Credit Agreement among the Registrant, Bank of America, N.A. and other banks and financial institutions party thereto, dated as of September 10, 2012 | S-1 | 333-184317 | 10.10 | October 5, 2012 | |||||
| 21.1 | List of Subsidiaries | |||||||||
| 23.1 | Consent of Independent Registered Public Accounting Firm | |||||||||
| 24.1 | Power of Attorney (contained in the signature page to this Annual Report on Form 10-K) | |||||||||
| 31.1 | Certification of the Chief Executive Officer pursuant to Section 302(a) of the Sarbanes-Oxley Act of 2002 | |||||||||
| 31.2 | Certification of the Chief Financial Officer pursuant to Section 302(a) of the Sarbanes-Oxley Act of 2002 |
127
Table of Contents
| Exhibit |
Exhibit Description |
Form | File No. | Incorporated by Reference |
Exhibit Filing Date | |||||
| 32.1† | Certification of the Chief Executive Officer pursuant to 18 U.S.C. Section 1350, as adopted pursuant to Section 906 of the Sarbanes-Oxley Act of 2002 | |||||||||
| 32.2† | Certification of the Chief Financial Officer pursuant to 18 U.S.C. Section 1350, as adopted pursuant to Section 906 of the Sarbanes-Oxley Act of 2002 |
| * | Indicates a management contract or compensatory plan or arrangement. |
| ** | Registrant has omitted portions of the relevant exhibit and filed such exhibit separately with the Securities and Exchange Commission pursuant to a request for confidential treatment under Rule 406 under the Securities Act of 1933, as amended. |
| † | The certifications attached as Exhibit 32.1 and 32.2 that accompany this Annual Report on Form 10-K are not deemed filed with the Securities and Exchange Commission and are not to be incorporated by reference into any filing of SolarCity Corporation under the Securities Act of 1933, as amended, or the Securities Exchange Act of 1934, as amended, whether made before or after the date of this Form 10-K, irrespective of any general incorporation language contained in such filing. |
128