Attached files
| file | filename |
|---|---|
| EX-3.3 - EX-3.3 - OFS Capital Corp | d504495dex33.htm |
| EX-21.1 - EX-21.1 - OFS Capital Corp | d504495dex211.htm |
| EX-31.1 - EX-31.1 - OFS Capital Corp | d504495dex311.htm |
| EX-32.2 - EX-32.2 - OFS Capital Corp | d504495dex322.htm |
| EX-31.2 - EX-31.2 - OFS Capital Corp | d504495dex312.htm |
| EX-32.1 - EX-32.1 - OFS Capital Corp | d504495dex321.htm |
Table of Contents
UNITED STATES
SECURITIES AND EXCHANGE COMMISSION
Washington, DC 20549
Form 10-K
(Mark One)
| x | ANNUAL REPORT PURSUANT TO SECTION 13 OR 15(d) OF THE SECURITIES EXCHANGE ACT OF 1934 |
For the fiscal year ended December 31, 2012
OR
| ¨ | TRANSITION REPORT PURSUANT TO SECTION 13 OR 15(d) OF THE SECURITIES EXCHANGE ACT OF 1934 |
COMMISSION FILE NUMBER: 814-00813
OFS Capital Corporation
(EXACT NAME OF REGISTRANT AS SPECIFIED IN ITS CHARTER)
| Delaware | 46-1339639 | |
| (State or jurisdiction of incorporation or organization) |
(I.R.S. Employer Identification No.) | |
| 2850 West Golf Road, 5th Floor Rolling Meadows, Illinois |
60008 | |
| (Address of principal executive office) | (Zip Code) | |
REGISTRANT’S TELEPHONE NUMBER, INCLUDING AREA CODE:
(847) 734-2060
SECURITIES REGISTERED PURSUANT TO SECTION 12(b) OF THE ACT:
| Title of Each Class |
Name of Each Exchange on Which Registered | |
| Common Stock, par value $0.01 per share | The Nasdaq Global Market |
SECURITIES REGISTERED PURSUANT TO SECTION 12(g) OF THE ACT:
None
Indicate by check mark if the registrant is a well-known seasoned issuer, as defined in Rule 405 of the Securities Act. YES ¨ No x
Indicate by check mark if the registrant is not required to file reports pursuant to Section 13 or Section 15(d) of the Act. YES ¨ No x
Indicate by check mark whether the registrant (1) has filed all reports required to be filed by Section 13 or 15(d) of the Securities Exchange Act of 1934 during the preceding 12 months (or for such shorter periods as the registrant was required to file such reports), and (2) has been subject to such filing requirements for the past 90 days. YES x NO ¨
Indicate by check mark whether the registrant has submitted electronically and posted on its corporate Web site, if any, every Interactive Data File required to be submitted and posted pursuant to Rule 405 of Regulation S-T during the preceding 12 months (or for such shorter period that the registrant was required to submit and post such files). Yes ¨ No ¨
Indicate by check mark if disclosure of delinquent filers pursuant to Item 405 of Regulation S-K is not contained herein, and will not be contained, to the best of registrant’s knowledge, in definitive proxy or information statements incorporated by reference in Part III of this Form 10-K or any amendment to this Form 10-K. ¨
Indicate by check mark whether the registrant is a large accelerated filer, an accelerated filer, a non-accelerated filer, or a smaller reporting company. See the definitions of “large accelerated filer,” “accelerated filer” and “smaller reporting company” in Rule 12b-2 of the Exchange Act. (Check one):
| Large accelerated filer | ¨ | Accelerated filer | ¨ | |||
| Non-accelerated filer | x (Do not check if a smaller reporting company) | Smaller reporting company | ¨ | |||
Indicate by check mark whether the registrant is a shell company (as defined in Rule 12b-2 of the Act) YES ¨ NO x
The aggregate market value of the common stock held by non-affiliates of the registrant as of June 30, 2012 has not been provided because trading of the registrant’s common stock on the Nasdaq Global Market did not commence until November 8, 2012.
On March 22, 2013, there were 9,613,582 shares outstanding of the Registrant’s common stock, $0.01 par value.
DOCUMENTS INCORPORATED BY REFERENCE
Portions of the registrant’s definitive Proxy Statement relating to the registrant’s 2013 Annual Meeting of Stockholders, to be filed with the Securities and Exchange Commission within 120 days following the end of the Company’s fiscal year, are incorporated by reference in Part III of this Annual Report on Form 10-K as indicated herein.
Table of Contents
OFS Capital Corporation, our logo and other trademarks of OFS Capital Corporation are the property of OFS Capital Corporation. All other trademarks or trade names referred to in this annual report on Form 10-K are the property of their respective owners.
Table of Contents
As used in this annual report on Form 10-K, except as otherwise indicated, the terms “OFS Capital,” “the Company,” “we,” “us,” and “our” refer to OFS Capital, LLC, a Delaware limited liability company, and its consolidated subsidiaries for the periods prior to consummation of the BDC Conversion (as defined below), and refer to OFS Capital Corporation, a Delaware corporation, and its consolidated subsidiaries for the periods after the consummation of the BDC Conversion.
On November 7, 2012, we converted from a limited liability company into a corporation. In this conversion, or the BDC Conversion, OFS Capital succeeded to the business of OFS Capital, LLC and its consolidated subsidiaries, and the sole member of OFS Capital, LLC became the sole stockholder of OFS Capital. Thereafter, we filed an election to be regulated as a business development company, or BDC, under the Investment Company Act of 1940, as amended, or the 1940 Act. On November 14, 2012, we completed our initial public offering, or IPO, selling 6,666,667 shares of our common stock at a public offering price of $15 per share, raising $100 million in gross proceeds. Unless otherwise indicated, the disclosure in this annual report on Form 10-K gives effect to the BDC Conversion.
| Item 1. | Business |
GENERAL
We are an externally managed, closed-end, non-diversified management investment company formed in March 2001. Our investment objective is to provide our stockholders with both current income and capital appreciation primarily through debt investments and, to a lesser extent, equity investments. We intend to pursue an investment strategy focused primarily on investments in middle-market companies in the United States. We use the term “middle-market” to refer to companies which may exhibit one or more of the following characteristics: number of employees between 150 and 2,000; revenues between $50 million and $300 million; annual earnings before interest, taxes, depreciation and amortization, or EBITDA, between $5 million and $50 million; generally, private companies owned by private equity firms or owners/operators; and enterprise value between $25 million and $500 million. For additional information about how we define the middle-market, see “General—Investment Criteria/Guidelines.” As of December 31, 2012, our investment portfolio consisted of outstanding loans of approximately $234.6 million in aggregate principal amount, of which 100% were senior secured loans, as well as an approximate $4.7 million (at fair value) equity investment in Tamarix Capital Partners, LP, or Tamarix LP.
In connection with our IPO, on November 7, 2012, we converted from a limited liability company to a corporation, as a result of which the sole membership interest held by Orchard First Source Asset Management, LLC, or OFSAM, prior to the conversion was exchanged for 2,912,024 shares of our common stock. In connection with our IPO, we elected to be treated as a BDC under the1940 Act. On November 14, 2012, we completed our IPO selling 6,666,667 shares of our common stock at a public offering price of $15 per share, raising $100 million in gross proceeds. We incurred approximately $6.2 million of sales load and $5.8 million of offering related costs in connection with our IPO. We utilized approximately $90 million of our IPO proceeds to pay down the senior secured revolving credit facility, which OFS Capital WM, LLC, or OFS Capital WM, our wholly owned subsidiary, entered into with Wells Fargo Bank, N.A., or Wells Fargo, and Madison Capital Funding LLC, a subsidiary of New York Life Investments, or Madison Capital, to finance its business, which we refer to as the OFS Capital WM Facility. The OFS Capital WM Facility indebtedness repaid included approximately $48.0 million of Class A loans and approximately $42.0 million of Class B loans.
Although we will continue to focus on investments in senior secured loans, we also intend to expand into additional asset classes in which the investment professionals of OFS Capital Management, LLC, or OFS Advisor, our investment adviser, have expertise, including investments in unitranche, second-lien and mezzanine loans and, to a lesser extent, warrants and other minority equity securities. Initially, we expect that our senior secured loan investments will principally be made through on-balance sheet special purpose vehicles, while our unitranche, second lien and mezzanine loans will be made by us directly or by Tamarix LP. We expect our investments in the equity securities of these companies, such as warrants, preferred stock, common stock and
3
Table of Contents
other equity interests, will principally be made in conjunction with our debt investments, although we currently anticipate that no more than 5% of our portfolio will consist of equity investments in middle-market companies that do not pay a regular dividend. Generally, we do not expect to make investments in companies or securities that OFS Advisor determines to be distressed investments (such as discounted debt instruments that have either experienced a default or have a significant potential for default), other than follow-on investments in portfolio companies of ours.
A substantial portion of our business will focus on the direct origination and sourcing of investments through portfolio companies or their financial sponsors or other owners or intermediaries. We expect our middle-market investments to range generally from $5 million to $25 million each, although we expect that this investment size will vary proportionately with the size of our capital base.
Our investment activities are managed by OFS Advisor and supervised by our board of directors, a majority of whom are independent of us, OFS Advisor and its affiliates. Under the Investment Advisory Agreement between us and OFS Advisor, or the Investment Advisory Agreement, we have agreed to pay OFS Advisor an annual base management fee based on the average value of our total assets (other than cash and cash equivalents but including assets purchased with borrowed amounts and including assets owned by any consolidated entity) as well as an incentive fee based on our investment performance. We have also entered into an Administration Agreement with OFS Capital Services, LLC, or OFS Services. Under our Administration Agreement, we have agreed to reimburse OFS Services for our allocable portion (subject to the review and approval of our independent directors) of overhead and other expenses incurred by OFS Services in performing its obligations under the administration agreement between us and OFS Services, or the Administration Agreement.
As a BDC, we must not acquire any assets other than “qualifying assets” specified in the 1940 Act unless, at the time the acquisition is made, at least 70% of our total assets are qualifying assets (with certain limited exceptions). Qualifying assets include investments in “eligible portfolio companies.” Under the relevant SEC rules, the term “eligible portfolio company” includes all private companies, companies whose securities are not listed on a national securities exchange, and certain public companies that have listed their securities on a national securities exchange and have a market capitalization of less than $250 million, in each case organized in the United States.
We intend to elect to be treated for tax purposes as a regulated investment company, or RIC, under Subchapter M of the Internal Revenue Code of 1986, or the Code. To qualify as a RIC, we must, among other things, meet certain source-of-income and assets diversification requirements. Pursuant to these elections, we generally will not have to pay corporate-level taxes on any income we distribute to our shareholders.
As of December 31, 2012, our net asset value was approximately $141.8 million, or approximately $14.80 per share, and our portfolio included debt investments in 58 portfolio companies as well as our equity investment in Tamarix LP.
We believe senior secured, unitranche, second-lien and mezzanine loans to middle-market companies represent attractive investments. In particular, we believe that structured equity debt investments (i.e., unitranche loans, typically with warrant coverage, in companies with no financial sponsor) represent a significant growth opportunity offering the borrower the convenience of dealing with one lender, which may result in a higher blended rate of interest than a traditional multitranche structure. We believe this creates the opportunity to originate new loans to less leveraged borrowers at historically high interest rates, as well as to purchase loans in the secondary market at attractive prices with high yields.
While we intend to pursue an investment strategy focused primarily on middle-market companies in the United States, including senior secured, unitranche, second-lien and mezzanine loans and, to a lesser extent, warrants and other minority equity securities, we also may invest up to 30% of our portfolio in opportunistic
4
Table of Contents
investments of non-eligible portfolio companies. Specifically, as part of this 30% basket, we may consider investments in investment funds that are operating pursuant to certain exceptions to the 1940 Act and in advisers to similar investment funds, as well as in debt of middle-market companies located outside of the United States and debt and equity of public companies that do not meet the definition of eligible portfolio companies because their market capitalization of publicly traded equity securities exceeds the levels provided for in the 1940 Act.
About OFS and Our Advisor
OFS (which refers to the collective activities and operations of OFSAM and its subsidiaries and certain affiliates) is an established investment platform focused on meeting the capital needs of middle-market companies. OFS is the successor to First Source Financial Inc., which was founded in 1995 as a joint venture between Dominion Capital, Inc., a wholly-owned subsidiary of Dominion Resources, Inc., or Dominion, and Household Commercial Financial Services Inc., a unit of Household International, or Household. Household sold its interest in First Source Financial Inc. to Dominion in 1997. In 2003, Orchard Paladin Management, LLC, our predecessor, acquired from Dominion a portfolio of performing and non-performing loans of approximately $625 million in aggregate commitment amount, plus additional investments in equity securities. Shortly thereafter, in 2004, Orchard Paladin Management, LLC acquired Dominion’s interest in First Source Financial Inc. Most of the workouts managed by our senior managers since 2003 involved loans in the portfolio acquired from Dominion and loans acquired as a result of the purchase of Dominion’s interest in First Source Financial Inc.
As of December 31, 2012, OFS had 22 full-time employees and five part-time employees. OFS is headquartered in Rolling Meadows, Illinois, a suburb of Chicago, with additional offices in New York, New York and Los Angeles, California.
Our investment activities are managed by OFS Advisor, our investment adviser. OFS Advisor is responsible for sourcing potential investments, conducting research and diligence on potential investments and equity sponsors, analyzing investment opportunities, structuring our investments and monitoring our investments and portfolio companies on an ongoing basis. OFS Advisor is a subsidiary of OFSAM, our parent company prior to the completion of our IPO, and is a registered investment adviser under the Investment Advisers Act of 1940, or the Advisers Act.
Our relationship with OFS Advisor is governed by and dependent on the Investment Advisory Agreement and may be subject to conflicts of interest. We have entered into the Investment Advisory Agreement, pursuant to which OFS Advisor provides us with advisory services in exchange for a base management fee and incentive fee. See “—Management and Other Agreements—Investment Advisory Agreement” for a discussion of the base management fee and incentive fee payable by us to OFS Advisor. The base management fee is based on our total assets (other than cash and cash equivalents but including assets purchased with borrowed amounts and including assets owned by any consolidated entity) and, therefore, OFS Advisor will benefit when we incur debt or use leverage. Our board of directors is charged with protecting our interests by monitoring how OFS Advisor addresses these and other conflicts of interest associated with its management services and compensation. While our board of directors is not expected to review or approve each borrowing or incurrence of leverage, our independent directors will periodically review OFS Advisor’s services and fees as well as its portfolio management decisions and portfolio performance.
OFS Advisor has entered into a Staffing Agreement with Orchard First Source Capital, Inc., or OFSC. OFSC employs all of OFS’s investment professionals. Under the Staffing Agreement, OFSC will make experienced investment professionals available to OFS Advisor and provide access to the senior investment personnel of OFS and its affiliates. The Staffing Agreement provides OFS Advisor with access to deal flow generated by OFS and its affiliates in the ordinary course of their businesses and commits the members of OFS Advisor’s investment committee to serve in that capacity. As our investment adviser, OFS Advisor is obligated to allocate investment opportunities among us and any other clients fairly and equitably over time in accordance with its allocation policy.
5
Table of Contents
OFS Advisor capitalizes on the significant deal origination and sourcing, credit underwriting, due diligence, investment structuring, execution, portfolio management and monitoring experience of OFS’s professionals. The senior management team of OFS, including Glenn Pittson, Bilal Rashid, Jeff Cerny and Kathi Inorio, provides services to OFS Advisor. These managers have developed a broad network of contacts within the investment community, averaging over 20 years of experience investing in debt and equity securities of middle-market companies. In addition, these managers have gained extensive experience investing in assets that will constitute our primary focus and have expertise in investing across all levels of the capital structure of middle-market companies.
In addition to their roles with OFS Advisor, Glenn Pittson and Bilal Rashid serve as our interested directors. Mr. Pittson has over 25 years of experience in corporate finance, senior and mezzanine lending, structured finance, loan workouts and loan portfolio management, having spent the majority of his career at various capacities in Canadian Imperial Bank of Commerce (“CIBC”), including as head of U.S. Credit Markets, where he was central to the development and execution of a fundamental restructuring of CIBC’s loan origination activities. During the mid-1980’s, Mr. Pittson was instrumental in establishing CIBC’s leveraged lending business. Mr. Rashid has approximately 17 years of experience in investment banking, debt capital markets and investing as it relates to corporate credit, structured credit and securitizations, including serving as a managing director in the global markets and investment banking division at Merrill Lynch. Over his career, Mr. Rashid has advised, arranged financing for and lent to several middle-market credit providers, including business development companies and their affiliates.
Among other members of OFS’s senior management team, Jeff Cerny is experienced in credit evaluation, credit monitoring, troubled credit and loan administration, and negotiation and structuring of structured funding vehicles, having previously held positions at Sanwa Business Credit Corporation, American National Bank and Trust Company of Chicago and Charter Bank Group, a multi-bank holding company. Kathi Inorio’s focus is on origination and underwriting, drawing on her experience as a vice president in the corporate finance group at Heller Financial, Inc., where she was responsible for portfolio management of middle-market senior cash flow loans.
Our Administrator
OFS Services, an affiliate of OFS Advisor, provides the administrative services necessary for us to operate. OFS Services furnishes us with office facilities and equipment, necessary software licenses and subscriptions and clerical, bookkeeping and recordkeeping services at such facilities. OFS Services oversees our financial reporting as well as prepare our reports to stockholders and all other reports and materials required to be filed with the SEC or any other regulatory authority. OFS Services also manages the determination and publication of our net asset value and the preparation and filing of our tax returns and generally monitors the payment of our expenses and the performance of administrative and professional services rendered to us by others. OFS Services may retain third parties to assist in providing administrative services to us. To the extent that OFS Services outsources any of its functions, we will pay the fees associated with such functions on a direct basis without incremental profit to OFS Services.
Tamarix LP
We expect our investment strategy will continue to be augmented by Tamarix LP, which received an SBIC license from the Small Business Administration, or SBA, in May 2012. As of December 31, 2012, our equity investment in Tamarix LP was fair valued at approximately $4.7 million, and the investment portfolio held by Tamarix LP consisted of debt and equity securities which we fair valued at approximately $18.3 million and $2.6 million, respectively, at December 31, 2012. It is our intention to seek to acquire all of the limited partnership interests in Tamarix LP and all of the ownership interests in Tamarix Capital G.P. LLC, the limited liability company that functions as its general partner (“Tamarix GP”) that are currently owned or subscribed for by other persons. These acquisitions would require further approval from the SBA. We cannot assure shareholders that the
6
Table of Contents
SBA would grant that further approval or that the holders of those ownership interests would agree to sell them to us. In the event that the SBA were not to grant the necessary further approval, or the holders of those ownership interests did not agree to transfer them to us, we would still benefit from our significant economic interest in Tamarix LP—currently we have subscribed for $24.9 million out of a total of $36.9 million committed and partially funded commitments in Tamarix LP (giving us 67.5% of the limited partnership interests) and have a non-controlling interest in Tamarix GP—as well as our strong relationship with the investment professionals on the investment committee of Tamarix GP. If we are successful in acquiring all of the limited partnership interests in Tamarix LP and all of the ownership interests in Tamarix GP that are currently owned or subscribed for by other persons, we would once again consolidate Tamarix LP’s financial statements into our financial statements. As such, Tamarix LP will not elect to be treated as a BDC, and will not be registered as an investment company under the 1940 Act.
The investment and exit decisions and day-to-day investment activities of Tamarix LP are managed by the three investment professionals of Tamarix GP, each of whom, together with Glenn Pittson, our Chief Executive Officer, serves on the investment committee of Tamarix GP, which individuals have been previously approved by the SBA to manage Tamarix LP. Any investment decision on the part of Tamarix LP requires the unanimous approval of Tamarix GP’s investment committee. If we are able to acquire the interests in Tamarix LP and Tamarix GP that we do not already own, we anticipate that the three investment professionals will become employees of OFSC, all of the cost of which will be borne by OFS Advisor through the Staffing Agreement.
Tamarix LP has the same investment objective as ours and invests primarily in debt and, to a lesser extent, equity securities; however, we expect that Tamarix LP will focus on the generation of investment opportunities that are primarily non-sponsor oriented, complementing our current sponsor-oriented origination activities. Further, we expect Tamarix LP to typically target companies with annual EBITDA between $3 million and $15 million (compared to $5 million and $50 million for us) and typically invest between $5 million and $20 million per transaction (compared to $5 million and $25 million for us).
Small business investment companies, or SBICs, are designed to stimulate the flow of private equity capital to eligible small businesses. Under SBA regulations, SBICs may make loans to eligible small businesses and invest in the equity securities of small businesses. The SBIC license allows Tamarix LP to receive SBA-guaranteed debenture funding, subject to the issuance of a leverage commitment by the SBA and other customary procedures. Tamarix LP received a $30.1 million leverage commitment from the SBA in June 2012. The commitment will expire in September 2016. SBA leverage funding is subject to Tamarix LP’s payment of certain fees to the SBA, and the ability of Tamarix LP to draw on the commitment is subject to its compliance with SBA regulations and policies, including an audit by the SBA. For additional information regarding the regulation of Tamarix LP, see “- Regulation—Small Business Investment Company Regulations.”
To the extent we are able to purchase the interests in Tamarix LP that we do not already own, and consolidate the SBIC, we expect to apply for exemptive relief from the SEC to permit us to exclude the debt of Tamarix LP guaranteed by the SBA from our 200% asset coverage test under the 1940 Act. If we receive an exemption for this SBA debt, we would have increased capacity to fund investments with debt capital. There is no assurance that we will receive exemptive relief.
Market Opportunity
Our investment strategy is focused primarily on investments in middle-market companies in the United States. We find the middle-market attractive for the following reasons:
Large Target Market. According to the U.S. Census Bureau in its 2007 economic census, the most recent economic census conducted by the U.S. Census Bureau, there were approximately 196,000 companies in the United States with annual revenues between $10 million and $2.5 billion, compared with 1,200 companies with
7
Table of Contents
revenues greater than $2.5 billion. We believe that these middle-market companies represent a significant growth segment of the U.S. economy and often require substantial capital investments to grow. Middle-market companies have historically constituted the vast bulk of OFS’s portfolio companies since its inception, and we believe that this market segment will continue to produce significant investment opportunities for us.
Specialized Lending Requirements with High Barriers to Entry. We believe that several factors render many U.S. financial institutions ill-suited to lend to U.S. middle-market companies. For example, based on the experience of our management team, lending to private middle-market companies in the United States (a) is generally more labor-intensive than lending to larger companies due to the smaller size of each investment and the fragmented nature of information for such companies, (b) requires due diligence and underwriting practices consistent with the demands and economic limitations of the middle-market, and (c) may also require more extensive ongoing monitoring by the lender. As a result, middle-market companies historically have been served by a limited segment of the lending community. As a result of the unique challenges facing lenders to middle-market companies, there are high barriers to entry that a new lender must overcome.
Reduction in Competition Over the Last Several Years. Although the credit markets have improved, we believe that the fallout from the dislocation in the markets that began with the credit crisis in 2007 continues to impact the amount of credit available to middle-market companies. Many participants in the mezzanine, second-lien and subordinated debt market over the past five years, such as hedge funds and managers of CLOs, have contracted or eliminated their origination and sourcing activities as investors’ credit concerns have reduced available funding. Moreover, regulatory changes, including the Dodd-Frank Wall Street Reform and Consumer Protection Act, or Dodd-Frank Act, and the introduction of new international capital and liquidity requirements under Basel III, and the continued ownership of legacy non-performing assets have significantly curtailed commercial banks’ lending capacity. In response, we believe that many commercial lenders have de-emphasized their service and product offerings to middle-market companies in favor of lending, managing capital markets transactions and providing other non-credit services to their larger customers. We expect bank lending to middle-market companies to continue to be constrained for several years as Basel III rules phase in and rules and regulations are promulgated and interpreted under the Dodd-Frank Act.
Significant Refinancing Requirements. We believe that the debt associated with a large number of middle-market leveraged mergers and acquisitions completed from 2005 to 2008, which totaled approximately $97.7 billion in the aggregate, has started to become due and will continue to do so in the near term. In many cases, this debt will need to be refinanced as the existing debt facilities mature. When combined with the decreased availability of debt financing for middle-market companies generally, we believe these factors will increase lending opportunities for us.
Robust Demand for Debt Capital. We believe that private equity firms have significant committed but uncalled capital, a large portion of which is still available for investment in the United States. We expect the large amount of unfunded buyout commitments will drive demand for leveraged buyouts over the next several years, which should, in turn, create leveraged lending opportunities for us.
Attractive Pricing. Reduced access to, and availability of, debt capital for our targeted middle-market borrowers typically increases the interest rates, or pricing, of loans. Based on what OFS has observed, recent mezzanine deals typically have included meaningful upfront fees, prepayment protections and, in many cases, warrants, all of which should enhance profitability for lenders making new loans.
Conservative Deal Structures. As a result of the credit crisis that began in 2007, many middle market lenders are requiring lower senior and total leverage, more equity and more comprehensive loan covenants than was customary in the years leading up to the credit crisis. Lower debt multiples on purchase prices suggest that the cash flow of borrowing companies should enable them to service their debt more easily, creating a greater buffer against a downturn.
8
Table of Contents
Competitive Strengths and Core Competencies
Deep Management Team Experienced in All Phases of Investment Cycle and Across All Levels of the Capital Structure. We are managed by OFS Advisor, which has access through the Staffing Agreement with OFSC to the resources and expertise of OFS’s investment professionals. As of December 31, 2012, OFS’s credit and investment professionals (including all investment committee members) employed by OFSC had an average of over 15 years of investment experience with strong institutional backgrounds, including General Electric Capital Corporation, Merrill Lynch, Heller Financial Inc., NationsBank Corp., Sanwa Business Credit Corporation, Canadian Imperial Bank of Commerce and Drexel Burnham Lambert Inc. Moreover, OFS’s investment professionals specialize in the acquisition, origination and sourcing, underwriting and asset management of our specific targeted class of portfolio companies and have experience in investing at all levels of the capital structure. OFS’s senior managers have gained extensive workout experience during multiple business cycles. In addition, if we are able to acquire the interests in Tamarix LP and Tamarix GP that we do not already own (which is subject to, among other things, the receipt of the necessary SBA approvals in connection with such acquisition), we anticipate that this staff of investment professionals will be augmented and diversified by the addition of the three individuals who are primarily responsible for the day-to-day management of the investment activities of Tamarix LP. OFS’s credit and investment professionals are supported by additional administrative and back-office personnel that focus on operations, finance, legal and compliance, accounting and reporting, marketing, information technology and office management. The expertise of OFS’s senior managers extends beyond just loan origination and sourcing to significant experience with distressed debt and workouts. OFS also draws upon the significant experience of Richard Ressler, the Chairman of the executive committee of OFSAM and the Chairman of OFS Advisor’s investment committee. Mr. Ressler has been actively involved in managing and investing in private middle-market companies for over 20 years. Mr. Ressler is the founder and President of Orchard Capital, co-founder and Principal of CIM Group, Inc., a real estate investor and manager, and Chairman of j2 Global, Inc., in addition to serving on the boards of directors of various private companies. He has developed an expansive network of relationships in the sponsor group and corporate arena, which we intend to leverage for loan origination and sourcing purposes.
Alignment of Interests Among Us, the Management Team of OFS Advisor and New Investors. Unlike many business development companies, the interests of the senior management team of OFS Advisor and OFSAM are directly and significantly aligned with those of us and our shareholders. As of December 31, 2012, the senior management team of OFS Advisor and OFSAM owned, indirectly through their interests in OFSAM, 30.4% of our outstanding shares of common stock. For many members of the senior management team, their investment in us represents a substantial percentage of such member’s net worth. Accordingly, these individuals have an incentive to make decisions in the long-term interests of all our stockholders.
Significant Investment Capacity. Income from our investments, together with the net proceeds from our IPO and any subsequent offerings, if any, and any new debt we may incur, will provide us with a substantial amount of capital available for deployment into new investment opportunities in our targeted asset class. Additionally, if we are able to acquire the interests in Tamarix LP and Tamarix GP that we do not already own (which is subject to, among other things, the receipt of the necessary SBA approvals in connection with such acquisition), we will be able to borrow additional funds through Tamarix LP and take advantage of additional investment opportunities to meet our investment objectives.
Scalable Infrastructure Supporting the Entire Investment Cycle. We believe that our loan acquisition, origination and sourcing, underwriting, administration and management platform is highly scalable (that is, it can be expanded on a cost efficient basis within a timeframe that meets the demands of business growth). We believe that with limited incremental investment in personnel and back-office functions, our existing loan platform could accommodate three times our current loan volume. Because OFS Advisor is compensated in part on a fixed percentage of our total assets (other than cash and cash equivalents but including assets purchased with borrowed amounts and including assets owned by any consolidated entity), it has an incentive to leverage that platform and put our capital to work.
9
Table of Contents
Our platform extends beyond origination and sourcing and includes a regimented credit monitoring system. We believe that our careful approach, which involves ongoing review and analysis by an experienced team of professionals, should enable us to identify problems early and to assist borrowers before they face difficult liquidity constraints. The expertise of OFS’s senior managers extends beyond just loan origination and sourcing to significant experience with distressed debt and workouts, which the senior managers have managed separately or as a team through multiple business cycles. We believe that this experience enables us to prepare for possible negative contingencies in order to address them promptly should they arise.
Extensive Loan Sourcing Capabilities. OFS Advisor gives us access to the deal flow of OFS. We believe OFS’s over 17-year history as a middle-market lending platform and its market position make it a leading lender to many sponsors and other deal sources, especially in the currently underserved lending environment, and we have extensive relationships with potential borrowers and other lenders. We believe that because of its relationships and its reputation in the marketplace as a source of debt capital to the middle-market, OFS receives relationship-based “early looks” at many investment opportunities, allowing it to be selective in the transactions it pursues. Finally, we believe that our strong relationship with the investment professionals on the investment committee of Tamarix GP, as well as our relationship with the loan manager of, and the lender to, OFS Capital WM, will significantly expand the investment opportunities available to us.
Structuring with a High Level of Service and Operational Orientation. We seek to provide client-specific and creative financing structures to our portfolio companies. Based on our experience in lending to middle-market companies, we believe that the middle-market companies we target, as well as sponsor groups we may pursue, require a higher level of service, creativity and knowledge than has historically been provided by other service providers more accustomed to participating in commodity-like loan transactions. We believe the broad expertise of the investment professionals of OFS Advisor enables us to identify, assess and structure investments successfully across all levels of a company’s capital structure, and to manage potential risk and return at all stages of the economic cycle. We are not subject to many of the regulatory limitations that govern traditional lending institutions such as banks. As a result, we are flexible in selecting and structuring investments, adjusting investment criteria, transaction structures, and the types of securities in which we invest. This approach should enable OFS Advisor to identify attractive investment opportunities throughout the economic cycle so that we can make investments consistent with our stated objective even during turbulent periods in the capital markets.
Rigorous Credit Analysis and Approval Procedures. OFS Advisor utilizes the established, disciplined investment process of OFS for reviewing lending opportunities, structuring transactions and monitoring investments. Using its disciplined approach to lending, OFS Advisor will seek to minimize credit losses through effective underwriting, comprehensive due diligence investigations, structuring and, where appropriate, the implementation of restrictive debt covenants. OFS Advisor seeks to select borrowers whose businesses will retain significant enterprise value, even in a depressed market. We intend to use our capital resources to help our portfolio companies maintain sufficient liquidity to avoid the need for a distressed sale. While emphasizing thorough credit analysis, we intend to maintain strong relationships with sponsors and other deal sources by offering rapid initial feedback.
Investment Criteria/Guidelines
Our investment objective is to generate current income and capital appreciation by investing primarily in investments in middle-market companies in the United States. Our investments include asset classes in which OFS Advisor’s investment professionals have expertise, including investments in senior secured, unitranche, second-lien and mezzanine loans and, to a lesser extent, warrants and other minority equity securities. In particular, we believe that structured equity debt investments (i.e., unitranche loans, typically with warrant coverage, in companies with no financial sponsor) represent a significant growth opportunity offering the borrower the convenience of dealing with one lender, which may result in a higher blended rate of interest than a traditional multitranche structure. Initially, we expect that our senior loan investments will principally be made through on-balance sheet special purpose vehicles, while our unitranche, one-stop, second lien and mezzanine-loans will be made by us directly or by Tamarix LP. We expect our investments in the equity securities of these
10
Table of Contents
companies, such as warrants, preferred stock, common stock and other equity interests, will principally be made in conjunction with our debt investments, although we currently anticipate that no more than 5% of our portfolio will consist of equity investments in middle-market companies that do not pay a regular dividend. Generally, we do not expect to make investments in companies or securities that OFS Advisor determines to be distressed investments (such as discounted debt instruments that have either experienced a default or have a significant potential for default), other than follow-on investments in portfolio companies of ours. We intend to generate strong risk-adjusted net returns by assembling a diversified portfolio of investments across a broad range of industries.
We target U.S. middle-market companies by utilizing our proprietary database of borrowers developed over OFS’s more than 17 years in lending to middle-market companies, as well as through OFS’s access to a network of financial institutions, private equity sponsors, investment banks, consultants and attorneys. A typical targeted borrower will exhibit certain of the following characteristics:
| • | number of employees between 150 and 2,000; |
| • | revenues between $50 million and $300 million; |
| • | annual EBITDA between $5 million and $50 million; |
| • | generally, private companies owned by private equity firms or owners/operators; |
| • | enterprise value between $25 million and $500 million; |
| • | effective and experienced management teams; |
| • | defensible market share; |
| • | solid historical financial performance, including a steady stream of cash flow; |
| • | high degree of recurring revenue; |
| • | diversity of customers, markets, products and geography; and |
| • | differentiated products or services. |
While we believe that the characteristics listed above are important in identifying and investing in prospective portfolio companies, not all of these criteria will be met by each prospective portfolio company.
Due Diligence and Investment Process Overview
We employ a thorough and disciplined underwriting and due diligence process that is conducted in accordance with an established and documented credit policy and that is focused on investment recovery. Our process involves a comprehensive analysis of a prospective portfolio company’s market, operational, financial, and legal position, as well as its future prospects. In addition to our own analysis, we may use the services of third parties for environmental reviews, quality of earnings reports, industry surveys, background checks on key managers, and insurance reviews.
We seek to invest in companies that have experienced and incentivized management teams, that have stable and predictable cash flows, and that have defensible market positions. We underwrite our investments with the expectation that we will hold those investments for a number of years, and we structure and document our investments accordingly.
Our due diligence and underwriting process will typically address the following elements (although certain elements may not be included in every due diligence undertaking):
| • | Prospective Portfolio Company Characteristics: focusing on primary drivers of the company’s revenues and cash flows, including its key products and services; customer and supplier concentrations |
11
Table of Contents
| and contractual relationships; depth, breadth, and quality of company management, as well as the extent to which the management team is appropriately compensated with equity incentives; and any regulatory, labor, or litigation matters impacting the company. |
| • | Industry and Competitive Overview: including industry size and the company’s position within it; growth potential and barriers to entry; governmental, regulatory, or technological issues potentially affecting the industry; and cyclicality or seasonality risks associated with the industry. |
| • | Financial Analysis: involving an understanding of the company’s historical financial results, focusing on actual operating trends experienced over time, in order to forecast future performance, including in various sensitized performance scenarios; attention to projected cash flows, debt service coverage, and leverage multiples under such scenarios; and an assessment of enterprise valuations and debt repayment/investment recovery prospects given such sensitized performance scenarios. |
| • | Investment Documentation: focusing on obtaining the best legal protections available to us given our position within the capital structure, including, as appropriate, financial covenants; collateral liens and stock pledges; review of loan documents of other of the prospective portfolio company’s creditors; and negotiation of inter-creditor agreements. |
Portfolio Review/Risk Monitoring
We view active portfolio monitoring as a vital part of our investment process, and we benefit from a portfolio management system developed by OFS that includes daily, weekly, monthly, and quarterly components, and that involves comprehensive review of the performance of each of our portfolio companies. As part of the portfolio management process, OFS Advisor performs ongoing risk assessment on each of our investments and assigns each debt investment a credit rating based on OFS’s internal ratings scale.
Investment Committee
The purpose of OFS Advisor’s investment committee, which is comprised of Richard Ressler (Chairman), Glenn Pittson, Bilal Rashid, Jeffrey Cerny and Kathi Inorio, is to evaluate and approve all of our investments, subject at all times to the oversight of our board of directors. The investment committee process is intended to bring the diverse experience and perspectives of the committee’s members to the analysis and consideration of each investment. The investment committee serves to provide investment consistency and adherence to our core investment philosophy and policies. The investment committee also determines appropriate investment sizing and suggest ongoing monitoring requirements.
Each member of OFS Advisor’s investment committee performs a similar role for other investments managed by OFS and its affiliates. In certain instances, our board of directors may also determine that its approval is required prior to the making of an investment. In addition to reviewing investments, investment committee meetings serve as a forum to discuss credit views and outlooks. Potential transactions and deal flow are reviewed on a regular basis. Members of the investment team are encouraged to share information and views on credits with the investment committee early in their analysis. We believe this process improves the quality of the analysis and assists the deal team members in working efficiently.
The investment and exit decisions and day-to-day investment activities of Tamarix LP are managed by the three investment professionals of Tamarix GP, each of whom, together with Glenn Pittson, our Chief Executive Officer, serves on the investment committee of Tamarix GP, which individuals have been previously approved by the SBA to manage Tamarix LP. If we are able to acquire the interests in Tamarix LP and Tamarix GP that we do not already own, we anticipate that the three investment professionals will become employees of OFSC. Any investment decision on the part of Tamarix LP requires the unanimous approval of Tamarix GP’s investment committee. Subject to the foregoing, Tamarix GP’s team is led by Mark Hauser who brings over 25 years of middle-market investment experience to the group.
12
Table of Contents
Structure of Investments
Once we have determined that a prospective portfolio company is suitable for investment, we work with the management of that company and its other capital providers to structure an investment. We negotiate among these parties to agree on how our investment is expected to perform relative to the other capital in the portfolio company’s capital structure.
We anticipate that our loan portfolio will contain investments of the following types:
Senior Secured Loans. We expect that senior secured loans will comprise substantially all of our investment portfolio. We will obtain security interests in specified assets of these portfolio companies that will serve as collateral in support of the repayment of these loans (in certain cases, subject to a payment waterfall). The collateral will take the form of first-priority liens on specified assets of the portfolio company borrower. Our senior secured loans may provide for moderate loan amortization in the early years of the loan, with the majority of the amortization deferred until loan maturity.
Unitranche Loans. Unitranche loans are loans that combine both senior and subordinated debt into one loan under which the borrower pays a single blended interest rate that reflects the relative risk of the secured and unsecured components. We anticipate structuring our unitranche loans as senior secured loans. We will obtain security interests in the assets of these portfolio companies that will serve as collateral in support of the repayment of these loans. This collateral may take the form of first-priority liens on the assets of a portfolio company. We believe that unitranche lending represents a significant growth opportunity offering the borrower the convenience of dealing with one lender, which may result in a higher blended rate of interest than a traditional multitranche structure. Unitranche loans typically provide for moderate loan amortization in the initial years of the facility, with the majority of the amortization deferred until loan maturity. Unitranche loans generally allow the borrower to make a large lump sum payment of principal at the end of the loan term, and there is a risk of loss if the borrower is unable to pay the lump sum or refinance the amount owed at maturity. In many cases, we will be the sole lender, or we together with our affiliates will be the sole lender, of unitranche loans, which can afford us additional influence with a borrower in terms of monitoring and, if necessary, remediation in the event of underperformance.
Second-lien Loans. We anticipate structuring these investments as junior, secured loans. We intend to obtain security interests in the assets of these portfolio companies that will serve as collateral in support of the repayment of such loans. This collateral may take the form of second-priority liens on the assets of a portfolio company and we may enter into an intercreditor agreement with the holders of the portfolio company’s senior secured debt. These loans typically provide for moderate loan amortization in the initial years of the facility, with the majority of the amortization deferred until loan maturity.
Mezzanine Loans. We anticipate structuring these investments as unsecured, subordinated loans that provide for relatively high, fixed interest rates that provide us with significant current interest income. These loans typically will have interest-only payments (often representing a combination of cash pay and payment-in-kind (“PIK”) interest) in the early years, with amortization of principal deferred to maturity. Mezzanine loans generally allow the borrower to make a large lump sum payment of principal at the end of the loan term, and there is a risk of loss if the borrower is unable to pay the lump sum or refinance the amount owed at maturity. Mezzanine investments are generally more volatile than secured loans and may involve a greater risk of loss of principal. Mezzanine loans often include a PIK feature (meaning a feature allowing for the payment of interest in the form of additional principal amount of the loan instead of in cash), which effectively operates as negative amortization of loan principal, thereby increasing credit risk exposure over the life of the loan.
Warrants and Minority Equity Securities. In some cases, we will also receive nominally priced warrants or options to buy a minority equity interest in the portfolio company in connection with such a loan. As a result, as a portfolio company appreciates in value, we may achieve additional investment return from this equity interest.
13
Table of Contents
We may structure such warrants to include provisions protecting our rights as a minority-interest holder, as well as a “put,” or right to sell such securities back to the issuer, upon the occurrence of specified events. In many cases, we may also seek to obtain registration rights in connection with these equity interests, which may include demand and “piggyback” registration rights.
General Structuring Considerations. We intend to tailor the terms of each investment to the facts and circumstances of the transaction and the prospective portfolio company, negotiating a structure that protects our rights and manages our risk while creating incentives for the portfolio company to achieve its business plan and improve its operating results. We seek to limit the downside potential of our investments by:
| • | selecting investments that we believe have a very low probability of loss. |
| • | requiring a total return on our investments (including both interest and potential equity appreciation) that we believe will compensate us appropriately for credit risk; |
| • | negotiating covenants in connection with our investments that afford our portfolio companies as much flexibility in managing their businesses as possible, consistent with the preservation of our capital. Such restrictions may include affirmative and negative covenants, default penalties, lien protection, change of control provisions and board rights, including either observation or rights to a seat on the board of directors under some circumstances; and |
We expect to hold most of our investments to maturity or repayment, but we may sell some of our investments earlier if a liquidity event occurs, such as a sale, recapitalization or worsening of the credit quality of the portfolio company.
Investments
We intend to continue to pursue an investment strategy focused primarily on investments in middle-market companies in the United States. We expect that our investments will include asset classes in which OFS Advisor’s investment professionals have expertise, including investments in senior secured, unitranche, second-lien and mezzanine loans and, to a lesser extent, warrants and other minority equity securities. We will seek to create a diverse portfolio by making investments in the securities of middle-market companies that we expect to range generally from $5.0 million to $25.0 million each, although we expect this investment size will vary proportionately with the size of our capital base.
As of December 31, 2012, our investment portfolio consisted of outstanding loans of approximately $234.6 million in aggregate principal amount and equity investments of $4.7 million at fair value. These investments were in 59 companies, including our equity investment in Tamarix LP, spanning a broad range of geographical regions and industries.
Set forth in the tables and chart below is selected information with respect to our portfolio as of December 31, 2012.
The following table summarizes the composition of our loan portfolio.
| As of December 31, 2012 | ||||||||
| Commitment | Outstanding | |||||||
| (dollars in thousands) | ||||||||
| Term Loans |
$ | 234,635 | $ | 234,635 | ||||
| Revolvers |
1,500 | — | ||||||
|
|
|
|
|
|||||
| Total |
$ | 236,135 | $ | 234,635 | ||||
|
|
|
|
|
|||||
| Total # of Obligors |
58 | 58 | ||||||
14
Table of Contents
The following chart provides a regional breakdown of our portfolio as of December 31, 2012.
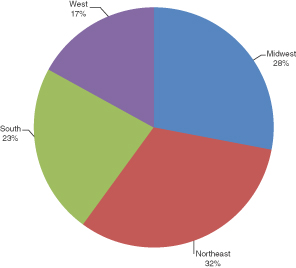
The following table summarizes our loan portfolio by size of exposure.
| As of December 31, 2012 | ||||||||
| Investment Size (in millions) |
Commitment | Number | ||||||
| (dollars in thousands) | ||||||||
| 0 - 10 |
$ | 236,135 | 59 | |||||
| 10 - 20 |
— | — | ||||||
| 20 - 30 |
— | — | ||||||
|
|
|
|
|
|||||
| Total Balance |
$ | 236,135 | 59 | |||||
|
|
|
|
|
|||||
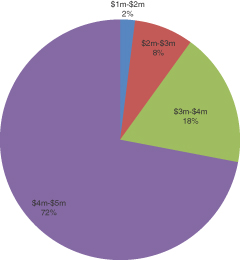
The following chart provides a breakdown of our portfolio by investment size as of December 31, 2012.
15
Table of Contents
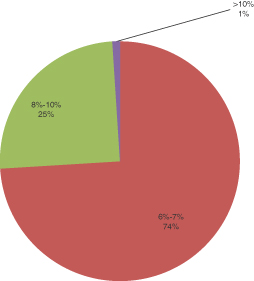
The following chart provides a breakdown of our portfolio by yield as of December 31, 2012
16
Table of Contents
Our loan portfolio is well-diversified, with limited exposure to commodities and real estate. The following table summarizes our loan portfolio by industry as of December 31, 2012.
| Category |
Commitment | Percent | ||||||
| (in thousands) | ||||||||
| Accounts Receivable Management Services |
$ | 4,907 | 2.1 | % | ||||
| Aerospace & Defense |
4,565 | 1.9 | % | |||||
| Asset Management & Custody Banks |
4,750 | 2.0 | % | |||||
| Asset Management Services |
4,813 | 2.0 | % | |||||
| Automobile |
7,885 | 3.3 | % | |||||
| Automotive Aftermarket Manufacturing |
4,685 | 2.0 | % | |||||
| Beverage, Food and Tobacco |
4,000 | 1.7 | % | |||||
| Broadcasting and Entertainment |
4,661 | 2.0 | % | |||||
| Busines Equipment & Services |
8,398 | 3.6 | % | |||||
| Chemical / Plastics |
10,335 | 4.4 | % | |||||
| Commercial Fastener Manufactuing |
4,695 | 2.0 | % | |||||
| Distributors |
12,592 | 5.3 | % | |||||
| Diversified Commercial & Professional Services |
9,107 | 3.9 | % | |||||
| Diversified/Conglomerate Manufacturing |
3,596 | 1.5 | % | |||||
| Electrical Components & Equipment |
5,994 | 2.5 | % | |||||
| Energy: Oil & Gas |
3,250 | 1.4 | % | |||||
| Environmental Consulting & Services |
4,347 | 1.8 | % | |||||
| Environmental Equipment Manufacturer |
4,441 | 1.9 | % | |||||
| Environmental Industries |
2,819 | 1.2 | % | |||||
| Financial Intermediaries |
7,270 | 3.1 | % | |||||
| Health Care Equipment |
9,529 | 4.0 | % | |||||
| Health Care Services |
19,027 | 8.1 | % | |||||
| Health Care Supplies |
3,592 | 1.5 | % | |||||
| Healthcare |
4,874 | 2.1 | % | |||||
| Healthcare Facilities |
4,950 | 2.1 | % | |||||
| High Tech Industries |
2,438 | 1.0 | % | |||||
| Household Products |
3,781 | 1.6 | % | |||||
| Industrial Conglomerates |
2,487 | 1.1 | % | |||||
| Industrial Gases |
4,362 | 1.8 | % | |||||
| Insurance |
4,987 | 2.1 | % | |||||
| Insurance Brokerage |
13,690 | 5.8 | % | |||||
| North American Commodities Brokerage |
4,580 | 1.9 | % | |||||
| Personal Products |
14,285 | 6.0 | % | |||||
| Printing & Publishing |
4,385 | 1.9 | % | |||||
| Property & Casualty Insurance |
4,962 | 2.1 | % | |||||
| Publishing |
4,818 | 2.0 | % | |||||
| Rehabilitation Products and Services |
4,938 | 2.1 | % | |||||
| Telecommunications |
7,340 | 3.1 | % | |||||
|
|
|
|
|
|||||
| $ | 236,135 | 100.0 | % | |||||
|
|
|
|
|
|||||
Our Investment in OFS Capital WM
We established OFS Capital WM to acquire, manage and finance senior secured loan investments to middle market companies in the United States. In March 2012, OFS Capital and Madison Capital, entered into an amendment to the credit facility which gave us substantial authority over (a) amendments, modifications, restructurings and waivers of the applicable OFS Capital WM portfolio loans, (b) providing notice of or waiving
17
Table of Contents
any default under the applicable OFS Capital WM portfolio loans, and (c) accelerating the maturity of the applicable OFS Capital WM portfolio loans, which we refer to as the WM 2012 Credit Facility Amendments. Specifically, for the vast majority of loans in the OFS Capital WM portfolio, the loan manager must consult with OFS Capital prior to taking any such action. While the loan manager for OFS Capital WM is not required to follow our recommendations, if we make a recommendation with which the loan manager disagrees, the loan manager must at our direction commence a process to sell the applicable investment, subject to our right to control the negotiations for such sale and to suspend any such sales process.
The WM 2012 Credit Facility Amendments were entered into in light of OFS Capital WM having made new investments which utilize the substantial majority of its borrowing capacity under the OFS Capital WM Facility. Accordingly, it is no longer the buy and sell activities, but rather the portfolio management activities that will most significantly impact OFS Capital WM’s economic performance. As the holder of 100% of the equity interests in OFS Capital WM, we determined that we should exert more influence and oversight over the portfolio management activities of OFS Capital WM.
We entered into the OFS Capital WM Transaction in part because OFS Capital WM would be able to increase the rate of return on the senior secured assets sold to OFS Capital WM as a result of the more favorable financing terms under the OFS Capital WM Facility, as compared to OFS Funding, LLC’s (or “OFS Funding”), credit facility with Bank of America, which we refer to as the Old Credit Facility. We continue to benefit from the loan assets sold to and still held by OFS Capital WM by virtue of our ownership of 100% of the equity interests in OFS Capital WM. Based on the cost of capital and the yield on the underlying assets, we have experienced positive cash flow on a quarterly basis from our investment in OFS Capital WM, and we expect to continue to do so for the life of the OFS Capital WM Facility. In addition, we believe that our relationship with Madison Capital has significantly expanded the investment opportunities available to us. Since the OFS Capital WM Closing, OFS Capital WM has made investments in 71 companies in 49 different industry categories. The vast majority of OFS Capital WM’s investments were originated in the past two years.
The following is a summary of the terms and conditions of OFS Capital WM Facility and related matters:
Availability; Borrowings. OFS Capital WM obtained a $180 million secured revolving credit facility from the Class A lenders (including Wells Fargo) and the Class B lenders (including Madison Capital). The Class A lenders are obligated to provide up to $135 million in Class A loans and the Class B lenders were obligated to provide up to $45 million in Class B loans to OFS Capital WM. In January 2013, OFS Capital WM terminated its $45 million Class B credit facility. The credit facility is secured by eligible loan assets or participations therein acquired by OFS Capital WM from us at the OFS Capital WM Closing and eligible loan assets thereafter acquired by OFS Capital WM during its reinvestment period. Eligible loan assets generally consist of first lien loans sold to OFS Capital WM by us at the OFS Capital WM Closing or acquired by OFS Capital WM during its reinvestment period.
Outstanding borrowings on the Class A credit facility are limited to the lesser of (a) the “maximum facility amount” of $135 million and (b) the “borrowing base.” Generally, during the reinvestment period, the borrowing base is equal to the value of the loan assets in OFS Capital WM’s portfolio multiplied by the advance rate of 65% with respect to the Class A loans. After the reinvestment period, the maximum facility amount will be limited to the then outstanding principal amount of Class A loans.
The Class A lender has significant input into assigning the value of OFS Capital WM loan assets for purposes of determining the borrowing base. Following certain events indicative of a deterioration in the assigned value of a loan asset, the Class A lender has the right to amend the assigned value of that loan for purposes of the borrowing base (provided that, other than for loans with an assigned value of zero, the amended and assigned value can be no less than the price quoted by a nationally recognized valuation firm selected by the controlling lender). If OFS Capital WM disagrees with that amended and assigned value, it may, at its expense, retain a nationally recognized valuation firm from an approved list or otherwise mutually agreeable to the
18
Table of Contents
Class A lenders and OFS Capital WM to determine the amended and assigned value of the applicable loan. If such valuation firm’s valuation is greater than that of the controlling lender, then the valuation firm’s valuation will become the amended and assigned value. In no event, however, will the amended and assigned value be greater than the value assigned the loan at the time it was acquired by OFS Capital WM without the consent of the majority of the Class A lenders.
A loan will have zero value for purposes of determining the borrowing base if (a) there is a payment default on the loan or the obligor becomes insolvent, (b) the loan is not an eligible loan asset under the facility, (c) a closing date participation interest with respect to a loan was not converted into a full assignment within 60 days after the OFS Capital WM Closing or (d) unless another value is assigned by the controlling lender, the principal on a loan has been reduced or waived.
If at any time the amount of Class A loans outstanding exceeds the relevant borrowing base, a borrowing base deficiency will exist. In that event, OFS Capital WM will have three business days to eliminate the deficiency by, among other things, (a) depositing additional cash into the relevant collection account, (b) repaying Class A loans, or (c) pledging additional eligible loan assets. In the case of such a deficiency, we may determine it is in our best interests to make additional capital contributions to OFS Capital WM in the form of cash or additional eligible loan assets to protect the value of our equity investment in OFS Capital WM, and our additional contributions could be material.
The facility is subject to a reinvestment period during which time, assuming there is no event of default and certain other conditions are satisfied, Class A loans that would otherwise be subject to repayment may be borrowed or reborrowed by OFS Capital WM and reinvested in additional eligible loan assets. The reinvestment period ends on December 31, 2013, but may be earlier terminated upon an event of default under the facility or certain events of default with respect to the loan manager and may be further extended by OFS Capital WM by one year with the consent of each lender. The maturity date of the Class A loans is December 31, 2016, which maturity date will be further extended by one year if the reinvestment period is extended by one year.
Payment Terms. OFS Capital WM is obligated to pay interest on outstanding Class A loans on each quarterly payment date. Outstanding Class A loans accrue interest at a rate per annum equal to LIBOR plus 2.75% (or 4.75% if an event of default has occurred). OFS Capital WM has the right to repay loans outstanding under the facility in part from time to time. OFS Capital WM also has the right to repay the facility in full at any time. However, in the event of a repayment of the facility in full prior to March 31, 2013, OFS Capital WM is required to pay a prepayment fee of 1.0% of the maximum facility amount; there is no prepayment fee thereafter.
OFS Capital WM is also required to pay (a) the lender customary annual unused facility fees, (b) its loan manager its loan manager fees, (c) certain trustee and bank fees and (d) other expenses and indemnities associated with management of its assets and the OFS Capital WM Facility.
Management of OFS Capital WM and its Assets. The facility imposes significant restrictions and limitations on the activities of OFS Capital WM. Among other things, under the terms of the facility, the activities of OFS Capital WM are limited to the acquisition, ownership and management of eligible loan assets, the sale and/or substitution of eligible loan assets when and as permitted by the terms of the facility, and business incidental to these activities. Under the terms of the facility, an affiliate of Madison Capital acts as loan manager and, in that capacity, has the authority to service, administer and exercise rights and remedies in respect of the assets in OFS Capital WM’s portfolio. The loan manager also has the authority to determine whether to cause assets to be sold or acquired by OFS Capital WM, subject in certain circumstances to the consent of OFS Capital, as administrative manager of OFS Capital WM, provided that OFS Capital WM retained authority to instruct the loan manager to sell the assets in its portfolio in order to repay the facility in full. The management rights of the loan manager were significantly modified in connection with the WM 2012 Credit Facility Amendments as a result of the extension of certain management and consent rights to OFS Capital, as administrative manager of OFS Capital WM, as described elsewhere in this annual report on Form 10-K.
19
Table of Contents
Other. The facility contains additional representations and warranties, covenants and events of default customary for a transaction of this nature. Among other things, we are required to repurchase eligible loan assets or participations therein sold and contributed by us to OFS Capital WM in the event of certain breaches of representations and warranties with respect to those assets. We also pledge all of our interests in OFS Capital WM to the lender to secure the obligations of OFS Capital WM to the lender until all obligations under the OFS Capital WM Facility have been paid in full and the commitments thereunder terminated.
Managerial Assistance
As a BDC, we must offer, and must provide upon request, managerial assistance to our portfolio companies. This assistance could involve monitoring the operations of our portfolio companies, participating in board and management meetings, consulting with and advising officers of portfolio companies and providing other organizational and financial guidance. OFS Services or an affiliate of OFS Services will provide such managerial assistance on our behalf to portfolio companies that request this assistance. We may receive fees for these services and will reimburse OFS Services or an affiliate of OFS Services for its allocated costs in providing such assistance, subject to the review and approval by our board of directors, including our independent directors.
Competition
Our primary competitors in providing financing to middle-market companies include public and private funds, other business development companies, commercial and investment banks, commercial finance companies and, to the extent they provide an alternative form of financing, private equity and hedge funds. Many of our competitors are substantially larger and have considerably greater financial, technical and marketing resources than we do. For example, we believe some competitors may have access to funding sources that are not available to us. In addition, some of our competitors may have higher risk tolerances or different risk assessments, which could allow them to consider a wider variety of investments and establish more relationships than us. Furthermore, many of our competitors are not subject to the regulatory restrictions that the 1940 Act imposes on us as a BDC or to the distribution and other requirements we must satisfy to maintain our RIC status.
We expect to use the expertise of the investment professionals of OFS and its affiliates to which we will have access to assess investment risks and determine appropriate pricing for our investments in portfolio companies. In addition, we expect that the relationships of the senior members of OFS and its affiliates will enable us to learn about, and compete effectively for, financing opportunities with attractive middle-market companies in the industries in which we seek to invest. For additional information concerning the competitive risks we face, see “Item 1A. Risk Factors—Risks Related to our Business and Structure—We operate in a highly competitive market for investment opportunities, which could reduce returns and result in losses.”
Administration
We do not have any direct employees, and our day-to-day investment operations are managed by OFS Advisor. We have a chief executive officer, chief financial officer, chief compliance officer and chief accounting officer and, to the extent necessary, our board of directors may elect to hire additional personnel going forward. Our officers are employees of OFSC, an affiliate of OFS Advisor, and a portion of the compensation paid to our officers are paid by us pursuant to the Administration Agreement. Some of our executive officers are also officers of OFS Advisor. See “—Management and Other Agreements.”
Properties
We do not own or lease any real estate or other physical properties material to our operation. Our headquarters are located at 2850 West Golf Road, 5th Floor, Rolling Meadows, Illinois 60008, and are provided by OFS Services pursuant to the Administration Agreement. Additional operations are conducted from offices in New York, New York and Los Angeles, California, which are also provided by OFS Services pursuant to the Administration Agreement. We believe that our office facilities are suitable and adequate for our business as we contemplate continuing to conduct it.
20
Table of Contents
MANAGEMENT AND OTHER AGREEMENTS
OFS Advisor is registered as an investment adviser under the Advisers Act. OFS Advisor is a wholly owned subsidiary of OFSAM. Subject to the overall supervision of our board of directors and in accordance with the 1940 Act, OFS Advisor manages our day-to-day operations and provides investment advisory services to us. Under the terms of the Investment Advisory Agreement, OFS Advisor:
| • | determines the composition of our portfolio, the nature and timing of the changes to our portfolio and the manner of implementing such changes; |
| • | assists us in determining what securities we purchase, retain or sell; |
| • | identifies, evaluates and negotiates the structure of the investments we make (including performing due diligence on our prospective portfolio companies); and |
| • | executes, closes, services and monitors the investments we make. |
Certain personnel of OFS conduct activities on our behalf directly through, and under the supervision of, OFS Advisor. OFS Advisor’s services under the Investment Advisory Agreement are not exclusive. Pursuant to a Staffing Agreement between OFSC and OFS Advisor, OFSC has agreed to provide OFS Advisor with the resources to fulfill its obligations under the Investment Advisory Agreement. These resources include staffing by experienced investment professionals and access to the senior investment personnel of OFSC, pursuant to which each member of OFS Advisor’s investment committee has committed to serve in such capacity (including Mr. Ressler, who is currently the Chairman of the investment committee). These personnel services are provided under the Staffing Agreement on a direct cost reimbursement basis to OFS Advisor.
Investment Advisory Agreement
Management and Incentive Fee
Pursuant to the Investment Advisory Agreement with OFS Advisor and subject to the overall supervision of our board of directors and in accordance with the 1940 Act, OFS Advisor provides investment advisory services to us. For providing these services, OFS Advisor receives a fee from us, consisting of two components—a base management fee and an incentive fee. From the completion of our IPO through October 31, 2013, the base management fee will be calculated at an annual rate of 0.875% based on the average value of our total assets (other than cash and cash equivalents but including assets purchased with borrowed amounts and including assets owned by any consolidated entity) at the end of the two most recently completed calendar quarters. After October 31, 2013, the base management fee will be calculated at an annual rate of 1.75% based on the average value of our total assets (other than cash and cash equivalents but including assets purchased with borrowed amounts and including assets owned by any consolidated entity) at the end of the two most recently completed calendar quarters. The base management fee is payable quarterly in arrears.
The incentive fee has two parts. One part is calculated and payable quarterly in arrears based on our pre-incentive fee net investment income for the quarter. “Pre-incentive fee net investment income” means interest income, dividend income and any other income (including any other fees such as commitment, origination and sourcing, structuring, diligence and consulting fees or other fees that we receive from portfolio companies but excluding fees for providing managerial assistance) accrued during the calendar quarter, minus operating expenses for the quarter (including the base management fee, any expenses payable under the Administration Agreement and any interest expense and dividends paid on any outstanding preferred stock, but excluding the incentive fee). Pre-incentive fee net investment income includes, in the case of investments with a deferred interest feature (such as original issue discount, or OID, debt instruments with PIK interest and zero coupon securities), accrued income that we have not yet received in cash.
21
Table of Contents
Pre-incentive fee net investment income does not include any realized gains, realized losses, unrealized capital appreciation or unrealized capital depreciation. Because of the structure of the incentive fee, it is possible that we may pay an incentive fee in a quarter where we incur a loss. For example, if we receive pre-incentive fee net investment income in excess of the hurdle rate (as defined below) for a quarter, we will pay the applicable incentive fee even if we have incurred a loss in that quarter due to realized capital losses and unrealized capital depreciation.
Pre-incentive fee net investment income, expressed as a rate of return on the value of our net assets (defined as total assets less indebtedness and before taking into account any incentive fees payable during the period) at the end of the immediately preceding calendar quarter, is compared to a fixed “hurdle rate” of 2.0% per quarter. If market interest rates rise, we may be able to invest our funds in debt instruments that provide for a higher return, which would increase our pre-incentive fee net investment income and make it easier for OFS Advisor to surpass the fixed hurdle rate and receive an incentive fee based on such net investment income. There is no accumulation of amounts on the hurdle rate from quarter to quarter and accordingly there is no clawback of amounts previously paid if subsequent quarters are below the quarterly hurdle rate and there is no delay of payment if prior quarters are below the quarterly hurdle rate. Our pre-incentive fee net investment income used to calculate this part of the incentive fee is also included in the amount of our total assets (other than cash and cash equivalents but including assets purchased with borrowed amounts and including assets owned by any consolidated entity) used to calculate the base management fee.
We pay OFS Advisor an incentive fee with respect to our pre-incentive fee net investment income in each calendar quarter as follows:
| • | no incentive fee in any calendar quarter in which the pre-incentive fee net investment income does not exceed the hurdle rate; |
| • | 100% of our pre-incentive fee net investment income with respect to that portion of such pre-incentive fee net investment income, if any, that exceeds the hurdle rate but is less than 2.5% in any calendar quarter. We refer to this portion of our pre-incentive fee net investment income (which exceeds the hurdle rate but is less than 2.5%) as the “catch-up” provision. The catch-up is meant to provide OFS Advisor with 20.0% of the pre-incentive fee net investment income as if a hurdle rate did not apply if this pre-incentive fee net investment income exceeds 2.5% in any calendar quarter; and |
| • | 20.0% of the amount of our pre-incentive fee net investment income, if any, that exceeds 2.5% in any calendar quarter. |
The following is a graphical representation of the calculation of the income-related portion of the incentive fee:
Quarterly Incentive Fee Based on Net Investment Income
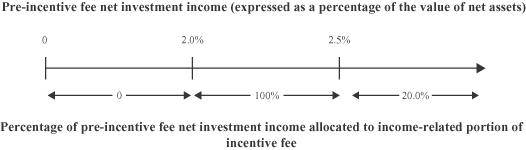
22
Table of Contents
These calculations will be appropriately prorated for any period of less than three months and adjusted for any share issuances or repurchases during the current quarter.
The second part of the incentive fee (the “Capital Gains Fee”) is determined and payable in arrears as of the end of each calendar year (or upon termination of the Investment Advisory Agreement, as of the termination date) and is calculated at the end of each applicable year by subtracting (a) the sum of our cumulative aggregate realized capital losses and our aggregate unrealized capital depreciation from (b) our cumulative aggregate realized capital gains. If such amount is positive at the end of such year, then the Capital Gains Fee for such year is equal to 20.0% of such amount, less the aggregate amount of Capital Gains Fees paid in all prior years. If such amount is negative, then there is no Capital Gains Fee for such year.
The cumulative aggregate realized capital gains are calculated as the sum of the differences, if positive, between (a) the net sales price of each investment in our portfolio when sold and (b) the accreted or amortized cost basis of such investment.
The cumulative aggregate realized capital losses are calculated as the sum of the amounts by which (a) the net sales price of each investment in our portfolio when sold is less than (b) the accreted or amortized cost basis of such investment.
The aggregate unrealized capital depreciation is calculated as the sum of the differences, if negative, between (a) the valuation of each investment in our portfolio as of the applicable Capital Gains Fee calculation date and (b) the accreted or amortized cost basis of such investment as of the close of our IPO. Unrealized capital appreciation is accrued, but not paid until said appreciation is realized.
Examples of Incentive Fee Calculation
Example 1—Income Related Portion of Incentive Fee:
Assumptions
| • | Hurdle rate(1) = 2.0% |
| • | Management fee(2) = 0.44% |
| • | Other estimated expenses (legal, accounting, custodian, transfer agent, etc.)(3) = 0.20% |
| (1) | Represents a quarter of the 8.0% annualized hurdle rate. |
| (2) | Represents a quarter of the 1.75% annualized management fee, which becomes effective October 31, 2013. |
| (3) | Excludes estimated offering expenses. |
Alternative 1
Additional Assumptions
| • | Investment income (including interest, dividends, fees, etc.) = 1.25% |
| • | Pre-incentive fee net investment income (investment income – (management fee + other expenses)) = 0.61% |
Pre-incentive fee net investment income does not exceed the hurdle rate, therefore there is no incentive fee.
Alternative 2
Additional Assumptions
| • | Investment income (including interest, dividends, fees, etc.) = 2.80% |
| • | Pre-incentive fee net investment income (investment income – (management fee + other expenses)) = 2.16% |
23
Table of Contents
Pre-incentive fee net investment income exceeds hurdle rate, therefore there is an incentive fee.
| Incentive Fee |
= | 100% × “Catch-Up” + the greater of 0% AND (20% × (pre-incentive fee net investment income – 2.5%)) | ||||
| = | (100% ×(2.16%) – 2.0%)) + 0% | |||||
| = | 100% × 0.16% | |||||
| = | 0.16% | |||||
Alternative 3
Additional Assumptions
| • | Investment income (including interest, dividends, fees, etc.) = 3.50% |
| • | Pre-incentive fee net investment income (investment income – (management fee + other expenses)) = 2.86% |
Pre-incentive fee net investment income exceeds hurdle rate, therefore there is an incentive fee.
| Incentive Fee |
= | 100% × “Catch-Up” + the greater of 0% AND (20% × (pre-incentive fee net investment income – 2.5%)) | ||||
| = | (100% ×(2.5% – 2.0%)) +(20% ×(2.86% – 2.5%)) | |||||
| = | 0.5% +(20% × 0.36%) | |||||
| = | 0.5% + 0.07% | |||||
| = | 0.57% | |||||
Example 2—Capital Gains Portion of Incentive Fee:
Alternative 1
Assumptions
| • | Year 1: $20 million investment made in Company A (“Investment A”), and $30 million investment made in Company B (“Investment B”) |
| • | Year 2: Investment A is sold for $50 million and fair market value (“FMV”) of Investment B determined to be $32 million |
| • | Year 3: FMV of Investment B determined to be $25 million |
| • | Year 4: Investment B sold for $31 million |
The capital gains portion of the incentive fee, if any, would be:
| • | Year 1: None (no sales transactions) |
| • | Year 2: $6 million (20% multiplied by $30 million realized capital gains on sale of Investment A) |
| • | Year 3: None; $5 million (20% multiplied by $30 million cumulative realized capital gains less $5 million cumulative unrealized capital depreciation) less $6 million (Capital Gains Fee paid in Year 2) |
| • | Year 4: $200,000; $6.2 million (20% multiplied by $31 million cumulative realized capital gains) less $6 million (Capital Gains Fee paid in Year 2) |
24
Table of Contents
Alternative 2
Assumptions
| • | Year 1: $20 million investment made in Company A (“Investment A”), $30 million investment made in Company B (“Investment B”) and $25 million investment made in Company C (“Investment C”) |
| • | Year 2: Investment A sold for $50 million, FMV of Investment B determined to be $25 million and FMV of Investment C determined to be $25 million |
| • | Year 3: FMV of Investment B determined to be $27 million and Investment C sold for $30 million |
| • | Year 4: FMV of Investment B determined to be $35 million |
| • | Year 5: Investment B sold for $20 million |
The capital gains portion of the incentive fee, if any, would be:
| • | Year 1: None (no sales transactions) |
| • | Year 2: $5 million (20% multiplied by $30 million realized capital gains on Investment A less $5 million unrealized capital depreciation on Investment B) |
| • | Year 3: $1.4 million; $6.4 million (20% multiplied by $32 million ($35 million cumulative realized capital gains on Investment A and Investment C less $3 million cumulative unrealized capital depreciation on Investment B)) less $5 million (Capital Gains Fee paid in Year 2) |
| • | Year 4: $0.6 million; $7 million (20% multiplied by $35 million (cumulative realized capital gains on Investment A and Investment C)) less $6.4 million (cumulative Capital Gains Fee paid in all prior years) |
| • | Year 5: None; $5 million (20% multiplied by $25 million ($35 million cumulative realized capital gains on Investments A and C less $10 million realized capital losses on Investment B)) less $7 million (cumulative Capital Gains Fee paid in all prior years)) |
Payment of Our Expenses
Our primary operating expenses include interest expense due under the OFS Capital WM Facility, management fee payment to the loan manager under the OFS Capital WM Facility, professional fees, the payment of fees to OFS Advisor under the Investment Advisory Agreement, our allocable portion of overhead expenses under the Administration Agreement and other operating costs described below. Additionally, we will pay interest expense on any outstanding debt under any new credit facility or other debt instrument we may enter into. We will bear all other out-of-pocket costs and expenses of our operations and transactions, whether incurred by us directly or on our behalf by a third party, including:
| • | the cost of calculating our net asset value, including the cost of any third-party valuation services; |
| • | the cost of effecting sales and repurchases of shares of our common stock and other securities; |
| • | fees payable to third parties relating to making investments, including out-of-pocket fees and expenses associated with performing due diligence and reviews of prospective investments; |
| • | transfer agent and custodial fees; |
| • | out-of-pocket fees and expenses associated with marketing efforts; |
| • | federal and state registration fees and any stock exchange listing fees; |
| • | U.S. federal, state and local taxes; |
| • | independent directors’ fees and expenses; |
25
Table of Contents
| • | brokerage commissions; |
| • | fidelity bond, directors’ and officers’ liability insurance and other insurance premiums; |
| • | direct costs, such as printing, mailing and long-distance telephone; |
| • | fees and expenses associated with independent audits and outside legal costs; |
| • | costs associated with our reporting and compliance obligations under the 1940 Act and other applicable U.S. federal and state securities laws; and |
| • | other expenses incurred by either OFS Services or us in connection with administering our business, including payments under the Administration Agreement that will be based upon our allocable portion (subject to the review and approval of our board of directors) of overhead. |
Duration and Termination
Unless terminated earlier as described below, the Investment Advisory Agreement will continue in effect for a period of two years from its effective date. It will remain in effect from year to year thereafter if approved annually by our board of directors or by the affirmative vote of the holders of a majority of our outstanding voting securities, and, in either case, if also approved by a majority of our directors who are not “interested persons.” The Investment Advisory Agreement automatically terminates in the event of its assignment, as defined in the 1940 Act, by OFS Advisor and may be terminated by either party without penalty upon not less than 60 days’ written notice to the other. The holders of a majority of our outstanding voting securities may also terminate the Investment Advisory Agreement without penalty upon not less than 60 days’ written notice. See “Item 1A. Risk Factors—Risks Related to our Business and Structure—We are dependent upon the OFS senior professionals for our future success and upon their access to the investment professionals and partners of OFS and its affiliates.”
Indemnification
The Investment Advisory Agreement provides that OFS Advisor and its affiliates and its and its affiliates’ respective officers, directors, members, managers, stockholders and employees are entitled to indemnification from us from and against any claims or liabilities, including reasonable legal fees and other expenses reasonably incurred, arising out of or in connection with our business and operations or any action taken or omitted on our behalf pursuant to authority granted by the Investment Advisory Agreement, except where attributable to willful misfeasance, bad faith or gross negligence in the performance of such person’s duties, or reckless disregard of such person’s obligations and duties under the Investment Advisory Agreement.
Board Approval of the Investment Advisory Agreement
Our board, including our independent directors, approved the Investment Advisory Agreement at a meeting held on May 9, 2012. In its consideration of the Investment Advisory Agreement, the board focused on information it had received relating to, among other things: (a) the nature, quality and extent of the advisory and other services to be provided to us by the Advisor; (b) comparative data with respect to advisory fees or similar expenses paid by other BDCs with similar investment objectives; (c) our projected operating expenses and expense ratio compared to BDCs with similar investment objectives; (d) any existing and potential sources of indirect income to the Advisor from its relationships with us and the profitability of those relationships; (e) information about the services to be performed and the personnel performing such services under the Investment Advisory Agreement; (f) the organizational capability and financial condition of the Advisor and its respective affiliates; and (g) the possibility of obtaining similar services from other third party service providers or through an internally managed structure.
Based on the information reviewed and the discussion thereof, the board of directors, including a majority of the non-interested directors, concluded that the investment advisory fee rates are reasonable in relation to the services to be provided.
26
Table of Contents
Administration Agreement
Pursuant to an Administration Agreement, OFS Services furnishes us with office facilities and equipment, necessary software licenses and subscriptions and clerical, bookkeeping and record keeping services at such facilities. Under the Administration Agreement, OFS Services performs, or oversees the performance of, our required administrative services, which include being responsible for the financial records that we are required to maintain and preparing reports to our stockholders and all other reports and materials required to be filed with the SEC or any other regulatory authority. In addition, OFS Services assists us in determining and publishing our net asset value, oversee the preparation and filing of our tax returns and the printing and dissemination of reports to our stockholders, and generally oversee the payment of our expenses and the performance of administrative and professional services rendered to us by others. Under the Administration Agreement, OFS Services also provides managerial assistance on our behalf to those portfolio companies that have accepted our offer to provide such assistance. Payments under the Administration Agreement will be equal to an amount based upon our allocable portion (subject to the review and approval of our board of directors) of OFS Services’ overhead in performing its obligations under the Administration Agreement, including rent and our allocable portion of the cost of our officers, including our chief executive officer, chief financial officer, chief compliance officer, chief accounting officer, if any, and their respective staffs. The Administration Agreement has an initial term of two years and may be renewed with the approval of our board of directors, including a majority of our directors who are not “interested persons.” The Administration Agreement may be terminated by either party without penalty upon 60 days’ written notice to the other party. To the extent that OFS Services outsources any of its functions we will pay the fees associated with such functions on a direct basis without profit to OFS Services.
Indemnification
The Administration Agreement provides that OFS Services and its affiliates’ respective officers, directors, members, managers, stockholders and employees are entitled to indemnification from us from and against any claims or liabilities, including reasonable legal fees and other expenses reasonably incurred, arising out of or in connection with our business and operations or any action taken or omitted on our behalf pursuant to authority granted by the Administration Agreement, except where attributable to willful misfeasance, bad faith or gross negligence in the performance of such person’s duties or reckless disregard of such person’s obligations and duties under the Administration Agreement.
License Agreement
We have entered into a license agreement with OFSAM under which OFSAM has agreed to grant us a non-exclusive, royalty-free license to use the name “OFS.” Under this agreement, we have a right to use the “OFS” name for so long as OFS Advisor or one of its affiliates remains our investment adviser. Other than with respect to this limited license, we have no legal right to the “OFS” name. This license agreement will remain in effect for so long as the Investment Advisory Agreement with OFS Advisor is in effect.
Staffing Agreement
We do not have any internal management capacity or employees. We will depend on the diligence, skill and network of business contacts of the OFS senior professionals to achieve our investment objective. OFS Advisor is a subsidiary of OFSAM and will depend upon access to the investment professionals and other resources of OFSAM and its affiliates to fulfill its obligations to us under the Investment Advisory Agreement. OFS Advisor will also depend upon OFSAM to obtain access to deal flow generated by the professionals of OFSAM and its affiliates. Under a Staffing Agreement between OFSC and OFS Advisor, OFSC has agreed to provide OFS Advisor with the resources necessary to fulfill these obligations. The Staffing Agreement provides that OFSC will make available to OFS Advisor experienced investment professionals and access to the senior investment personnel of OFSC for purposes of evaluating, negotiating, structuring, closing and monitoring our investments. The Staffing Agreement also includes a commitment that the members of OFS Advisor’s investment committee will serve in such capacity (including Mr. Ressler, who is currently the Chairman of the investment committee).
27
Table of Contents
The Staffing Agreement has an initial term of two years and is renewable thereafter on an annual basis. Services under the Staffing Agreement are provided to OFS Advisor on a direct cost reimbursement basis, and such fees are not our obligation.
OFSC also has entered into a staffing and corporate services agreement with OFS Services. Under this agreement, OFS Services will will make available to OFSC experienced investment professionals and access to the administrative resources of OFS Services.
REGULATION
We are a BDC under the 1940 Act and intend to elect to be treated as a RIC under the Code. The 1940 Act contains prohibitions and restrictions relating to transactions between business development companies and their affiliates (including any investment advisers), principal underwriters and affiliates of those affiliates or underwriters and requires that a majority of the directors be persons other than “interested persons,” as that term is defined in the 1940 Act. In addition, the 1940 Act provides that we may not change the nature of our business so as to cease to be, or to withdraw our election as, a BDC unless approved by a majority of our outstanding voting securities.
We may invest up to 100% of our assets in securities acquired directly from issuers in privately negotiated transactions. With respect to such securities, we may, for the purpose of public resale, be deemed an “underwriter” as that term is defined in the Securities Act. Our intention is to not write (sell) or buy put or call options to manage risks associated with the publicly traded securities of our portfolio companies, except that we may enter into hedging transactions to manage the risks associated with interest rate fluctuations. However, we may purchase or otherwise receive warrants to purchase the common stock of our portfolio companies in connection with acquisition financing or other investments. Similarly, in connection with an acquisition, we may acquire rights to require the issuers of acquired securities or their affiliates to repurchase them under certain circumstances. We also do not intend to acquire securities issued by any investment company that exceed the limits imposed by the 1940 Act. Under these limits, we generally cannot acquire more than 3% of the voting stock of any registered investment company, invest more than 5% of the value of our total assets in the securities of one investment company or invest more than 10% of the value of our total assets in the securities of more than one investment company. With regard to that portion of our portfolio invested in securities issued by investment companies, it should be noted that such investments might subject our stockholders to additional expenses. None of these policies are fundamental and may be changed without stockholder approval.
Qualifying Assets
Under the 1940 Act, a BDC may not acquire any asset other than assets of the type listed in section 55(a) of the 1940 Act, which are referred to as “qualifying assets,” unless, at the time the acquisition is made, qualifying assets represent at least 70% of the company’s total assets. The principal categories of qualifying assets relevant to our business are the following:
| (a) | Securities purchased in transactions not involving any public offering from the issuer of such securities, which issuer (subject to certain limited exceptions) is an eligible portfolio company, or from any person who is, or has been during the preceding 13 months, an affiliated person of an eligible portfolio company, or from any other person, subject to such rules as may be prescribed by the SEC. An eligible portfolio company is defined in the 1940 Act as any issuer that: |
| • | is organized under the laws of, and has its principal place of business in, the United States; |
| • | is not an investment company (other than a small business investment company wholly-owned by the BDC) or a company that would be an investment company but for certain exclusions under the 1940 Act; and |
28
Table of Contents
| • | satisfies either of the following: |
| • | does not have any class of securities listed on a national securities exchange or has any class of securities listed on a national securities exchange subject to a $250 million market capitalization maximum; or |
| • | is controlled by a BDC or a group of companies including a BDC, the BDC actually exercises a controlling influence over the management or policies of the eligible portfolio company, and, as a result, the BDC has an affiliated person who is a director of the eligible portfolio company. |
| (b) | Securities of any eligible portfolio company which we control. |
| (c) | Securities purchased in a private transaction from a U.S. issuer that is not an investment company or from an affiliated person of the issuer, or in transactions incident to such a private transaction, if the issuer is in bankruptcy and subject to reorganization or if the issuer, immediately prior to the purchase of its securities, was unable to meet its obligations as they came due without material assistance other than conventional lending or financing arrangements. |
| (d) | Securities of an eligible portfolio company purchased from any person in a private transaction if there is no ready market for such securities and we already own 60% of the outstanding equity of the eligible portfolio company. |
| (e) | Securities received in exchange for or distributed on or with respect to securities described above, or pursuant to the exercise of warrants or rights relating to such securities. |
| (f) | Cash, cash equivalents, U.S. government securities or high-quality debt securities that mature in one year or less from the date of investment. |
The regulations defining qualifying assets may change over time. We may adjust our investment focus as needed to comply with and/or take advantage of any regulatory, legislative, administrative or judicial actions in this area.
Managerial Assistance to Portfolio Companies
A BDC must have been organized and have its principal place of business in the United States and must be operated for the purpose of making investments in the types of securities described in (a), (b) or (c) above. However, in order to count portfolio securities as qualifying assets for the purpose of the 70% test, the BDC must either control the issuer of the securities or must offer to make available to the issuer of the securities significant managerial assistance; except that, when the BDC purchases such securities in conjunction with one or more other persons acting together, one of the other persons in the group may make available such managerial assistance. Making available managerial assistance means, among other things, any arrangement whereby the BDC, through its directors, officers or employees, offers to provide, and, if accepted, does so provide, significant guidance and counsel concerning the management, operations or business objectives and policies of a portfolio company. OFS Services or an affiliate of OFS Services will provide such managerial assistance on our behalf to portfolio companies that request this assistance.
Temporary Investments
Pending investment in other types of qualifying assets, as described above, our investments may consist of cash, cash equivalents, U.S. government securities, repurchase agreements and high-quality debt investments that mature in one year or less from the date of investment, which we refer to, collectively, as temporary investments, so that 70% of our assets are qualifying assets or temporary investments. Typically, we will invest in U.S. Treasury bills or in repurchase agreements, so long as the agreements are fully collateralized by cash or securities issued by the U.S. government or its agencies. A repurchase agreement involves the purchase by an investor, such as us, of a specified security and the simultaneous agreement by the seller to repurchase it at an agreed-upon
29
Table of Contents
future date and at a price that is greater than the purchase price by an amount that reflects an agreed-upon interest rate. There is no percentage restriction on the proportion of our assets that may be invested in such repurchase agreements. However, if more than 25% of our total assets constitute repurchase agreements from a single counterparty, we would not meet the diversification tests in order to qualify as a RIC for federal income tax purposes. Accordingly, we do not intend to enter into repurchase agreements with a single counterparty in excess of this limit. OFS Advisor will monitor the creditworthiness of the counterparties with which we enter into repurchase agreement transactions.
Senior Securities
We are permitted, under specified conditions, to issue multiple classes of indebtedness and one class of stock senior to our common stock if our asset coverage, as defined in the 1940 Act, is at least equal to 200% immediately after each such issuance. In addition, while any senior securities remain outstanding, we must make provisions to prohibit any distribution to our stockholders or the repurchase of such securities or shares unless we meet the applicable asset coverage ratios at the time of the distribution or repurchase. We may also borrow amounts up to 5% of the value of our total assets for temporary or emergency purposes without regard to asset coverage. For a discussion of the risks associated with leverage, see “Item 1A. Risk Factors—Risks Related to our Business and Structure—Regulations governing our operation as a BDC affect our ability to and the way in which we raise additional capital. As a BDC, we will need to raise additional capital, which will expose us to risks, including the typical risks associated with leverage.”
Codes of Ethics
We and OFS Advisor have each adopted a code of ethics pursuant to Rule 17j-1 under the 1940 Act that establishes procedures for personal investments and restricts certain personal securities transactions. Personnel subject to each code may invest in securities for their personal investment accounts, including securities that may be purchased or held by us, so long as such investments are made in accordance with the code’s requirements. Our code of ethics is available, free of charge, on our website at www.ofscapital.com. We intend to disclose any amendments to, or waivers from, our code of ethics that are required to be publicly disclosed pursuant to rules of the Securities and Exchange Commission (the “SEC”) and the Nasdaq Global Market by filing such amendment or waiver with the SEC and by posting it on our website. You may read and copy the code of ethics at the SEC’s Public Reference Room in Washington, D.C. You may obtain information on the operation of the Public Reference Room by calling the SEC at (800) SEC-0330. In addition, the code of ethics is attached as an exhibit to the registration statement on Form N-2 of which this annual report on Form 10-K is a part, and will be available on the SEC’s website at http://www.sec.gov. You may also obtain copies of the code of ethics, after paying a duplicating fee, by electronic request at the following e-mail address: publicinfo@sec.gov, or by writing the SEC’s Public Reference Section, 100 F Street, N.E., Washington, D.C. 20549.
Proxy Voting Policies and Procedures
We have delegated our proxy voting responsibility to OFS Advisor. The proxy voting policies and procedures of OFS Advisor are set out below. The guidelines are reviewed periodically by OFS Advisor and our directors who are not “interested persons,” and, accordingly, are subject to change. For purposes of these proxy voting policies and procedures described below, “we,” “our” and “us” refer to OFS Advisor.
Introduction
As an investment adviser registered under the Advisers Act, we have a fiduciary duty to act solely in the best interests of our clients. As part of this duty, we recognize that we must vote client securities in a timely manner free of conflicts of interest and in the best interests of our clients.
These policies and procedures for voting proxies for our investment advisory clients are intended to comply with Section 206 of, and Rule 206(4)-6 under, the Advisers Act.
30
Table of Contents
Proxy Policies
We vote proxies relating to our portfolio securities in what we perceive to be the best interest of our clients. We review on a case-by-case basis each proposal submitted to a stockholder vote to determine its effect on the portfolio securities held by our clients. In most cases we will vote in favor of proposals that we believe are likely to increase the economic value of the underlying portfolio securities held by our clients. Although we will generally vote against proposals that may have a negative effect on our clients’ portfolio securities, we may vote for such a proposal if there exist compelling long-term reasons to do so.
Our proxy voting decisions are made by those senior officers who are responsible for monitoring each of our clients’ investments. To ensure that our vote is not the product of a conflict of interest, we require that (1) anyone involved in the decision-making process disclose to our chief compliance officer any potential conflict that he or she is aware of and any contact that he or she has had with any interested party regarding a proxy vote; and (2) employees involved in the decision-making process or vote administration are prohibited from revealing how we intend to vote on a proposal in order to reduce any attempted influence from interested parties. Where conflicts of interest may be present, we will disclose such conflicts to our client, including with respect to OFS Capital, those directors who are not interested persons and we may request guidance from such persons on how to vote such proxies for their account.
Proxy Voting Records
You may obtain information about how we voted proxies for OFS Capital, free of charge, by making a written request for proxy voting information to: OFS Capital Corporation, 2850 West Golf Road, 5th Floor, Rolling Meadows, Illinois 60008, Attention: Investor Relations, or by calling OFS Capital Corporation at (847) 734-2060. The SEC also maintains a website at http://www.sec.gov that contains such information.
Privacy Principles
We are committed to maintaining the privacy of our stockholders and to safeguarding their nonpublic personal information. The following information is provided to help you understand what personal information we collect, how we protect that information and why, in certain cases, we may share information with select other parties.
Generally, we do not receive any nonpublic personal information relating to our stockholders, although certain nonpublic personal information of our stockholders may become available to us. We do not disclose any nonpublic personal information about our stockholders or former stockholders to anyone, except as permitted by law or as is necessary in order to service stockholder accounts (for example, to a transfer agent or third-party administrator).
We restrict access to nonpublic personal information about our stockholders to employees of OFS Advisor and its affiliates with a legitimate business need for the information. We maintain physical, electronic and procedural safeguards designed to protect the nonpublic personal information of our stockholders.
Other
We are required to provide and maintain a bond issued by a reputable fidelity insurance company to protect us against larceny and embezzlement. Furthermore, as a BDC, we are prohibited from protecting any director or officer against any liability to OFS Capital or our stockholders arising from willful misfeasance, bad faith, gross negligence or reckless disregard of the duties involved in the conduct of such person’s office.
We and OFS Advisor each have adopted and implemented written policies and procedures reasonably designed to prevent violation of relevant federal securities laws, will review these policies and procedures annually for their adequacy and the effectiveness of their implementation, and have designated a chief compliance officer to be responsible for administering the policies and procedures.
31
Table of Contents
We may also be prohibited under the 1940 Act from knowingly participating in certain transactions with our affiliates without the prior approval of our board of directors who are not interested persons and, in some cases, prior approval by the SEC. The SEC has interpreted the BDC prohibition on transactions with affiliates to prohibit all “joint transactions” between entities that share a common investment adviser. In connection with our election to be regulated as a BDC, we will not be permitted to co-invest with other funds managed by OFSAM or one of its affiliates in certain types of negotiated investment transactions unless we receive exemptive relief from the SEC permitting us to do so. Moreover, we may be limited in our ability to make follow-on investments or liquidate our existing equity investments in such companies. Although we intend to apply to the SEC for exemptive relief to permit such co-investment and liquidity transactions, subject to certain conditions, we cannot be certain that our application for such relief will be granted or what conditions will be placed on such relief.
The staff of the SEC has granted no-action relief permitting purchases of a single class of privately placed securities provided that the adviser negotiates no term other than price and certain other conditions are met. As a result, we only expect to co-invest on a concurrent basis with other funds advised by OFS Advisor when each of us will own the same securities of the issuer and when no term is negotiated other than price. Any such investment would be made, subject to compliance with existing regulatory guidance, applicable regulations and OFS Advisor’s allocation policy. If opportunities arise that would otherwise be appropriate for us and for another fund advised by OFS Advisor to invest in different securities of the same issuer, OFS Advisor will need to decide which fund will proceed with the investment. The decision by OFS Advisor to allocate an opportunity to another entity could cause us to forego an investment opportunity that we otherwise would have made. Moreover, except in certain circumstances, we will be unable to invest in any issuer in which another fund advised by OFS Advisor has previously invested.
Sarbanes-Oxley Act of 2002
The Sarbanes-Oxley Act imposes a wide variety of regulatory requirements on publicly held companies and their insiders. Many of these requirements affect us. For example:
| • | pursuant to Rule 13a-14 under the Exchange Act, our principal executive officer and principal financial officer must certify the accuracy of the financial statements contained in our periodic reports; |
| • | pursuant to Item 307 under Regulation S-K, our periodic reports must disclose our conclusions about the effectiveness of our disclosure controls and procedures; |
| • | pursuant to Rule 13a-15 under the Exchange Act, our management must prepare an annual report regarding its assessment of our internal control over financial reporting, which must be audited by our independent registered public accounting firm; and |
| • | pursuant to Item 308 of Regulation S-K and Rule 13a-15 under the Exchange Act, our periodic reports must disclose whether there were significant changes in our internal controls over financial reporting or in other factors that could significantly affect these controls subsequent to the date of their evaluation, including any corrective actions with regard to significant deficiencies and material weaknesses. |
The Sarbanes-Oxley Act requires us to review our current policies and procedures to determine whether we comply with the Sarbanes-Oxley Act and the regulations promulgated under such act. We will continue to monitor our compliance with all regulations that are adopted under the Sarbanes-Oxley Act and will take actions necessary to ensure that we are in compliance with that act.
Small Business Investment Company Regulations
As noted above under “General—Tamarix LP,” we expect our investment strategy will continue to be augmented by Tamarix LP. It is our intention to seek to acquire all of the limited partnership interests in Tamarix LP and all the limited liability company interests in Tamarix GP that are currently owned or subscribed for by other persons.
32
Table of Contents
SBICs are designed to stimulate the flow of private equity capital to eligible small businesses. Under SBA regulations, SBICs may make loans to eligible small businesses and invest in the equity securities of small businesses. The SBIC license allows Tamarix LP to receive SBA-guaranteed debenture funding, subject to the issuance of a leverage commitment by the SBA and other customary procedures. SBA-guaranteed debentures are non-recourse, interest only debentures with interest payable semi-annually and have a ten year maturity. The principal amount of SBA-guaranteed debentures is not required to be paid prior to maturity but may be prepaid without penalty twice each year on certain dates. The interest rate of SBA-guaranteed debentures is fixed at the time of issuance at a market-driven spread over U.S. Treasury Notes with 10-year maturities.
SBA regulations currently limit the amount that an SBIC may borrow to up to a maximum of $150 million when it has at least $75 million in regulatory capital, receives a leverage commitment from the SBA and has been through an examination by the SBA subsequent to licensing. For two or more SBICs under common control, the maximum amount of outstanding SBA-provided leverage cannot exceed $225 million. A proposed bill in the U.S. Senate, the Expanding Access to Capital for Entrepreneurial Act, or Senate Bill 511, would increase the total SBIC leverage capacity for affiliated SBIC funds from $225 million to $350 million. However, the ultimate form and likely outcome of such legislation or any similar legislation cannot be predicted.
The investments of an SBIC are limited to loans to and equity securities of eligible small businesses. Under present SBA regulations, eligible small businesses generally include businesses that (together with their affiliates) have a tangible net worth not exceeding $18 million and have average annual net income after U.S. federal income taxes not exceeding $6 million (average net income to be computed without benefit of any carryover loss) for the two most recent fiscal years. In addition, an SBIC must devote 25% of its investment activity to “smaller concerns,” as defined by the SBA. A smaller concern generally includes businesses that have a tangible net worth not exceeding $6 million and have average annual net income after U.S. federal income taxes not exceeding $2 million (average net income to be computed without benefit of any net carryover loss) for the two most recent fiscal years.
The SBA prohibits an SBIC from providing funds to small businesses for certain purposes, such as relending, real estate or investing in companies outside of the United States, and providing funds to businesses engaged in a few prohibited industries and to certain “passive” (i.e., non-operating) companies. In addition, without prior SBA approval, an SBIC may not invest an amount equal to more than approximately 30% of the SBIC’s regulatory capital in any one company and its affiliates.
The SBA restricts the ability of SBICs to release their investors from their capital commitments and requires that SBICs invest idle funds in accordance with SBA regulations. SBA regulations also include restrictions on a “change of control” or other transfers of limited partnership interests in an SBIC. In addition, Tamarix LP may also be limited in its ability to make distributions to us if it does not have sufficient accumulated net profit, in accordance with SBA regulations.
Tamarix LP is subject to regulation and oversight by the SBA, including requirements with respect to maintaining certain minimum financial ratios and other covenants. Receipt of the SBIC license and an SBA leverage commitment does not assure that Tamarix LP will receive SBA guaranteed debenture funding, and such funding is dependent upon Tamarix LP’s continuing to be in compliance with SBA regulations and policies.
The SBA, as a creditor, will have a superior claim to the Tamarix LP’s assets over Tamarix LP’s limited partners and our stockholders in the event that Tamarix LP is liquidated or the SBA exercises its remedies under the SBA debentures issued by Tamarix LP in the event of a default.
MATERIAL U.S. FEDERAL INCOME TAX CONSIDERATIONS
Election to be Taxed as a RIC
As a BDC, we intend to elect to be treated as a RIC under Subchapter M of the Code. As a RIC, we generally will not have to pay corporate-level federal income taxes on any ordinary income or capital gains that
33
Table of Contents
we timely distribute to our stockholders as dividends. To qualify as a RIC, we must, among other things, meet certain source-of-income and asset diversification requirements, as described below. In addition, to be relieved of U.S. federal income taxes on income and gains distributed to our stockholders, we must distribute to our stockholders, for each taxable year, at least 90% of our “investment company taxable income,” which is generally our net ordinary income plus the excess of realized net short-term capital gains over realized net long-term capital losses (the “Annual Distribution Requirement”).
Taxation as a RIC
If we:
| • | qualify as a RIC; and |
| • | satisfy the Annual Distribution Requirement; |
then we will not be subject to U.S. federal income tax on the portion of our investment company taxable income and net capital gain (i.e. net long-term capital gains in excess of net short-term capital losses) we distribute to stockholders. We will be subject to U.S. federal income tax at the regular corporate rates on any net income or net capital gain not distributed (or deemed distributed) to our stockholders.
We will be subject to a 4% nondeductible federal excise tax on our undistributed income unless we distribute in a timely manner an amount at least equal to the sum of (a) 98% of our ordinary income for each calendar year, (b) 98.2% of our capital gain net income (both long-term and short-term) for the one-year period ending October 31 in that calendar year (or, if we have a taxable year that ends on November 30 or December 31 and so elect, for our taxable year) and (c) any income realized, but not distributed, in the preceding years, or the Excise Tax Avoidance Requirement. For this purpose, however, any ordinary income or capital gain net income retained by us that is subject to corporate income tax for the tax year ending in that calendar year will be considered to have been distributed by year end. We currently intend to make sufficient distributions each taxable year to satisfy the Excise Tax Avoidance Requirement.
In order to qualify as a RIC for federal income tax purposes, we must, among other things:
| • | qualify to be treated as a BDC under the 1940 Act at all times during each taxable year; |
| • | derive in each taxable year at least 90% of our gross income from dividends, interest, certain payments with respect to loans of stock and securities, gains from the sale or other disposition of stock, securities, or foreign currencies and other income (including but not limited to gains from options, futures or forward contracts) derived with respect to our business of investing in such stock, securities or currencies, and net income derived from interests in “qualified publicly traded partnerships,” as such term is defined in the Code, or the 90% Income Test; and |
| • | diversify our holdings so that at the end of each quarter of the taxable year: |
| • | at least 50% of the value of our assets consists of cash, cash equivalents, U.S. government securities, securities of other RICs, and other securities, with such other securities limited, in respect of any one issuer, to an amount not greater than 5% of the value of our assets and 10% of the outstanding voting securities of such issuer; and |
| • | no more than 25% of the value of our assets is invested in the securities, other than U.S. government securities or securities of other RICs, of one issuer, of two or more issuers that we control (as determined under applicable tax rules) and that are engaged in the same, similar or related trades or businesses or of one or more qualified publicly traded partnerships (the “Diversification Tests”). |
34
Table of Contents
We may invest in partnerships, including qualified publicly traded partnerships, which may result in our being subject to state, local or foreign income, franchise or withholding liabilities.
We may be required to recognize taxable income in circumstances in which we do not receive cash. For example, if we hold debt obligations that are treated under applicable rules as having OID (such as debt instruments with PIK interest or, in certain cases, with increasing interest rates or issued with warrants), we must include in income each year a portion of the OID that accrues over the life of the obligation, regardless of whether cash representing such income is received by us in the same taxable year. Because any OID accrued will be included in our investment company taxable income for the year of accrual, we may be required to make a distribution to our stockholders in order to satisfy the Annual Distribution Requirement, even though we will not have received any corresponding cash amount.
We may make investments or engage in transactions that affect the character, amount and timing of gains or losses we realize. We may make investments that produce income that is not matched by a corresponding cash receipt by us. Any such income would be treated as income earned by us and therefore would be subject to the Annual Distribution Requirement. Such investments may require us to borrow money or dispose of other securities in order to comply with those requirements. We may also make investments that prevent or defer the recognition of losses or the deduction of expenses. These investments may likewise require us to borrow money or dispose of other securities in order to comply with the Annual Distribution Requirement. Additionally, we may make investments that result in the recognition of ordinary income rather than capital gain, or that prevent us from accruing a long-term holding period. These investments may prevent us from making capital gain distributions, as described below. We intend to monitor our transactions, will make the appropriate tax elections and will make the appropriate entries in our books and records when we make any such investments in order to mitigate the effects of these rules.
Although we do not presently expect to do so, we are authorized to borrow funds and to sell assets in order to satisfy distribution requirements. However, under the 1940 Act, we are not permitted to make distributions to our stockholders while our debt obligations and other senior securities are outstanding unless certain “asset coverage” tests are met. See “Regulation—Senior Securities.” Moreover, our ability to dispose of assets to meet our distribution requirements may be limited by (a) the illiquid nature of our portfolio and/or (b) other requirements relating to our status as a RIC, including the Diversification Tests. If we dispose of assets in order to meet the Annual Distribution Requirement or the Excise Tax Avoidance Requirement, we may make such dispositions at times that, from an investment standpoint, are not advantageous.
Some of the income and fees that we may recognize will not satisfy the 90% Income Test. In order to ensure that such income and fees do not disqualify us as a RIC for a failure to satisfy the 90% Income Test, we may be required to recognize such income and fees directly or indirectly through one or more entities treated as corporations for U.S. federal income tax purposes. Such corporations will be required to pay U.S. corporate income tax on their earnings, which ultimately will reduce our return on such income and fees.
Failure to Qualify as a RIC
If for any year we do not qualify for treatment as a RIC, we will be subject to tax on all of our taxable income (including our net capital gain) at regular corporate rates. We will not be able to deduct distributions to stockholders, nor would we be required to make such distributions. Distributions, including distributions of net long-term capital gain, would generally be taxable to our stockholders as dividend income to the extent of our current and accumulated earnings and profits. Such dividend income generally would be taxable as qualified dividend income eligible for a maximum federal tax rate of 20% in the case of individual U.S. stockholders provided that the shares have been held for more than 60 days during the 121-day period beginning 60 days before the ex-dividend date. Subject to certain limitations under the Code, corporate distributees would be eligible for the dividends received deduction. Distributions in excess of our current and accumulated earnings and profits would be treated first as a return of capital to the extent of the stockholder’s tax basis, and any
35
Table of Contents
remaining distributions would be treated as capital gain. If we fail to qualify as a RIC for a period greater than two taxable years, to qualify as a RIC in a subsequent year we may be subject to regular corporate tax on any net built-in gains with respect to certain of our assets (i.e., the excess of the aggregate gains, including items of income, over aggregate losses that would have been realized with respect to such assets if we had been liquidated) that we elect to recognize on requalification or when recognized over the next ten years.
36
Table of Contents
| Item 1A. | Risk Factors |
RISK FACTORS
Investing in our common stock involves a number of significant risks. In addition to the other information contained in this annual report on Form 10-K, you should consider carefully the following information before making an investment in our common stock. The risks set out below are not the only risks we face. Additional risks and uncertainties not presently known to us or not presently deemed material by us might also impair our operations and performance. If any of the following events occur, our business, financial condition and results of operations could be materially and adversely affected. In such case, our net asset value and the trading price of our common stock could decline, and you may lose all or part of your investment.
Risks Related to Our Business and Structure
Prior to November 7, 2012, we had not operated as a BDC or qualified to be treated as a RIC, and none of OFS Advisor or its affiliates had ever managed a BDC or a RIC, and we may not be able to operate our business successfully or generate sufficient revenue to make or sustain distributions to our stockholders.
Prior to November 7, 2012, we had not operated as a BDC or qualified to be treated as a RIC, and none of OFS Advisor or its affiliates has ever managed a BDC. As a result of our limited experience as a BDC, we are subject to the business risks and uncertainties associated with new entities of these types, including the risk that we will not achieve our investment objective, or that we will not qualify or maintain our qualification to be treated as a RIC, and that the value of your investment could decline substantially.
The 1940 Act and the Code impose numerous constraints on the operations of business development companies and RICs. Business development companies are required, for example, to invest at least 70% of their total assets primarily in securities of U.S. private or thinly traded public companies, cash, cash equivalents, U.S. government securities and other high-quality debt instruments that mature in one year or less from the date of investment. Furthermore, any failure to comply with the requirements imposed on business development companies by the 1940 Act could cause the SEC to bring an enforcement action against us and/or expose us to claims of private litigants. In addition, upon approval of a majority of our stockholders, we may elect to withdraw our status as a BDC. If we decide to withdraw our election, or if we otherwise fail to qualify, or maintain our qualification, as a BDC, we may be subject to the substantially greater regulation under the 1940 Act as a closed-end investment company. Compliance with such regulations would significantly decrease our operating flexibility, and could significantly increase our costs of doing business. Moreover, qualification for treatment as a RIC requires satisfaction of source-of-income, asset diversification and distribution requirements. None of us, OFS Advisor or any of our or their respective affiliates has any experience operating under these constraints, which may hinder our ability to take advantage of attractive investment opportunities and to achieve our investment objective.
We intend to continue to pursue a portion of our investment strategy through Tamarix LP; however, we have not previously operated or managed an SBIC. Although Tamarix LP has received an SBIC license, none of us, OFS Advisor or any of our or its respective affiliates has any experience in operating an SBIC or complying with SBA regulations and requirements. As a result, our lack of experience may hinder our ability to obtain the necessary approvals from the SBA in connection with the acquisition of the ownership interests of Tamarix LP and Tamarix GP that we do not already own or, even if such approvals are received, to take advantage of investment opportunities through Tamarix LP and to achieve our investment objective.
We are dependent upon the OFS senior professionals for our future success and upon their access to the investment professionals and partners of OFS and its affiliates, including Tamarix GP’s management personnel.
We do not have any internal management capacity or employees. We will depend on the diligence, skill and network of business contacts of the OFS senior professionals to achieve our investment objective. Our future
37
Table of Contents
success will depend, to a significant extent, on the continued service and coordination of the OFS senior management team, particularly Glenn Pittson, Senior Managing Director of OFSC, Bilal Rashid, Senior Managing Director of OFSC, Jeffrey Cerny, Senior Managing Director of OFSC, and Kathi Inorio, Senior Managing Director of OFSC. Each of these individuals is an employee at will of OFSC and is not subject to an employment contract. In addition, we rely on the services of Richard Ressler, Chairman of the executive committee of OFSAM and Chairman of OFS Advisor’s investment committee pursuant to a consulting agreement with Orchard Capital. The departure of Mr. Ressler or any of the senior managers of OFSC, or of a significant number of its other investment professionals, could have a material adverse effect on our ability to achieve our investment objective.
In addition, the day-to-day investment activities of Tamarix LP are managed by the three investment professionals of Tamarix GP, each of whom, together with Glenn Pittson, our Chief Executive Officer, serves on the investment committee of Tamarix LP. If we are able to acquire the interests in Tamarix LP and Tamarix GP that we do not already own, we anticipate that the three investment professionals will become employees of OFSC. The departure of any of Tamarix GP’s management personnel could have a material adverse effect on our ability to obtain the necessary approvals from the SBA in connection with the acquisition of the ownership interests in Tamarix LP and Tamarix GP that we do not already own and our strategy to make investments through Tamarix LP.
We expect that OFS Advisor will evaluate, negotiate, structure, close and monitor our investments in accordance with the terms of the Investment Advisory Agreement. We can offer no assurance, however, that OFS senior professionals will continue to provide investment advice to us. If these individuals do not maintain their existing relationships with OFS and its affiliates and do not develop new relationships with other sources of investment opportunities, we may not be able to grow our investment portfolio or achieve our investment objective. In addition, individuals with whom the OFS senior professionals have relationships are not obligated to provide us with investment opportunities. Therefore, we can offer no assurance that such relationships will generate investment opportunities for us.
OFS Advisor is a subsidiary of OFSAM that has no employees and will depend upon access to the investment professionals and other resources of OFS and its affiliates to fulfill its obligations to us under the Investment Advisory Agreement. OFS Advisor will also depend upon OFS to obtain access to deal flow generated by the professionals of OFS and its affiliates. Under a Staffing Agreement between OFSC, a subsidiary of OFSAM that employs all of OFS’s personnel, and OFS Advisor, OFSC has agreed to provide OFS Advisor with the resources necessary to fulfill these obligations. The Staffing Agreement provides that OFSC will make available to OFS Advisor experienced investment professionals and access to the senior investment personnel of OFSC for purposes of evaluating, negotiating, structuring, closing and monitoring our investments. We are not a party to this Staffing Agreement and cannot assure shareholders that OFSC will fulfill its obligations under the agreement. If OFSC fails to perform, we cannot assure shareholders that OFS Advisor will enforce the Staffing Agreement or that such agreement will not be terminated by either party or that we will continue to have access to the investment professionals of OFSC and its affiliates or their information and deal flow.
The investment committee that will oversee our investment activities is provided by OFS Advisor under the Investment Advisory Agreement. OFS Advisor’s investment committee consists of Richard Ressler (Chairman), Glenn Pittson, Bilal Rashid, Jeffrey Cerny and Kathi Inorio. The loss of any member of OFS Advisor’s investment committee or of other OFS senior professionals would limit our ability to achieve our investment objective and operate as we anticipate. This could have a material adverse effect on our financial condition and results of operation.
38
Table of Contents
Our business model depends to a significant extent upon strong referral relationships with financial institutions, sponsors and investment professionals. Any inability of OFS Advisor to maintain or develop these relationships, or the failure of these relationships to generate investment opportunities, could adversely affect our business.
We depend upon OFS Advisor to maintain OFS’s relationships with financial institutions, sponsors and investment professionals, and we intend to rely to a significant extent upon these relationships to provide us with potential investment opportunities. If OFS Advisor fails to maintain such relationships, or to develop new relationships with other sources of investment opportunities, we will not be able to grow our investment portfolio. In addition, individuals with whom the principals of OFS Advisor have relationships are not obligated to provide us with investment opportunities, and, therefore, we can offer no assurance that these relationships will generate investment opportunities for us in the future.
A substantial portion of our senior secured loan portfolio was purchased by OFS Capital WM, our wholly-owned subsidiary, using borrowed funds and will be managed by an unaffiliated loan manager.
OFS Capital WM financed the purchase from us of a substantial portion of our loan portfolio using funds borrowed under the OFS Capital WM Facility. While investors in OFS Capital will continue to benefit from the loan assets sold to OFS Capital WM by virtue of our ownership of 100% of the equity interests in OFS Capital WM, they will also be exposed to the risks associated with those assets. For example, lenders have a first lien on the loan assets sold to OFS Capital WM and will have a superior claim to our claim as an equityholder in any liquidation of OFS Capital WM. In addition, the lender has a first lien on our equity interests in OFS Capital WM and will have a superior claim to a claim by our investors on those equity interests in any liquidation of OFS Capital. Additionally, OFS Capital WM is managed by an affiliate of Madison Capital (an indirect wholly-owned subsidiary of New York Life Investments), as loan manager, pursuant to the OFS Capital WM Facility documentation, which prescribes the order in which payments are to be applied and contains other contractual restrictions. Accordingly, at least in the near term, our success will depend, to a certain degree, on the administration of OFS Capital WM’s portfolio by an unaffiliated loan manager. If the loan manager is unable to generate sufficient returns to permit payments to us under the OFS Capital WM Facility documentation or defaults in its obligation thereunder, we could be materially and adversely affected.
We may not replicate the historical results achieved by OFSAM or other entities managed or sponsored by OFSAM and its other affiliates.
Although our historical concentration has been investments in senior secured loans, we intend to pursue an investment strategy that will also focus on investments in unitranche, second-lien and mezzanine loans and, to a lesser extent, warrants and other equity securities. In addition, as a result of the OFS Capital WM Transaction, we no longer have sole management control over the assets we sold to OFS Capital WM, or any assets subsequently acquired by OFS Capital WM, and these assets may not achieve or replicate historical results. We may consider co-investing in portfolio investments with OFSAM or its other affiliates or other investment funds, accounts or investment vehicles managed by OFSAM or its other affiliates. Any such investments will be subject to regulatory limitations and approvals by directors who are not “interested persons,” as defined in the 1940 Act. We can offer no assurance, however, that we will pursue or obtain such approvals or develop opportunities that comply with such limitations. We also cannot assure shareholders that we will replicate the historical results achieved by OFSAM or its other affiliates, and we caution you that our investment returns could be substantially lower than the returns achieved by them in prior periods. Additionally, all or a portion of the prior results may have been achieved in particular market conditions which may never be repeated. Moreover, current or future market volatility and regulatory uncertainty may have an adverse impact on our future performance.
Our financial condition and results of operation will depend on our ability to manage our business effectively.
Our ability to achieve our investment objective and grow will depend on our ability to manage our business. This will depend, in turn, on OFS Advisor’s ability to identify, invest in and monitor companies that meet our
39
Table of Contents
investment criteria. The achievement of our investment objectives on a cost-effective basis will depend upon OFS Advisor’s execution of our investment process, its ability to provide competent, attentive and efficient services to us and, to a lesser extent, our access to financing on acceptable terms. OFS Advisor will have substantial responsibilities under the Investment Advisory Agreement. The OFS senior professionals and other personnel of OFS Advisor’s affiliates, including OFSC, may be called upon to provide managerial assistance to our portfolio companies. These activities may distract them or slow our rate of investment. Any failure to manage our business and our future growth effectively could have a material adverse effect on our business, financial condition and results of operations. In addition, as a result of the OFS Capital WM Transaction, we no longer have sole management control over a substantial portion of our historical portfolio.
We have potential conflicts of interest related to obligations that OFS Advisor or its affiliates may have to other clients.
OFS Advisor and its affiliates manage other assets and CLO funds and may manage other entities in the future, and these other funds and entities may have similar or overlapping investment strategies. The members of OFS Advisor’s investment committee serve or may serve as officers, directors or principals of entities that operate in the same or a related line of business as we do, or of investment funds or other investment vehicles managed by OFS Advisor or its affiliates. Similarly, OFS Advisor and/or its affiliates may have, or may have other clients with, similar, different or competing investment objectives. In serving in these multiple capacities, they may have obligations to other clients or investors in those entities, the fulfillment of which may not be in the best interests of us or our stockholders. OFS Advisor will seek to allocate investment opportunities among eligible accounts in a manner that is fair and equitable over time and consistent with its allocation policy. Under this allocation policy, if two or more investment vehicles with similar or overlapping investment strategies are in their investment periods, an available opportunity will be allocated based on the provisions governing allocations of such investment opportunities in the relevant organizational, offering or similar documents, if any, for such investment vehicles. In the absence of any such provisions, OFS Advisor will consider the following factors and the weight that should be given with respect to each of these factors:
| • | investment guidelines and/or restrictions, if any, set forth in the applicable organizational, offering or similar documents for the investment vehicles; |
| • | risk and return profile of the investment vehicles; |
| • | suitability/priority of a particular investment for the investment vehicles; |
| • | if applicable, the targeted position size of the investment for the investment vehicles; |
| • | level of available cash for investment with respect to the investment vehicles; |
| • | total amount of funds committed to the investment vehicles; and |
| • | the age of the investment vehicles and the remaining term of their respective investment periods, if any. |
There can be no assurance that we will be able to participate in all investment opportunities that are suitable to us.
OFS Advisor’s investment committee, OFS Advisor or its affiliates may, from time to time, possess material non-public information, limiting our investment discretion.
OFS senior professionals and members of OFS Advisor’s investment committee may serve as directors of, or in a similar capacity with, companies in which we invest, the securities of which are purchased or sold on our behalf. In the event that material nonpublic information is obtained with respect to such companies, or we become subject to trading restrictions under the internal trading policies of those companies or as a result of applicable law or regulations, we could be prohibited for a period of time from purchasing or selling the securities of such companies, and this prohibition may have an adverse effect on us.
40
Table of Contents
Our incentive fee structure may create incentives for OFS Advisor that are not fully aligned with the interests of our stockholders.
In the course of our investing activities, we will pay management and incentive fees to OFS Advisor. The base management fee is based on our total assets (other than cash and cash equivalents but including assets purchased with borrowed amounts and including assets owned by any consolidated entity). As a result, investors in our common stock will invest on a “gross” basis and receive distributions on a “net” basis after expenses, resulting in a lower rate of return than one might achieve through direct investments. Because these fees are based on our total assets, other than cash and cash equivalents but including assets purchased with borrowed amounts and including any assets owned by any consolidated entity, OFS Advisor will benefit when we incur debt or use leverage. Our board of directors is charged with protecting our interests by monitoring how OFS Advisor addresses these and other conflicts of interests associated with its management services and compensation. While our board of directors is not expected to review or approve each borrowing or incurrence of leverage, our independent directors will periodically review OFS Advisor’s services and fees as well as its portfolio management decisions and portfolio performance. In connection with these reviews, our independent directors will consider whether our fees and expenses (including those related to leverage) remain appropriate. As a result of this arrangement, OFS Advisor or its affiliates may from time to time have interests that differ from those of our stockholders, giving rise to a conflict.
The part of the incentive fee payable to OFS Advisor that relates to our pre-incentive fee net investment income will be computed and paid on income that may include interest income that has been accrued but not yet received in cash. This fee structure may be considered to involve a conflict of interest for OFS Advisor to the extent that it may encourage OFS Advisor to favor debt financings that provide for deferred interest, rather than current cash payments of interest. OFS Advisor may have an incentive to invest in deferred interest securities in circumstances where it would not have done so but for the opportunity to continue to earn the incentive fee even when the issuers of the deferred interest securities would not be able to make actual cash payments to us on such securities. This risk could be increased because OFS Advisor is not obligated to reimburse us for any incentive fees received even if we subsequently incur losses or never receive in cash the deferred income that was previously accrued.
The valuation process for certain of our portfolio holdings creates a conflict of interest.
Many of our portfolio investments are expected to be made in the form of securities that are not publicly traded. As a result, our board of directors will determine the fair value of these securities in good faith as described below in “Many of our portfolio investments will be recorded at fair value as determined in good faith by our board of directors and, as a result, there may be uncertainty as to the value of our portfolio investments.” In connection with that determination, investment professionals from OFS Advisor may provide our board of directors with portfolio company valuations based upon the most recent portfolio company financial statements available and projected financial results of each portfolio company. In addition, the members of our board of directors who are not independent directors have a substantial indirect pecuniary interest in OFS Advisor. The participation of OFS Advisor’s investment professionals in our valuation process, and the indirect pecuniary interest in OFS Advisor by those members of our board of directors, could result in a conflict of interest since OFS Advisor’s management fee is based, in part, on our total assets (other than cash and cash equivalents but including assets purchased with borrowed amounts and including assets owned by any consolidated entity).
We may have additional conflicts related to other arrangements with OFS Advisor or its affiliates.
We have entered into a license agreement with OFSAM under which OFSAM has agreed to grant us a non-exclusive, royalty-free license to use the name “OFS.” See “Item 1. Business—Management and Other Agreements—License Agreement.” In addition, we will rent office space from another subsidiary of OFSAM and pay to that subsidiary our allocable portion of overhead and other expenses incurred in performing its obligations under the Administration Agreement, such as rent and our allocable portion of the cost of our officers, including our chief executive officer, chief financial officer, chief compliance officer and chief accounting officer. This will create conflicts of interest that our board of directors must monitor.
41
Table of Contents
The Investment Advisory Agreement with OFS Advisor and the Administration Agreement with OFS Services were not negotiated on an arm’s length basis and may not be as favorable to us as if they had been negotiated with an unaffiliated third party.
The Investment Advisory Agreement and the Administration Agreement were negotiated between related parties. Consequently, their terms, including fees payable to OFS Advisor, may not be as favorable to us as if they had been negotiated with an unaffiliated third party. In addition, we may choose not to enforce, or to enforce less vigorously, our rights and remedies under these agreements because of our desire to maintain our ongoing relationship with OFS Advisor, OFS Services and their respective affiliates. Any such decision, however, would breach our fiduciary obligations to our stockholders.
Our ability to enter into transactions with our affiliates will be restricted, which may limit the scope of investments available to us.
Because we have elected to be treated as a BDC under the 1940 Act, we are prohibited under the 1940 Act from participating in certain transactions with our affiliates without the prior approval of our independent directors and, in some cases, of the SEC. Those transactions include purchases and sales, and so-called “joint” transactions, in which we and one or more of our affiliates are engaging together in certain types of profit-making activities. Any person that owns, directly or indirectly, five percent or more of our outstanding voting securities will be our affiliate for purposes of the 1940 Act, and we are generally prohibited from engaging in purchases or sales of assets or joint transactions with such affiliates, absent the prior approval of our independent directors. Additionally, without the approval of the SEC, we are prohibited from engaging in purchases or sales of assets or joint transactions with the following affiliated persons: (a) our officers, directors, and employees; (b) OFS Advisor and its affiliates; and (c) any person who owns more than 25% of our voting securities or certain of that person’s affiliates.
We may, however, invest alongside OFSAM and its other affiliates or their respective other clients in certain circumstances where doing so is consistent with applicable law and SEC staff interpretations. For example, we may invest alongside such accounts consistent with guidance promulgated by the SEC staff permitting us and such other accounts to purchase interests in a single class of privately placed securities so long as certain conditions are met, including that OFS Advisor, acting on our behalf and on behalf of other clients, negotiates no term other than price. We may also invest alongside OFSAM and its other affiliates or their respective other clients as otherwise permissible under regulatory guidance, applicable regulations and OFS Advisor’s allocation policy. Under this allocation policy, if two or more investment vehicles with similar or overlapping investment strategies are in their investment periods, an available opportunity will be allocated based on the provisions governing allocations of such investment opportunities in the relevant organizational, offering or similar documents, if any, for such investment vehicles. In the absence of any such provisions, OFS Advisor will consider the following factors and the weight that should be given with respect to each of these factors:
| • | investment guidelines and/or restrictions, if any, set forth in the applicable organizational, offering or similar documents for the investment vehicles; |
| • | risk and return profile of the investment vehicles; |
| • | suitability/priority of a particular investment for the investment vehicles; |
| • | if applicable, the targeted position size of the investment for the investment vehicles; |
| • | level of available cash for investment with respect to the investment vehicles; |
| • | total amount of funds committed to the investment vehicles; and |
| • | the age of the investment vehicles and the remaining term of their respective investment periods, if any. |
In situations where co-investment with such other accounts is not permitted or appropriate, such as when there is an opportunity to invest in different securities of the same issuer or where the different investments could be expected to result in a conflict between our interests and those of other accounts, OFS Advisor will need to
42
Table of Contents
decide which account will proceed with the investment. The decision by OFS Advisor to allocate an opportunity to another entity could cause us to forego an investment opportunity that we otherwise would have made. Moreover, except in certain circumstances, we will be unable to invest in any issuer in which OFSAM and its other affiliates or a fund managed by OFSAM or its other affiliates has previously invested. Similar restrictions limit our ability to transact business with our officers or directors or their affiliates. These restrictions may limit the scope of investment opportunities that would otherwise be available to us.
We may also be prohibited under the 1940 Act from knowingly participating in certain transactions with our affiliates without the prior approval of members of our board of directors who are not interested persons and, in some cases, prior approval by the SEC. The SEC has interpreted the BDC regulations governing transactions with affiliates to prohibit certain “joint transactions” between entities that share a common investment adviser. In connection with our election to be regulated as a BDC, we will not be permitted to co-invest with other funds managed by OFSAM or one of its affiliates in certain types of negotiated investment transactions unless we receive exemptive relief from the SEC permitting us to do so. Although we may apply to the SEC for exemptive relief to permit such co-investment and liquidity transactions, subject to certain conditions, we cannot be certain that any application for such relief will be granted or what conditions will be placed on such relief.
We may not obtain the necessary approvals from the SBA in connection with our anticipated acquisition of the ownership interests in Tamarix LP and Tamarix GP that we do not already own, and we may not be able to acquire such interests.
Tamarix LP has received an SBIC license to operate as a “stand-alone” entity. Additional approvals of the SBA will be required in connection with our proposed acquisition of the ownership interests in Tamarix LP and Tamarix GP that we do not already own due to the fact that, following such acquisition, Tamarix LP will be what is known as a “drop-down” SBIC. We cannot guarantee that the SBA will provide those necessary approvals. Additionally, the owners of the remaining ownership interests in Tamarix LP and Tamarix GP are under no contractual obligation to sell us their interests. If the SBA does not issue the approvals necessary for us to acquire the remaining ownership interests in Tamarix LP and Tamarix GP, or the other holders of the ownership interests are unwilling to sell us their interests, our ability to benefit from Tamarix LP’s investment opportunities will be correspondingly limited. In the event we are unable to acquire the remaining ownership interests in Tamarix LP and Tamarix GP, we anticipate that we will invest substantially less in Tamarix LP than we would have otherwise, and no more than our current commitment aggregating $25 million in respect of both entities. While our investment objective and strategy will remain the same, the inability to acquire the remaining ownership interests in Tamarix LP and therefore utilize the full leverage capacity of Tamarix LP will potentially reduce the return on our investments or force us to seek alternative sources of debt financing. An inability to obtain acceptable alternative financing could limit our ability to grow our business and execute our business strategy and could decrease our earnings, if any, which may have an adverse effect on the value of our securities.
We may not receive exemptive relief from the SEC to permit us to exclude the debt of Tamarix LP from our asset coverage test, which may decrease our capacity to fund investments with debt capital.
If we acquire the ownership interest in Tamarix LP and Tamarix GP that we do not already own, we expect to apply for exemptive relief from the SEC to permit us to exclude the debt of Tamarix LP guaranteed by the SBA from our 200% asset coverage test under the 1940 Act. We cannot assure shareholders that we will receive exemptive relief from the SEC and if we do not receive an exemption for this SBA debt, we would have reduced capacity to fund investments with debt capital. As a result, we may not be able to realize fully the benefits of Tamarix LP and may not achieve our investment objective.
SBA regulations limit the outstanding dollar amount of SBA guaranteed debenture funding that may be received by an SBIC or group of SBICs under common control.
SBA regulations currently limit the amount that an SBIC may borrow to up to a maximum of $150 million when it has at least $75 million in regulatory capital, receives a leverage commitment from the SBA and has been
43
Table of Contents
through an examination by the SBA subsequent to licensing. For two or more SBICs under common control, the maximum amount of outstanding SBA-provided leverage cannot exceed $225 million. A proposed bill in the U.S. Senate, the Expanding Access to Capital for Entrepreneurial Act, or Senate Bill 511, would increase the total SBIC leverage capacity for affiliated SBIC funds from $225 million to $350 million. However, the ultimate form and likely outcome of such legislation or any similar legislation cannot be predicted.
Assuming we are able to acquire the ownership interests in Tamarix LP and Tamarix GP that we do not already own, we cannot presently predict whether or not we will borrow the maximum permitted amount; if we reach the maximum dollar amount of SBA guaranteed debentures permitted, and thereafter require additional capital, our cost of capital may increase, and there is no assurance that we will be able to obtain additional financing on acceptable terms.
Moreover, Tamarix LP’s status as an SBIC and its receipt of a $30.1 million SBA leverage commitment does not automatically assure that it will receive SBA guaranteed debenture funding. Receipt of SBA leverage funding is dependent upon whether Tamarix LP is and continues to be in compliance with SBA regulations and policies and whether funding is available. The amount of SBA leverage funding available to SBICs is dependent upon annual Congressional authorizations and in the future may be subject to annual Congressional appropriations. There can be no assurance that there will be sufficient debenture funding available at the times desired by Tamarix LP. As of December 31, 2012, Tamarix LP has a total of $14.0 million of SBA guaranteed debentures outstanding and has paid the SBA fees of approximately $0.6 million.
Tamarix LP is subject to SBA regulations.
We expect our investment strategy will continue to be augmented by Tamarix LP, which is regulated by the SBA. It is our intention to seek to acquire all of the limited partnership interests in Tamarix LP and all the limited liability company interests in Tamarix GP that are currently owned or subscribed for by other persons. These acquisitions would require further approval from the SBA. We cannot assure shareholders that the SBA would grant that further approval or that the holders of those ownership interests would agree to transfer them to us.
The SBIC license allows Tamarix LP to receive SBA-guaranteed debenture funding, subject to the issuance of a leverage commitment by the SBA and other customary procedures. Tamarix LP has received a $30.1 million SBA leverage commitment and may receive additional leverage commitments from the SBA. However, receipt of SBA-guaranteed debenture funding is subject to its compliance with SBA regulations and policies. We cannot assure shareholders that Tamarix LP will satisfy the conditions to receipt of such funding or that it will otherwise be able to make additional draws on its existing commitment or receive additional commitments from the SBA.
Further, the SBA regulations require that a licensed SBIC be periodically examined and audited by the SBA to determine its compliance with the relevant SBA regulations. If Tamarix LP fails to comply with applicable SBA regulations, the SBA could, depending on the severity of the violation, limit or prohibit its use of debentures, declare outstanding debentures immediately due and payable, and/or limit its ability to make new investments. The SBA, as a creditor, will have a superior claim to Tamarix LP’s assets over Tamarix LP’s limited partners and our stockholders in the event Tamarix LP is liquidated or the SBA exercises its remedies under the SBA debentures issued by Tamarix LP in the event of a default. In addition, the SBA can revoke or suspend a license for willful or repeated violation of, or willful or repeated failure to observe, any provision of the Small Business Investment Act of 1958 or any rule or regulation promulgated thereunder. These actions by the SBA would, in turn, negatively affect us because of our ownership interest in Tamarix LP.
The SBA places certain limitations on the financing terms of investments by SBICs in portfolio companies and prohibits an SBIC from providing funds to small businesses for certain purposes, such as relending, real estate or investing in companies outside of the United States, and providing funds to businesses engaged in a few prohibited industries and to certain “passive” (i.e., non-operating) companies. In addition, without prior SBA approval, an SBIC may not invest an amount equal to more than approximately 30% of the SBIC’s regulatory capital in any one company and its affiliates. Compliance with SBIC requirements may cause Tamarix LP to forego attractive investment opportunities that are not permitted under SBA regulations.
44
Table of Contents
Tamarix LP is subject to ongoing regulation and oversight by the SBA, including requirements with respect to maintaining certain minimum financial ratios and other covenants. The SBA restricts the ability of SBICs to release their investors from their capital commitments and requires that SBICs invest idle funds in accordance with SBA regulations. The SBA also prohibits, without prior SBA approval, a “change of control” of an SBIC or transfers that would result in any person (or a group of persons acting in concert) owning 10% or more of a class of capital stock of a licensed SBIC as well as other transfers of limited partnership interests. In addition, Tamarix LP may also be limited in its ability to make distributions to us if it does not have sufficient accumulated net profit, in accordance with SBA regulations. These requirements may make it more difficult for us to achieve our investment objective.
We intend to finance our investments with borrowed money, which will magnify the potential for gain or loss on amounts invested and may increase the risk of investing in us.
The use of leverage magnifies the potential for gain or loss on amounts invested. The use of leverage is generally considered a speculative investment technique and increases the risks associated with investing in our securities. We may pledge up to 100% of our assets and may grant a security interest in all of our assets under the terms of any debt instruments we may enter into with lenders. In addition, under the terms of any credit facility or other debt instrument we enter into, we are likely to be required by its terms to use the net proceeds of any investments that we sell to repay a portion of the amount borrowed under such facility or instrument before applying such net proceeds to any other uses. If the value of our assets decreases, leveraging would cause net asset value to decline more sharply than it otherwise would have had we not leveraged, thereby magnifying losses or eliminating our equity stake in a leveraged investment. Similarly, any decrease in our revenue or income will cause our net income to decline more sharply than it would have had we not borrowed. Such a decline would also negatively affect our ability to make dividend payments on our common stock or preferred stock. Our ability to service our debt will depend largely on our financial performance and will be subject to prevailing economic conditions and competitive pressures. Moreover, because the management fee payable to OFS Advisor is payable based on our total assets (other than cash, cash equivalents but including assets purchased with borrowed amounts and including assets owned by any consolidated entity), OFS Advisor will have a financial incentive to incur leverage which may not be consistent with our stockholders’ interests. In addition, our common stockholders will bear the burden of any increase in our expenses as a result of our use of leverage, including interest expenses and any increase in the management fee payable to OFS Advisor.
As a BDC, we generally will be required to meet a coverage ratio of total assets to total borrowings and other senior securities, which include all of our borrowings and any preferred stock that we may issue in the future, of at least 200%. If this ratio declines below 200%, we will not be able to incur additional debt and could be required to sell a portion of our investments to repay some debt when it is disadvantageous to do so. This could have a material adverse effect on our operations, and we may not be able to make distributions. The amount of leverage that we employ will depend on OFS Advisor’s and our board of directors’ assessment of market and other factors at the time of any proposed borrowing. We cannot assure shareholders that we will be able to obtain credit at all or on terms acceptable to us.
The following table illustrates the effect of leverage on returns from an investment in our common stock assuming various annual returns, net of expenses. The calculations in the table below are hypothetical and actual returns may be higher or lower than those appearing in the table below.
| Assumed Return on Our Portfolio (Net of Expenses) |
||||||||||||||||||||
| -10% | -5% | 0% | 5% | 10% | ||||||||||||||||
| Corresponding return to common stockholder(1) |
-20 | % | -12 | % | -3 | % | 6 | % | 14 | % | ||||||||||
| (1) | Assumes $245.5 million in total assets, $99.2 million in debt outstanding, $141.8 million in net assets and an average cost of funds of 4.2%. Assumptions are based on our financial condition and our average cost of funds at December 31, 2012. |
45
Table of Contents
Based on our outstanding indebtedness of $99.2 million as of December 31, 2012 and the average cost of funds of 4.2% as of that date, our investment portfolio must experience an annual return of at least 1.7% to cover interest payments on the outstanding debt.
To the extent we use debt to finance our investments, changes in interest rates will affect our cost of capital and net investment income.
To the extent we borrow money to make investments, our net investment income will depend, in part, upon the difference between the rate at which we borrow funds and the rate at which we invest those funds. As a result, we can offer no assurance that a significant change in market interest rates will not have a material adverse effect on our net investment income in the event we use debt to finance our investments. In periods of rising interest rates, our cost of funds would increase, which could reduce our net investment income. We may use interest rate risk management techniques in an effort to limit our exposure to interest rate fluctuations. Such techniques may include various interest rate hedging activities to the extent permitted by the 1940 Act.
You should also be aware that a rise in the general level of interest rates typically leads to higher interest rates applicable to our debt investments. Accordingly, an increase in interest rates may result in an increase of the amount of incentive fees payable to OFS Advisor.
We may enter into reverse repurchase agreements, which are another form of leverage.
We may enter into reverse repurchase agreements as part of our management of our temporary investment portfolio. Under a reverse repurchase agreement, we will effectively pledge our assets as collateral to secure a short-term loan. Generally, the other party to the agreement makes the loan in an amount equal to a percentage of the fair value of the pledged collateral. At the maturity of the reverse repurchase agreement, we will be required to repay the loan and correspondingly receive back our collateral. While used as collateral, the assets continue to pay principal and interest which are for the benefit of us.
Our use of reverse repurchase agreements, if any, involves many of the same risks involved in our use of leverage, as the proceeds from reverse repurchase agreements generally will be invested in additional securities. There is a risk that the market value of the securities acquired in the reverse repurchase agreement may decline below the price of the securities that we have sold but remain obligated to purchase. In addition, there is a risk that the market value of the securities retained by us may decline. If a buyer of securities under a reverse repurchase agreement were to file for bankruptcy or experience insolvency, we may be adversely affected. Also, in entering into reverse repurchase agreements, we would bear the risk of loss to the extent that the proceeds of such agreements at settlement are less than the fair value of the underlying securities being pledged. In addition, due to the interest costs associated with reverse repurchase agreements transactions, our net asset value would decline, and, in some cases, we may be worse off than if we had not used such instruments.
We operate in a highly competitive market for investment opportunities, which could reduce returns and result in losses.
A number of entities compete with us to make the types of investments that we plan to make. We will compete with public and private funds, commercial and investment banks, commercial financing companies and, to the extent they provide an alternative form of financing, private equity and hedge funds. Many of our competitors are substantially larger and have considerably greater financial, technical and marketing resources than we do. For example, we believe some of our competitors may have access to funding sources that are not available to us. In addition, some of our competitors may have higher risk tolerances or different risk assessments, which could allow them to consider a wider variety of investments and establish more relationships than us. Furthermore, many of our competitors are not subject to the regulatory restrictions that the 1940 Act imposes on us as a BDC or the source of income, asset diversification and distribution requirements we must satisfy to maintain our RIC status. The competitive pressures we face may have a material adverse effect on our
46
Table of Contents
business, financial condition and results of operations. As a result of this competition, we may not be able to take advantage of attractive investment opportunities from time to time, and we may not be able to identify and make investments that are consistent with our investment objective.
With respect to the investments we make, we will not seek to compete based primarily on the interest rates we will offer, and we believe that some of our competitors may make loans with interest rates that will be lower than the rates we offer. In the secondary market for acquiring existing loans, we expect to compete generally on the basis of pricing terms. With respect to all investments, we may lose some investment opportunities if we do not match our competitors’ pricing, terms and structure. However, if we match our competitors’ pricing, terms and structure, we may experience decreased net interest income, lower yields and increased risk of credit loss. We may also compete for investment opportunities with OFSAM and its other affiliates or accounts managed by OFSAM or one of its other affiliates. Although OFS Advisor will allocate opportunities in accordance with its policies and procedures, allocations to such other accounts will reduce the amount and frequency of opportunities available to us and may not be in the best interests of us and our stockholders. Moreover, the performance of investments will not be known at the time of allocation.
We may suffer credit losses.
Investment in middle market companies is highly speculative and involves a high degree of risk of credit loss, and therefore our securities may not be suitable for someone with a low tolerance for risk. These risks are likely to increase during an economic recession.
We will be subject to corporate-level federal income tax if we are unable to qualify or maintain our qualification as a RIC.
We intend to elect to be treated as a RIC under Subchapter M of the Code, and no assurance can be given that we will be able to qualify for and maintain RIC status after we elect to be treated as RIC. If we qualify as a RIC under the Code, we will not be required to pay corporate-level federal income taxes on our income and capital gains distributed (or deemed distributed) to our stockholders. To qualify as a RIC under the Code and to be relieved of federal taxes on income and gains distributed to our stockholders, we must meet certain source-of-income, asset diversification and distribution requirements. The distribution requirement for a RIC is satisfied if we distribute at least 90% of our net ordinary income and net short-term capital gains in excess of net long-term capital losses, if any, to our stockholders on an annual basis. We will be subject, to the extent we use debt financing, to certain asset coverage ratio requirements under the 1940 Act and financial covenants under loan and credit agreements that could, under certain circumstances, restrict us from making distributions necessary to qualify as a RIC. If we are unable to obtain cash from other sources, we may fail to qualify and maintain our qualification for the tax benefits available to RICs and, thus, may be subject to corporate-level federal income tax. To qualify and maintain our qualification as a RIC, we must also meet certain asset diversification requirements at the end of each calendar quarter. Failure to meet these tests may result in our having to dispose of certain investments quickly in order to prevent the loss of RIC status. Because most of our investments will be in private or thinly traded public companies, any such dispositions could be made at disadvantageous prices and may result in substantial losses. If we fail to qualify, or continue to qualify, as a RIC for any reason and become subject to corporate-level federal income tax, the resulting corporate taxes could substantially reduce our net assets, the amount of income available for distributions to stockholders and the amount of our distributions and the amount of funds available for new investments. Such a failure would have a material adverse effect on us and our stockholders. See “Item 1. Business—Material U.S. Federal Income Tax Considerations—Taxation as a RIC.”
47
Table of Contents
Our subsidiaries and portfolio companies may be unable to make distributions to us that will enable us to meet RIC requirements, which could result in the imposition of an entity-level tax.
In order for us to qualify as a RIC and to minimize corporate-level taxes, we will be required to distribute on an annual basis substantially all of our taxable income, which would include income from our subsidiaries and portfolio companies. As a substantial portion of our investments are, or are anticipated to be, made through OFS Capital WM or Tamarix LP, we will be substantially dependent on those entities for cash distributions to enable us to meet the RIC distribution requirements. Tamarix LP may be limited by the Small Business Investment Act of 1958 and SBA regulations governing SBICs from making certain distributions to us that may be necessary to enable us to qualify as a RIC. We may have to request a waiver of the SBA’s restrictions for Tamarix LP to make certain distributions to maintain our status as a RIC and we cannot assure shareholders that the SBA will grant such waiver. Additionally, OFS Capital WM is managed by an unaffiliated loan manager pursuant to the OFS Capital WM Facility documentation, which prescribes the order in which payments are to be applied and contains other contractual restrictions. Accordingly, we cannot assure shareholders that OFS Capital WM will make distributions to us. If our subsidiaries and portfolio companies are unable to make distributions to us, this may result in loss of RIC status and a consequent imposition of a corporate-level federal income tax on us.
We may have difficulty paying our required distributions if we recognize income before, or without, receiving cash representing such income.
For U.S. federal income tax purposes, we will include in income certain amounts that we have not yet received in cash, such as the accretion of original issue discount (“OID”). This may arise if we purchase assets at a discount, receive warrants in connection with the making of a loan or in other circumstances, or through contracted payment-in-kind (“PIK”) interest (meaning interest paid in the form of additional principal amount of the loan instead of in cash), which represents contractual interest added to the loan balance and due at the end of the loan term. Such OID, which could be significant relative to our overall investment activities, or increases in loan balances as a result of contracted PIK arrangements, will be included in income before we receive any corresponding cash payments. We also may be required to include in income certain other amounts that we will not receive in cash. Additionally, assets have been transferred to us with built-in-gain (i.e., assets in respect of which our basis is less than fair market value upon receipt of such assets (“built-in-gain assets”)).
Since in certain cases we may recognize income before or without receiving cash representing such income, we may have difficulty meeting the requirement to distribute at least 90% of our net ordinary income and net short-term capital gains in excess of net long-term capital losses, if any, to qualify for the tax benefits available to RICs. In such a case, we may have to sell some of our investments at times and/or at prices we would not consider advantageous, raise additional debt or equity capital or reduce new investment originations and sourcings to meet these distribution requirements. If we sell built-in-gain assets, we may be required to recognize taxable income in respect of the built-in-gain on such assets. In such a case, we would have to distribute all of our taxable gain (including the built-in-gain) in respect of such sale to avoid the imposition of entity-level tax on such gain. If we are not able to obtain such cash from other sources, we may fail to qualify for the tax benefits available to RICs and thus be subject to corporate-level income tax. See “Item 1. Business—Material U.S. Federal Income Tax Considerations—Taxation as a RIC.”
We may in the future choose to pay dividends in our own stock, in which case shareholders may be required to pay tax in excess of the cash they receive.
We may distribute taxable dividends that are payable in cash or shares of our common stock at the election of each stockholder. Under certain applicable provisions of the Code and the Treasury regulations, distributions payable in cash or in shares of stock at the election of stockholders are treated as taxable dividends. The Internal Revenue Service has issued private rulings indicating that this rule will apply even where the total amount of cash that may be distributed is limited to no more than 20% of the total distribution. Under these rulings, if too many stockholders elect to receive their distributions in cash, each such stockholder would receive a pro rata
48
Table of Contents
share of the total cash to be distributed and would receive the remainder of their distribution in shares of stock. If we decide to make any distributions consistent with these rulings that are payable in part in our stock, taxable stockholders receiving such dividends will be required to include the full amount of the dividend (whether received in cash, our stock, or a combination thereof) as ordinary income (or as long-term capital gain to the extent such distribution is properly reported as a capital gain dividend) to the extent of our current and accumulated earnings and profits for United States federal income tax purposes. As a result, a U.S. stockholder may be required to pay tax with respect to such dividends in excess of any cash received. If a U.S. stockholder sells the stock it receives as a dividend in order to pay this tax, the sales proceeds may be less than the amount included in income with respect to the dividend, depending on the market price of our stock at the time of the sale. Furthermore, with respect to non-U.S. stockholders, we may be required to withhold U.S. tax with respect to such dividends, including in respect of all or a portion of such dividend that is payable in stock. In addition, if a significant number of our stockholders determine to sell shares of our stock in order to pay taxes owed on dividends, it may put downward pressure on the trading price of our stock.
Because we expect to distribute substantially all of our net investment income and net realized capital gains to our stockholders, we may need additional capital to finance our growth and such capital may not be available on favorable terms or at all.
We intend to elect to be taxed for federal income tax purposes as a RIC under Subchapter M of the Code. After electing to be treated as RIC, if we meet certain requirements, including source of income, asset diversification and distribution requirements, and if we continue to qualify as a BDC, we will continue to qualify to be a RIC under the Code and will not have to pay corporate-level taxes on income we distribute to our stockholders as dividends, allowing us to substantially reduce or eliminate our corporate-level tax liability. As a BDC, we are generally required to meet a coverage ratio of total assets to total senior securities, which includes all of our borrowings and any preferred stock we may issue in the future, of at least 200% at the time we issue any debt or preferred stock. This requirement limits the amount that we may borrow. Because we will continue to need capital to grow our investment portfolio, this limitation may prevent us from incurring debt or preferred stock and require us to raise additional equity at a time when it may be disadvantageous to do so. We cannot assure shareholders that debt and equity financing will be available to us on favorable terms, or at all, and debt financings may be restricted by the terms of any of our outstanding borrowings. In addition, as a BDC, we are generally not permitted to issue common stock priced below net asset value without stockholder approval. If additional funds are not available to us, we could be forced to curtail or cease new lending and investment activities, and our net asset value could decline.
Regulations governing our operation as a BDC affect our ability to and the way in which we raise additional capital. As a BDC, we will need to raise additional capital, which will expose us to risks, including the typical risks associated with leverage.
We may issue debt securities or preferred stock and/or borrow money from banks or other financial institutions, which we refer to collectively as “senior securities,” up to the maximum amount permitted by the 1940 Act. Under the provisions of the 1940 Act, we will be permitted as a BDC to issue senior securities in amounts such that our asset coverage ratio, as defined in the 1940 Act, equals at least 200% of gross assets less all liabilities and indebtedness not represented by senior securities, after each issuance of senior securities. If the value of our assets declines, we may be unable to satisfy this test. If that happens, we may be required to sell a portion of our investments and, depending on the nature of our leverage, repay a portion of our indebtedness at a time when such sales may be disadvantageous. Also, any amounts that we use to service our indebtedness would not be available for distributions to our common stockholders. If we issue senior securities, we will be exposed to typical risks associated with leverage, including an increased risk of loss.
As of December 31, 2012, we had debt outstanding in the amount of $99.2 million. We utilized approximately $90 million of our IPO proceeds to pay down the OFS Capital WM Facility. The OFS Capital WM Facility indebtedness repaid included approximately $48.0 million of Class A loans and approximately $42.0 million of Class B loans. Our ability to incur additional debt and remain in compliance with the asset
49
Table of Contents
coverage test will be limited. We may seek a credit facility to finance investments and potentially for working capital requirements. There can be no assurance that we will be able to obtain such financing on favorable terms or at all, or that Tamarix LP will be able to borrow additional funds. If we receive the SBA’s approval of our proposed acquisition of the ownership interest in Tamarix LP and Tamarix GP, we expect to apply for exemptive relief from the SEC to permit us to exclude the debt of Tamarix LP guaranteed by the SBA from our 200% asset coverage test under the 1940 Act. If we receive an exemption for this SBA debt, we would have increased capacity to fund investments with debt capital. However, we cannot assure shareholders that we will receive such exemptive relief from the SEC.
No person or entity from which we borrow money will have a veto power or a vote in approving or changing any of our fundamental policies. If we issue preferred stock, the preferred stock would rank “senior” to common stock in our capital structure, preferred stockholders would have separate voting rights on certain matters and might have other rights, preferences or privileges more favorable than those of our common stockholders, and the issuance of preferred stock could have the effect of delaying, deferring or preventing a transaction or a change of control that might involve a premium price for holders of our common stock or otherwise be in our shareholders’ best interest. Holders of our common stock will directly or indirectly bear all of the costs associated with offering and servicing any preferred stock that we issue. In addition, any interests of preferred stockholders may not necessarily align with the interests of holders of our common stock and the rights of holders of shares of preferred stock to receive dividends would be senior to those of holders of shares of our common stock. We do not, however, anticipate issuing preferred stock during the 12 months following our IPO.
We are not generally able to issue and sell our common stock at a price below net asset value per share. We may, however, sell our common stock, or warrants, options or rights to acquire our common stock, at a price below the then-current net asset value per share of our common stock if our board of directors determines that such sale is in the best interests of us and our stockholders, and if our stockholders approve any such sale. In any such case, the price at which our securities are to be issued and sold may not be less than a price that, in the determination of our board of directors, closely approximates the market value of such securities (less any distributing commission or discount). If we raise additional funds by issuing common stock or senior securities convertible into, or exchangeable for, our common stock, then the percentage ownership of our stockholders at that time will decrease, and you might experience dilution.
Our ability to invest in public companies may be limited in certain circumstances.
To maintain our status as a BDC, we are not permitted to acquire any assets other than “qualifying assets” specified in the 1940 Act unless, at the time the acquisition is made, at least 70% of our total assets are qualifying assets (with certain limited exceptions). Subject to certain exceptions for follow-on investments and distressed companies, an investment in an issuer that has outstanding securities listed on a national securities exchange may be treated as a qualifying asset only if such issuer has a common equity market capitalization that is less than $250 million at the time of such investment and meets the other specified requirements.
Various events could negatively impact the value of our investment in OFS Capital WM (and, as a result, a shareholder’s investment in us), including an event of default under the OFS Capital WM Facility documentation and the substantive consolidation of OFS Capital WM with us.
The OFS Capital WM Facility documentation contains several events of default, including breaches of representations and warranties by us, OFS Capital WM or Madison Capital (an indirect wholly-owned subsidiary of New York Life Investments) and breaches of covenants that prohibit certain actions by us, OFS Capital WM, Madison Capital or the affiliate of Madison Capital that acts as loan manager for OFS Capital WM. If an event of default were to occur, the trustee, at the request of the controlling lender, will accelerate the outstanding indebtedness under the OFS Capital WM Facility and may enforce its rights in the collateral securing the facility. As we have pledged our equity interest in OFS Capital WM as security for the obligations under the OFS Capital WM Facility, we may lose all or a portion of our investment in OFS Capital WM if an event of default occurs.
50
Table of Contents
Breaches of the OFS Capital WM Facility documentation that fall short of an event of default could also negatively impact the value of our equity interest in OFS Capital WM and the value of your investment in OFS Capital.
An extended continuation of the disruption in the capital markets and the credit markets could negatively affect our business.
As a BDC, we must maintain our ability to raise additional capital for investment purposes. Without sufficient access to the capital markets or credit markets, we may be forced to curtail our business operations or we may not be able to pursue new business opportunities. Since the middle of 2007, the capital markets and the credit markets have been experiencing extreme volatility and disruption and, accordingly, there has been and will continue to be uncertainty in the financial markets in general. Ongoing disruptive conditions in the financial industry and the impact of new legislation in response to those conditions could restrict our business operations and could adversely impact our results of operations and financial condition.
Once we have fully invested the net proceeds of IPO, we will access the capital markets periodically to issue debt or equity securities or borrow from financial institutions in order to obtain such additional capital. Unfavorable economic conditions could increase our funding costs, limit our access to the capital markets or result in a decision by lenders not to extend credit to us. A reduction in the availability of new capital could limit our ability to pursue new business opportunities and grow our business. In addition, we will be required to distribute at least 90% of our net ordinary income and net short-term capital gains in excess of net long-term capital losses, if any, to our stockholders to qualify for the tax benefits available to RICs. As a result, these earnings will not be available to fund new investments. An inability to access the capital markets successfully could limit our ability to grow our business and execute our business strategy fully and could decrease our earnings, if any, which may have an adverse effect on the value of our securities.
We are currently operating in a period of capital markets disruption.
The U.S. capital markets have been experiencing volatility and disruption since the beginning of the credit crisis in 2007, and the U.S. economy was in a recession for several consecutive calendar quarters during the same period. Disruptions in the capital markets have increased the spread between the yields realized on risk-free and higher risk securities, resulting in illiquidity in parts of the capital markets. A prolonged period of market illiquidity may have an adverse effect on our business, financial condition and results of operations. Unfavorable economic conditions also could increase our funding costs, limit our access to the capital markets or result in a decision by lenders not to extend credit to us. These events could limit our investment originations and sourcings, limit our ability to grow and negatively impact our operating results.
The downgrade in the U.S. credit rating could materially adversely affect our business, financial conditions and results of operations.
On August 5, 2011, Standard & Poor’s downgraded the U.S. credit rating to AA+ from its top rank of AAA. The current U.S. debt ceiling and budget deficit concerns have increased the possibility of other credit-rating agency downgrades and an economic slowdown. The downgrade of the U.S. credit rating could have a material adverse effect on the financial markets and economic conditions in the United States and throughout the world. Additionally, austerity measures necessary to reduce the deficit could accelerate an already slowing economy in the near term.
Downgrading of the U.S. credit rating could negatively impact the trading market for U.S. government securities and would likely impact the credit risk associated with our investments in U.S. Treasury securities. This could reduce the value of the U.S. Treasury securities in our portfolio. In addition, adverse market and economic conditions that could occur due to a downgrade of the U.S. credit rating on the United States’ debt could result in rapidly rising interest rates, a falling dollar, shakier financial markets and slowing or negative
51
Table of Contents
economic growth in the near term. These events could adversely affect our business in many ways, including, but not limited to, adversely impacting our portfolio companies’ ability to obtain financing, or obtaining financing but at significantly lower valuations than the preceding financing rounds. If any of these events were to occur, it could materially adversely affect our business, financial condition and results of operations.
Adverse developments in the credit markets may impair our ability to secure debt financing.
During the economic downturn in the United States that began in mid-2007, many commercial banks and other financial institutions stopped lending or significantly curtailed their lending activity. In addition, in an effort to stem losses and reduce their exposure to segments of the economy deemed to be high risk, some financial institutions limited routine refinancing and loan modification transactions and even reviewed the terms of existing facilities to identify bases for accelerating the maturity of existing lending facilities. As a result, it may be difficult for us to obtain desired financing to finance the growth of our investments on acceptable economic terms, or at all.
If we are unable to consummate credit facilities on commercially reasonable terms, our liquidity may be reduced significantly. If we are unable to repay amounts outstanding under any facility we may enter into and are declared in default or are unable to renew or refinance any such facility, it would limit our ability to initiate significant originations or to operate our business in the normal course. These situations may arise due to circumstances that we may be unable to control, such as inaccessibility of the credit markets, a severe decline in the value of the U.S. dollar, a further economic downturn or an operational problem that affects third parties or us, and could materially damage our business. Moreover, we are unable to predict when economic and market conditions may become more favorable. Even if such conditions improve broadly and significantly over the long term, adverse conditions in particular sectors of the financial markets could adversely impact our business.
If we do not invest a sufficient portion of our assets in qualifying assets, we could fail to continue to qualify as a BDC or be precluded from investing according to our current business strategy.
As a BDC, we may not acquire any assets other than “qualifying assets” unless, at the time of and after giving effect to such acquisition, at least 70% of our total assets are qualifying assets. See “Item 1. Business—Regulation.”
We believe that most of the investments that we may acquire in the future will constitute qualifying assets. However, we may be precluded from investing in what we believe are attractive investments if such investments are not qualifying assets for purposes of the 1940 Act. Until we acquire the remaining limited partnership interests in Tamarix LP that we do not already own, Tamarix LP will not be a qualifying asset. If a sufficient portion of our assets are not qualifying assets, we could violate the 1940 Act provisions applicable to business development companies. As a result of such violation, specific rules under the 1940 Act could prevent us, for example, from making follow-on investments in existing portfolio companies (which could result in the dilution of our position) or could require us to dispose of investments at inappropriate times in order to come into compliance with the 1940 Act. If we need to dispose of such investments quickly, it could be difficult to dispose of such investments on favorable terms. We may not be able to find a buyer for such investments and, even if we do find a buyer, we may have to sell the investments at a substantial loss. Any such outcomes would have a material adverse effect on our business, financial condition and results of operations.
If we do not maintain our status as a BDC, we would be subject to regulation as a registered closed-end investment company under the 1940 Act. As a registered closed-end fund, we would be subject to substantially more regulatory restrictions under the 1940 Act which would significantly decrease our operating flexibility.
Many of our portfolio investments will be recorded at fair value as determined in good faith by our board of directors and, as a result, there may be uncertainty as to the value of our portfolio investments.
We expect that many of our portfolio investments, including those of our subsidiaries, will take the form of securities that are not publicly traded. The fair value of securities and other investments that are not publicly
52
Table of Contents
traded may not be readily determinable, and we will value these securities at fair value as determined in good faith by our board of directors, including to reflect significant events affecting the value of our securities. Most of our investments (other than cash and cash equivalents) will be classified as Level 3 under Accounting Standards Codification Topic 820, Fair Value Measurement and Disclosures (ASC Topic 820). This means that our portfolio valuations will be based on unobservable inputs and our own assumptions about how market participants would price the asset or liability in question. We expect that inputs into the determination of fair value of our portfolio investments will require significant management judgment or estimation. Even if observable market data are available, such information may be the result of consensus pricing information or broker quotes, which include a disclaimer that the broker would not be held to such a price in an actual transaction. The non-binding nature of consensus pricing and/or quotes accompanied by disclaimers materially reduces the reliability of such information. We expect to retain the services of one or more independent service providers to review the valuation of these securities. The types of factors that the board of directors may take into account in determining the fair value of our investments generally include, as appropriate, comparison to publicly traded securities including such factors as yield, maturity and measures of credit quality, the enterprise value of a portfolio company, the nature and realizable value of any collateral, the portfolio company’s ability to make payments and its earnings and discounted cash flow, the markets in which the portfolio company does business and other relevant factors. Because such valuations, and particularly valuations of private securities and private companies, are inherently uncertain, may fluctuate over short periods of time and may be based on estimates, our determinations of fair value may differ materially from the values that would have been used if a ready market for these securities existed. Our net asset value could be adversely affected if our determinations regarding the fair value of our investments were materially higher than the values that we ultimately realize upon the disposal of such securities.
We will adjust quarterly the valuation of our portfolio to reflect our board of directors’ determination of the fair value of each investment in our portfolio. Any changes in fair value are recorded in our statement of income as net change in unrealized appreciation or depreciation.
We may experience fluctuations in our quarterly operating results.
We could experience fluctuations in our quarterly operating results due to a number of factors, including the interest rate payable on the debt securities we acquire, the default rate on such securities, the level of our expenses, variations in and the timing of the recognition of realized and unrealized gains or losses, distributions from our subsidiaries and portfolio companies, the degree to which we encounter competition in our markets and general economic conditions. In light of these factors, results for any period should not be relied upon as being indicative of performance in future periods.
Changes in the laws or regulations, including the Dodd-Frank Act, governing our business, or changes in the interpretations thereof, and any failure by us to comply with these laws or regulations, could have a material adverse effect on our, and our portfolio companies’, business, results of operations or financial condition.
We and our portfolio companies are subject to regulation by laws at the U.S. federal, state and local levels, including those that govern BDCs, RICs or non-depository commercial lenders. These laws and regulations, including applicable accounting standards, as well as their interpretation, may change from time to time, and new laws, regulations, accounting standards and interpretations may also come into effect. Any such new or changed laws or regulations could have a material adverse effect on our business.
We are also subject to judicial and administrative decisions that affect our operations, including our loan originations, maximum interest rates, fees and other charges, disclosures to portfolio companies, the terms of secured transactions, collection and foreclosure procedures and other trade practices. If these laws, regulations or decisions change, or if we expand our business into jurisdictions that have adopted more stringent requirements than those in which we currently conduct business, we may have to incur significant expenses in order to comply, or we might have to restrict our operations. If we do not comply with applicable laws, regulations and decisions, we may lose licenses needed for the conduct of our business and may be subject to civil fines and criminal penalties.
53
Table of Contents
In addition, changes to the laws and regulations governing our operations related to permitted investments may cause us to alter our investment strategy, including making investments in entities such as OFS Capital WM, in order to avail ourselves of new or different opportunities. Such changes could result in material differences to the strategies and plans set forth in this annual report on Form 10-K and our accounting practices described in this annual report on Form 10-K, and may shift our investment focus from the areas of expertise of OFS Advisor to other types of investments in which OFS Advisor may have little or no expertise or experience. Any such changes, if they occur, could have a material adverse effect on our results of operations and the value of your investment.
Moreover, in light of current conditions in the U.S. and global financial markets and the U.S. and global economy, legislators, the presidential administration and regulators have increased their focus on the regulation of the financial services industry. The Dodd-Frank Act became effective on July 21, 2010, although many provisions of the Dodd-Frank Act have delayed effectiveness or will not become effective until the relevant federal agencies issue new rules to implement the Dodd-Frank Act. Nevertheless, the Dodd-Frank Act may have a material adverse impact on the financial services industry as a whole and on our business, results of operations and financial condition. Accordingly, we cannot predict the effect the Dodd-Frank Act or its implementing regulations will have on our business, results of operations or financial condition.
Pending legislation may allow us to incur additional leverage.
As a BDC, under the 1940 Act generally we are not permitted to incur indebtedness unless immediately after such borrowing we have an asset coverage for total borrowings of at least 200% (i.e., the amount of debt may not exceed 50% of the value of our assets). Recent legislation introduced in the U.S. House of Representatives, if passed, would modify this section of the 1940 Act and increase the amount of debt that business development companies may incur by modifying the percentage from 200% to 150%. As a result, we may be able to incur additional indebtedness in the future and therefore shareholders’ risk of an investment in us may increase.
Loss of status as a RIC would reduce our net asset value and distributable income.
We intend to qualify as a RIC under the Code. As a RIC we would not have to pay federal income taxes on our income (including realized gains) that we distribute to our stockholders, provided that we satisfy certain distribution and other requirements. Accordingly, we are not permitted under accounting rules to establish reserves for taxes on our unrealized capital gains. If we fail to qualify for RIC status in any year, to the extent that we had unrealized gains, we would have to establish reserves for taxes, which would reduce our net asset value and the amount potentially available for distribution. In addition, if we, as a RIC, were to decide to make a deemed distribution of net realized capital gains and retain the net realized capital gains, we would have to establish appropriate reserves for taxes that we would have to pay on behalf of stockholders. It is possible that establishing reserves for taxes could have a material adverse effect on the value of our common stock. See “Item 1. Business— Material U.S. Federal Income Tax Considerations—Taxation as a RIC.”
Our board of directors may change our investment objective, operating policies and strategies without prior notice or stockholder approval.
Our board of directors has the authority, except as otherwise provided in the 1940 Act, to modify or waive certain of our operating policies and strategies without prior notice and without stockholder approval. However, absent stockholder approval, we may not change the nature of our business so as to cease to be, or withdraw our election as, a BDC. Under Delaware law, we also cannot be dissolved without prior stockholder approval except by judicial action. We cannot predict the effect any changes to our current operating policies and strategies would have on our business, operating results and the price value of our common stock. Nevertheless, any such changes could adversely affect our business and impair our ability to make distributions.
54
Table of Contents
Provisions of the General Corporation Law of the State of Delaware and our certificate of incorporation and bylaws could deter takeover attempts and have an adverse effect on the price of our common stock.
The General Corporation Law of the State of Delaware (the “DGCL”) contains provisions that may discourage, delay or make more difficult a change in control of us or the removal of our directors. Our certificate of incorporation and bylaws contain provisions that limit liability and provide for indemnification of our directors and officers. These provisions and others also may have the effect of deterring hostile takeovers or delaying changes in control or management. We are subject to Section 203 of the DGCL, the application of which is subject to any applicable requirements of the 1940 Act. This section generally prohibits us from engaging in mergers and other business combinations with stockholders that beneficially own 15% or more of our voting stock, or with their affiliates, unless our directors or stockholders approve the business combination in the prescribed manner. Section 203 of the DGCL may discourage third parties from trying to acquire control of us and increase the difficulty of consummating such an offer.
We have also adopted measures that may make it difficult for a third party to obtain control of us, including provisions of our certificate of incorporation authorizing our board of directors to classify or reclassify shares of our stock in one or more classes or series and to cause the issuance of additional shares of our stock. These provisions, as well as other provisions of our certificate of incorporation and bylaws, may delay, defer or prevent a transaction or a change in control that might otherwise be in the best interests of our stockholders.
OFS Advisor can resign on 60 days’ notice, and we may not be able to find a suitable replacement within that time, resulting in a disruption in our operations that could adversely affect our financial condition, business and results of operations.
OFS Advisor has the right, under the Investment Advisory Agreement, to resign at any time upon not less than 60 days’ written notice, whether we have found a replacement or not. If OFS Advisor resigns, we may not be able to find a new investment adviser or hire internal management with similar expertise and ability to provide the same or equivalent services on acceptable terms within 60 days, or at all. If we are unable to do so quickly, our operations are likely to experience a disruption, our financial condition, business and results of operations as well as our ability to pay distributions are likely to be adversely affected and the market price of our shares may decline. In addition, the coordination of our internal management and investment activities is likely to suffer if we are unable to identify and reach an agreement with a single institution or group of executives having the expertise possessed by OFS Advisor and its affiliates. Even if we are able to retain comparable management, whether internal or external, the integration of such management and their lack of familiarity with our investment objective may result in additional costs and time delays that may adversely affect our financial condition, business and results of operations.
OFS Services can resign from its role as our Administrator under the Administration Agreement, and we may not be able to find a suitable replacement, resulting in a disruption in our operations that could adversely affect our financial condition, business and results of operations.
OFS Services has the right to resign under the Administration Agreement, whether we have found a replacement or not. If OFS Services resigns, we may not be able to find a new administrator or hire internal management with similar expertise and ability to provide the same or equivalent services on acceptable terms, or at all. If we are unable to do so quickly, our operations are likely to experience a disruption, our financial condition, business and results of operations as well as our ability to pay distributions are likely to be adversely affected and the market price of our shares may decline. In addition, the coordination of our internal management and administrative activities is likely to suffer if we are unable to identify and reach an agreement with a service provider or individuals with the expertise possessed by OFS Services. Even if we are able to retain a comparable service provider or individuals to perform such services, whether internal or external, their integration into our business and lack of familiarity with our investment objective may result in additional costs and time delays that may adversely affect our financial condition, business and results of operations.
55
Table of Contents
We will incur significant costs as a result of being a publicly traded company.
As a publicly traded company, we will incur legal, accounting and other expenses, including costs associated with the periodic reporting requirements applicable to a company whose securities are registered under the Exchange Act, as well as additional corporate governance requirements, including requirements under the Sarbanes-Oxley Act and other rules implemented by the SEC.
Efforts to comply with Section 404 of the Sarbanes-Oxley Act will involve significant expenditures, and non-compliance with Section 404 of the Sarbanes-Oxley Act may adversely affect us and the market price of our common stock.
Under current SEC rules, beginning with our fiscal year ending December 31, 2013, we will be required to report on our internal control over financial reporting pursuant to Section 404 of the Sarbanes-Oxley Act and related rules and regulations of the SEC. We will be required to review on an annual basis our internal control over financial reporting, and on a quarterly and annual basis to evaluate and disclose changes in our internal control over financial reporting.
As a result, we expect to incur additional expenses in the near term that may negatively impact our financial performance and our ability to make distributions. This process also will result in a diversion of management’s time and attention. We cannot be certain as to the timing of completion of our evaluation, testing and remediation actions or the impact of the same on our operations, and we may not be able to ensure that the process is effective or that our internal control over financial reporting is or will be effective in a timely manner. In the event that we are unable to maintain or achieve compliance with Section 404 of the Sarbanes-Oxley Act and related rules, we and the market price of our common stock may be adversely affected.
We are highly dependent on information systems and systems failures could significantly disrupt our business, which may, in turn, negatively affect the market price of our common stock and our ability to pay dividends.
Our business is highly dependent on the communications and information systems of OFS Advisor and its affiliates. Any failure or interruption of such systems could cause delays or other problems in our activities. This, in turn, could have a material adverse effect on our operating results and negatively affect the market price of our common stock and our ability to pay dividends to our stockholders.
Risks Related to Our Investments
Economic recessions or downturns could impair our portfolio companies and harm our operating results.
Many of our portfolio companies are susceptible to economic slowdowns or recessions and may be unable to repay our loans during these periods. Therefore, our non-performing assets are likely to increase and the value of our portfolio is likely to decrease during these periods. Adverse economic conditions may decrease the value of collateral securing some of our loans and the value of our equity investments. Economic slowdowns or recessions could lead to financial losses in our portfolio and a decrease in revenues, net income and assets. Unfavorable economic conditions also could increase our funding costs, limit our access to the capital markets or result in a decision by lenders not to extend credit to us. These events could prevent us from increasing our investments and harm our operating results.
A portfolio company’s failure to satisfy financial or operating covenants imposed by us or other lenders could lead to defaults and, potentially, termination of its loans and foreclosure on its assets, which could trigger cross-defaults under other agreements and jeopardize our portfolio company’s ability to meet its obligations under the debt securities that we hold. We may incur expenses to the extent necessary to seek recovery upon default or to negotiate new terms with a defaulting portfolio company. In addition, lenders in certain cases can be subject to lender liability claims for actions taken by them when they become too involved in the borrower’s business or exercise control over a borrower. It is possible that we could become subject to a lender liability
56
Table of Contents
claim, including as a result of actions taken if we render significant managerial assistance to the borrower. Furthermore, if one of our portfolio companies were to file for bankruptcy protection, even though we may have structured our investment as senior secured debt, depending on the facts and circumstances, including the extent to which we provided managerial assistance to that portfolio company, a bankruptcy court might re-characterize our debt holding and subordinate all or a portion of our claim to claims of other creditors.
Market conditions have materially and adversely affected debt and equity capital markets in the United States and around the world.
Beginning in 2007 and continuing into 2013, global financial markets and the global economy, including U.S. financial markets and the U.S. economy, have experienced periods of extreme volatility and disruption resulting in uncertainty in the financial and credit markets in general. This uncertainty in the financial and credit markets has reduced the availability of debt and equity capital for the market as a whole and to financial firms in particular. To the extent that we wish to use debt to fund our investments, the debt capital that will be available to us, if at all, may be at a higher cost, and on terms and conditions that may be less favorable, than what we expect, which could negatively affect our financial performance and results. A prolonged period of market illiquidity could cause us to reduce the volume of loans we originate and/or fund below historical levels and adversely affect the value of our portfolio investments, which could have a material and adverse effect on our business, financial condition, and results of operations. Deterioration of market conditions could materially and adversely affect our business.
Our investments in leveraged portfolio companies may be risky, and shareholders could lose all or part of their investment.
Investment in leveraged companies involves a number of significant risks. Leveraged companies in which we invest may have limited financial resources and may be unable to meet their obligations under their debt securities that we hold. Such developments may be accompanied by a deterioration in the value of any collateral and a reduction in the likelihood of our realizing any guarantees that we may have obtained in connection with our investment. In addition, our mezzanine loans are generally subordinated to senior loans and are generally unsecured. As such, other creditors may rank senior to us in the event of an insolvency. Smaller leveraged companies also may have less predictable operating results and may require substantial additional capital to support their operations, finance their expansion or maintain their competitive position.
Investing in our securities may involve an above-average degree of risk.
Historically, substantially all of our investment portfolio consisted of senior secured loans to middle-market companies in the United States. We intend to expand into additional asset classes, including investments in unitranche, second-lien and mezzanine loans and, to a lesser extent, warrants and other minority equity securities, which may result in a higher amount of risk than alternative investments, volatility or loss of principal. Our investments in portfolio companies may be highly speculative and aggressive, and therefore, an investment in our securities may not be suitable for someone with lower risk tolerance.
Our investments in private and middle-market portfolio companies are risky, and we could lose all or part of our investment.
Investment in private and middle-market companies involves a number of significant risks. Generally, little public information exists about these companies, and we expect to rely on the ability of OFS Advisor’s investment professionals to obtain adequate information to evaluate the potential returns from investing in these companies. If we are unable to uncover all material information about these companies, we may not make a fully informed investment decision, and we may lose money on our investments. Middle-market companies may have limited financial resources and may be unable to meet their obligations under their debt securities that we hold, which may be accompanied by a deterioration in the value of any collateral and a reduction in the likelihood of our realizing any guarantees we may have obtained in connection with our investment. In addition, such companies typically have shorter operating histories, narrower product lines and smaller market shares than
57
Table of Contents
larger businesses, which tend to render them more vulnerable to competitors’ actions and market conditions, as well as general economic downturns. Additionally, middle-market companies are more likely to depend on the management talents and efforts of a small group of persons. Therefore, the death, disability, resignation or termination of one or more of these persons could have a material adverse impact on our portfolio company and, in turn, on us. Middle-market companies also may be parties to litigation and may be engaged in rapidly changing businesses with products subject to a substantial risk of obsolescence. In addition, our executive officers, directors and OFS Advisor may, in the ordinary course of business, be named as defendants in litigation arising from our investments in the portfolio companies.
If the assets securing the loans that we make decrease in value, then we may lack sufficient collateral to cover losses.
We will at times take a security interest in the available assets of our portfolio companies, including the equity interests of their subsidiaries and, in some cases, the equity interests of our portfolio companies held by their stockholders. There is a risk that the collateral securing these types of loans may decrease in value over time, may be difficult to sell in a timely manner, may be difficult to appraise and may fluctuate in value based upon the success of the business and market conditions, including as a result of the inability of a portfolio company to raise additional capital. In some circumstances, our lien could be subordinated to claims of other creditors. Additionally, deterioration in a portfolio company’s financial condition and prospects, including its inability to raise additional capital, may be accompanied by deterioration in the value of the collateral for these types of loans. Moreover, in the case of certain of our investments, we do not have a first lien position on the collateral. Consequently, the fact that a loan may be secured does not guarantee that we will receive principal and interest payments according to the loan’s terms, or that we will be able to collect on the loan should we be forced to enforce our remedies.
We may suffer a loss if a portfolio company defaults on a loan and the underlying collateral is not sufficient.
In the event of a default by a portfolio company on a secured loan, we will only have recourse to the assets collateralizing the loan. If the underlying collateral value is less than the loan amount, we will suffer a loss.
In the event of bankruptcy of a portfolio company, we may not have full recourse to its assets in order to satisfy our loan, or our loan may be subject to equitable subordination. In addition, certain of our loans are subordinate to other debt of the portfolio company. If a portfolio company defaults on our loan or on debt senior to our loan, or in the event of a portfolio company bankruptcy, our loan will be satisfied only after the senior debt receives payment. Where debt senior to our loan exists, the presence of intercreditor arrangements may limit our ability to amend our loan documents, assign our loans, accept prepayments, exercise our remedies (through “standstill” periods) and control decisions made in bankruptcy proceedings relating to the portfolio company. Bankruptcy and portfolio company litigation can significantly increase collection losses and the time needed for us to acquire the underlying collateral in the event of a default, during which time the collateral may decline in value, causing us to suffer losses.
If the value of collateral underlying our loan declines or interest rates increase during the term of our loan, a portfolio company may not be able to obtain the necessary funds to repay our loan at maturity through refinancing. Decreasing collateral value and/or increasing interest rates may hinder a portfolio company’s ability to refinance our loan because the underlying collateral cannot satisfy the debt service coverage requirements necessary to obtain new financing. If a borrower is unable to repay our loan at maturity, we could suffer a loss which may adversely impact our financial performance.
The lack of liquidity in our investments may adversely affect our business.
All of our assets may be invested in illiquid securities, and a substantial portion of our investments in leveraged companies will be subject to legal and other restrictions on resale or will otherwise be less liquid than more broadly traded public securities. The illiquidity of these investments may make it difficult for us to sell
58
Table of Contents
such investments if the need arises. In addition, if we are required to liquidate all or a portion of our portfolio quickly, we may realize significantly less than the value at which we have previously recorded our investments. We may also face other restrictions on our ability to liquidate an investment in a portfolio company to the extent that we, OFS Advisor, OFSAM or any of its other affiliates have material nonpublic information regarding such portfolio company.
Price declines and illiquidity in the corporate debt markets may adversely affect the fair value of our portfolio investments, reducing our net asset value through increased net unrealized depreciation.
As a BDC, we are required to carry our investments at market value or, if no market value is ascertainable, at fair value as determined in good faith by our board of directors. As part of the valuation process, we may take into account the following types of factors, if relevant, in determining the fair value of our investments:
| • | a comparison of the portfolio company’s securities to publicly traded securities; |
| • | the enterprise value of a portfolio company; |
| • | the nature and realizable value of any collateral; |
| • | the portfolio company’s ability to make payments and its earnings and discounted cash flow; |
| • | the markets in which the portfolio company does business; and |
| • | changes in the interest rate environment and the credit markets generally that may affect the price at which similar investments may be made in the future and other relevant factors. |
When an external event such as a purchase transaction, public offering or subsequent equity sale occurs, we use the pricing indicated by the external event to corroborate our valuation. We record decreases in the market values or fair values of our investments as unrealized depreciation. Declines in prices and liquidity in the corporate debt markets may result in significant net unrealized depreciation in our portfolio. The effect of all of these factors on our portfolio may reduce our net asset value by increasing net unrealized depreciation in our portfolio. Depending on market conditions, we could incur substantial realized losses and may suffer additional unrealized losses in future periods, which could have a material adverse effect on our business, financial condition and results of operations.
We will be a non-diversified management investment company within the meaning of the 1940 Act, and therefore we will not be limited with respect to the proportion of our assets that may be invested in securities of a single issuer.
We will be classified as a non-diversified management investment company within the meaning of the 1940 Act, which means that we will not be limited by the 1940 Act with respect to the proportion of our assets that we may invest in securities of a single issuer. To the extent that we assume large positions in the securities of a small number of issuers, our net asset value may fluctuate to a greater extent than that of a diversified investment company as a result of changes in the financial condition or the market’s assessment of the issuer. We may also be more susceptible to any single economic or regulatory occurrence than a diversified investment company. Beyond our asset diversification requirements as a RIC under the Code, we do not have fixed guidelines for diversification, and our investments could be concentrated in relatively few portfolio companies.
Our portfolio may be concentrated in a limited number of portfolio companies and industries, which will subject us to a risk of significant loss if any of these companies defaults on its obligations under any of its debt instruments or if there is a downturn in a particular industry.
Although we believe our portfolio is well-diversified across companies and industries, our portfolio is and may in the future be concentrated in a limited number of portfolio companies and industries. Beyond the asset diversification requirements associated with our qualification as a RIC under the Code, we do not have fixed
59
Table of Contents
guidelines for diversification. As a result, the aggregate returns we realize may be significantly adversely affected if a small number of investments perform poorly or if we need to write down the value of any one investment. Additionally, while we are not targeting any specific industries, our investments may be concentrated in relatively few industries. As a result, a downturn in any particular industry in which we are invested could also significantly impact the aggregate returns we realize.
We may hold the debt securities of leveraged companies that may, due to the significant volatility of such companies, enter into bankruptcy proceedings.
Although we generally do not expect to make investments in companies or securities that OFS Advisor determines to be distressed investments, we may hold debt securities of leveraged companies that may, due to the significant volatility of such companies, enter into bankruptcy proceedings or experience similar financial distress. The bankruptcy process has a number of significant inherent risks. Many events in a bankruptcy proceeding are the product of contested matters and adversary proceedings and are beyond the control of the creditors. A bankruptcy filing by an issuer may adversely and permanently affect the issuer. If the proceeding is converted to a liquidation, the value of the issuer may not equal the liquidation value that was believed to exist at the time of the investment. The duration of a bankruptcy proceeding is also difficult to predict, and a creditor’s return on investment can be adversely affected by delays until the plan of reorganization or liquidation ultimately becomes effective. The administrative costs in connection with a bankruptcy proceeding are frequently high and would be paid out of the debtor’s estate prior to any return to creditors. Because the standards for classification of claims under bankruptcy law are vague, our influence with respect to the class of securities or other obligations we own may be lost by increases in the number and amount of claims in the same class or by different classification and treatment. In the early stages of the bankruptcy process, it is often difficult to estimate the extent of, or even to identify, any contingent claims that might be made. In addition, certain claims that have priority by law (for example, claims for taxes) may be substantial.
Our failure to make follow-on investments in our portfolio companies could impair the value of our portfolio.
Following an initial investment in a portfolio company, we may make additional investments in that portfolio company as “follow-on” investments, in seeking to:
| • | increase or maintain in whole or in part our position as a creditor or equity ownership percentage in a portfolio company; |
| • | exercise warrants, options or convertible securities that were acquired in the original or subsequent financing; or |
| • | preserve or enhance the value of our investment. |
We have discretion to make follow-on investments, subject to the availability of capital resources. Failure on our part to make follow-on investments may, in some circumstances, jeopardize the continued viability of a portfolio company and our initial investment, or may result in a missed opportunity for us to increase our participation in a successful operation. Even if we have sufficient capital to make a desired follow-on investment, we may elect not to make a follow-on investment because we may not want to increase our level of risk, because we prefer other opportunities or because we are inhibited by compliance with BDC requirements or the desire to maintain our RIC status. Our ability to make follow-on investments may also be limited by OFS Advisor’s allocation policy.
Because we generally do not hold controlling equity interests in our portfolio companies, we may not be able to exercise control over our portfolio companies or to prevent decisions by management of our portfolio companies that could decrease the value of our investments.
Although we may do so in the future, we generally do not hold controlling equity positions in our portfolio companies. As a result of not holding controlling equity interests in our portfolio companies, we are subject to
60
Table of Contents
the risk that a portfolio company may make business decisions with which we disagree, and that the management and/or stockholders of a portfolio company may take risks or otherwise act in ways that are adverse to our interests. Due to the lack of liquidity of the debt and equity investments that we typically hold in our portfolio companies, we may not be able to dispose of our investments in the event we disagree with the actions of a portfolio company and may therefore suffer a decrease in the value of our investments. As a result of the WM 2012 Credit Facility Amendments, we have substantial additional input into certain key management decisions with respect to OFS Capital WM’s portfolio companies, including decisions with respect to amendments to or modifications of the investments in these entities, or noticing or waiving of defaults or accelerating portfolio loans. While the loan manager for OFS Capital WM is not required to follow our recommendations, if we make a recommendation with which the loan manager disagrees, the loan manager must at our direction commence a process to sell the applicable investment, subject to our right to control the negotiations for such sale and to suspend any such sales process.
Defaults by our portfolio companies will harm our operating results.
A portfolio company’s failure to satisfy financial or operating covenants imposed by us or other lenders could lead to defaults and, potentially, termination of its loans and foreclosure on its assets. This could trigger cross-defaults under other agreements and jeopardize such portfolio company’s ability to meet its obligations under the debt or equity securities that we hold. We may incur expenses to the extent necessary to seek recovery upon default or to negotiate new terms, which may include the waiver of certain financial covenants, with a defaulting portfolio company.
Our portfolio companies may incur debt that ranks equally with, or senior to, our investments in such companies.
We intend to invest a substantial portion of our capital in senior secured, unitranche, second-lien and mezzanine loans issued by our portfolio companies. The portfolio companies may be permitted to incur, other debt that ranks equally with, or senior to, the debt securities in which we invest. By their terms, such debt instruments may provide that the holders are entitled to receive payment of interest or principal on or before the dates on which we are entitled to receive payments in respect of the debt securities in which we invest. Also, in the event of insolvency, liquidation, dissolution, reorganization or bankruptcy of a portfolio company, holders of debt instruments ranking senior to our investment in that portfolio company would typically be entitled to receive payment in full before we receive any distribution in respect of our investment. After repaying senior creditors, the portfolio company may not have any remaining assets to use for repaying its obligation to us. In the case of debt ranking equally with debt securities in which we invest, we would have to share any distributions on an equal and ratable basis with other creditors holding such debt in the event of an insolvency, liquidation, dissolution, reorganization or bankruptcy of the relevant portfolio company.
Additionally, certain loans that we make to portfolio companies may be secured on a second-priority basis by the same collateral securing senior secured debt of such companies. The first-priority liens on the collateral will secure the portfolio company’s obligations under any outstanding senior debt and may secure certain other future debt that may be permitted to be incurred by the portfolio company under the agreements governing the loans. The holders of obligations secured by first-priority liens on the collateral will generally control the liquidation of, and be entitled to receive proceeds from, any realization of the collateral to repay their obligations in full before us. In addition, the value of the collateral in the event of liquidation will depend on market and economic conditions, the availability of buyers and other factors. There can be no assurance that the proceeds, if any, from sales of all of the collateral would be sufficient to satisfy the loan obligations secured by the second-priority liens after payment in full of all obligations secured by the first-priority liens on the collateral. If such proceeds were not sufficient to repay amounts outstanding under the loan obligations secured by the second- priority liens, then we, to the extent not repaid from the proceeds of the sale of the collateral, would only have an unsecured claim against the portfolio company’s remaining assets, if any.
61
Table of Contents
The rights we may have with respect to the collateral securing the loans we make to our portfolio companies with senior debt outstanding may also be limited pursuant to the terms of one or more intercreditor agreements that we enter into with the holders of such senior debt. Under a typical intercreditor agreement, at any time that obligations that have the benefit of the first-priority liens are outstanding, any of the following actions that may be taken in respect of the collateral will be at the direction of the holders of the obligations secured by the first-priority liens:
| • | the ability to cause the commencement of enforcement proceedings against the collateral; |
| • | the ability to control the conduct of such proceedings; |
| • | the approval of amendments to collateral documents; |
| • | releases of liens on the collateral; and |
| • | waivers of past defaults under collateral documents. |
We may not have the ability to control or direct such actions, even if our rights are adversely affected.
We may also make unsecured loans to portfolio companies, meaning that such loans will not benefit from any interest in collateral of such companies. Liens on such portfolio companies’ collateral, if any, will secure the portfolio company’s obligations under its outstanding secured debt and may secure certain future debt that is permitted to be incurred by the portfolio company under its secured loan agreements. The holders of obligations secured by such liens will generally control the liquidation of, and be entitled to receive proceeds from, any realization of such collateral to repay their obligations in full before us. In addition, the value of such collateral in the event of liquidation will depend on market and economic conditions, the availability of buyers and other factors. There can be no assurance that the proceeds, if any, from sales of such collateral would be sufficient to satisfy our unsecured loan obligations after payment in full of all secured loan obligations. If such proceeds were not sufficient to repay the outstanding secured loan obligations, then our unsecured claims would rank equally with the unpaid portion of such secured creditors’ claims against the portfolio company’s remaining assets, if any.
If we make subordinated investments, the obligors or the portfolio companies may not generate sufficient cash flow to service their debt obligations to us.
We may make subordinated investments that rank below other obligations of the obligor in right of payment. Subordinated investments are subject to greater risk of default than senior obligations as a result of adverse changes in the financial condition of the obligor or in general economic conditions. If we make a subordinated investment in a portfolio company, the portfolio company may be highly leveraged, and its relatively high debt-to-equity ratio may create increased risks that its operations might not generate sufficient cash flow to service all of its debt obligations.
The disposition of our investments may result in contingent liabilities.
We currently expect that a significant portion of our investments will involve private securities. In connection with the disposition of an investment in private securities, we may be required to make representations about the business and financial affairs of the portfolio company typical of those made in connection with the sale of a business. We may also be required to indemnify the purchasers of such investment to the extent that any such representations turn out to be inaccurate or with respect to potential liabilities. These arrangements may result in contingent liabilities that ultimately result in funding obligations that we must satisfy through our return of distributions previously made to us.
Our base management fee may induce OFS Advisor to cause us to incur leverage.
Our base management fee is payable based upon our total assets, other than cash and cash equivalents but including assets purchased with borrowed amounts and including assets owned by any consolidated entity. This
62
Table of Contents
fee structure may encourage OFS Advisor to cause us to borrow money to finance additional investments. Under certain circumstances, the use of borrowed money may increase the likelihood of default, which would disfavor holders of our common stock, including investors in the common stock offered by this annual report on Form 10-K. Given the subjective nature of the investment decisions made by OFS Advisor on our behalf, our board of directors may not be able to monitor this potential conflict of interest effectively.
Our incentive fee may induce OFS Advisor to make certain investments, including speculative investments.
The incentive fee payable by us to OFS Advisor may create an incentive for OFS Advisor to make investments on our behalf that are riskier or more speculative than would be the case in the absence of such compensation arrangement. The way in which the incentive fee payable to OFS Advisor is determined may encourage OFS Advisor to use leverage to increase the return on our investments. Under certain circumstances, the use of leverage may increase the likelihood of default, which would disfavor our stockholders.
OFS Advisor receives an incentive fee based, in part, upon net capital gains realized on our investments. Unlike that portion of the incentive fee based on income, there is no hurdle rate applicable to the portion of the incentive fee based on net capital gains. As a result, OFS Advisor may have a tendency to invest more capital in investments that are likely to result in capital gains as compared to income producing securities. Such a practice could result in our investing in more speculative securities than would otherwise be the case, which could result in higher investment losses, particularly during economic downturns.
We may invest, to the extent permitted by law, in the securities and instruments of other investment companies, including private funds, and, to the extent we so invest, will bear our ratable share of any such investment company’s expenses, including management and performance fees. We will also remain obligated to pay management and incentive fees to OFS Advisor with respect to the assets invested in the securities and instruments of other investment companies. With respect to each of these investments, each of our stockholders will bear his or her share of the management and incentive fee of OFS Advisor as well as indirectly bearing the management and performance fees and other expenses of any investment companies in which we invest. For example, by virtue of our investment in OFS Capital WM, our stockholders indirectly incur management fees payable to the loan manager of the OFS Capital WM portfolio.
Our board of directors is charged with protecting our interests by monitoring how OFS Advisor addresses these and other conflicts of interests associated with its management services and compensation. While our board of directors is not expected to review or approve each borrowing or incurrence of leverage, our independent directors will periodically review OFS Advisor’s services and fees. In connection with these reviews, our independent directors will consider whether our fees and expenses (including those related to leverage) remain appropriate.
OFS Advisor’s liability will be limited under the Investment Advisory Agreement, and we have agreed to indemnify OFS Advisor against certain liabilities, which may lead OFS Advisor to act in a riskier manner on our behalf than it would when acting for its own account.
Under the Investment Advisory Agreement, OFS Advisor will not assume any responsibility to us other than to render the services called for under that agreement, and it will not be responsible for any action of our board of directors in following or declining to follow OFS Advisor’s advice or recommendations. Under the terms of the Investment Advisory Agreement, OFS Advisor and its and its affiliates’ respective officers, directors, members, managers, stockholders and employees will not be liable to us, any subsidiary of ours, our directors, our stockholders or any subsidiary’s stockholders or partners for acts or omissions performed in accordance with and pursuant to the Investment Advisory Agreement, except those resulting from acts constituting gross negligence, willful misconduct, bad faith or reckless disregard of such person’s duties under the Investment Advisory Agreement. In addition, we have agreed to indemnify OFS Advisor and its and its affiliates’ respective officers, directors, members, managers, stockholders and employees from and against any claims or liabilities, including
63
Table of Contents
reasonable legal fees and other expenses reasonably incurred, arising out of or in connection with our business and operations or any action taken or omitted on our behalf pursuant to authority granted by the Investment Advisory Agreement, except where attributable to gross negligence, willful misconduct, bad faith or reckless disregard of such person’s duties under the Investment Advisory Agreement. These protections may lead OFS Advisor to act in a riskier manner when acting on our behalf than it would when acting for its own account.
We may be subject to additional risks if we engage in hedging transactions and/or invest in foreign securities.
The 1940 Act generally requires that 70% of our investments be in issuers each of whom is organized under the laws of, and has its principal place of business in, any state of the United States, the District of Columbia, Puerto Rico, the Virgin Islands or any other possession of the United States. Our investment strategy does not presently contemplate investments in securities of non-U.S. companies. We expect that these investments would focus on the same junior debt securities investments that we intend to make in U.S. middle-market companies and accordingly would be complementary to our overall strategy and enhance the diversity of our holdings. Investing in securities of emerging market issuers involves many risks, including economic, social, political, financial, tax and security conditions in the emerging market, potential inflationary economic environments, regulation by foreign governments, different accounting standards and political uncertainties. Economic, social, political, financial, tax and security conditions also could negatively affect the value of emerging market companies. These factors could include changes in the emerging market government’s economic and fiscal policies, the possible imposition of, or changes in, currency exchange laws or other laws or restrictions applicable to the emerging market companies or investments in their securities and the possibility of fluctuations in the rate of exchange between currencies.
Engaging in either hedging transactions or investing in foreign securities would entail additional risks to our stockholders. We could, for example, use instruments such as interest rate swaps, caps, collars and floors and, if we were to invest in foreign securities, we could use instruments such as forward contracts or currency options and borrow under a credit facility in currencies selected to minimize our foreign currency exposure. In each such case, we generally would seek to hedge against fluctuations of the relative values of our portfolio positions from changes in market interest rates or currency exchange rates. Hedging against a decline in the values of our portfolio positions would not eliminate the possibility of fluctuations in the values of such positions or prevent losses if the values of the positions declined. However, such hedging could establish other positions designed to gain from those same developments, thereby offsetting the decline in the value of such portfolio positions. Such hedging transactions could also limit the opportunity for gain if the values of the underlying portfolio positions increased. Moreover, it might not be possible to hedge against an exchange rate or interest rate fluctuation that was so generally anticipated that we would not be able to enter into a hedging transaction at an acceptable price.
While we may enter into such transactions to seek to reduce currency exchange rate and interest rate risks, unanticipated changes in currency exchange rates or interest rates could result in poorer overall investment performance than if we had not engaged in any such hedging transactions. In addition, the degree of correlation between price movements of the instruments used in a hedging strategy and price movements in the portfolio positions being hedged could vary. Moreover, for a variety of reasons, we might not seek to establish a perfect correlation between the hedging instruments and the portfolio holdings being hedged. Any such imperfect correlation could prevent us from achieving the intended hedge and expose us to risk of loss. In addition, it might not be possible to hedge fully or perfectly against currency fluctuations affecting the value of securities denominated in non-U.S. currencies because the value of those securities would likely fluctuate as a result of factors not related to currency fluctuations.
We may not realize gains from our equity investments.
When we invest in senior secured, unitranche, second-lien and mezzanine loans, we may acquire warrants or other equity securities of portfolio companies as well. We may also invest in equity securities directly. To the extent we hold equity investments, except as described below, we will attempt to dispose of them and realize
64
Table of Contents
gains upon our disposition of them. However, the equity interests we receive may not appreciate in value and may decline in value. As a result, we may not be able to realize gains from our equity interests, and any gains that we do realize on the disposition of any equity interests may not be sufficient to offset any other losses we experience. In the case of OFS Capital WM, our wholly-owned subsidiary, we will not receive direct benefits from the sale of assets in its portfolio. Rather, our return on our investment in such assets will depend on the ability of OFS Capital WM’s loan portfolio to generate cash flow in excess of payments required to be made to other parties under the terms of the OFS Capital WM Facility documentation and distribution of the excess to us.
Risks Related to Our Common Stock
There is a risk that shareholders may not receive distributions or that our distributions may not grow over time and a portion of our distributions may be a return of capital.
We intend to make distributions on a quarterly basis to our stockholders out of assets legally available for distribution. We cannot assure shareholders that we will achieve investment results that will allow us to make a specified level of cash distributions or year-to-year increases in cash distributions. Our ability to pay distributions might be adversely affected by the impact of one or more of the risk factors described in this annual report on Form 10-K. Due to the asset coverage test applicable to us under the 1940 Act as a BDC, we may be limited in our ability to make distributions.
The market price of our common stock may fluctuate significantly.
As with any stock, the market price of our common stock will fluctuate with market conditions and other factors. The market price and liquidity of the market for shares of our common stock may be significantly affected by numerous factors, some of which are beyond our control and may not be directly related to our operating performance. These factors include:
| • | significant volatility in the market price and trading volume of securities of business development companies or other companies in our sector, which is not necessarily related to the operating performance of these companies; |
| • | changes in regulatory policies or tax guidelines, particularly with respect to RICs, SBICs or business development companies; |
| • | failure to qualify for treatment as a RIC or loss of RIC or BDC status; |
| • | failure of Tamarix LP to maintain its status as an SBIC; |
| • | changes or perceived changes in earnings or variations in operating results; |
| • | changes or perceived changes in the value of our portfolio of investments; |
| • | changes in accounting guidelines governing valuation of our investments; |
| • | any shortfall in revenue or net income or any increase in losses from levels expected by investors or securities analysts; |
| • | departure of OFS Advisor’s, OFSC’s or any of their affiliates’ key personnel; |
| • | operating performance of companies comparable to us; |
| • | general economic trends and other external factors; and |
| • | loss of a major funding source. |
Our common stock may trade below its net asset value per share, which limits our ability to raise additional equity capital.
If our common stock is trading below its net asset value per share, we will generally not be able to issue additional shares of our common stock at its market price without first obtaining the approval for such issuance
65
Table of Contents
from our stockholders and our independent directors. Shares of BDCs, including shares of our common stock, have traded at discounts to their net asset values. As of December 31, 2012, our net asset value per share was $14.80. The daily average closing price of our shares on The Nasdaq Global Market for the period November 8, 2012, the day our stock started trading, through December 31, 2012 was $13.69. If our common stock trades below net asset value, the higher the cost of equity capital may result in it being unattractive to raise new equity, which may limit our ability to grow. The risk of trading below net asset value is separate and distinct from the risk that our net asset value per share may decline. We cannot predict whether shares of our common stock will trade above, at or below our net asset value.
| Item 1B. | Unresolved Staff Comments |
Not applicable.
| Item 2. | Properties |
We do not own any real estate or other physical properties materially important to our operation. Our headquarters are currently located at 2850 West Golf Road, 5th Floor, Rolling Meadows, Illinois 60008. OFS Capital Services, LLC, or OFS Services, furnishes us office space and we reimburse it for such costs on an allocated basis.
| Item 3. | Legal Proceedings |
We, OFS Advisor and OFS Services, are not currently subject to any material pending legal proceedings threatened against us as of December 31, 2012. From time to time, we may be a party to certain legal proceedings incidental to the normal course of our business including the enforcement of our rights under contracts with our portfolio companies. While the outcome of these legal proceedings cannot be predicted with certainty, we do not expect that these proceedings will have a material effect upon our business, financial condition or results of operations.
| Item 4. | Mine Safety Disclosures |
Not applicable.
66
Table of Contents
| Item 5. | Market for Registrant’s Common Equity, Related Stockholder Matters and Issuer Purchases of Equity Securities |
Our common stock is traded on The Nasdaq Global Market under the symbol “OFS.” The following table sets forth the range of high and low sales prices of our common stock as reported on the The Nasdaq Global Market and our net asset value per share as determined as of the last day of each quarter since our common stock began trading on the The Nasdaq Global Market on November 8, 2012:
| Sales Price | Premium or Discount of High Sales Price to NAV (2) |
Premium or Discount of Low Sales Price to NAV (2) |
Declared Dividends (3) |
|||||||||||||||||||||
| NAV(1) | High | Low | ||||||||||||||||||||||
| Fiscal 2012 |
||||||||||||||||||||||||
| Fourth Quarter (4) |
$ | 14.80 | $ | 14.37 | $ | 12.88 | 97 | % | 87 | % | $ | 0.17 | ||||||||||||
| (1) | Net asset value per share is determined as of the last day in the relevant quarter and therefore may not reflect the net asset value per share on the date of the high and low sales prices. The net asset values shown are based on outstanding shares at the end of each period. |
| (2) | Calculated as of the respective high or low sales price divided by the quarter end NAV. |
| (3) | Represents the dividend declared in the specified quarter, which, if prorated for the number of days remaining in the fourth quarter after our IPO in November 2012, would be $0.34 per share. |
| (4) | Period from November 8, 2012 through December 31, 2012 (excludes IPO price of $15.00). |
The last reported sale price for our common stock on the The Nasdaq Global Market on March 22, 2013 was $14.22 per share. As of March 22, 2013, there was one holder of record of the common stock which did not include shareholders for whom shares are held in “nominee” or “street name.”
Sales of Unregistered Securities
As part of the BDC Conversion, OFSAM was issued an aggregate of 2,912,024 shares of common stock in OFS Capital Corporation in exchange for its limited liability company interest in OFS Capital, LLC at an average estimated equivalent price of $19.14 per share. These shares are not registered and, as a result, are restricted securities under the meaning of Rule 144 promulgated under the Securities Act and may not be sold in the absence of registration under the Securities Act of 1933, as amended, unless an exemption from registration is available, including exemptions contained in Rule 144.
Issuer Purchases of Equity Securities
For the year ended December 31, 2012, we did not purchase any shares of our common stock in the open market.
67
Table of Contents
Performance Graph
This graph compares the return on our common stock with that of the Standard & Poor’s 500 Stock Index and the Russell 2000 Index, for the period from November 8, 2012, the date our common stock began trading on the Nasdaq Global Market, through December 31, 2012. The graph assumes that, on November 8, 2012, a person invested $100 in each of our common stock, the Standard & Poor’s 500 Stock Index and the Russell 2000 Financial Services Index. The graph measures total shareholder return, which takes into account changes in stock price.
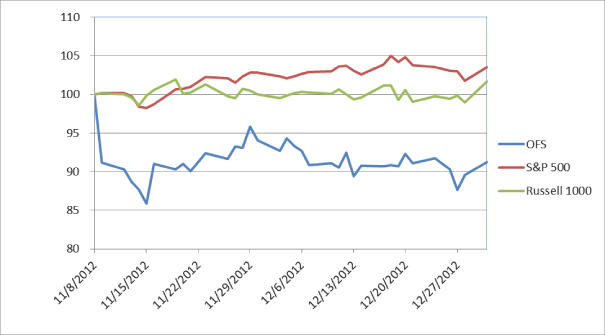
| * | This performance graph does not reflect the dividend we paid to our shareholders on January 31, 2013. |
The graph and other information furnished under this Part II Item 5 of this Form 10-K shall not be deemed to be “soliciting material” or to be “filed” with the SEC or subject to Regulation 14A or 14C, or to the liabilities of Section 18 of the Securities Exchange Act of 1934, as amended. The stock price performance included in the above graph is not necessarily indicative of future stock price performance.
Dividends
We intend to qualify to be taxed as a RIC under the Code. Generally, a RIC is entitled to deduct dividends it pays to its shareholders from its income to determine “taxable income.” Taxable income includes our taxable interest, dividend and fee income, as well as taxable net capital gains. Taxable income generally differs from net income for financial reporting purposes due to temporary and permanent differences in the recognition of income and expenses, and generally excludes net unrealized appreciation or depreciation, as gains or losses are not included in taxable income until they are realized. In addition, gains realized for financial reporting purposes may differ from gains included in taxable income as a result of our election to recognize gains using installment sale treatment, which generally results in the deferment of gains for tax purposes until notes or other amounts, including amounts held in escrow, received as consideration from the sale of investments are collected in cash. Taxable income includes non-cash income, such as changes in accrued and reinvested interest and dividends, which includes contractual payment-in-kind interest, and the amortization of discounts and fees. Cash collections
68
Table of Contents
of income resulting from contractual PIK interest or the amortization of discounts and fees generally occur upon the repayment of the loans or debt securities that include such items. Non-cash taxable income is reduced by non-cash expenses, such as realized losses and depreciation and amortization expense.
Our board of directors will maintain a variable dividend policy with the objective of distributing four quarterly distributions in an amount that approximates 90-100% of our taxable quarterly income or potential annual income for a particular year. In addition, at the end of the year, we may also pay an additional special dividend, or fifth dividend, such that we may distribute approximately all of our annual taxable income in the year it was earned, while maintaining the option to spill over our excess taxable income.
We intend to distribute quarterly dividends to our stockholders. In order to avoid certain excise taxes imposed on RICs, we currently intend to distribute during each calendar year an amount at least equal to the sum of (1) 98% of our ordinary income for the calendar year, (2) 98.2% of our capital gains in excess of capital losses for the one year period ending on October 31 of the calendar year, and (3) any ordinary income and net capital gains for the preceding year that were not distributed during such year. We will not be subject to excise taxes on amounts on which we are required to pay corporate income tax (such as retained net capital gains). In order to obtain the tax benefits applicable to RICs, we will be required to distribute to our stockholders with respect to each taxable year at least 90% of our ordinary income and realized net short-term capital gains in excess of realized net long-term capital losses.
On November 26, 2012, we announced that we had declared an initial dividend of $0.34 per share for the quarter ending December 31, 2012 (which amount was to be proportionately reduced to reflect the number of days remaining in such quarter after the completion of our IPO), payable on January 31, 2013 to stockholders of record as of the close of business on January 17, 2013. Based on the November 14, 2012 closing of our IPO, stockholders of record on January 17, 2013 received a dividend of $0.17 per share in respect of the quarter ending December 31, 2012.
Distributions in excess of our current and accumulated earnings and profits generally will be treated first as a return of capital to the extent of the stockholder’s tax basis, and any remaining distributions would be treated as a capital gain. The determination of the tax attributes of our distributions is made annually as of the end of our fiscal year based upon our taxable income for the full year and distributions paid for the full year; therefore, a determination made on a quarterly basis may not be representative of the tax attributes of our annual distributions to stockholders. For the period November 8, 2012 through December 31, 2012, out of our approximately $1.6 million dividend distribution, approximately 98% represented ordinary income and 2% represented a return of capital.
Each year a statement on Form 1099-DIV identifying the source of the distribution (i.e., paid from ordinary income, paid from net capital gains on the sale of securities, and/or a return of paid-in-capital surplus which is a nontaxable distribution) is mailed to our U.S. stockholders. To the extent our taxable earnings fall below the total amount of our distributions for that fiscal year, a portion of those distributions may be deemed a tax return of capital to our stockholders.
We can offer no assurance that we will achieve results that will permit the payment of any cash distributions and, if we issue senior securities, we will be prohibited from making distributions if doing so causes us to fail to maintain the asset coverage ratios stipulated by the 1940 Act or if distributions are limited by the terms of any of our borrowings.
We maintain an “opt-out” dividend reinvestment plan for our common stockholders. As a result, if we declare a dividend, cash dividends will be automatically reinvested in additional shares of our common stock unless the stockholder specifically “opts out” of the dividend reinvestment plan and chooses to receive cash dividends.
69
Table of Contents
The following table lists the cash distributions, including dividends and returns of capital, if any, per share that we have declared since completion of our IPO. The table is divided by fiscal year according to record date.
| Date Declared |
Record Date |
Payment Date |
Amount | |||||
| Fiscal 2012 |
||||||||
| November 26, 2012 |
January 17, 2013 | January 31, 2013 | $ | 0.17 | (1) | |||
| Fiscal 2013 |
||||||||
| March 26, 2013 |
April 17, 2013 | April 30, 2013 | $ | 0.34 | ||||
| (1) | Represents the dividend declared in the specified quarter, which, if prorated for the number of days remaining in the fourth quarter after our IPO in November 2012, would be $0.34 per share. |
70
Table of Contents
| Item 6. | Selected Consolidated Financial Data |
The following selected financial and other data for the period from November 8, 2012 to December 31, 2012, the period January 1, 2012 through November 7, 2012, and the years ended December 31, 2011 and 2010 are derived from our consolidated financial statements that have been audited by McGladrey LLP, our independent auditors. The data should be read in conjunction with our consolidated financial statements and notes thereto and “Management’s Discussion and Analysis of Financial Condition and Results of Operations,” which are included in this annual report on Form 10-K.
| Post-IPO as a Business Development Company |
Pre-IPO Prior to becoming a Business Development Company |
|||||||||||||||||||
| For the Period November 8, 2012 through December 31, 2012 |
For the Period January 1, 2012 through November 7, 2012 |
For the Year Ended December 31, 2012 (1) |
For the Year Ended December 31, 2011 |
For the Year Ended December 31, 2010 |
||||||||||||||||
| (Dollar amounts in thousands, except per share data) | ||||||||||||||||||||
| Statement of Operations Data: |
||||||||||||||||||||
| Total investment income |
$ | 2,593 | $ | 10,839 | $ | 13,432 | $ | 1,772 | $ | 10,438 | ||||||||||
| Total expenses |
1,932 | 7,405 | 9,337 | 2,635 | 7,466 | |||||||||||||||
| Net investment income (expenses) |
661 | 3,434 | 4,095 | (863 | ) | 2,972 | ||||||||||||||
| Net realized loss on non-affiliate investments |
— | (1,112 | ) | (1,112 | ) | — | — | |||||||||||||
| Net change in unrealized appreciation (depreciation) on non-affiliate investments |
(222 | ) | 161 | (61 | ) | (156 | ) | 19 | ||||||||||||
| Net change in unrealized depreciation on affiliate investments |
(41 | ) | — | (41 | ) | — | — | |||||||||||||
| Other income (loss) prior to becoming a business development company |
— | 3,113 | 3,113 | (1,168 | ) | 2,248 | ||||||||||||||
| Cumulative effect of accounting change |
(348 | ) | 570 | 222 | — | — | ||||||||||||||
| Extraordinary gain (loss) |
873 | (873 | ) | — | — | — | ||||||||||||||
| Net increase (decrease) in net assets resulting from operations |
923 | 5,293 | 6,216 | (2,187 | ) | 5,239 | ||||||||||||||
| Per share data: |
||||||||||||||||||||
| Net asset value |
$ | 14.80 | N/A | N/A | N/A | N/A | ||||||||||||||
| Net investment income |
0.07 | N/A | N/A | N/A | N/A | |||||||||||||||
| Net realized loss on non-affiliate investments |
— | N/A | N/A | N/A | N/A | |||||||||||||||
| Net change in unrealized appreciation (depreciation) on non-affiliate investments |
(0.02 | ) | N/A | N/A | N/A | N/A | ||||||||||||||
| Net change in unrealized depreciation on affiliate investments |
— | N/A | N/A | N/A | N/A | |||||||||||||||
| Per share dividends declared |
0.17 | N/A | N/A | N/A | N/A | |||||||||||||||
| Balance sheet data at period end: |
||||||||||||||||||||
| Investments, at fair value/book value |
$ | 232,199 | N/A | $ | 232,199 | $ | 59,379 | $ | 150,477 | |||||||||||
| Cash and cash equivalents |
8,270 | N/A | 8,270 | 814 | 942 | |||||||||||||||
| Restricted cash and cash equivalents |
623 | N/A | 623 | — | — | |||||||||||||||
| Other assets |
4,457 | N/A | 4,457 | 4,721 | 2,651 | |||||||||||||||
| Total assets |
245,549 | N/A | 245,549 | 64,914 | 154,070 | |||||||||||||||
| Total liabilities |
103,750 | N/A | 103,750 | 10,195 | 84,548 | |||||||||||||||
| Total net assets/member’s equity |
141,799 | N/A | 141,799 | 54,719 | 69,522 | |||||||||||||||
| Other data (unaudited): |
||||||||||||||||||||
| Weighted average annualized yield on income producing investments at fair value (2) |
N/A | N/A | 7.64 | % | 8.41 | % | 7.56 | % | ||||||||||||
| Number of portfolio companies at period end (3) |
59 | N/A | 59 | 51 | 38 | |||||||||||||||
71
Table of Contents
| (1) | The consolidated statement of operations for the year ended December 31, 2012 included the Company’s Pre-IPO and Post-IPO operations during 2012. |
| (2) | Weighted average annualized yield on income producing investments at fair value for the year ended December 31, 2011 and 2010 gives pro forma effect to OFS Capital’s consolidation of OFS Capital WM as a result of the WM 2012 Credit Facility Amendments, as if the consolidation took place at December 31, 2011 and 2010, respectively. Weighted average annualized yield on income producing investments at fair value for the year ended December 31, 2010 also gives effect to the sale accounting adjustment related to OFS Capital’s sale of its loan portfolio to OFS Capital WM on September 28, 2010, as if the accounting adjustment took place at December 31, 2010. |
| (3) | The number of portfolio companies at December 31, 2011 and 2010 gives pro forma effect to OFS Capital’s consolidation of OFS Capital WM as a result of the WM 2012 Credit Facility Amendments, as if the consolidation took place at December 31, 2011 and 2010, respectively. |
72
Table of Contents
| Item 7. | Management’s Discussion and Analysis of Financial Condition and Results of Operations |
Forward-Looking Statements
This annual report on Form 10-K contains forward-looking statements that involve substantial risks and uncertainties. These forward-looking statements are not historical facts, but rather are based on current expectations, estimates and projections about us, our current and prospective portfolio investments, our industry, our beliefs, and our assumptions. Words such as “anticipates,” “expects,” “intends,” “plans,” “believes,” “seeks,” “estimates,” “would,” “should,” “targets,” “projects,” and variations of these words and similar expressions are intended to identify forward-looking statements. These statements are not guarantees of future performance and are subject to risks, uncertainties, and other factors, some of which are beyond our control and difficult to predict and could cause actual results to differ materially from those expressed or forecasted in the forward-looking statements, including without limitation:
| • | our inexperience operating a BDC or an SBIC, or qualifying as a RIC; |
| • | our dependence on key personnel; |
| • | our ability to maintain or develop referral relationships; |
| • | the administration of OFS Capital WM’s portfolio by an unaffiliated loan manager; |
| • | management of the day-to-day operations of Tamarix LP and its portfolio investments by its manager, which we do not control; |
| • | our ability to replicate historical results; |
| • | the ability of OFS Advisor to identify, invest in and monitor companies that meet our investment criteria; |
| • | actual and potential conflicts of interest with OFS Advisor and other affiliates of OFSAM; |
| • | constraint on investment due to access to material nonpublic information; |
| • | restrictions on our ability to enter into transactions with our affiliates; |
| • | our ability to obtain the necessary approvals of the SBA in connection with our proposed acquisition of the ownership interests in Tamarix LP and Tamarix GP that we do not already own; |
| • | our receipt of exemptive relief from the SEC to permit us to exclude the debt of Tamarix LP from our asset coverage test; |
| • | limitations on the amount of SBA-guaranteed debentures that may be issued by an SBIC; |
| • | Tamarix LP’s ability to comply with SBA regulations and requirements; |
| • | the use of borrowed money to finance a portion of our investments; |
| • | competition for investment opportunities; |
| • | our ability to qualify and maintain our qualification as a RIC and as a BDC; |
| • | the ability of Tamarix LP, OFS Capital WM and any other portfolio companies to make distributions enabling us to meet RIC requirements; |
| • | our ability to raise capital as a BDC; |
| • | the timing, form and amount of any distributions from our portfolio companies; |
| • | the impact of a protracted decline in the liquidity of credit markets on our business; |
| • | the general economy and its impact on the industries in which we invest; |
| • | uncertain valuations of our portfolio investments; and |
| • | the effect of new or modified laws or regulations governing our operations. |
73
Table of Contents
Although we believe that the assumptions on which these forward-looking statements are based are reasonable, any of those assumptions could prove to be inaccurate, and as a result, the forward-looking statements based on those assumptions also could be inaccurate. In light of these and other uncertainties, the inclusion of a projection or forward-looking statement in this annual report on Form 10-K should not be regarded as a representation by us that our plans and objectives will be achieved. These risks and uncertainties include, among others, those described or identified in “Item 1A. Risk Factors” in this annual report on Form 10-K. You should not place undue reliance on these forward-looking statements, which apply only as of the date of this annual report on Form 10-K.
We have based the forward-looking statements on information available to us on the date of this annual report on Form 10-K. Except as required by the federal securities laws, we undertake no obligation to revise or update any forward-looking statements, whether as a result of new information, future events or otherwise. You are advised to consult any additional disclosures that we may make directly to you or through reports that we in the future may file with the SEC, including annual reports on Form 10-K, quarterly reports on Form 10-Q and current reports on Form 8-K. The forward-looking statements and projections contained in this annual report on Form 10-K are excluded from the safe harbor protection provided by Section 27A of the Securities Act of 1933, as amended, and Section 21E of the Securities Exchange Act of 1934, as amended.
The following analysis of our financial condition and results of operations should be read in conjunction with our consolidated financial statements and the related notes thereto contained elsewhere in this annual report on Form 10-K.
Overview
We are an externally managed, closed-end, non-diversified management investment company formed in March 2001. Our investment objective is to provide our stockholders with both current income and capital appreciation primarily through debt investments and, to a lesser extent, equity investments. We intend to pursue an investment strategy focused primarily on investments in middle-market companies in the United States.
In connection with our IPO, on November 7, 2012, we converted from a limited liability company to a corporation, as a result of which the sole membership interest held by OFSAM prior to the conversion was exchanged for 2,912,024 shares of our common stock. In connection with our IPO, we elected to be treated as a BDC under the1940 Act. On November 14, 2012, we completed our IPO selling 6,666,667 shares of our common stock at a public offering price of $15 per share, raising $100 million in gross proceeds. We incurred approximately $6.2 million of sales load and $5.8 million of offering related costs in connection with our IPO. We utilized approximately $90 million of our IPO proceeds to pay down the OFS Capital WM Facility. The OFS Capital WM Facility indebtedness repaid included approximately $48.0 million of Class A loans and approximately $42.0 million of Class B loans.
Although we will continue to focus on investments in senior secured loans, we also intend to expand into additional asset classes in which OFS Advisor’s investment professionals have expertise, including investments in unitranche, second-lien and mezzanine loans and, to a lesser extent, warrants and other minority equity securities. Initially, we expect that our senior secured loan investments will principally be made through on-balance sheet special purpose vehicles, while our unitranche, second lien and mezzanine loans will be made by us directly or by Tamarix LP. We expect our investments in the equity securities of these companies, such as warrants, preferred stock, common stock and other equity interests, will principally be made in conjunction with our debt investments, although we currently anticipate that no more than 5% of our portfolio will consist of equity investments in middle-market companies that do not pay a regular dividend. Generally, we do not expect to make investments in companies or securities that OFS Advisor determines to be distressed investments (such as discounted debt instruments that have either experienced a default or have a significant potential for default), other than follow-on investments in portfolio companies of ours.
74
Table of Contents
A substantial portion of our business will focus on the direct origination and sourcing of investments through portfolio companies or their financial sponsors or other owners or intermediaries. We expect our middle-market investments to range generally from $5 million to $25 million each, although we expect that this investment size will vary proportionately with the size of our capital base.
Our investment activities are managed by OFS Advisor and supervised by our board of directors, a majority of whom are independent of us, OFS Advisor and its affiliates. Under our Investment Advisory Agreement, we have agreed to pay OFS Advisor an annual base management fee based on the average value of total assets (other than cash and cash equivalents but including assets purchased with borrowed amounts and including assets owned by any consolidated entity), as well as an incentive fee based on our investment performance. We have also entered into an Administration Agreement with OFS Services. Under our Administration Agreement, we have agreed to reimburse OFS Services for our allocable portion (subject to the review and approval of our independent directors) of overhead and other expenses incurred by OFS Services in performing its obligations under the Administration Agreement.
As a BDC, we must not acquire any assets other than “qualifying assets” specified in the 1940 Act unless, at the time the acquisition is made, at least 70% of our total assets are qualifying assets (with certain limited exceptions). Qualifying assets include investments in “eligible portfolio companies.” Under the relevant SEC rules, the term “eligible portfolio company” includes all private companies, companies whose securities are not listed on a national securities exchange, and certain public companies that have listed their securities on a national securities exchange and have a market capitalization of less than $250 million, in each case organized in the United States.
We intend to elect to be treated for tax purposes as a regulated investment company, or RIC, under Subchapter M of the Internal Revenue Code of 1986, or the Code. To qualify as a RIC, we must, among other things, meet certain source-of-income and assets diversification requirements. Pursuant to these elections, we generally will not have to pay corporate-level taxes on any income we distribute to our shareholders.
As of December 31, 2012, our net asset value was approximately $141.8 million, or approximately $14.80 per share, and our portfolio included debt investments in 58 portfolio companies as well as our equity investment in Tamarix LP. As of December 31, 2012, our investment portfolio consisted of outstanding loans of approximately $234.6 million in aggregate principal amount, all of which were senior secured loans, as well as equity investments of approximately $4.7 million at fair value.
Outlook on Market Conditions
Since the beginning of the credit crisis in 2007, global capital markets have experienced periods of disruption, as evidenced by a lack of liquidity in the debt capital markets, write-offs in the financial services sector, re-pricing of credit risk and failure of certain major financial institutions. Despite actions of the United States federal government and foreign governments, these events have contributed to worsening general economic conditions that have materially and adversely impacted the broader financial and credit markets and reduced the availability of debt and equity capital for the market as a whole and financial services firms in particular. While indicators suggest improvement in capital markets, these conditions could deteriorate in the future. During such market disruptions, we may have difficulty raising debt or equity capital especially as a result of certain regulatory constraints.
At the same time, the capital markets for the companies in which we invest have shown signs of increased investment activity in 2012 and 2013, as compared to prior years. Therefore, to the extent we have capital available, we believe this is an opportune time to invest in the lending market for such companies. Today’s economy creates potentially attractive new lending opportunities, and we believe that the market for such companies improving, as evidenced by the improved initial public offering market in 2012 as compared to previous years.
75
Table of Contents
Recent Developments and Other Factors Affecting Comparability
BDC Conversion. On November 7, 2012, OFS Capital, LLC converted into a Delaware corporation, OFS Capital Corporation, and the outstanding limited liability company interest in OFS Capital, LLC was converted into 2,912,024 shares of common stock in OFS Capital Corporation. As part of the BDC Conversion, OFSAM was issued an aggregate of 2,912,024 shares of common stock in OFS Capital Corporation in exchange for its limited liability company interest in OFS Capital, LLC at an average estimated equivalent price of $19.14 per share. Upon completion of our IPO and through December 31, 2012, OFSAM owned an interest of 30.4% in us. See Note 2 in our December 31, 2012 consolidated financial statements for more information regarding the cumulative effect of our BDC election.
Tamarix Transactions. Prior to May 10, 2012, we were deemed to be the primary beneficiary of Tamarix LP and, therefore, in accordance with ASC Topic 810, the financial statements of Tamarix LP were consolidated with ours. On May 10, 2012, as a result of Tamarix LP’s receipt of an SBIC license, we became a 68.4% limited partner in Tamarix LP and were deemed, under the applicable accounting literature, to continue to hold a controlling financial interest in Tamarix LP, as described more fully in our financial statements. Accordingly, we continued to consolidate the financial statements of Tamarix LP with ours at June 30, 2012. On July 27, 2012, however, Tamarix LP repaid its loans together with accrued interest due to us in aggregate amount of approximately $16.6 million, and the three investment professionals of Tamarix GP resigned from our affiliated entity. As a result, effective as of July 27, 2012, we deconsolidated Tamarix LP’s financial statements from our own, and began accounting for our investment in Tamarix LP under the equity method of accounting. As of December 31, 2012, the investment portfolio held by Tamarix LP consisted of outstanding loans of approximately $18.2 million in aggregate principal amount and equity investments of approximately $2.6 million at fair value. It is our intention to seek to acquire all of the limited partnership interests in Tamarix LP and all of the ownership interests in Tamarix GP that are currently owned or subscribed for by other persons. These acquisitions would require further approval from the SBA. We cannot assure shareholders that the SBA would grant that further approval or that the holders of those ownership interests would agree to sell them to us. In the event that the SBA does not grant the necessary further approval, or the holders of those ownership interests do not agree to transfer them to us, we would still benefit from our significant economic interest in Tamarix LP—currently we have subscribed for $24.9 million out of a total of $36.9 million committed and partially funded commitments in Tamarix LP (giving us 67.5% of the limited partnership interests) and have a non-controlling interest in Tamarix GP—as well as our strong relationship with the investment professionals on the investment committee of Tamarix GP. If we are successful in acquiring all of the limited partnership interests in Tamarix LP and all of the ownership interests in Tamarix GP that are currently owned or subscribed for by other persons, we would once again consolidate Tamarix LP’s financial statements into our financial statements.
WM 2012 Credit Facility Amendments. Prior to the WM 2012 Credit Facility Amendments completed in March 2012, under generally accepted accounting principles, we did not consolidate OFS Capital WM’s financial statements into our financial statements. Following the OFS Capital WM Transaction, we determined in accordance with ASC Topic 810 that, despite owning 100% of the equity interests of OFS Capital WM, the loan manager, Madison Capital, was the primary beneficiary of OFS Capital WM because it (a) had the sole authority to service, administer and exercise rights and remedies in respect of the assets in OFS Capital WM’s portfolio, (b) had the sole authority to determine whether to cause assets to be sold or acquired by OFS Capital WM (subject in limited circumstances to our consent rights as the administrative manager), and (c) received a fee for its services in addition to holding Class B loans of OFS Capital WM, as described elsewhere in this annual report on Form 10-K. In light of these considerations, prior to March 30, 2012, we recorded our equity interest in OFS Capital WM in our financial statements but did not consolidate its financial statements with our own.
As a result of the WM 2012 Credit Facility Amendments, OFS Capital succeeded Madison Capital to the controlling financial interest in OFS Capital WM. In light of this and other factors, we have consolidated the financial statements of OFS Capital WM into our financial statements as of March 30, 2012. The WM 2012 Credit Facility Amendments were entered into in light of OFS Capital WM having made investments which utilize the
76
Table of Contents
substantial majority of its borrowing capacity under the OFS Capital WM Facility. Accordingly, it was determined that the management of an existing portfolio of investment assets, as opposed to buying and originating activities, would constitute the activities that most significantly impact OFS Capital WM’s economic performance.
OFS Capital WM Transaction and OFSAM Cash Contribution. In September of 2010, we established OFS Capital WM, an entity that acquires, manages and finances senior secured loan investments to middle-market companies in the United States. To finance its business, at the OFS Capital WM Closing, OFS Capital WM entered into the OFS Capital WM Facility with Wells Fargo and Madison Capital, which is secured by the eligible loan assets or participations therein acquired by OFS Capital WM from us at the OFS Capital WM Closing and eligible loan assets thereafter acquired by OFS Capital WM during its reinvestment period. Subject to limited exceptions, our sale of eligible loan assets or participations therein to OFS Capital WM is without recourse to us, and we will have no liability for the debt or other obligations of OFS Capital WM. In connection with the closing of the OFS Capital WM Facility, the lenders received customary opinions of counsel generally to the effect that the sale of assets by us to OFS Capital WM on September 28, 2010 would be considered a true sale of those assets, and not a secured loan, and that in the event of our bankruptcy it would not be proper to ignore the separate existence of OFS Capital WM and substantively consolidate the assets and liabilities of OFS Capital WM with our own.
At the OFS Capital WM Closing, we sold approximately $96.9 million of loans or participations therein, transferred to us by OFS Funding, to OFS Capital WM in exchange for all the equity interests in OFS Capital WM and the OFS Capital WM Cash Consideration. The “OFS Capital WM Cash Consideration” refers to the cash received by us from OFS Capital WM in the OFS Capital WM Transaction, which we transferred to OFS Funding, and which OFS Funding used to repay a substantial portion of the outstanding balance under the Old Credit Facility. We also transferred the OFSAM Cash Contribution, made by our parent to us simultaneously with the OFS Capital WM Closing, to OFS Funding, and OFS Funding used the OFSAM Cash Contribution, together with cash on hand, to pay off the remaining balance under the Old Credit Facility in full (the “OFSAM Cash Contribution”).
We entered into the OFS Capital WM Transaction, in part, because OFS Capital WM would be able to increase the rate of return on the senior secured assets sold to OFS Capital WM as a result of the more favorable financing terms under the OFS Capital WM Facility, as compared to the Old Credit Facility. We will continue to benefit from the loan assets sold to and still held by OFS Capital WM by virtue of our ownership of 100% of the equity interests in OFS Capital WM. Based on the cost of capital and the yield on the underlying assets, we have experienced positive cash flow on a quarterly basis from our investment in OFS Capital WM and we expect to continue to do so for the life of the OFS Capital WM Facility. Since the OFS Capital WM Closing, OFS Capital WM has made investments in 71 companies in 49 different industry categories.
As a result of certain provisions of the loan documentation for the OFS Capital WM Transaction, we were required to account for that transaction in our financial statements as a secured borrowing as of December 31, 2010, which resulted in our retaining the loans we transferred to OFS Capital WM on our balance sheet as of December 31, 2010 and recording a corresponding payable due to OFS Capital WM. On February 23, 2011, we amended the loan documentation to remove those provisions, pursuant to which amendments we accounted for the OFS Capital WM Transaction as a sale of assets by us to OFS Capital WM (“Sale Accounting Adjustment”). Upon effectiveness of the February 23, 2011 amendments to the loan documentation, under the Sale Accounting Adjustments, the loans retained on our December 31, 2010 balance sheet were removed, the payable due to OFS Capital WM was eliminated, and we booked a loss from the sale of assets in the amount of approximately $0.9 million. For more information on these transactions, see our December 31, 2012 Consolidated Financial Statements included under Item 8 of this Annual Report on Form 10-K.
2010 Distribution. Concurrently with the OFS Capital WM Transaction, OFS Funding distributed to us and we in turn distributed to OFSAM certain investments totaling approximately $68.7 million in certain portfolio companies. We refer to these actions collectively as the “2010 Distribution.” We determined to make these distributions to eliminate certain potential conflicts of interest that might arise due to the fact that we and an affiliated fund both had investments in these portfolio companies.
77
Table of Contents
Critical Accounting Policies
The preparation of financial statements and related disclosures in conformity with generally accepted accounting principles in the United States requires management to make estimates and assumptions that affect the reported amounts of assets and liabilities, disclosure of contingent assets and liabilities at the date of the financial statements, and revenues and expenses during the periods reported. Actual results could materially differ from those estimates. We have identified the following items as critical accounting policies:
Valuation of Portfolio Investments.
The most significant estimate inherent in the preparation of our consolidated financial statements is the valuation of investments and the related amounts of unrealized appreciation and depreciation of investments recorded.
Our investments are carried at fair value in accordance with the 1940 Act and Accounting Standards Codification (“ASC”) topic 820 Fair Value Measurements and Disclosures (ASC Topic 820). At December 31, 2012, approximately 95% of the Company’s total assets represented investments in portfolio companies that are valued at fair value by the Board of Directors. Value, as defined in Section 2(a)(41) of the 1940 Act, is (i) the market price for those securities for which a market quotation is readily available and (ii) for all other securities and assets, fair value is as determined in good faith by the Board of Directors. Our debt securities are primarily invested in middle market companies whose securities are not publicly traded. Our investments in these portfolio companies are generally considered Level 3 assets under ASC Topic 820 because the inputs used to value the investments are generally unobservable. As such, we value substantially all of our investments at fair value as determined in good faith by our Board of Directors pursuant to a consistent valuation policy in accordance with the provisions of ASC Topic 820 and the 1940 Act. Due to the inherent uncertainty in determining the fair value of investments that do not have a readily available market value, the fair value of our investments determined in good faith by our Board may differ significantly from the value that would have been used had a readily available market existed for such investments, and the differences could be material.
Our policies relating to the valuation of our portfolio investments are as follows:
Investments for which sufficient market quotations are readily available will be valued at such market quotations. We may also obtain indicative prices with respect to certain of our investments from pricing services or brokers or dealers in order to value such investments. We expect that there will not be a readily available market value for many of our investments; those debt and equity securities that are not publicly traded or whose market prices are not readily available are valued at fair value as determined in good faith by the board of directors. We expect to value such investments at fair value as determined in good faith by our board of directors using a documented valuation policy and a consistently applied valuation process. We expect that our valuation of each of our assets for which sufficient market quotations are not readily available will be reviewed by one or more independent third-party valuation firms at least once every 12 months.
Our board of directors is ultimately and solely responsible for determining the fair value of the portfolio investments that are not publicly traded, whose market prices are not readily available on a quarterly basis or any other situation where portfolio investments require a fair value determination.
With respect to investments for which sufficient market quotations are not readily available or for which no or an insufficient number of indicative prices from pricing services or brokers or dealers have been received, our board of directors will undertake, on a quarterly basis, unless otherwise noted, a multi-step valuation process, as described below:
| • | For each such investment, a basic credit rating review process will be completed. The risk rating on every credit facility will be reviewed and either reaffirmed or revised by the investment committee. This process will establish base information for the quarterly valuation process. |
| • | Each portfolio company or investment will be valued by an investment professional. |
78
Table of Contents
| • | Preliminary valuation conclusions will then be documented and discussed with individual members of the investment committee. |
| • | The preliminary valuations will then be submitted to the investment committee for ratification. |
| • | Third-party valuation firm(s) will be engaged to provide valuation services as requested, by reviewing the investment committee’s preliminary valuations. The investment committee’s preliminary fair value conclusions on each of our assets, for which sufficient market quotations are not readily available will be reviewed and assessed by a third-party valuation firm at least once in every 12-month period, and more often as determined by our board of directors or required by our valuation policy. Such valuation assessment may be in the form of positive assurance, range of values or other valuation method based on the discretion of our board of directors. |
| • | Our board of directors will discuss valuations and determine the fair value of each investment in the portfolio in good faith based on the input of OFS Advisor and, where appropriate, the respective independent valuation firms. |
The types of factors that we may take into account in fair value pricing our investments include, as relevant, the nature and realizable value of any collateral, the portfolio company’s ability to make payments and its earnings and discounted cash flow, the markets in which the portfolio company does business, comparison to publicly traded securities and other relevant factors.
Determination of fair value involves subjective judgments and estimates. Accordingly, the notes to our financial statements will express the uncertainty with respect to the possible effect of such valuations, and any change in such valuations, on our financial statements.
Revenue Recognition. Our revenue recognition policies are as follows:
Investments and Related Investment Income: We account for investment transactions on a trade date basis. Our board of directors determines, in good faith, the fair value of each investment in our portfolio. Interest is recognized on an accrual basis. For investments with contractual PIK interest, which represents contractual interest accrued and added to the principal balance that generally becomes due at maturity, we will not accrue PIK interest if the portfolio company valuation indicates that PIK interest is not collectible. Realized gains or losses on investments will be measured by the difference between the net proceeds from the disposition and the cost basis of investment, without regard to unrealized gains or losses previously recognized. We report changes in the fair value of investments that are measured at fair value as a component of the net change in unrealized appreciation (depreciation) on non-affiliate and affiliate investments in our consolidated statements of operations.
Non-accrual. We place loans on non-accrual status when principal and interest payments are past due 90 days or more or when there is reasonable doubt that we will collect principal or interest. Accrued interest is generally reversed when a loan is placed on non-accrual. Interest payments received on non-accrual loans may be recognized as income or applied to principal depending upon management’s judgment. Non-accrual loans are restored to accrual status when past due principal and interest is paid and, in our management’s judgment, is likely to remain current.
Portfolio Composition and Investment Activity
The total fair value of our investments was approximately $232.2 million at December 31, 2012, approximately $225.0 million at December 31, 2011 and approximately $123.2 million at December 31, 2010. The amount at December 31, 2011 gives pro forma effect to the BDC/RIC Elections Adjustments and the WM Consolidation Adjustments, which refers to the financial statement adjustments to consolidate OFS Capital WM’s financial statements into our own as a result of the WM 2012 Credit Facility Amendments (the “WM Consolidation Adjustments”) while the amount at December 31, 2010 gives pro forma effect to the BDC/RIC Elections Adjustments, the WM Consolidation Adjustments and Sale Accounting Adjustments, as described under Note 3 to the Notes to our Consolidated Financial Statements. For the year ended December 31, 2012, OFS
79
Table of Contents
Capital WM closed debt investment with 24 companies with an aggregate face value of approximately $91 million and for the period January 1, 2012 through July 27, 2012, Tamarix LP closed an investment with one portfolio company with a face value of approximately $3.3 million. For the year ended December 31, 2011, OFS Capital and our wholly-owned subsidiary OFS Capital WM closed loans with 41 companies with an aggregate face value of approximately $201.2 million. For the year ended December 31, 2010, in addition to our equity investment in OFS Capital WM, which was valued at approximately $59.7 million at December 31, 2010, after giving effect to the subsequent WM 2011 Credit Facility Amendments, which permitted us to treat the OFS Capital WM closing as a sale for accounting purposes from that date (the “WM 2011 Credit Facility Amendments”), we originated approximately $0.6 million of new debt investments.
On May 11, 2012, due to a reduction in the borrowing base value ascribed to a $4.7 million (principal amount) loan owned by OFS Capital WM following March 31, 2012, an affiliate of OFSAM purchased the loan from OFS Capital WM at its fair value as of March 31, 2012 of $4.2 million. We recognized a realized loss of approximately $1.2 million from this transaction. For the year ended December 31, 2012 and the year ended December 31, 2011, after giving pro forma effect to the WM Consolidation Adjustments, we had approximately $32.7 million and $63.2 million, respectively, in net debt repayments (net of revolver advances) in existing portfolio companies and sold approximately $15.0 million and $21.2 million of our loans, respectively. For the year ended December 31, 2010, after giving pro forma effect to the WM Consolidation Adjustments, we had approximately $38.1 million in net debt repayments in existing portfolio companies and sold approximately $31.0 million of our loans.
The following table shows the cost and fair value of our portfolio of investments by asset class as of December 31, 2012 and December 31, 2011 and 2010, as well as pro forma at December 31, 2011, after giving effect to the WM Consolidation Adjustments and December 31, 2010 after giving effect to the Sale Accounting Adjustments and the WM Consolidation Adjustments.
| As of December 31, 2012 |
As of December 31, 2011 |
As
of December 31, 2011 |
As
of December 31, 2010 |
As
of December 31, 2010 |
||||||||||||||||||||||||||||||||||||
| Historical | Historical | Pro Forma | Historical | Pro Forma | ||||||||||||||||||||||||||||||||||||
| Cost | Fair Value |
Cost | Fair Value |
Cost | Fair Value |
Cost | Fair Value |
Cost | Fair Value |
|||||||||||||||||||||||||||||||
| (in thousands) | ||||||||||||||||||||||||||||||||||||||||
| Senior Secured |
||||||||||||||||||||||||||||||||||||||||
| Performing |
$ | 231,781 | $ | 227,542 | $ | 9,267 | $ | 9,809 | $ | 223,029 | $ | 217,637 | $ | 82,680 | $ | 80,711 | $ | 114,919 | $ | 113,496 | ||||||||||||||||||||
| Non-Accrual |
— | — | — | — | — | — | — | — | — | — | ||||||||||||||||||||||||||||||
| Unitranche |
||||||||||||||||||||||||||||||||||||||||
| Performing |
— | — | — | — | — | — | — | — | — | — | ||||||||||||||||||||||||||||||
| Non-Accrual |
— | — | — | — | — | — | — | — | — | — | ||||||||||||||||||||||||||||||
| Second-Lien |
||||||||||||||||||||||||||||||||||||||||
| Performing |
— | — | — | — | — | — | 1,925 | 1,967 | 1,925 | 1,967 | ||||||||||||||||||||||||||||||
| Non-Accrual |
— | — | — | — | — | — | — | — | — | — | ||||||||||||||||||||||||||||||
| Mezzanine |
||||||||||||||||||||||||||||||||||||||||
| Performing |
— | — | — | — | — | — | — | — | — | — | ||||||||||||||||||||||||||||||
| Non-Accrual |
— | — | — | — | — | — | — | — | — | — | ||||||||||||||||||||||||||||||
| Unsecured |
||||||||||||||||||||||||||||||||||||||||
| Performing |
— | — | 4,756 | 4,756 | 4,756 | 4,756 | — | — | — | — | ||||||||||||||||||||||||||||||
| Non-Accrual |
— | — | — | — | — | — | 2,696 | 2,177 | 2,696 | 2,177 | ||||||||||||||||||||||||||||||
| Equity Investments |
5,049 | 4,657 | 45,575 | 43,836 | 2,455 | 2,619 | 64,949 | 65,220 | 4,842 | 5,545 | ||||||||||||||||||||||||||||||
|
|
|
|
|
|
|
|
|
|
|
|
|
|
|
|
|
|
|
|
|
|||||||||||||||||||||
| Total |
$ | 236,830 | 232,199 | $ | 59,598 | $ | 58,401 | $ | 230,240 | $ | 225,012 | $ | 152,250 | $ | 150,075 | $ | 124,382 | $ | 123,185 | |||||||||||||||||||||
|
|
|
|
|
|
|
|
|
|
|
|
|
|
|
|
|
|
|
|
|
|||||||||||||||||||||
As of December 31, 2012, the weighted average yield to fair value of our debt investments was approximately 7.64%. Throughout this document, the weighted average yield on debt investments at fair value is computed as (a) total annual stated interest on accruing loans plus the annualized amortization of deferred loan origination fees
80
Table of Contents
and accretion of OID divided by (b) total debt investments at fair value (with any unamortized premium or discount accounted for at the time of loan repayment). The weighted average yield on debt investments at fair value is computed as of the balance sheet date and excludes assets on non-accrual status as of such date.
As of December 31, 2012, floating rate loans comprised our entire debt investment portfolio. However, in accordance with our investment strategy, we expect that over time the proportion of fixed rate debt investments in our portfolio will increase.
Our level of investment activity may vary substantially from period to period depending on various factors, including, but not limited to, the amount of debt and equity capital available to middle market companies, the level of merger and acquisition activity, general economic environment and the competitive environment for the types of investments we make.
Results of Operations
Key Financial Measures
The following is a discussion of the key financial measures that management employs in reviewing the performance of our operations.
Revenues. We generate revenue in the form of interest income on debt investments and capital gains and distributions, if any, from our investment securities in portfolio companies. Our debt investments typically have a term of three to eight years and bear interest at fixed and floating rates. As of December 31, 2012, floating rate loans comprised 100% of our current debt investment portfolio; however, in accordance with our investment strategy, we expect that over time the proportion of fixed rate loans will increase. In some instances, we receive payments on our debt investments based on scheduled amortization of the outstanding balances. In addition, we anticipate receiving repayments of some of our debt investments prior to their scheduled maturity date. The frequency or volume of these repayments may fluctuate significantly from period to period. On occasion, our portfolio activity may also reflect the proceeds of sales of securities. In some cases, our investments will provide for deferred interest payments or PIK interest (meaning interest paid in the form of additional principal amount of the loan instead of in cash). In addition, we may generate revenue in the form of commitment, origination and sourcing, structuring or due diligence fees, fees for providing managerial assistance and consulting fees. Loan origination and sourcing fees, original issue discount, or OID, and market discount or premium will be capitalized, and we will accrete or amortize such amounts as interest income. We record prepayment premiums on loans as interest income. When we receive principal payments on a loan in an amount that exceeds its carrying value, we will also record the excess principal payment as income. Dividend income, if any, will be recognized on an accrual basis to the extent that we expect to collect such amounts.
Expenses. Our primary operating expenses include interest expense due under the OFS Capital WM Facility, the payment of fees to OFS Advisor under the Investment Advisory Agreement, our allocable portion of overhead expenses under the Administration Agreement and other operating costs described below. Additionally, we will pay interest expense on any outstanding debt under any new credit facility or other debt instrument we may enter into. We will bear all other out-of-pocket costs and expenses of our operations and transactions, whether incurred by us directly or on our behalf by a third party, including:
| • | the cost of calculating our net asset value, including the cost of any third-party valuation services; |
| • | the cost of effecting sales and repurchases of shares of our common stock and other securities; |
| • | fees payable to third parties relating to making investments, including out-of-pocket fees and expenses associated with performing due diligence and reviews of prospective investments; |
| • | transfer agent and custodial fees; |
| • | out-of-pocket fees and expenses associated with marketing efforts; |
| • | federal and state registration fees and any stock exchange listing fees; |
81
Table of Contents
| • | U.S. federal, state and local taxes; |
| • | independent directors’ fees and expenses; |
| • | brokerage commissions; |
| • | fidelity bond, directors’ and officers’ liability insurance and other insurance premiums; |
| • | direct costs, such as printing, mailing and long-distance telephone; |
| • | fees and expenses associated with independent audits and outside legal costs; |
| • | costs associated with our reporting and compliance obligations under the 1940 Act and other applicable U.S. federal and state securities laws; and |
| • | other expenses incurred by either OFS Services or us in connection with administering our business, including payments under the Administration Agreement that will be based upon our allocable portion (subject to the review and approval of our board of directors) of overhead. |
We do not believe that our historical operating performance is necessarily indicative of our future results of operations that we expect to report in future periods. Prior to the completion of our initial public offering, we completed several significant corporate transactions, including the OFS Capital WM Transaction, the 2010 Distribution, the WM 2011 Credit Facility Amendments, the Tamarix Transactions and the WM 2012 Credit Facility Amendments, as described in more detail under “—Recent Developments and Other Factors Affecting Comparability.” We also intend to pursue a strategy that is focused primarily on investments in middle-market companies in the United States, including investments in senior secured, unitranche, second-lien and mezzanine loans and, to a lesser extent, warrants and other minority equity securities, which differs to some degree from our historical investment concentration, which was in senior secured loans to middle-market companies in the United States. Moreover, as a BDC and a RIC, we will also be subject to certain constraints on our operations, including, but not limited to, limitations imposed by the 1940 Act and the Code, to which we were not previously subject. In addition, Tamarix LP is subject to regulation and oversight by the SBA. For the reasons described above, the results of operations described below may not necessarily be indicative of the results we expect to report in future periods.
Comparison of year ended December 31, 2012 and December 31, 201
Consolidated operating results for the years ended December 31, 2012, 2011, and 2010 are as follows:
| 2012 | 2011 | 2010 | ||||||||||
| (Amounts in thousands) | ||||||||||||
| Total investment income |
$ | 13,432 | $ | 1,772 | $ | 10,438 | ||||||
| Total expenses |
9,337 | 2,635 | 7,466 | |||||||||
|
|
|
|
|
|
|
|||||||
| Net investment income (expenses) |
4,095 | (863 | ) | 2,972 | ||||||||
| Net realized and unrealized gain (loss) on investments |
(1,214 | ) | (156 | ) | 19 | |||||||
| Total other income (loss) prior to becoming a business development company |
3,113 | (1,168 | ) | 2,248 | ||||||||
| Cumulative effect of accounting change |
222 | — | — | |||||||||
|
|
|
|
|
|
|
|||||||
| Net increase (decrease) in net assets resulting from operations |
$ | 6,216 | $ | (2,187 | ) | $ | 5,239 | |||||
|
|
|
|
|
|
|
|||||||
Net income can vary substantially from period to period for various reasons, including the recognition of realized gains and losses and unrealized appreciation and depreciation. As a result, annual comparisons of net income may not be meaningful.
82
Table of Contents
Investment Income
| 2012 | 2011 | 2010 | ||||||||||
| (Amounts in thousands) | ||||||||||||
| Interest income from non-affiliate investments |
$ | 13,326 | $ | 1,752 | $ | 10,253 | ||||||
| Dividend and fee income |
106 | 20 | 185 | |||||||||
|
|
|
|
|
|
|
|||||||
| Total investment income |
$ | 13,432 | $ | 1,772 | $ | 10,438 | ||||||
|
|
|
|
|
|
|
|||||||
Total investment income increased by approximately $11.7 million, or 658%, for the year ended December 31, 2012, as compared to the year ended December 31, 2011. The $11.7 million increase in total investment income was primarily due to the interest income generated by OFS Capital WM for the period April 1, 2012 through December 31, 2012, as a result of our consolidation of OFS Capital WM’s statement of operations effective April 1, 2012.
Total investment income decreased by approximately $8.7 million, or 83.0%, for the year ended December 31, 2011, as compared to the year ended December 31, 2010, primarily due to a decrease of approximately $8.5 million in interest income. The decrease in interest income was primarily attributable to the substantial decrease of our loan receivable balance at December 31, 2011 as compared with that at December 31, 2010, as a result of the OFS Capital WM Transaction and 2010 Distribution (and without giving effect to the WM 2012 Credit Facility Amendments). In addition, for the year ended December 31, 2011, we recorded $0.8 million of interest income in respect of loans receivable pledged to creditors for the period January 1, 2011 through February 23, 2011. The loans receivable pledged to creditors represented a secured borrowing of assets that were sold by us to OFS Capital WM at September 28, 2010 in connection with the OFS Capital WM Transaction. As a result of the WM 2011 Credit Facility Amendments effective February 23, 2011, commencing February 23, 2011, those assets were no longer included on our balance sheet and, accordingly, we no longer recorded any interest income in respect of those assets after that date.
Expenses
| 2012 | 2011 | 2010 | ||||||||||
| (Amounts in thousands) | ||||||||||||
| Interest expense |
$ | 4,163 | $ | 831 | $ | 3,654 | ||||||
| Amortization of deferred financing closing costs |
472 | — | 1,500 | |||||||||
| Management fee |
2,245 | 1,365 | 343 | |||||||||
| Management fees—other related parties |
627 | — | 1,507 | |||||||||
| Professional fees |
935 | 151 | 194 | |||||||||
| Administrative fee |
110 | — | — | |||||||||
| General and administrative expenses |
785 | 288 | 268 | |||||||||
|
|
|
|
|
|
|
|||||||
| Total expenses |
$ | 9,337 | $ | 2,635 | $ | 7,466 | ||||||
|
|
|
|
|
|
|
|||||||
Total expense increased by approximately $6.7 million, or 254% for the year ended December 31, 2012, as compared to the year ended December 31, 2011. Interest expense increased by approximately $3.3 million for 2012 compared to 2011, primarily due to the interest expense incurred by OFS Capital WM on its credit facility in the amount of approximately $4.2 million for the period April 1, 2012 through December 31, 2012, as a result of our consolidation of OFS Capital WM’s statement of operations effective as of April 1, 2012, which was offset by $0.8 million of interest expense incurred in 2011 in respect of the payable under the securities loan agreement. The payable under the securities loan agreement represented a secured borrowing applied to the OFS Capital WM Transaction. Similar to the treatment of the interest income on loans receivable pledged to creditors, effective February 23, 2011, we derecognized the payable on our balance sheet and, accordingly, commencing February 23, 2011, we no longer recorded any interest expense in respect of the payable. Management fee expense increased by approximately $1.5 million in 2012 compared to 2011, which was primarily due to
83
Table of Contents
approximately $0.8 million of management fee OFS Capital WM incurred from its loan manager for the period April 1, 2012 through December 31, 2012, as well as approximately $0.6 million of management fee Tamarix LP incurred to its investment manager for the period January 1, 2012 through July 27, 2012, at which time we deconsolidated Tamarix LP. Professional fees, general and administrative expenses, and amortization of deferred financing closing costs increased by an aggregate of approximately $1.9 million in 2012 compared to 2011, due to our increased cost as a public company as well as our consolidation of OFS Capital WM’s statement of operations from April 1, 2012 through December 31, 2012.
Total expense decreased by $4.8 million, or 65% for the year ended December 31, 2011, as compared to the year ended December 31, 2010, which was primarily due to a decrease in interest expense of approximately $2.8 million and a decrease in amortization of deferred financing closing costs of $1.5 million in 2011 as compared to 2010. For the year ended December 31, 2010, we incurred approximately $3.7 million of interest expenses on our Old Credit Facility and $1.5 million of amortization of deferred financing closing costs. As a result of the OFS Capital WM Transaction, we did not incur such expenses during 2011.
Net Realized and Unrealized Gain (Loss) on Investments
| 2012 | 2011 | 2010 | ||||||||||
| (Amounts in thousands) | ||||||||||||
| Net realized loss on non-affiliate investments |
$ | (1,112 | ) | $ | — | $ | — | |||||
| Net change in unrealized appreciation (depreciation) on non-affiliate investments |
(61 | ) | (156 | ) | 19 | |||||||
| Net change in unrealized depreciation on affiliate investments |
(41 | ) | — | — | ||||||||
|
|
|
|
|
|
|
|||||||
| Net realized and unrealized gain (loss) on investments |
$ | (1,214 | ) | $ | (156 | ) | $ | 19 | ||||
|
|
|
|
|
|
|
|||||||
For the year ended December 31, 2012, we recorded total net realized and unrealized loss on investments in the amount of approximately $1.2 million, consisting primarily of approximately $1.1 million of net realized loss on non-affiliate investments, which represented net realized loss we incurred from sales of debt investments to an affiliated entity of ours.
Other Income (Loss) Prior to Becoming a Business Development Company
| 2012 | 2011 | 2010 | ||||||||||
| (Amounts in thousands) | ||||||||||||
| Loan loss recovery on loans receivable and loan receivable pledged to creditors |
$ | — | $ | 199 | $ | 2,390 | ||||||
| Income (loss) from equity interest in OFS Capital WM |
2,645 | (638 | ) | 2,353 | ||||||||
| Income from equity interest in Tamarix LP |
378 | — | — | |||||||||
| Loss on sale of loans to OFS Capital WM |
— | (889 | ) | — | ||||||||
| Loss on sale of other loans, net |
— | — | (1,641 | ) | ||||||||
| Gain on payable under securities loan agreement |
— | 71 | — | |||||||||
| Unrealized loss on payable under securities loan agreement |
— | — | (1,058 | ) | ||||||||
| Net loss attributable to the non-controlling interests |
61 | — | — | |||||||||
| Gain on restructuring of loans |
— | — | 152 | |||||||||
| Other income |
29 | 89 | 52 | |||||||||
|
|
|
|
|
|
|
|||||||
| Total other income (loss) prior to becoming a business development company |
$ | 3,113 | $ | (1,168 | ) | $ | 2,248 | |||||
|
|
|
|
|
|
|
|||||||
We generated approximately $3.1 million of total other income prior to becoming a BDC for the year ended December 31, 2012, and incurred approximately $1.2 million of total other loss prior to becoming a BDC for the year ended December 31, 2011. This increase of approximately $4.3 million, or 367%, in 2012 was primarily due
84
Table of Contents
to our recording of income from our equity interest in OFS Capital WM in the amount of $2.6 million for the period January 1, 2012 through March 31, 2012, prior to our consolidation of OFS Capital WM, as well as our recording of approximately $0.4 million of income from our equity interest in Tamarix LP from July 28, 2012 through November 7, 2012 (commencing July 28, 2012, we adopted the equity method of accounting to record our investment in Tamarix LP upon our deconsolidation of Tamarix LP; commencing November 8, 2012, we adopted fair value accounting to record our equity investment in Tamarix LP, as a result of our election to become a BDC). During 2011, we recorded an approximately $0.6 million loss from equity interest in OFS Capital WM, and an approximately $0.9 million loss on sale of loans to OFS Capital WM, offset by a loan loss recovery of approximately $0.2 million.
We incurred an approximately $1.2 million total other loss prior to becoming a BDC for the year ended December 31, 2011, and generated approximately $2.2 million of total other income prior to becoming a BDC for the year ended December 31, 2010. This decrease of approximately $3.4 million, or 1,520%, in 2011 was largely due to a loan loss recovery of approximately $2.4 million, and income from equity interest in OFS Capital WM of approximately $2.4 million, that we recorded in 2010, offset by a net loss on sale of other loans of $1.6 million, and unrealized loss on payable under securities loan agreement of $1.1 million, in 2010.
Cumulative Effect of Accounting Change
We recorded cumulative effect of accounting change in the net amount of approximately $0.2 million for the year ended December 31, 2012, consisting of approximately $0.5 million of cumulative increase to our net income as a result of Tamarix LP’s conversion to an investment company effective May 10, 2012 when it received the SBIC license, offset by approximately $0.3 million of cumulative decrease to our net income as a result of our BDC election on November 7, 2012.
Financial Condition, Liquidity and Capital Resources
As of December 31, 2012, we had cash and cash equivalents outstanding of $8.3 million and $99.2 million in indebtedness under the OFS Capital WM Facility.
In connection with our IPO, on November 7, 2012, we converted from a limited liability company to a corporation, as a result of which the sole membership interest held by OFSAM prior to the conversion was exchanged for 2,912,024 shares of our common stock. In connection with our IPO, we elected to be treated as a BDC under the 1940 Act. On November 14, 2012, we completed our IPO selling 6,666,667 shares of our common stock at a public offering price of $15 per share, raising $100 million in gross proceeds. We incurred approximately $6.2 million of sales load and $5.8 million of offering related costs in connection with our IPO.
We utilized $90 million of our IPO proceeds to pay down the OFS Capital WM Facility. The OFS Capital WM Facility indebtedness repaid included approximately $48.0 million of Class A loans and approximately $42.0 million of Class B loans. In January 2013, we terminated the Class B facility. Outstanding Class A loans accrue interest at a rate per annum equal to LIBOR plus 2.75% (or 4.75% if an event of default has occurred). The Class A loans mature on December 31, 2016, which maturity date will be extended by one year if the reinvestment period is extended by one year.
We generated cash primarily from the net proceeds of our IPO, and intend to generate additional cash flows from operations, distributions from equity investments, future borrowings, including borrowings by OFS Capital WM pursuant to the OFS Capital WM Facility, and through any future offerings of securities. Following the $90 million repayment on the OFS Capital WM Facility, we had in excess of $90 million of borrowing capacity. We may seek a credit facility to finance investments and working capital requirements. There can be no assurance that we will be able to obtain such financing on favorable terms or at all. In the future, we may also seek to finance all or portions of our portfolio through on-balance sheet special purpose vehicles. To securitize investments, we would likely create a subsidiary and contribute a pool of investments to the subsidiary. We or
85
Table of Contents
the subsidiary would then sell debt or equity interests in the subsidiary to purchasers and we would retain all or a portion of the equity in the subsidiary. Our primary use of funds will be investments in our targeted asset classes, interest payments on any indebtedness and cash distributions to holders of our common stock.
Although we expect to fund the growth of our investment portfolio utilizing borrowings under the OFS Capital WM Facility, future equity offerings, including our dividend reinvestment plan, and issuances of senior securities or future borrowings, to the extent permitted by the 1940 Act, we cannot assure shareholders that our plans to raise capital will be successful. In addition, we intend to distribute to our stockholders substantially all of our taxable income in order to satisfy the requirements applicable to RICs under Subchapter M of the Code. Consequently, we may not have the funds or the ability to fund new investments or make additional investments in our portfolio companies to fund our unfunded commitments to portfolio companies. The illiquidity of these portfolio investments may make it difficult for us to sell these investments when desired and, if we are required to sell these investments, we may realize significantly less than their recorded value.
In addition, as a BDC, we generally will be required to meet a coverage ratio of total assets, less liabilities and indebtedness not represented by senior securities, to total senior securities, which include all of our borrowings and any outstanding preferred stock, of at least 200%. This requirement limits the amount that we may borrow. To fund growth in our investment portfolio in the future, we anticipate needing to raise additional capital from various sources, including the equity markets and the securitization or other debt-related markets, which may or may not be available on favorable terms, if at all.
The OFS Capital WM Facility
On September 28, 2010, OFS Capital WM entered into a $180.0 million secured revolving credit facility (the “OFS Capital WM Facility”) with Wells Fargo and Madison Capital, with the Class A lenders (initially Wells Fargo) providing up to $135 million in Class A loans and the Class B lenders (initially Madison Capital) providing up to $45 million in Class B loans to OFS Capital WM. In January 2013, OFS Capital WM terminated its $45 million Class B credit facility. The OFS Capital WM Facility is secured by the Eligible Loans transferred to OFS Capital WM by OFS Capital on the date of the OFS Capital WM Transaction and any eligible loan assets subsequently acquired by OFS Capital WM.
Outstanding borrowings on the Class A credit facility are limited to the lesser of (a) the “maximum facility amount” of $135 million and (b) the “borrowing base.” Generally, during the reinvestment period, the borrowing base is equal to the value of the loan assets in OFS Capital WM’s portfolio multiplied by the advance rate of 65% with respect to the Class A loans. After the reinvestment period, the maximum facility amount will be limited to the then outstanding principal amount of Class A loans.
If at any time the amount of Class A loans outstanding exceeds the borrowing base, a borrowing base deficiency will exist. In that event, OFS Capital WM will have three business days to eliminate the deficiency by, among other things, (a) depositing additional cash into the relevant collection account, (b) repaying Class A loans, or (c) pledging additional eligible loan assets. In the case of such a deficiency, we may determine it is in our best interests to make additional capital contributions to OFS Capital WM in the form of cash or additional eligible loan assets to protect the value of our equity investment in OFS Capital WM, and our additional contributions could be material.
Under the OFS Capital WM Facility, the Loan Manager charges both a senior and subordinated management fee to OFS Capital WM for its services, each at 0.25% per annum of the assigned value of the underlying portfolio investments, plus an accrued fee that is deferred until after the end of the investment period of the portfolio investments. For the year ended December 31, 2012, the Company incurred management fee expense of approximately $0.8 million to the Loan Manager.
86
Table of Contents
On September 28, 2012, the WM Credit Facility was amended (“Amended WM Credit Facility”). Under the Amended WM Credit Facility: (1) the loans were extended to December 31, 2016, and there is a one-year option for extension of the Class A loans upon the approval of the Class A lenders; (2) the reinvestment period was extended to December 31, 2013, which can be further extended by one year with the consent of the lender; and (3) accrued interest rate on outstanding Class A loans was amended to LIBOR plus 2.75% per annum. In connection with the Amended OFS Capital WM Facility, OFS Capital WM incurred financing costs of $0.7 million which, together with the unamortized deferred financing costs under the WM Credit Facility of $2.4 million at September 28, 2012, are deferred and amortized over the Amended OFS Capital WM Facility.
Off-Balance Sheet Arrangements
We may be a party to financial instruments with off-balance sheet risk in the normal course of our business to meet the financial needs of our portfolio companies. As of December 31, 2012, we had a $1.5 million unused line of credit granted to a borrower. Unused lines of credit involve, to varying degrees, elements of credit risk in excess of the amount recognized in the balance sheet and are not reflected on our balance sheet. In addition, as of December 31, 2012, we had approximately $20.1 million of committed but uncalled equity investment in Tamarix LP.
Contractual Obligations
The following table shows our contractual obligations as of December 31, 2012:
| Payments due by period (in thousands) |
||||||||||||||||||||
| Contractual Obligations(1) |
Total | Less than 1 year |
1 - 3 years |
3 - 5 years | After 5 years |
|||||||||||||||
| Borrowings |
$ | 99,224 | $ | — | $ | — | $ | 99,224 | $ | — | ||||||||||
|
|
|
|
|
|
|
|
|
|
|
|||||||||||
| Total |
$ | 99,224 | $ | — | $ | — | $ | 99,224 | $ | — | ||||||||||
|
|
|
|
|
|
|
|
|
|
|
|||||||||||
| (1) | Excludes commitments to extend credit to our portfolio companies. |
We have entered into contracts with third parties under which we have material future commitments—the Investment Advisory Agreement, pursuant to which OFS Advisor has agreed to serve as our investment adviser, and the Administration Agreement, pursuant to which OFS Services has agreed to furnish us with the facilities and administrative services necessary to conduct our day-to-day operations.
As a result of the WM 2012 Credit Facility Amendments, we have consolidated OFS Capital WM in our financial statements as of March 30, 2012. For more information on the contractual obligations of OFS Capital WM including the OFS Capital WM Facility, see “Item 8. Financial Statements and Supplementary Data.”
We have subscribed for $24.9 million out of a total of $36.9 million committed and partially funded commitments in Tamarix LP. We have partially funded and may be called upon to fund the balance of our commitment in connection with the operations of Tamarix LP.
Commitments and Contingencies
At December 31, 2012 and 2011, we had a $1.5 million unused line of credit granted to a borrower. On March 27, 2012, we entered into a new subscription agreement (“Subscription Agreement”) with respect to an investment in Tamarix LP, which superseded prior agreements and was contingent upon issuance of the license from the SBA. Under the terms of the Subscription Agreement, our investment in Tamarix LP will not exceed $25.0 million. On April 2, 2012, OFS Capital funded $1.58 million to Tamarix LP. In March and April 2012, Tamarix LP also received an aggregate of $0.2 million and $0.7 million, respectively, from other investors. These funds, totaling $2.5 million, were called by Tamarix LP as requested by the SBA and would be used as
87
Table of Contents
initial capital of Tamarix LP once Tamarix LP received the SBIC license. On May 10, 2012, as a result of Tamarix LP’s receipt of the SBIC license, our equity investment in Tamarix LP was no longer contingent, and our advance to Tamarix LP in the amount of $1.58 million was reclassified to an equity investment in Tamarix LP. In July 2012, we made an additional equity investment of $3.24 million in Tamarix LP. As of December 31, 2012, our committed but uncalled capital investment in Tamarix LP was approximately $20.1 million.
From time to time, we are involved in legal proceedings in the normal course of its business. Although the outcome of such litigation cannot be predicted with any certainty, management is of the opinion, based on the advice of legal counsel, that final disposition of any litigation should not have a material adverse effect on our financial position.
In the normal course of business, we enter into contracts and agreements that contain a variety of representations and warranties that provide general indemnifications. Our maximum exposure under these arrangements is unknown, as this would involve future claims that may be made against us that have not occurred. We believe the risk of any material obligation under these indemnifications to be unlikely.
Dividends
We intend to qualify to be taxed as a RIC under the Code. Generally, a RIC is entitled to deduct dividends it pays to its shareholders from its income to determine “taxable income.” Taxable income includes our taxable interest, dividend and fee income, as well as taxable net capital gains. Taxable income generally differs from net income for financial reporting purposes due to temporary and permanent differences in the recognition of income and expenses, and generally excludes net unrealized appreciation or depreciation, as gains or losses are not included in taxable income until they are realized. In addition, gains realized for financial reporting purposes may differ from gains included in taxable income as a result of our election to recognize gains using installment sale treatment, which generally results in the deferment of gains for tax purposes until notes or other amounts, including amounts held in escrow, received as consideration from the sale of investments are collected in cash. Taxable income includes non-cash income, such as changes in accrued and reinvested interest and dividends, which includes contractual payment-in-kind interest, and the amortization of discounts and fees. Cash collections of income resulting from contractual PIK interest or the amortization of discounts and fees generally occur upon the repayment of the loans or debt securities that include such items. Non-cash taxable income is reduced by non-cash expenses, such as realized losses and depreciation and amortization expense.
Our board of directors will maintain a variable dividend policy with the objective of distributing four quarterly distributions in an amount that approximates 90-100% of our taxable quarterly income or potential annual income for a particular year. In addition, at the end of the year, we may also pay an additional special dividend, or fifth dividend, such that we may distribute approximately all of our annual taxable income in the year it was earned, while maintaining the option to spill over our excess taxable income.
On November 26, 2012, we announced that we had declared an initial dividend of $0.34 per share for the quarter ending December 31, 2012 (which amount was to be proportionately reduced to reflect the number of days remaining in such quarter after the completion of our IPO), payable on January 31, 2013 to stockholders of record as of the close of business on January 17, 2013. Based on the November 14, 2012 closing of our IPO, stockholders of record on January 17, 2013 received a dividend of $0.17 per share in respect of the quarter ending December 31, 2012.
Distributions in excess of our current and accumulated earnings and profits generally will be treated first as a return of capital to the extent of the stockholder’s tax basis, and any remaining distributions would be treated as a capital gain. The determination of the tax attributes of our distributions is made annually as of the end of our fiscal year based upon our taxable income for the full year and distributions paid for the full year; therefore, a determination made on a quarterly basis may not be representative of the tax attributes of our annual distributions to stockholders. For the period November 8, 2012 through December 31, 2012, out of our approximately $1.6 million dividend distribution, approximately 98% represented ordinary income and 2% represented a return of capital.
88
Table of Contents
Each year a statement on Form 1099-DIV identifying the source of the distribution (i.e., paid from ordinary income, paid from net capital gains on the sale of securities, and/or a return of paid-in-capital surplus which is a nontaxable distribution) is mailed to our U.S. stockholders. To the extent our taxable earnings fall below the total amount of our distributions for that fiscal year, a portion of those distributions may be deemed a tax return of capital to our stockholders.
Related Party Transactions
Investment Advisory Agreement
We have entered into an Investment Advisory Agreement with OFS Advisor and will pay OFS Advisor a management fee and incentive fee. Pursuant to the Investment Advisory Agreement with OFS Advisor and subject to the overall supervision of our board of directors and in accordance with the 1940 Act, OFS Advisor provides investment advisory services to us. For providing these services, OFS Advisor receives a fee from us consisting of two components—a base management fee and an incentive fee. From the completion of our initial public offering through October 31, 2013, the base management fee will be calculated at an annual rate of 0.875% based on the average value of our total assets (other than cash and cash equivalents but including assets purchased with borrowed amounts and including assets owned by any consolidated entity) at the end of the two most recently completed calendar quarters. After October 31, 2013, the base management fee will be calculated at an annual rate of 1.75% based on the average value of our total assets (other than cash and cash equivalents but including assets purchased with borrowed amounts and including assets owned by any consolidated entity) at the end of the two most recently completed calendar quarters. The base management fee is payable quarterly in arrears.
The incentive fee has two parts. One part is calculated and payable quarterly in arrears based on our pre-incentive fee net investment income for the quarter. “Pre-incentive fee net investment income” means interest income, dividend income and any other income (including any other fees such as commitment, origination and sourcing, structuring, diligence and consulting fees or other fees that we receive from portfolio companies but excluding fees for providing managerial assistance) accrued during the calendar quarter, minus operating expenses for the quarter (including the base management fee, any expenses payable under the Administration Agreement and any interest expense and dividends paid on any outstanding preferred stock, but excluding the incentive fee). Pre-incentive fee net investment income includes, in the case of investments with a deferred interest feature (such as OID, debt instruments with PIK interest and zero coupon securities), accrued income that we have not yet received in cash.
Pre-incentive fee net investment income does not include any realized gains, realized losses, unrealized capital appreciation or unrealized capital depreciation. Because of the structure of the incentive fee, it is possible that we may pay an incentive fee in a quarter where we incur a loss. For example, if we receive pre-incentive fee net investment income in excess of the hurdle rate (as defined below) for a quarter, we will pay the applicable incentive fee even if we have incurred a loss in that quarter due to realized capital losses and unrealized capital depreciation.
Pre-incentive fee net investment income, expressed as a rate of return on the value of our net assets (defined as total assets less indebtedness and before taking into account any incentive fees payable during the period) at the end of the immediately preceding calendar quarter, is compared to a fixed “hurdle rate” of 2.0% per quarter. If market interest rates rise, we may be able to invest our funds in debt instruments that provide for a higher return, which would increase our pre-incentive fee net investment income and make it easier for OFS Advisor to surpass the fixed hurdle rate and receive an incentive fee based on such net investment income. There is no accumulation of amounts on the hurdle rate from quarter to quarter and accordingly there is no clawback of amounts previously paid if subsequent quarters are below the quarterly hurdle rate and there is no delay of payment if prior quarters are below the quarterly hurdle rate.
89
Table of Contents
We pay OFS Advisor an incentive fee with respect to our pre-incentive fee net investment income in each calendar quarter as follows:
| • | no incentive fee in any calendar quarter in which the pre-incentive fee net investment income does not exceed the hurdle rate; |
| • | 100% of our pre-incentive fee net investment income with respect to that portion of such pre-incentive fee net investment income, if any, that exceeds the hurdle rate but is less than 2.5% in any calendar quarter. We refer to this portion of our pre-incentive fee net investment income (which exceeds the hurdle rate but is less than 2.5%) as the “catch-up” provision. The catch-up is meant to provide OFS Advisor with 20.0% of the pre-incentive fee net investment income as if a hurdle rate did not apply if this pre-incentive fee net investment income exceeds 2.5% in any calendar quarter; and |
| • | 20.0% of the amount of our pre-incentive fee net investment income, if any, that exceeds 2.5% in any calendar quarter. |
The second part of the incentive fee (the “Capital Gains Fee”) is determined and payable in arrears as of the end of each calendar year (or upon termination of the Investment Advisory Agreement, as of the termination date) and is calculated at the end of each applicable year by subtracting (a) the sum of our cumulative aggregate realized capital losses and our aggregate unrealized capital depreciation from (b) our cumulative aggregate realized capital gains. If such amount is positive at the end of such year, then the Capital Gains Fee for such year is equal to 20.0% of such amount, less the aggregate amount of Capital Gains Fees paid in all prior years. If such amount is negative, then there is no Capital Gains Fee for such year.
The cumulative aggregate realized capital gains are calculated as the sum of the differences, if positive, between (a) the net sales price of each investment in our portfolio when sold and (b) the accreted or amortized cost basis of such investment.
The cumulative aggregate realized capital losses are calculated as the sum of the amounts by which (a) the net sales price of each investment in our portfolio when sold is less than (b) the accreted or amortized cost basis of such investment.
The aggregate unrealized capital depreciation is calculated as the sum of the differences, if negative, between (a) the valuation of each investment in our portfolio as of the applicable Capital Gains Fee calculation date and (b) the accreted or amortized cost basis of such investment. Unrealized capital appreciation is accrued, but not paid until said appreciation is realized.
License Agreement
We have entered into a license agreement with OFSAM under which OFSAM has agreed to grant us a non-exclusive, royalty-free license to use the name “OFS.”
Administration Agreement
We have entered into an Administration Agreement, pursuant to which OFS Services furnishes us with office facilities, equipment, necessary software licenses and subscriptions and clerical, bookkeeping and record keeping services at such facilities. Under our Administration Agreement, OFS Services performs, or oversees the performance of, our required administrative services, which include, among other things, being responsible for the financial records which we are required to maintain and preparing reports to our stockholders and all other reports and materials required to be filed with the SEC or any other regulatory authority.
90
Table of Contents
Staffing Agreement
OFS Advisor is an affiliate of OFSC, with which it has entered into a Staffing Agreement. Under this agreement OFSC will make available to OFS Advisor experienced investment professionals and access to the senior investment personnel and other resources of OFSC and its affiliates. The Staffing Agreement should provide OFS Advisor with access to deal flow generated by the professionals of OFSC and its affiliates and commits the members of OFS Advisor’s investment committee to serve in that capacity. OFS Advisor intends to capitalize on the significant deal origination and sourcing, credit underwriting, due diligence, investment structuring, execution, portfolio management and monitoring experience of OFSC’s investment professionals.
OFSC also has entered into a staffing and corporate services agreement with OFS Services. Under this agreement, OFS Services will will make available to OFSC experienced investment professionals and access to the administrative resources of OFS Services.
Distributions to Affiliates
On December 31, 2009, we distributed to OFSAM assets and operations that we determined were not consistent with our investment strategy. Since December 31, 2009, we have undertaken or determined to undertake certain additional steps to further our investment strategy. At the OFS Capital WM Closing, we sold a substantial portion of our loan portfolio, transferred to us by OFS Funding, to OFS Capital WM in exchange for all the equity interests in OFS Capital WM and the OFS Capital WM Cash Consideration. Our transfer of the OFS Capital WM Cash Consideration and the OFSAM Cash Contribution to OFS Funding allowed OFS Funding to repay the outstanding loan balance under the Old Credit Facility after it had applied net proceeds from the sale of three loans to pay down a portion thereof. In addition, concurrently with the OFS Capital WM Transaction, we distributed to OFSAM a substantial portion of our remaining loan portfolio transferred to us by OFS Funding and certain of our equity investments. We determined to make these distributions to eliminate certain potential conflicts of interest that might arise due to the fact that we and an affiliated fund both had investments in these portfolio companies. In March 2012, we entered into the WM 2012 Credit Facility Amendments, and we have consolidated the financial statements of OFS Capital WM into our own as of March 30, 2012 as described elsewhere in this annual report on Form 10-K.
For the period January 1, 2012 through November 7, 2012, we made distributions to OFSAM in the aggregate amount of approximately $6.7 million.
Recent Developments
On January 22, 2013, the OFS Capital WM Facility was further amended, pursuant to which the Class B Facility was terminated. As a result, the OFS Capital WM Facility was reduced from $180.0 million to $135.0 million.
On March 13, 2013, we made an additional equity investment in Tamarix LP pursuant to its capital call in the amount of approximately $2,169,000. Also on March 13, 2013, we made an additional equity investment in Tamarix GP in the amount of approximately $11,000.
On March 26, 2013, the Company announced that it had declared a dividend of $0.34 per share for the quarter ending March 31, 2013, payable on April 30, 2013 to stockholders of record as of the close of business on April 17, 2013.
| Item 7A. | Quantitative and Qualitative Disclosures about Market Risk |
We are subject to financial market risks, including changes in interest rates. As of December 31, 2012, all of our debt investments bore interest at floating interest rates, and we expect that our investment portfolio may in
91
Table of Contents
the future include both floating and fixed rate debt investments. The interest rates on our debt investments are usually based on a floating LIBOR, and the debt investments typically contain interest rate re-set provisions that adjust applicable interest rates to current rates on a periodic basis. All of the debt investments in our portfolio as of December 31, 2012 had interest rate floors, which have effectively converted those debt investments to fixed rate debt investments in the current interest rate environment.
In addition, our credit facility has a floating interest rate provision, and we expect that other credit facilities into which we may enter in the future may have floating interest rate provisions.
Assuming that our consolidated balance sheet as of December 31, 2012 were to remain constant, and that we took no actions to alter our existing interest rate sensitivity, the following table shows the annualized impact of hypothetical base rate changes in interest rates
| Basis point increase(1) |
Interest income |
Interest expense |
Net
increase (decrease) |
|||||||||
| (Dollar amount in thousands) |
||||||||||||
| 100 |
$ | 137 | $ | (1,006 | ) | $ | (869 | ) | ||||
| 200 |
2,080 | (2,012 | ) | 68 | ||||||||
| 300 |
4,458 | (3,018 | ) | 1,440 | ||||||||
| 400 |
6,835 | (4,024 | ) | 2,811 | ||||||||
| 500 |
9,212 | (5,030 | ) | 4,182 | ||||||||
| (1) | A decline in interest rates would not have a material impact on our consolidated financial statements. |
Although we believe that the foregoing analysis is indicative of our sensitivity to interest rate changes, it does not adjust for potential changes in the credit market, credit quality, size and composition of the assets in our portfolio, and other business developments, including borrowings under our credit facility, that could affect net increase in net assets resulting from operations, or net income. Accordingly, no assurances can be given that actual results would not differ materially from the statement above.
We are subject to financial market risks, including changes in interest rates. Changes in interest rates affect both our cost of funding and the valuation of our investment portfolio. Our risk management systems and procedures are designed to identify and analyze our risk, to set appropriate policies and limits and to continually monitor these risks and limits by means of reliable administrative and information systems and other policies and programs. Our investment portfolio and investment income may be affected by changes in various interest rates, including LIBOR and prime rates.
As of December 31, 2012, all of our outstanding loan portfolio bore interest at floating rates.
92
Table of Contents
| Item 8. | Financial Statements and Supplementary Data |
| Page | ||
| 94 | ||
| Consolidated Balance Sheets as of December 31, 2012 and 2011 |
95 | |
| 96 | ||
| 98 | ||
| 99 | ||
| Consolidated Schedules of Investments as of December 31, 2012 and 2011 |
103 | |
| 108 | ||
| 141 | ||
| Statements of Assets and Liabilities as of December 31, 2011 and 2010 |
142 | |
| 143 | ||
| 144 | ||
| 145 | ||
| 147 | ||
| 155 | ||
93
Table of Contents
Report of Independent Registered Public Accounting Firm
To the Board of Directors and Stockholders
OFS Capital Corporation
We have audited the accompanying consolidated balance sheets of OFS Capital Corporation and Subsidiaries (collectively, the “Company”), including the consolidated schedules of investments, as of December 31, 2012 and 2011, and the related consolidated statements of operations, changes in net assets, and cash flows for the period November 8, 2012 through December 31, 2012, the period January 1, 2012 through November 7, 2012, and the years ended December 31, 2011 and 2010. Our audit also included the financial statement schedule of the Company listed in Item 15(a). These financial statements and financial statement schedule are the responsibility of the Company’s management. Our responsibility is to express an opinion on these financial statements and schedule based on our audits.
We conducted our audits in accordance with the standards of the Public Company Accounting Oversight Board (United States). Those standards require that we plan and perform the audit to obtain reasonable assurance about whether the financial statements are free of material misstatement. The Company is not required to have, nor were we engaged to perform, an audit of its internal control over financial reporting. Our audits included consideration of internal control over financial reporting as a basis for designing audit procedures that are appropriate in the circumstances, but not for the purpose of expressing an opinion on the effectiveness of the Company’s internal control over financial reporting. Accordingly, we express no such opinion. An audit also includes examining, on a test basis, evidence supporting the amounts and disclosures in the financial statements, assessing the accounting principles used and significant estimates made by management, as well as evaluating the overall financial statement presentation. Our procedures included confirmation of investments owned as of December 31, 2012, by correspondence with custodian, loan agent or borrower. Our audit also involved performing such other procedures as we considered necessary in the circumstances. We believe that our audits provide a reasonable basis for our opinion.
In our opinion, the consolidated financial statements referred to above present fairly, in all material respects, the financial position of OFS Capital Corporation and Subsidiaries as of December 31, 2012 and 2011, and the results of their operations and their cash flows for the period November 8, 2012 through December 31, 2012, the period January 1, 2012 through November 7, 2012, and the years ended December 31, 2011 and 2010, in conformity with U.S. generally accepted accounting principles. Also, in our opinion, the related financial statement schedule, when considered in relation to the basic consolidated financial statements taken as a whole, presents fairly in all material respects the information set forth therein.
As explained in Note 7, the consolidated financial statements include investments valued at approximately $232,199,000 (163.75% of net assets) as of December 31, 2012, whose fair values have been estimated by management in the absence of readily ascertainable fair values.
/s/ McGladrey LLP
Chicago, Illinois
March 26, 2013
94
Table of Contents
OFS Capital Corporation and Subsidiaries
(Amounts in thousands, except share and per share data)
| December 31, | ||||||||
| 2012 | 2011 | |||||||
| Assets |
||||||||
| Investments, at fair value |
||||||||
| Non-affiliate investments (cost of $231,781 at December 31, 2012) |
$ | 227,542 | $ | — | ||||
| Affiliate investments (cost of $5,049 at December 31, 2012) |
4,657 | — | ||||||
|
|
|
|
|
|||||
| Total investments at fair value |
232,199 | — | ||||||
| Cash and cash equivalents |
8,270 | 814 | ||||||
| Restricted cash and cash equivalents |
623 | — | ||||||
| Loans receivable, net of allowance for losses of $219 at December 31, 2011 |
— | 13,804 | ||||||
| Interest receivable |
1,292 | 12 | ||||||
| Prepaid expenses and other assets |
326 | 456 | ||||||
| Deferred offering costs |
— | 4,253 | ||||||
| Deferred financing costs, net of accumulated amortization of $1,336 at |
||||||||
| December 31, 2012 |
2,839 | — | ||||||
| Equity investment in OFS Capital WM |
— | 43,120 | ||||||
| Other equity investments |
— | 2,455 | ||||||
|
|
|
|
|
|||||
| Total assets |
$ | 245,549 | $ | 64,914 | ||||
|
|
|
|
|
|||||
| Liabilities |
||||||||
| Accrued professional fees |
$ | 463 | $ | — | ||||
| Accrued deferred offering costs |
— | 3,078 | ||||||
| Interest payable |
1,222 | — | ||||||
| Dividend payable |
1,628 | — | ||||||
| Management fee payable |
667 | 302 | ||||||
| Administration fee payable |
110 | — | ||||||
| Other payables |
223 | 3 | ||||||
| Due to affiliated entities, net |
9 | 6,812 | ||||||
| Deferred loan fee revenue |
204 | — | ||||||
| Revolving line of credit |
99,224 | — | ||||||
|
|
|
|
|
|||||
| Total liabilities |
103,750 | 10,195 | ||||||
|
|
|
|
|
|||||
| Net Assets/Member’s equity |
||||||||
| Member’s equity |
— | 54,719 | ||||||
| Preferred stock, par value of $0.01 per share, 2,000,000 shares authorized, 0 shares issued and outstanding as of December 31, 2012 and 2011 |
— | — | ||||||
| Common stock, par value of $0.01 per share, 100,000,000 shares authorized, 9,578,691 shares issued and outstanding as of December 31, 2012 and 2011 |
96 | — | ||||||
| Paid-in capital in excess of par |
142,408 | — | ||||||
| Distributions in excess of net investment income |
(94 | ) | ||||||
| Net unrealized depreciation on investments |
(611 | ) | — | |||||
|
|
|
|
|
|||||
| Total net assets/member’s equity |
141,799 | 54,719 | ||||||
|
|
|
|
|
|||||
| Total liabilities and net assets/member’s equity |
$ | 245,549 | $ | 64,914 | ||||
|
|
|
|
|
|||||
| Number of shares outstanding |
9,578,691 | N/A | ||||||
|
|
|
|
|
|||||
| Net asset value per share |
$ | 14.80 | N/A | |||||
|
|
|
|
|
|||||
See Notes to Consolidated Financial Statements.
95
Table of Contents
OFS Capital Corporation and Subsidiaries
Consolidated Statements of Operations
(Amounts in thousands, except share and per share data)
| Post-IPO as a Business Development Company |
Pre-IPO Prior to becoming a Business Development Company (1) |
|||||||||||||||||||
| For the Period November 8, 2012 through December 31, 2012 |
For the Period January 1, 2012 through November 7, 2012 |
For the Year Ended December 31, 2012 (2) |
For the Year Ended December 31, 2011 |
For the Year Ended December 31, 2010 |
||||||||||||||||
| Investment income |
||||||||||||||||||||
| Interest income from non-affiliate investments |
$ | 2,593 | $ | 10,733 | $ | 13,326 | $ | 1,752 | $ | 10,253 | ||||||||||
| Dividend and fee income |
— | 106 | 106 | 20 | 185 | |||||||||||||||
|
|
|
|
|
|
|
|
|
|
|
|||||||||||
| Total investment income |
2,593 | 10,839 | 13,432 | 1,772 | 10,438 | |||||||||||||||
|
|
|
|
|
|
|
|
|
|
|
|||||||||||
| Expenses |
||||||||||||||||||||
| Interest expense |
580 | 3,583 | 4,163 | 831 | 3,654 | |||||||||||||||
| Amortization of deferred financing closing costs |
127 | 345 | 472 | — | 1,500 | |||||||||||||||
| Management fee |
427 | 1,818 | 2,245 | 1,365 | 343 | |||||||||||||||
| Management fees - other related parties |
— | 627 | 627 | — | 1,507 | |||||||||||||||
| Professional fees |
472 | 463 | 935 | 151 | 194 | |||||||||||||||
| Administrative fee |
110 | — | 110 | — | — | |||||||||||||||
| General and administrative expenses |
216 | 569 | 785 | 288 | 268 | |||||||||||||||
|
|
|
|
|
|
|
|
|
|
|
|||||||||||
| Total expenses |
1,932 | 7,405 | 9,337 | 2,635 | 7,466 | |||||||||||||||
|
|
|
|
|
|
|
|
|
|
|
|||||||||||
| Net investment income (expenses) |
661 | 3,434 | 4,095 | (863 | ) | 2,972 | ||||||||||||||
|
|
|
|
|
|
|
|
|
|
|
|||||||||||
| Net realized and unrealized gain (loss) on investments |
||||||||||||||||||||
| Net realized loss on non-affiliate investments |
— | (1,112 | ) | (1,112 | ) | — | — | |||||||||||||
| Net change in unrealized appreciation (depreciation) on non-affiliate investments |
(222 | ) | 161 | (61 | ) | (156 | ) | 19 | ||||||||||||
| Net change in unrealized depreciation on affiliate investments |
(41 | ) | — | (41 | ) | — | — | |||||||||||||
|
|
|
|
|
|
|
|
|
|
|
|||||||||||
| Net realized and unrealized gain (loss) on investments |
(263 | ) | (951 | ) | (1,214 | ) | (156 | ) | 19 | |||||||||||
|
|
|
|
|
|
|
|
|
|
|
|||||||||||
| Other income (loss) prior to becoming a business development company |
||||||||||||||||||||
| Loan loss recovery on loans receivable and loan receivable pledged to creditors |
— | — | — | 199 | 2,390 | |||||||||||||||
| Income (loss) from equity interest in OFS Capital WM |
— | 2,645 | 2,645 | (638 | ) | 2,353 | ||||||||||||||
| Income from equity interest in Tamarix LP |
— | 378 | 378 | — | — | |||||||||||||||
| Loss on sale of loans to OFS Capital WM |
— | — | — | (889 | ) | — | ||||||||||||||
| Loss on sale of other loans, net |
— | — | — | — | (1,641 | ) | ||||||||||||||
| Gain on payable under securities loan agreement |
— | — | — | 71 | — | |||||||||||||||
| Unrealized loss on payable under securities loan agreement |
— | — | — | — | (1,058 | ) | ||||||||||||||
| Net loss attributable to the non-controlling interests |
— | 61 | 61 | — | — | |||||||||||||||
| Gain on restructuring of loans |
— | — | — | — | 152 | |||||||||||||||
| Other income |
— | 29 | 29 | 89 | 52 | |||||||||||||||
|
|
|
|
|
|
|
|
|
|
|
|||||||||||
| Total other income (loss) prior to becoming a business development company |
— | 3,113 | 3,113 | (1,168 | ) | 2,248 | ||||||||||||||
|
|
|
|
|
|
|
|
|
|
|
|||||||||||
| Net increase (decrease) in net assets before cumulative effect of accounting change and extraordinary gain (loss) |
398 | 5,596 | 5,994 | (2,187 | ) | 5,239 | ||||||||||||||
| Cumulative effect of accounting change |
(348 | ) | 570 | 222 | — | — | ||||||||||||||
| Extraordinary gain (loss) |
873 | (873 | ) | — | — | — | ||||||||||||||
|
|
|
|
|
|
|
|
|
|
|
|||||||||||
| Net increase (decrease) in net assets resulting from operations |
$ | 923 | $ | 5,293 | $ | 6,216 | $ | (2,187 | ) | $ | 5,239 | |||||||||
|
|
|
|
|
|
|
|
|
|
|
|||||||||||
| Net investment income per common share - basic and diluted |
$ | 0.07 | ||||||||||||||||||
|
|
|
|||||||||||||||||||
| Net increase in net assets resulting from operations per common share - basic and diluted |
$ | 0.10 | ||||||||||||||||||
|
|
|
|||||||||||||||||||
| Dividend declared per common share - basic and diluted |
$ | 0.17 | ||||||||||||||||||
|
|
|
|||||||||||||||||||
| Basic and diluted weighted average shares outstanding |
9,578,691 | |||||||||||||||||||
|
|
|
|||||||||||||||||||
96
Table of Contents
| (1) | For historical periods that include financial results prior to November 7, 2012, the Company did not have common shares outstanding or an equivalent and, therefore, earnings per share, dividends declared per common shares and weighted average shares outstanding information for periods that include financial results prior to November 7, 2012 are not provided. |
| (2) | The consolidated statement of operations for the year ended December 31, 2012 included the Company’s Pre-IPO and Post-IPO operations during 2012. |
See Notes to Consolidated Financial Statements.
97
Table of Contents
OFS Capital Corporation and Subsidiaries
Consolidated Statements of Changes in Net Assets
(Amounts in thousands, except share and per share data)
| Member’s Equity |
Non- Controlling Interests |
Paid-in Capital in Excess of Par |
Distributions in Excess of Net Investment Income |
Net Unrealized Depreciation on Investments |
Total
Net Assets |
|||||||||||||||||||||||||||
| Common Stock | ||||||||||||||||||||||||||||||||
| Shares | Par | |||||||||||||||||||||||||||||||
| Balance at January 1, 2010 |
$ | 111,350 | $ | — | — | $ | — | $ | — | $ | — | $ | — | $ | 111,350 | |||||||||||||||||
| Net income |
5,239 | 5,239 | ||||||||||||||||||||||||||||||
| Contributions |
19,942 | 19,942 | ||||||||||||||||||||||||||||||
| Distributions |
(67,009 | ) | (67,009 | ) | ||||||||||||||||||||||||||||
|
|
|
|
|
|
|
|
|
|
|
|
|
|
|
|
|
|||||||||||||||||
| Balance at December 31, 2010 |
69,522 | — | — | — | — | — | — | $ | 69,522 | |||||||||||||||||||||||
| Net loss |
(2,187 | ) | — | — | — | — | — | — | (2,187 | ) | ||||||||||||||||||||||
| Distributions |
(12,616 | ) | — | — | — | — | — | — | (12,616 | ) | ||||||||||||||||||||||
|
|
|
|
|
|
|
|
|
|
|
|
|
|
|
|
|
|||||||||||||||||
| Balance at December 31, 2011 |
54,719 | — | — | — | — | — | — | 54,719 | ||||||||||||||||||||||||
|
|
|
|
|
|
|
|
|
|
|
|
|
|
|
|
|
|||||||||||||||||
| Net income |
5,293 | (61 | ) | — | — | — | — | — | 5,232 | |||||||||||||||||||||||
| Member/non-controlling interest contributions |
1,227 | 2,790 | — | — | — | — | — | 4,017 | ||||||||||||||||||||||||
| Syndication costs |
(209 | ) | (121 | ) | — | — | — | — | — | (330 | ) | |||||||||||||||||||||
| Distributions |
(6,710 | ) | (225 | ) | — | — | — | — | — | (6,935 | ) | |||||||||||||||||||||
| Deconsolidation of Tamarix LP adjustment on July 27, 2012 |
||||||||||||||||||||||||||||||||
| Net income (loss) |
— | 61 | — | — | — | — | — | 61 | ||||||||||||||||||||||||
| Non-controlling interest contributions |
— | (2,790 | ) | — | — | — | — | — | (2,790 | ) | ||||||||||||||||||||||
| Syndication costs |
209 | 121 | — | — | — | — | — | 330 | ||||||||||||||||||||||||
| Distributions |
— | 225 | — | — | — | — | — | 225 | ||||||||||||||||||||||||
|
|
|
|
|
|
|
|
|
|
|
|
|
|
|
|
|
|||||||||||||||||
| Total deconsolidation of Tamarix LP adjustment |
209 | (2,383 | ) | — | — | — | — | — | (2,174 | ) | ||||||||||||||||||||||
|
|
|
|
|
|
|
|
|
|
|
|
|
|
|
|
|
|||||||||||||||||
| Balance at November 7, 2012 |
54,529 | — | — | — | — | — | — | 54,529 | ||||||||||||||||||||||||
|
|
|
|
|
|
|
|
|
|
|
|
|
|
|
|
|
|||||||||||||||||
| IPO offering and underwriting costs borne by OFSAM (3) |
(12,025 | ) | — | — | — | — | — | — | (12,025 | ) | ||||||||||||||||||||||
| OFS Capital Corporation BDC Conversion (1) |
(42,504 | ) | — | 2,912,024 | 29 | 42,475 | 348 | (348 | ) | — | ||||||||||||||||||||||
| Issuance of common stock (2) |
— | — | 6,666,667 | 67 | 99,933 | — | — | 100,000 | ||||||||||||||||||||||||
| Net increase (decrease) in net assets resulting from operations |
— | — | — | — | — | 1,186 | (263 | ) | 923 | |||||||||||||||||||||||
| Dividend payable |
— | — | — | — | — | (1,628 | ) | — | (1,628 | ) | ||||||||||||||||||||||
|
|
|
|
|
|
|
|
|
|
|
|
|
|
|
|
|
|||||||||||||||||
| Balance at December 31, 2012 |
$ | — | $ | — | 9,578,691 | $ | 96 | $ | 142,408 | $ | (94 | ) | $ | (611 | ) | $ | 141,799 | |||||||||||||||
|
|
|
|
|
|
|
|
|
|
|
|
|
|
|
|
|
|||||||||||||||||
| (1) | - Immediately prior to the initial public offering, OFS Capital, LLC converted from a limited liability company to a corporation, as a result of which the sole membership interest held by Orchard First Source Asset Management, LLC prior to the conversion was exchanged for 2,912,024 shares of common stock in OFS Capital Corporation. The Company also reclassified $348 to net unrealized depreciation on investments upon conversion to a business development company. |
| (2) | - On November 7, 2012, OFS Capital Corporation priced its initial public offering, selling 6,666,667 shares of its common stock at a public offering price of $15.00 per share. |
| (3) | - OFSAM bore 100% of the IPO offering and underwriting costs in the total amount of $12,025, of which $5,795 were offering related costs and $6,230 underwriting costs. |
See Notes to Consolidated Financial Statements.
98
Table of Contents
OFS Capital Corporation and Subsidiaries
Consolidated Statements of Cash Flows
(Amounts in thousands)
| Post-IPO as a Business Development Company |
Pre-IPO Prior to becoming a Business Development Company |
|||||||||||||||||||
| For the Period November 8, 2012 through December 31, 2012 |
For the Period January 1, 2012 through November 7, 2012 |
For the Year Ended December 31, 2012 |
For the Year Ended December 31, 2011 |
For the Year Ended December 31, 2010 |
||||||||||||||||
| Cash Flows From Operating Activities |
||||||||||||||||||||
| Net increase (decrease) in net assets resulting from operations |
$ | 923 | $ | 5,293 | $ | 6,216 | $ | (2,187 | ) | $ | 5,239 | |||||||||
| Adjustments to reconcile net increase (decrease) in net assets resulting from operations to net cash used in operating activities: |
||||||||||||||||||||
| Amortization of deferred financing closing costs |
127 | 345 | 472 | — | 1,500 | |||||||||||||||
| Amortization of discounts and premium |
(175 | ) | (706 | ) | (881 | ) | 2 | 103 | ||||||||||||
| Amortization and write-off of of deferred fee revenue |
(10 | ) | (155 | ) | (165 | ) | (172 | ) | (499 | ) | ||||||||||
| Cash collection of deferred fee revenue |
25 | 235 | 260 | 343 | 139 | |||||||||||||||
| Reversal of paid-in-kind interest income on non-accrual loans |
— | — | — | 110 | 482 | |||||||||||||||
| Net realized loss on non-affiliate investments |
— | 1,112 | 1,112 | — | — | |||||||||||||||
| Net change in unrealized appreciation (depreciation) on non-affiliate investments |
222 | (161 | ) | 61 | 156 | (19 | ) | |||||||||||||
| Net change in unrealized depreciation on affiliate investments |
41 | — | 41 | |||||||||||||||||
| Purchase of portfolio investments |
(32,079 | ) | (46,065 | ) | (78,144 | ) | — | — | ||||||||||||
| Proceeds from principal payments on portfolio investments |
6,242 | 26,483 | 32,725 | — | — | |||||||||||||||
| Proceeds from sale of portfolio investments to related party |
— | 4,950 | 4,950 | — | — | |||||||||||||||
| Proceeds from sale of portfolio investments |
— | 8,946 | 8,946 | — | — | |||||||||||||||
| Loan loss recovery on loans receivable and loans receivable pledged to creditors |
— | — | — | (199 | ) | (2,390 | ) | |||||||||||||
| (Income) loss from equity investments in OFS Capital WM |
— | (2,645 | ) | (2,645 | ) | 638 | (2,353 | ) | ||||||||||||
| Income from equity investments in Tamarix LP |
— | (378 | ) | (378 | ) | — | — | |||||||||||||
| Loss on sale of loans to OFS Capital WM |
— | — | — | 889 | — | |||||||||||||||
| Loss on sale of loans, net |
— | — | — | — | 1,641 | |||||||||||||||
| Gain on payable under securities loan agreement |
— | — | — | (71 | ) | — | ||||||||||||||
| Gain on loan restructurings |
— | — | — | — | (152 | ) | ||||||||||||||
| Unrealized loss on payable under securities loan agreement |
— | — | — | — | 1,058 | |||||||||||||||
| Write-off of uncollectible receivables |
— | 290 | 290 | — | — | |||||||||||||||
| Cumulative effect of accounting change |
348 | (570 | ) | (222 | ) | — | — | |||||||||||||
| Net loss allocated to non-controlling interests |
— | (61 | ) | (61 | ) | — | — | |||||||||||||
| Other income |
— | (29 | ) | (29 | ) | (89 | ) | — | ||||||||||||
| Extraordinary (gain) loss |
(873 | ) | 873 | — | — | |||||||||||||||
| Changes in operating assets and liabilities: |
||||||||||||||||||||
| Interest receivable and other assets, net |
97 | (650 | ) | (553 | ) | (9 | ) | 562 | ||||||||||||
| Accrued paid-in-kind interest |
— | (193 | ) | (193 | ) | (221 | ) | (933 | ) | |||||||||||
| Prepaid expenses and other current assets |
(237 | ) | (25 | ) | (262 | ) | (20 | ) | (167 | ) | ||||||||||
| Accrued professional fees |
463 | — | 463 | — | — | |||||||||||||||
| Due to/from affiliated entities, net |
— | 142 | 142 | 269 | 228 | |||||||||||||||
| Interest payable |
580 | (1,005 | ) | (425 | ) | — | (20 | ) | ||||||||||||
| Management fee payable |
427 | (378 | ) | 49 | (41 | ) | 343 | |||||||||||||
| Management fee payable—other related parties |
— | 628 | 628 | — | (1,236 | ) | ||||||||||||||
| Administration fee payable |
110 | — | 110 | — | — | |||||||||||||||
| Other payables |
148 | 34 | 182 | (4 | ) | (60 | ) | |||||||||||||
|
|
|
|
|
|
|
|
|
|
|
|||||||||||
| Net cash provided by (used in) used in operating activities |
(23,621 | ) | (3,690 | ) | (27,311 | ) | (606 | ) | 3,466 | |||||||||||
|
|
|
|
|
|
|
|
|
|
|
|||||||||||
(Continued)
99
Table of Contents
OFS Capital Corporation and Subsidiaries
Consolidated Statements of Cash Flows
(Amounts in thousands)
| Post-IPO as a Business Development Company |
Pre-IPO Prior to becoming a Business Development Company |
|||||||||||||||||||
| For the Period November 8, 2012 through December 31, 2012 |
For the Period January 1, 2012 through November 7, 2012 |
For the Year Ended December 31, 2012 |
For the Year Ended December 31, 2011 |
For the Year Ended December 31, 2010 |
||||||||||||||||
| Cash Flows From Investing Activities |
||||||||||||||||||||
| Loan receivables originations |
— | — | — | (14,750 | ) | (550 | ) | |||||||||||||
| Loan receivables collections and payoffs |
— | — | — | 3,393 | 25,452 | |||||||||||||||
| Collections and payoffs on loans receivable pledged to creditors |
— | — | — | 5,906 | 13,944 | |||||||||||||||
| Interest receivable pledged to creditors |
— | — | — | — | (546 | ) | ||||||||||||||
| Collections on interest receivable pledged to creditors |
— | — | — | 65 | 269 | |||||||||||||||
| Net advance on revolving lines of credit to borrowers |
— | — | — | — | (1,655 | ) | ||||||||||||||
| Purchase of equity interests |
— | — | — | (1,955 | ) | — | ||||||||||||||
| Proceeds from sale of loans and structured securities |
— | — | — | — | 29,395 | |||||||||||||||
| Investments in OFS Capital WM |
— | — | — | — | (411 | ) | ||||||||||||||
| Advances and other assets |
— | (110 | ) | (110 | ) | (251 | ) | — | ||||||||||||
| Distribution from OFS Capital WM |
— | 1,225 | 1,225 | 9,693 | — | |||||||||||||||
| Distribution from Tamarix GP |
— | 52 | 52 | — | — | |||||||||||||||
| Consolidation of cash from OFS Capital WM |
— | 9,581 | 9,581 | — | — | |||||||||||||||
| Deconsolidation of cash of Tamarix LP |
— | (711 | ) | (711 | ) | — | — | |||||||||||||
|
|
|
|
|
|
|
|
|
|
|
|||||||||||
| Net cash provided by investing activities |
— | 10,037 | 10,037 | 2,101 | 65,898 | |||||||||||||||
|
|
|
|
|
|
|
|
|
|
|
|||||||||||
| Cash Flows From Financing Activities |
||||||||||||||||||||
| Net repayments under revolving lines of credit |
(62,476 | ) | (3,175 | ) | (65,651 | ) | — | (113,206 | ) | |||||||||||
| Notes payable due to the SBA |
— | 14,000 | 14,000 | — | — | |||||||||||||||
| Repayment of advance due to affiliated entities |
— | (6,796 | ) | (6,796 | ) | (2,957 | ) | (1,829 | ) | |||||||||||
| Advance from affiliated entities |
— | — | — | 8,324 | 1,395 | |||||||||||||||
| Payable under loan securities agreement |
— | — | — | — | 36,255 | |||||||||||||||
| Repayment of payable under loan securities agreement |
— | — | — | (6,335 | ) | (13,305 | ) | |||||||||||||
| Other liabilities |
37 | — | 37 | — | — | |||||||||||||||
| Contribution from member |
— | — | — | — | 19,942 | |||||||||||||||
| Distributions to members |
— | (6,710 | ) | (6,710 | ) | — | (4,523 | ) | ||||||||||||
| Contributions from non-controlling interests |
— | 2,590 | 2,590 | — | — | |||||||||||||||
| Distributions to non-controlling interests |
— | (225 | ) | (225 | ) | — | — | |||||||||||||
| Syndication costs |
— | (209 | ) | (209 | ) | — | — | |||||||||||||
| Syndication costs allocated to non-controlling interests |
— | (121 | ) | (121 | ) | — | — | |||||||||||||
| Proceeds from shares sold, net of underwriting costs |
93,770 | — | 93,770 | — | — | |||||||||||||||
| Deferred offering costs |
(4,206 | ) | (433 | ) | (4,639 | ) | (655 | ) | (524 | ) | ||||||||||
| Deferred financing costs |
— | (1,316 | ) | (1,316 | ) | — | — | |||||||||||||
|
|
|
|
|
|
|
|
|
|
|
|||||||||||
| Net cash provided by (used in) financing activities |
27,125 | (2,395 | ) | 24,730 | (1,623 | ) | (75,795 | ) | ||||||||||||
|
|
|
|
|
|
|
|
|
|
|
|||||||||||
| Net increase (decrease) in cash and cash equivalents |
3,504 | 3,952 | 7,456 | (128 | ) | (6,431 | ) | |||||||||||||
| Cash and cash equivalents — beginning of period |
4,766 | 814 | 814 | 942 | 7,373 | |||||||||||||||
|
|
|
|
|
|
|
|
|
|
|
|||||||||||
| Cash and cash equivalents — end of period |
$ | 8,270 | $ | 4,766 | $ | 8,270 | $ | 814 | $ | 942 | ||||||||||
|
|
|
|
|
|
|
|
|
|
|
|||||||||||
(Continued)
100
Table of Contents
OFS Capital Corporation and Subsidiaries
Consolidated Statements of Cash Flows
(Amounts in thousands)
| Post-IPO as a Business Development Company |
Pre-IPO Prior to becoming a Business Development Company |
|||||||||||||||||||
| For the Period November 8, 2012 through December 31, 2012 |
For the Period January 1, 2012 through November 7, 2012 |
For the Year Ended December 31, 2012 |
For the Year Ended December 31, 2011 |
For the Year Ended December 31, 2010 |
||||||||||||||||
| Supplemental Disclosure of Cash Flow Information: |
||||||||||||||||||||
| Cash paid during the period for interest |
$ | 1,494 | $ | 3,092 | $ | 4,586 | $ | — | $ | 1,579 | ||||||||||
| Supplemental Disclosure of Noncash Financing and Investing Activities: |
||||||||||||||||||||
| Accrued deferred offering costs |
$ | — | $ | — | $ | — | $ | 3,078 | $ | 1,674 | ||||||||||
| Distribution payable |
1,628 | — | 1,628 | — | — | |||||||||||||||
| Equity contribution from member recognized due to the difference between the purchase price and fair value of the loan investment purchased from OFS Capital WM |
— | 1,227 | 1,227 | — | — | |||||||||||||||
| Equity interests received in connection with loan purchase and restructuring |
— | 539 | 539 | — | — | |||||||||||||||
| Reclasification of other liabilities to capital contribution from non-controlling interests |
— | 206 | 206 | — | — | |||||||||||||||
| Capital contribution from non-controlling interests via a reduction of management fee payable—related party |
— | 200 | 200 | — | — | |||||||||||||||
| Derecognition of payable under securities loan agreement under sale accounting |
— | — | — | 74,945 | — | |||||||||||||||
| Derecognition of loans receivable pledged to creditors under sale accounting |
— | — | — | 77,055 | — | |||||||||||||||
| Derecognition of interest receivable pledged to creditors under sale accounting |
— | — | — | 212 | — | |||||||||||||||
| Loans distributed from OFS Capital WM on June 30, 2011 |
— | — | — | 7,245 | — | |||||||||||||||
| Reduction of equity investments in OFS Capital WM as a result of the June 30, 2011 loan distributions |
— | — | — | 6,656 | — | |||||||||||||||
| Deferred fee revenue recognized s a result of the June 30, 2011 loan distributions |
— | — | — | 589 | — | |||||||||||||||
| Reclassification of deferred offering costs to other assets |
— | — | — | 13 | — | |||||||||||||||
| Loan principal collection due from OFS Capital WM as a result of the June 30, 2011 loan distributions |
— | — | — | 5 | — | |||||||||||||||
| Elimination of equity investment in OFS Capital WM and consolidation of assets and liabilities of OFS Capital WM effective March 30, 2012: |
||||||||||||||||||||
| Restricted cash and cash equivalents |
— | 623 | 623 | — | — | |||||||||||||||
| Interest receivable |
— | 920 | 920 | — | — | |||||||||||||||
| Investments, at fair value |
— | 197,765 | 197,765 | — | — | |||||||||||||||
| Deferred financing costs, net of accumulated amortization |
— | 2,637 | 2,637 | — | — | |||||||||||||||
| Revolving line of credit-Wells Fargo |
— | 134,123 | 134,123 | — | — | |||||||||||||||
| Revolving line of credit-Madison Capital |
— | 30,752 | 30,752 | — | — | |||||||||||||||
| Interest payable |
— | 1,647 | 1,647 | — | — | |||||||||||||||
| Management fee payable |
— | 314 | 314 | — | — | |||||||||||||||
| Due to affiliated entity |
— | 18 | 18 | — | — | |||||||||||||||
| Accrued expenses and other liabilities |
— | 132 | 132 | — | — | |||||||||||||||
| Deconsolidation of assets and liabilities of Tamarix LP and recording of an equity investment in Tamarix LP under the equity method of accounting effective July 27, 2012: |
||||||||||||||||||||
| Interest receivable and other assets |
— | 240 | 240 | — | — | |||||||||||||||
| Investments, at fair value |
— | 20,109 | 20,109 | — | — | |||||||||||||||
| Deferred financing costs, net of accumulated amortization |
— | 640 | 640 | — | — | |||||||||||||||
| Notes payable due to the SBA |
— | 14,000 | 14,000 | — | — | |||||||||||||||
| Management fee payable |
— | 427 | 427 | — | — | |||||||||||||||
| Accrued expenses and other liabilities |
— | 428 | 428 | — | — | |||||||||||||||
| Syndication costs |
— | (209 | ) | (209 | ) | — | — | |||||||||||||
| Non-controlling interests |
— | 2,383 | 2,383 | — | — | |||||||||||||||
(Continued)
101
Table of Contents
OFS Capital Corporation and Subsidiaries
Consolidated Statements of Cash Flows
(Amounts in thousands)
| Post-IPO as a Business Development Company |
Pre-IPO Prior to becoming a
Business Development Company |
|||||||||||||||||||
| For the Period November 8, 2012 through December 31, 2012 |
For the Period January 1, 2012 through November 7, 2012 |
For the Year Ended December 31, 2012 |
For the Year Ended December 31, 2011 |
For the Year Ended December 31, 2010 |
||||||||||||||||
| Supplemental Disclosure of Noncash Financing and Investing Activities: |
||||||||||||||||||||
| Loans distributed to member |
— | — | — | 8,588 | 67,248 | |||||||||||||||
| Reversal of loan loss reserve for loans distributed to member |
— | — | — | 314 | 6,736 | |||||||||||||||
| Adjustments to loan discounts and fees upon member loan distribution, net |
— | — | — | 534 | 143 | |||||||||||||||
| Equity Interests distributed to member |
— | — | — | 4,688 | 1,533 | |||||||||||||||
| Other assets distributed to member |
— | — | — | 189 | — | |||||||||||||||
| Equity interests received in connection with a newly originated loan |
— | — | — | 500 | — | |||||||||||||||
| Loans in exchange for equity interests during loan restructurings |
— | — | — | — | 12,708 | |||||||||||||||
| Reversal of loan loss reserve for loans exchanged for equity in loan restructurings |
— | — | — | — | 6,487 | |||||||||||||||
| Loan held for sale distributed to OFSAM on September 28, 2010 |
— | — | — | — | 1,860 | |||||||||||||||
| 100% equity interest in OFS Capital WM received as part of the consideration for loans transferred to OFS Capital WM on September 28, 2010 |
— | — | — | — | 57,343 | |||||||||||||||
| Reclassification of loans to loan held for sale |
— | — | — | — | 5,000 | |||||||||||||||
| Reversal of loan loss reserve for loan sold |
— | — | — | — | 459 | |||||||||||||||
See Notes to Consolidated Financial Statements.
102
Table of Contents
OFS Capital Corporation and Subsidiaries
Consolidated Schedule of Investments
December 31, 2012
(dollar amounts in thousands)
| Name of Portfolio Company |
Investment Type |
Interest |
Spread |
Maturity |
Principal |
Cost |
Fair |
Percent |
||||||||||||||||||||||
| Non-affiliate Investments (5) |
||||||||||||||||||||||||||||||
| Accounts Receivable Management Services |
| |||||||||||||||||||||||||||||
| Revspring Inc. |
Senior Secured Term Loan | 6.25 | % | (L +5.00 | %) | 08/03/17 | $ | 4,907 | $ | 4,868 | $ | 4,673 | 3.3 | % | ||||||||||||||||
|
|
|
|
|
|
|
|
|
|||||||||||||||||||||||
| Aerospace & Defense |
| |||||||||||||||||||||||||||||
| Whitcraft LLC |
Senior Secured Term Loan | 6.25 | % | (L +4.75 | %) | 12/16/15 | 4,565 | 4,514 | 4,440 | 3.1 | ||||||||||||||||||||
|
|
|
|
|
|
|
|
|
|||||||||||||||||||||||
| Asset Management & Custody Banks |
| |||||||||||||||||||||||||||||
| Townsend Acquisition LLC |
Senior Secured Term Loan | 6.25 | % | (L +4.75 | %) | 05/18/16 | 4,750 | 4,658 | 4,598 | 3.2 | ||||||||||||||||||||
|
|
|
|
|
|
|
|
|
|||||||||||||||||||||||
| Asset Management Services |
| |||||||||||||||||||||||||||||
| H.D. Vest, Inc. |
Senior Secured Term Loan | 7.00 | % | (L +5.50 | %) | 10/03/17 | 4,813 | 4,755 | 4,706 | 3.3 | ||||||||||||||||||||
|
|
|
|
|
|
|
|
|
|||||||||||||||||||||||
| Automobile |
| |||||||||||||||||||||||||||||
| BBB Industries, LLC |
Senior Secured Term Loan | 6.50 | % | (L +4.50 | %) | 06/29/13 | 4,713 | 4,704 | 4,671 | 3.3 | ||||||||||||||||||||
| Tectum Holdings Inc (Extang) |
Senior Secured Term Loan A | 7.50 | % | (L +5.25 | %) | 12/03/15 | 3,172 | 3,149 | 3,149 | 2.2 | ||||||||||||||||||||
|
|
|
|
|
|
|
|
|
|||||||||||||||||||||||
| 7,885 | 7,853 | 7,820 | 5.5 | |||||||||||||||||||||||||||
|
|
|
|
|
|
|
|
|
|||||||||||||||||||||||
| Automotive Aftermarket Manufacturing |
| |||||||||||||||||||||||||||||
| Trico Products Corporation |
Senior Secured Term Loan | 6.25 | % | (L +4.75 | %) | 07/22/16 | 4,685 | 4,632 | 3,798 | 2.7 | ||||||||||||||||||||
|
|
|
|
|
|
|
|
|
|||||||||||||||||||||||
| Beverage, Food and Tobacco |
| |||||||||||||||||||||||||||||
| Columbus Manufacturing, Inc. |
Senior Secured Term Loan B | 6.50 | % | (L +5.25 | %) | 04/17/18 | 4,000 | 3,942 | 3,942 | 2.8 | ||||||||||||||||||||
|
|
|
|
|
|
|
|
|
|||||||||||||||||||||||
| Broadcasting and Entertainment |
| |||||||||||||||||||||||||||||
| Lamont Digital Systems, Inc. |
Senior Secured Term Loan | 7.25 | % | (L +5.75 | %) | 10/23/17 | 4,661 | 4,549 | 4,549 | 3.2 | ||||||||||||||||||||
|
|
|
|
|
|
|
|
|
|||||||||||||||||||||||
| Busines Equipment & Services |
| |||||||||||||||||||||||||||||
| Dorner MFG, Corp. |
Senior Secured Term Loan | 6.25 | % | (L +4.75 | %) | 06/15/17 | 3,398 | 3,338 | 3,274 | 2.3 | ||||||||||||||||||||
| Tharpe Company, Inc. |
Senior Secured Term Loan | 7.00 | % | (L +5.75 | %) | 10/19/17 | 5,000 | 4,928 | 4,928 | 3.5 | ||||||||||||||||||||
|
|
|
|
|
|
|
|
|
|||||||||||||||||||||||
| 8,398 | 8,266 | 8,202 | 5.8 | |||||||||||||||||||||||||||
|
|
|
|
|
|
|
|
|
|||||||||||||||||||||||
| Chemical / Plastics |
| |||||||||||||||||||||||||||||
| Actagro, LLC |
Senior Secured Term Loan | 7.00 | % | (L +5.50 | %) | 12/30/16 | 1,950 | 1,925 | 1,920 | 1.4 | ||||||||||||||||||||
| Fluoro-Seal International LLC |
Senior Secured Term Loan A | 9.00 | % | (L +7.50 | %) | 01/04/17 | 2,964 | 2,930 | 3,024 | 2.1 | ||||||||||||||||||||
| ICM Products Inc |
Senior Secured Term Loan | 8.50 | % | (L +7.00 | %) | 02/01/17 | 2,406 | 2,368 | 2,406 | 1.7 | ||||||||||||||||||||
| VanDeMark Chemical Inc. |
Senior Secured Term Loan | 7.50 | % | (L +5.25 | %) | 11/30/17 | 3,015 | 2,956 | 2,956 | 2.1 | ||||||||||||||||||||
|
|
|
|
|
|
|
|
|
|||||||||||||||||||||||
| 10,335 | 10,179 | 10,306 | 7.3 | |||||||||||||||||||||||||||
|
|
|
|
|
|
|
|
|
|||||||||||||||||||||||
| Commercial Fastener Manufactuing |
| |||||||||||||||||||||||||||||
| Elgin Fasteners Group |
Senior Secured Term Loan | 7.00 | % | (L +5.50 | %) | 08/26/16 | 4,695 | 4,588 | 4,633 | 3.3 | ||||||||||||||||||||
|
|
|
|
|
|
|
|
|
|||||||||||||||||||||||
| Distributors |
||||||||||||||||||||||||||||||
| Phillips Feed & Pet Supply |
Senior Secured Term Loan | 7.50 | % | (L +5.25 | %) | 10/13/17 | 3,265 | 3,224 | 3,130 | 2.2 | ||||||||||||||||||||
| Diversified Foodservice Supply, Inc. |
Senior Secured Term Loan | 6.75 | % | (L +5.00 | %) | 01/27/16 | 4,580 | 4,536 | 4,508 | 3.2 | ||||||||||||||||||||
| Lindstrom Metric, LLC |
Senior Secured Term Loan | 6.26 | % | (L +4.75 | %) | 07/12/16 | 4,747 | 4,702 | 4,586 | 3.2 | ||||||||||||||||||||
|
|
|
|
|
|
|
|
|
|||||||||||||||||||||||
| 12,592 | 12,462 | 12,224 | 8.6 | |||||||||||||||||||||||||||
|
|
|
|
|
|
|
|
|
|||||||||||||||||||||||
| Diversified Commercial & Professional Services |
| |||||||||||||||||||||||||||||
| Kellermeyer Building Services, LLC |
Senior Secured Term Loan | 6.50 | % | (L +4.75 | %) | 12/17/15 | 4,609 | 4,546 | 4,511 | 3.2 | ||||||||||||||||||||
| Royal Adhesives |
Senior Secured Term Loan A | 7.25 | % | (L +5.50 | %) | 11/29/15 | 4,498 | 4,457 | 4,485 | 3.1 | ||||||||||||||||||||
|
|
|
|
|
|
|
|
|
|||||||||||||||||||||||
| 9,107 | 9,003 | 8,996 | 6.3 | |||||||||||||||||||||||||||
|
|
|
|
|
|
|
|
|
|||||||||||||||||||||||
| Diversified/Conglomerate Manufacturing |
| |||||||||||||||||||||||||||||
| Revere Industries, LLC |
Senior Secured Rollover Loans | 9.00 | % | (L +6.00 | %) | 06/30/13 | 1,889 | 1,891 | 1,895 | 1.3 | ||||||||||||||||||||
| Phillips Plastics |
Senior Secured Term Loan | 6.50 | % | (L +5.00 | %) | 02/12/17 | 1,707 | 1,673 | 1,649 | 1.2 | ||||||||||||||||||||
|
|
|
|
|
|
|
|
|
|||||||||||||||||||||||
| 3,596 | 3,564 | 3,544 | 2.5 | |||||||||||||||||||||||||||
|
|
|
|
|
|
|
|
|
|||||||||||||||||||||||
103
Table of Contents
OFS Capital Corporation and Subsidiaries
Consolidated Schedule of Investments-Continued
December 31, 2012
(dollar amounts in thousands)
| Name of Portfolio Company |
Investment Type |
Interest Rate (1) |
Spread Above Index (1) |
Maturity | Principal Amount |
Cost | Fair Value |
Percent of Net Assets |
||||||||||||||||||||||
| Non-affiliate Investments—Continued |
||||||||||||||||||||||||||||||
| Electrical Components & Equipment |
|
|||||||||||||||||||||||||||||
| B&B Electronics Manufacturing Company |
Senior Secured Term Loan A | 6.50 | % | (L +5.00 | %) | 04/04/15 | 2,905 | 2,870 | 2,858 | 2.0 | ||||||||||||||||||||
| Barcodes LLC |
Senior Secured Term Loan | 7.25 | % | (L +6.00 | %) | 11/02/17 | 3,089 | 3,044 | 3,044 | 2.1 | ||||||||||||||||||||
|
|
|
|
|
|
|
|
|
|||||||||||||||||||||||
| 5,994 | 5,914 | 5,902 | 4.1 | |||||||||||||||||||||||||||
|
|
|
|
|
|
|
|
|
|||||||||||||||||||||||
| Energy: Oil & Gas |
| |||||||||||||||||||||||||||||
| ANS Distributing, INC. |
Senior Secured Term Loan | 8.00 | % | (L +6.50 | %) | 11/01/17 | 3,250 | 3,187 | 3,187 | 2.2 | ||||||||||||||||||||
|
|
|
|
|
|
|
|
|
|||||||||||||||||||||||
| Environmental Consulting & Services |
| |||||||||||||||||||||||||||||
| Apex Companies, LLC. |
Senior Secured Term Loan | 7.50 | % | (L +5.75 | %) | 12/10/16 | 4,347 | 4,302 | 4,339 | 3.1 | ||||||||||||||||||||
|
|
|
|
|
|
|
|
|
|||||||||||||||||||||||
| Environmental Equipment Manufacturer |
| |||||||||||||||||||||||||||||
| JWC Environmental, LLC. |
Senior Secured Term Loan | 6.00 | % | (L +4.50 | %) | 08/03/16 | 4,441 | 4,407 | 4,245 | 3.0 | ||||||||||||||||||||
|
|
|
|
|
|
|
|
|
|||||||||||||||||||||||
| Environmental Industries |
| |||||||||||||||||||||||||||||
| Aero-Metric, Inc. |
Senior Secured Term Loan | 6.75 | % | (L +5.25 | %) | 08/27/17 | 2,819 | 2,780 | 2,737 | 1.9 | ||||||||||||||||||||
|
|
|
|
|
|
|
|
|
|||||||||||||||||||||||
| Financial Intermediaries |
| |||||||||||||||||||||||||||||
| Personable Holdings, Inc. |
Senior Secured Term Loan | 8.00 | % | (L +6.50 | %) | 05/16/17 | 3,785 | 3,745 | 3,841 | 2.7 | ||||||||||||||||||||
| CSI Financial Services, LLC |
Senior Secured Term Loan | 7.25 | % | (L +6.00 | %) | 12/07/17 | 3,485 | 3,425 | 3,425 | 2.4 | ||||||||||||||||||||
|
|
|
|
|
|
|
|
|
|||||||||||||||||||||||
| 7,270 | 7,170 | 7,266 | 5.1 | |||||||||||||||||||||||||||
|
|
|
|
|
|
|
|
|
|||||||||||||||||||||||
| Health Care Equipment |
| |||||||||||||||||||||||||||||
| NeuroTherm, Inc |
Senior Secured Term Loan | 6.50 | % | (L +5.00 | %) | 02/01/16 | 4,529 | 4,478 | 4,326 | 3.1 | ||||||||||||||||||||
| Hygenic Corporation |
Senior Secured Term Loan | 6.25 | % | (L +5.00 | %) | 10/11/18 | 5,000 | 4,928 | 4,928 | 3.5 | ||||||||||||||||||||
|
|
|
|
|
|
|
|
|
|||||||||||||||||||||||
| 9,529 | 9,406 | 9,254 | 6.6 | |||||||||||||||||||||||||||
|
|
|
|
|
|
|
|
|
|||||||||||||||||||||||
| Health Care Services |
| |||||||||||||||||||||||||||||
| Studer Group LLC |
Senior Secured Term Loan | 7.00 | % | (L +5.50 | %) | 09/28/16 | 4,604 | 4,551 | 4,538 | 3.2 | ||||||||||||||||||||
| MCMC LLC |
Senior Secured Term Loan A | 7.50 | % | (L +6.00 | %) | 09/30/16 | 4,635 | 4,581 | 4,627 | 3.3 | ||||||||||||||||||||
| Aegis Sciences Corporation |
Senior Secured Term Loan A | 7.00 | % | (L +5.50 | %) | 10/21/16 | 4,850 | 4,781 | 4,779 | 3.4 | ||||||||||||||||||||
| Elements Behavioral Health, Inc. |
Senior Secured Term Loan A | 7.50 | % | (L +6.00 | %) | 08/14/17 | 4,938 | 4,870 | 4,920 | 3.5 | ||||||||||||||||||||
|
|
|
|
|
|
|
|
|
|||||||||||||||||||||||
| 19,027 | 18,783 | 18,864 | 13.4 | |||||||||||||||||||||||||||
|
|
|
|
|
|
|
|
|
|||||||||||||||||||||||
| Health Care Supplies |
| |||||||||||||||||||||||||||||
| The Ritedose Corporation |
Senior Secured Term Loan | 6.50 | % | (L +4.75 | %) | 11/10/16 | 3,592 | 3,545 | 2,881 | 2.0 | ||||||||||||||||||||
|
|
|
|
|
|
|
|
|
|||||||||||||||||||||||
| Healthcare |
||||||||||||||||||||||||||||||
| Strata Pathology Services, Inc. |
Senior Secured Term Loan | 8.00 | % | (L +6.50 | %) | 06/30/16 | 4,874 | 4,811 | 4,202 | 3.0 | ||||||||||||||||||||
|
|
|
|
|
|
|
|
|
|||||||||||||||||||||||
| Healthcare Facilities |
| |||||||||||||||||||||||||||||
| Accelerated Health Systems LLC |
Senior Secured Term Loan | 7.25 | % | (L +5.75 | %) | 07/22/17 | 4,950 | 4,911 | 4,896 | 3.5 | ||||||||||||||||||||
|
|
|
|
|
|
|
|
|
|||||||||||||||||||||||
| High Tech Industries |
| |||||||||||||||||||||||||||||
| OnePath Systems, LLC |
Senior Secured Term Loan | 7.50 | % | (L +6.00 | %) | 06/06/17 | 2,438 | 2,395 | 2,431 | 1.7 | ||||||||||||||||||||
|
|
|
|
|
|
|
|
|
|||||||||||||||||||||||
| Household Products |
| |||||||||||||||||||||||||||||
| Phoenix Brands LLC |
Senior Secured Term Loan A | 7.00 | % | (L +5.50 | %) | 01/31/16 | 3,781 | 3,739 | 3,307 | 2.3 | ||||||||||||||||||||
|
|
|
|
|
|
|
|
|
|||||||||||||||||||||||
| Industrial Conglomerates |
| |||||||||||||||||||||||||||||
| Jameson LLC |
Senior Secured Term Loan | 9.52 | % | (L +7.50 | %) | 10/01/15 | 2,487 | 2,460 | 2,240 | 1.6 | ||||||||||||||||||||
|
|
|
|
|
|
|
|
|
|||||||||||||||||||||||
| Industrial Gases |
| |||||||||||||||||||||||||||||
| Engineered Controls International, LLC |
Senior Secured Term Loan | 6.50 | % | (L +4.75 | %) | 08/05/16 | 4,362 | 4,316 | 4,242 | 3.0 | ||||||||||||||||||||
|
|
|
|
|
|
|
|
|
|||||||||||||||||||||||
| Insurance |
| |||||||||||||||||||||||||||||
| Captive Resources Midco LLC |
Senior Secured Term Loan | 6.75 | % | (L +5.50 | %) | 10/31/18 | 4,987 | 4,915 | 4,915 | 3.5 | ||||||||||||||||||||
|
|
|
|
|
|
|
|
|
|||||||||||||||||||||||
104
Table of Contents
OFS Capital Corporation and Subsidiaries
Consolidated Schedule of Investments-Continued
December 31, 2012
(dollar amounts in thousands)
| Name of Portfolio Company |
Investment Type |
Interest |
Spread |
Maturity |
Principal |
Cost |
Fair |
Percent |
||||||||||||||||||||||
| Non-affiliate Investments—Continued |
||||||||||||||||||||||||||||||
| Insurance Brokerage |
| |||||||||||||||||||||||||||||
| Frenkel Benefits LLC |
Senior Secured Term Loan A | 6.25 | % | (L +5.00 | %) | 12/28/15 | 3,938 | 3,890 | 3,831 | 2.7 | ||||||||||||||||||||
| AssuredPartners Capital, Inc. |
Senior Secured Term Loan A | 6.50 | % | (L +5.25 | %) | 05/01/18 | 4,877 | 4,877 | 4,651 | 3.3 | ||||||||||||||||||||
| Cetera Financial Group, Inc. |
Senior Secured Term Loan A | 6.50 | % | (L +5.00 | %) | 06/22/17 | 4,875 | 4,854 | 4,699 | 3.3 | ||||||||||||||||||||
|
|
|
|
|
|
|
|
|
|||||||||||||||||||||||
| 13,690 | 13,621 | 13,181 | 9.3 | |||||||||||||||||||||||||||
|
|
|
|
|
|
|
|
|
|||||||||||||||||||||||
| North American Commodities Brokerage |
| |||||||||||||||||||||||||||||
| Charter Brokerage LLC |
Senior Secured Term Loan A | 8.00 | % | (L +6.50 | %) | 10/10/16 | 4,580 | 4,520 | 4,652 | 3.3 | ||||||||||||||||||||
|
|
|
|
|
|
|
|
|
|||||||||||||||||||||||
| Personal Products |
||||||||||||||||||||||||||||||
| MedTech Group, Inc. |
Senior Secured Term Loan | 7.00 | % | (L +5.50 | %) | 09/07/16 | 4,808 | 4,755 | 4,740 | 3.3 | ||||||||||||||||||||
| Mold-Rite Plastics, LLC |
Senior Secured Term Loan | 6.25 | % | (L +4.50 | %) | 06/30/16 | 4,527 | 4,477 | 4,379 | 3.1 | ||||||||||||||||||||
| Pacific World |
Senior Secured Term Loan | 7.00 | % | (L +5.50 | %) | 10/31/16 | 4,950 | 4,881 | 4,879 | 3.4 | ||||||||||||||||||||
|
|
|
|
|
|
|
|
|
|||||||||||||||||||||||
| 14,285 | 14,113 | 13,998 | 9.8 | |||||||||||||||||||||||||||
|
|
|
|
|
|
|
|
|
|||||||||||||||||||||||
| Printing & Publishing |
| |||||||||||||||||||||||||||||
| Pamarco Technologies, Inc. |
Senior Secured Revolver | N/A |
|
(L +3.75%) (Unused Fee 0.50%) |
|
12/31/14 | — | (8 | ) | (33 | )(2) | — | ||||||||||||||||||
| Pamarco Technologies, Inc. |
Senior Secured Term Loan A | 6.00 | % | (L +3.75 | %) | 12/31/14 | 2,885 | 2,871 | 2,821 | 2.0 | ||||||||||||||||||||
|
|
|
|
|
|
|
|
|
|||||||||||||||||||||||
| 2,885 | 2,863 | 2,788 | 2.0 | |||||||||||||||||||||||||||
|
|
|
|
|
|
|
|
|
|||||||||||||||||||||||
| Property & Casualty Insurance |
| |||||||||||||||||||||||||||||
| MYI Acquiror Limited |
Senior Secured Term Loan A | 6.25 | % | (L +4.75 | %) | 09/13/16 | 4,962 | 4,903 | 4,777 | 3.4 | ||||||||||||||||||||
|
|
|
|
|
|
|
|
|
|||||||||||||||||||||||
| Publishing |
||||||||||||||||||||||||||||||
| Media Source |
Senior Secured Term Loan B | 7.50 | % | (L +6.00 | %) | 11/07/16 | 3,496 | 3,440 | 3,502 | 2.5 | ||||||||||||||||||||
| Media Source |
Senior Secured Term Loan A | 6.75 | % | (L +5.25 | %) | 11/07/16 | 1,322 | 1,301 | 1,293 | 0.9 | ||||||||||||||||||||
|
|
|
|
|
|
|
|
|
|||||||||||||||||||||||
| 4,818 | 4,741 | 4,795 | 3.4 | |||||||||||||||||||||||||||
|
|
|
|
|
|
|
|
|
|||||||||||||||||||||||
| Rehabilitation Products and Services |
| |||||||||||||||||||||||||||||
| Behavioral Health Group |
Senior Secured Term Loan A | 5.75 | % | (L +4.50 | %) | 08/18/16 | 4,938 | 4,900 | 4,699 | 3.3 | ||||||||||||||||||||
|
|
|
|
|
|
|
|
|
|||||||||||||||||||||||
| Telecommunications |
| |||||||||||||||||||||||||||||
| ConvergeOne Holdings Corporation |
Senior Secured Term Loan A | 8.50 | % | (L +7.00 | %) | 06/08/17 | 2,340 | 2,320 | 2,387 | 1.7 | ||||||||||||||||||||
| NHR Holdings, LLC |
Senior Secured Term Loan A | 6.50 | % | (L +5.25 | %) | 11/30/18 | 2,483 | 2,446 | 2,446 | 1.7 | ||||||||||||||||||||
| NHR Holdings, LLC |
Senior Secured Term Loan B | 6.50 | % | (L +5.25 | %) | 11/30/18 | 2,517 | 2,480 | 2,480 | 1.7 | ||||||||||||||||||||
|
|
|
|
|
|
|
|
|
|||||||||||||||||||||||
| 7,340 | 7,246 | 7,313 | 5.1 | |||||||||||||||||||||||||||
|
|
|
|
|
|
|
|
|
|||||||||||||||||||||||
| Sub-total Non-affiliate Investments |
|
$ | 234,635 | $ | 231,781 | $ | 227,542 | 160.5 | % | |||||||||||||||||||||
|
|
|
|
|
|
|
|
|
|||||||||||||||||||||||
105
Table of Contents
OFS Capital Corporation and Subsidiaries
Consolidated Schedule of Investments-Continued
December 31, 2012
(dollar amounts in thousands)
| Name of Portfolio Company |
Investment Type |
Principal |
Cost |
Fair Value |
Percent |
|||||||||||||
| Affiliate Investments |
| |||||||||||||||||
| Finance |
||||||||||||||||||
| Tamarix Capital Partners, LP |
67.5% Limited Partnership Interest | N/A | 5,049 | 4,657 | 3.3 | |||||||||||||
|
|
|
|
|
|
|
|||||||||||||
| Sub-total Affiliate Investments |
5,049 | 4,657 | 3.3 | |||||||||||||||
|
|
|
|
|
|
|
|||||||||||||
| Money Market |
||||||||||||||||||
| WF Prime INVT MM #1752 |
Money Market | N/A | 2,450 | (3) | 2,450 | (3) | 1.7 | |||||||||||
| WFB Secured Institutional MM |
Money Market | N/A | 623 | (4) | 623 | (4) | 0.5 | |||||||||||
| US Bank Money Market Deposit Account |
Money Market | N/A | 3,030 | (3) | 3,030 | (3) | 2.1 | |||||||||||
|
|
|
|
|
|
|
|||||||||||||
| Sub-total Money Market |
6,103 | 6,103 | 4.3 | |||||||||||||||
|
|
|
|
|
|
|
|
|
|||||||||||
| Total Investments (United States) |
$ | 234,635 | $ | 242,933 | $ | 238,302 | 168.1 | % | ||||||||||
|
|
|
|
|
|
|
|
|
|||||||||||
| (1) | The majority of the investments bear interest at a rate that may be determined by reference to LIBOR (L) or Prime and which is reset daily, quarterly or semi-annually. For each investment, we have provided the spread over LIBOR and current interest rate in effect at December 31, 2012. Certain investments are subject to a LIBOR or Prime interest rate floor. |
| (2) | The negative fair value is the result of the unfunded commitment being valued below par. |
| (3) | Included in cash and cash equivalents on the consolidated balance sheets. |
| (4) | Included in restricted cash and cash equivalents on the consolidated balance sheets. |
| (5) | Pledged as collateral under the OFS Capital WM Credit Facility. |
See Notes to Consolidated Financial Statements.
106
Table of Contents
OFS Capital, LLC and Subsidiaries
Consolidated Schedule of Investments
December 31, 2011
(Amounts in thousands, except shares)
| Name of Portfolio Company |
Type of Investment |
Interest |
Maturity |
Principal |
Cost |
Fair |
Percent |
|||||||||||||||||||
| United States |
| |||||||||||||||||||||||||
| Debt Investments |
| |||||||||||||||||||||||||
| Aerospace & Defense |
||||||||||||||||||||||||||
| Malabar, Malabar Holding Company |
Senior Subordinated Note | 15.00 | %(1) | 5/21/2017 | $ | 4,863 | $ | 4,756 | $ | 4,756 | 8.7 | % | ||||||||||||||
|
|
|
|
|
|
|
|
|
|||||||||||||||||||
| 4,863 | 4,756 | 4,756 | 8.7 | |||||||||||||||||||||||
|
|
|
|
|
|
|
|
|
|||||||||||||||||||
| Personal, Food & Misc. |
||||||||||||||||||||||||||
| Tangible Software, Inc. |
Senior Secured Note | 14.00 | %(1) | 9/28/2016 | 9,963 | 9,267 | 9,809 | 17.9 | ||||||||||||||||||
|
|
|
|
|
|
|
|
|
|||||||||||||||||||
| 9,963 | 9,267 | 9,809 | 17.9 | |||||||||||||||||||||||
|
|
|
|
|
|
|
|
|
|||||||||||||||||||
| Sub-total Debt Investments |
14,826 | 14,023 | 14,565 | 26.6 | ||||||||||||||||||||||
|
|
|
|
|
|
|
|
|
|||||||||||||||||||
| United States |
| |||||||||||||||||||||||||
| Equity Investments |
| |||||||||||||||||||||||||
| Aerospace & Defense |
||||||||||||||||||||||||||
| Malabar, Malabar Holding Company |
Series A Preferred Stock | N/A | N/A | 1,494 | 1,955 | 1,955 | 3.6 | |||||||||||||||||||
|
|
|
|
|
|
|
|||||||||||||||||||||
| 1,955 | 1,955 | 3.6 | ||||||||||||||||||||||||
|
|
|
|
|
|
|
|||||||||||||||||||||
| Personal, Food & Misc. |
||||||||||||||||||||||||||
| Tangible Software, Inc. |
Class B Common Units in Energy Management and Security Solutions, LLC(2) | N/A | N/A | 1,485,000 | 500 | 664 | 1.2 | |||||||||||||||||||
|
|
|
|
|
|
|
|||||||||||||||||||||
| 500 | 664 | 1.2 | ||||||||||||||||||||||||
|
|
|
|
|
|
|
|||||||||||||||||||||
| Senior Secured Lending |
||||||||||||||||||||||||||
| OFS Capital WM, LLC |
Membership Interest | N/A | N/A | |
100% Membership Interest |
|
43,120 | 41,217 | 75.3 | |||||||||||||||||
|
|
|
|
|
|
|
|||||||||||||||||||||
| 43,120 | 41,217 | 75.3 | ||||||||||||||||||||||||
|
|
|
|
|
|
|
|||||||||||||||||||||
| Sub-total Equity Investments |
45,575 | 43,836 | 80.1 | |||||||||||||||||||||||
|
|
|
|
|
|
|
|||||||||||||||||||||
| Total Investments (United States) |
$ | 59,598 | $ | 58,401 | 106.7 | % | ||||||||||||||||||||
|
|
|
|
|
|
|
|||||||||||||||||||||
| (1) | Includes 2.5% PIK interest. |
| (2) | Energy Management and Security Solutions, LLC owns a 100% equity interest in Tangible Software, Inc. |
See Notes to Consolidated Financial Statements.
107
Table of Contents
OFS Capital Corporation and Subsidiaries
Notes to Consolidated Financial Statements
(Amounts in thousands, except share and per share data)
| Note 1. | Organization |
OFS Capital Corporation (“OFS Capital”, the “Company”, or “we”) is a Delaware corporation formed on November 7, 2012 and is an externally managed, closed-end, non-diversified management investment company. The Company has elected to be treated as a business development company (“BDC”) under the Investment Company Act of 1940, as amended (the “1940 Act”). In addition, for tax purposes, the Company will elect to be treated as a regulated investment company (“RIC”) under Subchapter M of the Internal Revenue Code of 1986, as amended (the “Code”).
From time to time, the term OFS Capital, the Company, or we may be used herein to refer to OFS Capital, individually, or OFS Capital and/or its subsidiaries either collectively or individually, as well as, with respect to all periods prior to the IPO date, OFS Capital, LLC.
On November 7, 2012, the Company priced its initial public offering (“IPO”) selling 6,666,667 shares of its common stock at a public offering price of $15 per share, raising $100 million in gross proceeds. Immediately prior to the IPO, on November 7, 2012, OFS Capital, LLC converted from a limited liability company to a corporation, as a result of which the sole membership interest held in OFS Capital, LLC by Orchard First Source Asset Management, LLC (“OFSAM”) prior to the conversion was exchanged for 2,912,024 shares of common stock in the Company.
On September 28, 2010, as a result of the OFS Capital WM Transaction (as defined and described in more detail in Note 3), OFS Capital, LLC became the 100% equity owner of OFS Capital WM, LLC (“OFS Capital WM”). On September 29, 2011, OFS Capital, LLC became the primary beneficiary in Tamarix Capital Partners, LP (F/K/A: Tamarix Financial Partners, LP, “Tamarix LP”), a variable interest entity (“VIE”) under the applicable provisions of Financial Accounting Standards Board (“FASB”) Accounting Standards Codification Topic 810, “Consolidation” (ASC Topic 810). On May 10, 2012, upon Tamarix LP’s receipt of a Small Business Investment Company (“SBIC”) license, OFS Capital, LLC became an approximately 68% limited partner in Tamarix LP (see Note 4 for more detail).
The Company’s investment strategy is to invest primarily in senior secured debt investments to middle-market companies and, to a lesser extent, junior capital, including mezzanine debt and preferred and common equity. The Company has entered into an investment advisory and management agreement with OFS Capital Management, LLC, under which the Investment Advisor manages the day-to-day operations of, and provides investment advisory services to, the Company (see Note 5 for more detail).
| Note 2. | Summary of Significant Accounting Policies |
Election to become a Business Development Company: The results of operations for 2012 are divided into two periods. The period from January 1, 2012 through November 7, 2012, reflects the Company’s results prior to operating as a BDC under the 1940 Act. The period from November 8, 2012 through December 31, 2012, reflects the Company’s operations as a BDC under the 1940 Act. Accounting principles used in the preparation of the consolidated financial statements beginning November 8, 2012 are different from those of prior periods and, therefore, the financial position and results of operations for those periods are not directly comparable. The primary difference in accounting principles relates to the carrying value of debt and equity investments. On November 7, 2012, the Company recorded a cumulative effect of accounting change of $348 as a result of its election to become a BDC – see corresponding section below for further discussion.
Cumulative Effect of Business Development Company Election
| Effect of recording equity investment in Tamarix LP at fair value |
$ | (348 | ) | |
|
|
|
108
Table of Contents
OFS Capital Corporation and Subsidiaries
Notes to Consolidated Financial Statements
(Amounts in thousands, except share and per share data)
| Note 2. | Summary of Significant Accounting Policies (Continued) |
Basis of Presentation: The consolidated financial statements of the Company have been prepared in accordance with generally accepted accounting principles in the United States of America (“GAAP”) and pursuant to the requirements for reporting on Form 10-K and Article 6 or 10 of Regulation S-X. In the opinion of management, the consolidated financial statements reflect all adjustments consisting only of normal recurring accruals and adjustments except: (1) OFS Capital’s consolidation of the financial statements of OFS Capital WM effective March 30, 2012 (see Note 3); (2) cumulative effect of accounting change to convert from cost to fair value accounting on Tamarix LP’s portfolio investments effective May 10, 2012, as a result of Tamarix LP’s receipt of the SBIC license and conversion to an investment company (see Other cumulative effect of accounting change prior to become a BDC section below); (3) deconsolidation of the financial statements of Tamarix LP effective July 27, 2012 (see Note 4), (4) cumulative effect of accounting change to convert to a BDC effective November 7, 2012 (see Election to become a Business Development Company section above), and (5) the sale accounting treatment of the OFS Capital WM Transaction effective February 23, 2011 (see Note 3), which are, in the opinion of management, necessary to fairly state the operating results for the respective periods. All intercompany balances and transactions have been eliminated. Certain prior period amounts have been reclassified to conform to the current period presentation.
Principles of consolidation: The Company’s December 31, 2012 consolidated financial statements include the accounts of the Company and its wholly owned subsidiaries, OFS Capital WM and OFS Funding, LLC. The Company consolidates an affiliated subsidiary if it owns more than 50 percent of the subsidiary’s equity and holds the controlling financial interest in such subsidiary. The Company also consolidates a VIE if it is the primary beneficiary in the VIE. Effective March 30, 2012, the Company consolidated the financial statements of OFS Capital WM into its own (see Note 3). Effective July 27, 2012, the Company deconsolidated the financial statements of Tamarix LP from its own (see Note 4).
Other cumulative effect of accounting change prior to become a BDC: Equity contributions made by potential investors in Tamarix LP prior to issuance of the SBIC license on May 10, 2012 were contingent upon receipt of the SBIC license, and were fully refundable in the event that Tamarix LP failed to obtain such license. As a result, prior to May 10, 2012, Tamarix LP was not deemed to be an investment company and accordingly, followed the same accounting principles as its primary beneficiary, OFS Capital, to account for its loans receivable at cost, and its equity interests under the cost method of accounting, on the consolidated financial statements of OFS Capital. On May 10, 2012, upon receipt of the SBIC license, Tamarix LP was deemed to be an investment company under Accounting Standards Codification 946, “Financial Services – Investment Companies” (“ASC Topic 946”), and began reporting its investment assets at fair value. Accordingly, effective May 10, 2012, Tamarix LP changed its accounting principle from cost to fair value for measuring its portfolio investments, and recorded a cumulative effect of accounting change in the amount of $570 to reflect the difference between the fair value and cost basis of its portfolio investments at May 10, 2012.
The cumulative effect of accounting change at May 10, 2012 reflects the effect of Tamarix LP’s conversion to an investment company as follows:
Cumulative Effect of Conversion to an Investment Company
| Effect of recording loans at fair value |
$ | 211 | ||
| Effect of recording equity investments at fair value |
140 | |||
| Elimination of allowance for loan losses |
219 | |||
|
|
|
|||
| $ | 570 | |||
|
|
|
109
Table of Contents
OFS Capital Corporation and Subsidiaries
Notes to Consolidated Financial Statements
(Amounts in thousands, except share and per share data)
| Note 2. | Summary of Significant Accounting Policies (Continued) |
Fair value of financial instruments: The Company applies fair value to substantially all of its financial instruments in accordance with Accounting Standards Codification Topic 820, “Fair Value Measurements and Disclosures” (“ASC Topic 820”). ASC Topic 820 defines fair value, establishes a framework used to measure fair value and requires disclosures for fair value measurements. In accordance with ASC Topic 820, the Company has categorized its financial instruments carried at fair value, based on the priority of the valuation technique, into a three level fair value hierarchy. Fair value is a market-based measure considered from the perspective of the market participant which holds the financial instrument rather than an entity specific measure. Therefore, when market assumptions are not readily available, the Company’s own assumptions are set to reflect those that management believes market participants would use in pricing the financial instrument at the measurement date.
The availability of observable inputs can vary depending on the financial instrument and is affected by a wide variety of factors, including, for example, the type of product, whether the product is new, whether the product is traded on an active exchange or in the secondary market, and the current market conditions. To the extent that the valuation is based on models or inputs that are less observable or unobservable in the market, the determination of fair value requires more judgment. Accordingly, the degree of judgment exercised by the Company in determining fair value is greatest for financial instruments classified as Level 3 (i.e., those instruments valued using non-observable inputs).
Changes to the valuation policy are reviewed by management and the Company’s board of directors (the “Board”) to confirm that the changes are justified. As markets change, new products develop and the pricing for products becomes more or less transparent, the Company will continue to refine its valuation methodologies.
Use of estimates: The preparation of the consolidated financial statements in conformity with GAAP requires management to make estimates and assumptions that affect the reported amounts of assets and liabilities and disclosure of contingent assets and liabilities at the date of the consolidated financial statements and the reported amounts of revenues and expenses during the reporting period. Actual results could differ from those estimates.
Reporting segments: In accordance with segment guidance set by Accounting Standards Codification 280, “Segment Reporting” (“ASC Topic 280”), the Company has determined that it has a single reporting segment and operating unit structure.
Cash and cash equivalents: Cash and cash equivalents consist of cash and highly liquid investments not held for resale with original maturities at the time of acquisition of three months or less. The Company places its cash in financial institutions and at times, such balances may be in excess of the Federal Deposit Insurance Corporation insurance limits.
Restricted cash and cash equivalents: Restricted cash and cash equivalents represent amounts maintained in the Unfunded Exposure Account of OFS Capital WM as defined by the Loan Sale Agreement and other applicable transaction documents and are subject to the lien of the trustee for the benefit of the secured parties of OFS Capital WM (see Note 3). Proceeds in the Unfunded Exposure Account, along with advances under the OFS Capital WM Credit Facility (see Note 10), are utilized to fund an eligible loan owned by OFS Capital WM that has an unfunded revolving commitment.
Investments and related investment income: Investments are recorded at fair value. The Company’s Board determines the fair value of its portfolio investments. The determination of the fair value of the portfolio investments includes an analysis of the value of any unfunded loan commitments. Interest income is accrued
110
Table of Contents
OFS Capital Corporation and Subsidiaries
Notes to Consolidated Financial Statements
(Amounts in thousands, except share and per share data)
| Note 2. | Summary of Significant Accounting Policies (Continued) |
based upon the outstanding principal amount and contractual interest terms of debt investments. The Company accrues interest income until certain events take place, which may place a loan into a non-accrual status. Premiums, discounts and origination fees are amortized or accreted into interest income over the life of the respective debt investment. As of December 31, 2012, unamortized discounts and origination fees on debt investments amounted to $2,854. For the period November 8, 2012 through December 31, 2012, the period January 1, 2012 through November 7, 2012, and the years ended December 31, 2011 and 2010, the Company recognized net loan origination fee income of $185, $861, $170, and $448, respectively.
For investments with contractual payment-in-kind interest (“PIK”), which represent contractual interest accrued and added to the principal balance that generally becomes due at maturity (or at some other stipulated date), the Company will not accrue PIK interest if the portfolio company valuation indicates that the PIK interest is not collectible. For the period November 8, 2012 through December 31, 2012, the period January 1, 2012 through November 7, 2012, and the years ended December 31, 2011 and 2010, the Company recognized PIK interest in the amount of $0, $193, $111, and $451, respectively. Investment transactions are accounted for on a trade-date basis. Realized gains or losses on investments are measured by the difference between the net proceeds from the disposition and the cost basis of investment, without regard to unrealized gains or losses previously recognized. The Company reports changes in fair value of investments that are measured at fair value as a component of the net changes in unrealized appreciation (depreciation) on non-affiliate investments or unrealized depreciation on affiliate investments in the consolidated statement of operations.
Non-accrual loans: Loans on which the accrual of interest income has been discontinued are designated as non-accrual loans, and further designated as either non-accrual cash method or non-accrual cost recovery method. Loans are generally placed on non-accrual when a loan either: (i) is delinquent for 90 days or more on principal or interest based on contractual terms of the loan (unless well secured and in the process of collection), or (ii) in the opinion of the Company’s management, there is reasonable doubt about the collectability. When loans are placed on non-accrual status, all interest previously accrued but not collected is reversed against current period interest income. Interest payments received on non-accrual loans may be recognized as income or applied to principal depending upon management’s judgment. Interest accruals are resumed on non-accrual loans only when they are brought current with respect to interest and principal and when, in the judgment of management, the loans are estimated to be fully collectible as to all principal and interest. There were no non-accrual loans at December 31, 2012 and 2011.
Loans receivable: Prior to the Company’s election to become a BDC, loans receivable were recorded at unpaid principal balance less allowance for loan losses and net unamortized deferred loan origination fees and costs, or at adjusted cost if charge-offs had been applied on a specific loan basis.
Allowances for loan losses: Prior to the Company’s election to become a BDC, the allowance for loan losses represented management’s estimate of probable losses inherent in the loan portfolio as of the balance sheet date. When determining the adequacy of the allowance for loan losses, the following factors were considered: historical internal experience and current industry conditions, economic conditions and trends, credit quality trends and other factors deemed relevant. Additions to the allowance were charged to current period earnings through the provision for loan losses. Periodically, management might determine that it was appropriate to charge-off a portion of an existing loan. Upon the resolution of a loan that had remaining outstanding amounts that had been reserved for and were determined to be uncollectible, such amounts were charged off directly against the allowance for loan losses. To the extent that an amount was not reserved, then this amount was charged off through the provision for loan losses on the consolidated statement of operations.
111
Table of Contents
OFS Capital Corporation and Subsidiaries
Notes to Consolidated Financial Statements
(Amounts in thousands, except share and per share data)
| Note 2. | Summary of Significant Accounting Policies (Continued) |
The allowance for loan losses consisted of two components, a general reserve component and a specific reserve component. The general component of the allowance for loan losses was determined in accordance with Statement of Financial Accounting Standards (SFAS) No. 5, “Accounting for Contingencies” (ASC Topic 450). The general component represented a company’s estimate of losses inherent, but unidentified, in its portfolio as of the balance sheet date. The general component of the allowance for loan losses was estimated based upon a review of the loan portfolio’s risk characteristics and analysis of the loans in the portfolio to arrive at an estimated probability of default and estimated severity of loss based, among other things, on loan type, internal risk rating, and overall consideration of general economic conditions and trends. The specifically allocated component of the allowance for loan losses was generated from individual loans that were impaired and was determined in accordance with Accounting Standards Codification 310, “Receivables” (“ASC Topic 310”). The Company considered a loan to be impaired when, based on current information and events, it believed it was probable that it would be unable to collect all contractual principal and interest amounts due on the loan.
Loan origination fees and costs: Prior to the Company’s election to become a BDC, loan origination fees and costs were deferred, recorded as part of loans receivable and amortized over the life of the loan as an adjustment to the yield in interest income. On February 23, 2011, under the sale accounting treatment, as a result of the OFS Capital WM Transaction (see Note 3), the Company wrote off all unamortized loan origination fees and costs on loans sold to OFS Capital WM in the net amount of $283. On June 30, 2011, in connection with the loan distribution by OFS Capital WM to the Company, the Company recorded deferred revenue in the amount of $589. As of December 31, 2011, unamortized loan origination fees and costs were $803.
Income taxes: The Company will elect to be treated as a RIC under Subchapter M of the Code and operates in a manner so as to qualify for the tax treatment applicable to RICs. In order to qualify as a RIC, among other things, the Company is required to meet certain source of income and asset diversification requirements and timely distribute to its stockholders at least 90% of investment company taxable income, as defined by the Code, for each year. The Company has made, and intends to continue to make, the requisite distributions to its stockholders, which will generally relieve the Company from U.S. federal income taxes with respect to all income distributed to its stockholders.
Depending on the level of taxable income earned in a tax year, the Company may choose to retain taxable income in excess of current year dividend distributions into the next tax year in an amount less than what would trigger payments of federal income tax under subchapter M of the Code. The Company would then pay a 4% excise tax on such income, as required. To the extent that the Company determines that its estimated current year annual taxable income may exceed estimated current year dividend distributions, the Company accrues excise tax, on estimated excess taxable income as taxable income is earned. For the period November 8, 2012 through December 31, 2012, the Company recorded $63 of U.S. federal excise tax, which was accrued for at December 31, 2012.
The Company accounts for income taxes in conformity with Accounting Standards Codification 740, “Income Taxes” (“ASC Topic 740”). ASC Topic 740 provides guidelines for how uncertain tax positions should be recognized, measured, presented and disclosed in financial statements. ASC Topic 740 requires the evaluation of tax positions taken in the course of preparing the Company’s tax returns to determine whether the tax positions are “more-likely-than-not” to be sustained by the applicable tax authority. Tax benefits of positions not deemed to meet the more-likely-than-not threshold would be recorded as a tax expense in the current year. It is the Company’s policy to recognize accrued interest and penalties related to uncertain tax benefits in income tax expense. There were no material uncertain income tax positions at December 31, 2012 and 2011. The current and prior three tax years remain subject to examination by U.S. federal and most state tax authorities.
112
Table of Contents
OFS Capital Corporation and Subsidiaries
Notes to Consolidated Financial Statements
(Amounts in thousands, except share and per share data)
| Note 2. | Summary of Significant Accounting Policies (Continued) |
Prior to the Company’s election to become a BDC, the Company, as a limited liability company, did not record a provision for federal income taxes or deferred tax benefits because its income was taxable to its member. Therefore, no federal or state income tax provision had been recorded for the period January 1, 2012 through November 7, 2012 and the years ended December 31, 2011 and 2010.
Dividends and distributions: Dividends and distributions to common stockholders are recorded on the declaration date. The amount to be paid out as a dividend or distribution is determined by the Board each quarter and is generally based upon the earnings estimated by management. Net realized capital gains, if any, are distributed at least annually, although the Company may decide to retain such capital gains for investment.
The Company has adopted a dividend reinvestment plan (“DRIP”) that provides for reinvestment of any distributions the Company declares in cash on behalf of its stockholders, unless a stockholder elects to receive cash. As a result, if the Board authorizes and the Company declares a cash distribution, then stockholders who have not “opted out” of the DRIP will have their cash distribution automatically reinvested in additional shares of the Company’s common stock, rather than receiving the cash dividend.
The Company may use newly issued shares under the guidelines of the DRIP, or the Company may purchase shares in the open market in connection with the obligations under the plan.
On November 26, 2012, the Company declared an initial dividend of $0.34 per share for the quarter ending December 31, 2012, which was proportionately reduced to $0.17 per share to reflect the number of days remaining in such quarter after the completion of the Company’s IPO, payable on January 31, 2013 to stockholders of record as of the close of business on January 17, 2013. The total amount of the dividend was $1,628 and reflected as dividend payable on the Company’s accompanying consolidated balance sheet as of December 31, 2012.
Deferred offering costs: The Company defers costs related to its public offering until completion of the offering. These costs include professional fees, registration costs, printing, and other miscellaneous offering costs. Deferred offering costs are charged against the proceeds from equity offerings when received. The Company incurred total deferred offering costs of $5,795 related to its IPO, which was charged against the gross proceeds from the IPO on November 7, 2012.
Deferred financing closing costs: Deferred financing costs represent fees and other direct incremental costs incurred in connection with the Company’s borrowings. These amounts are amortized over the estimated average life of the borrowings. As of December 31, 2012, unamortized deferred financing costs recorded by OFS Capital WM amounted to $2,839. For the period November 8, 2012 through December 31, 2012, and the period April 1, 2012 through November 7, 2012, the Company recorded amortization expense of $127 and $345, respectively, on its deferred financing costs.
Equity investments: Historically, the Company had received various equity ownership interests from its borrowers as partial consideration for loan modifications or restructurings or from exercising its rights under various loan documents. The Company applied foreclosure accounting and recorded these equity interests at fair value at the time of the loan restructurings. Prior to the Company’s election to become a BDC, equity interests were reviewed subsequently for potential impairment. There were no such equity interests at December 31, 2012 and 2011.
113
Table of Contents
OFS Capital Corporation and Subsidiaries
Notes to Consolidated Financial Statements
(Amounts in thousands, except share and per share data)
| Note 2. | Summary of Significant Accounting Policies (Continued) |
In connection with certain lending arrangements, the Company may receive warrants to purchase shares of stock from the borrowers. Because the warrant agreements typically contain net exercise or “cashless” exercise provisions, the warrants qualify as derivative instruments under Accounting Standards Codification 815, “Derivatives and Hedging” (“ASC Topic 815”). Such warrants are considered loan fees and are recorded as unearned loan income on the grant date. The unearned income is recognized as interest income over the contractual life of the related loan in accordance with the Company’s income recognition policy. As such warrants held are deemed to be derivative, they are periodically measured at fair value. Any adjustment to fair value is recorded through earnings as net unrealized gain or loss on warrants. For the year ended December 31, 2011, the Company recognized an unrealized loss on warrants in the amount of $156, and for the year ended December 31, 2010, the Company recognized an unrealized gain on warrants in the amount of $19. For the period November 8, 2012 through December 31, 2012, and the period January 1, 2012 through November 7, 2012, the Company did not recognize any unrealized gain or loss on warrants.
For the three months ended March 31, 2012, and the years ended December 31, 2011 and 2010, under the equity method of accounting, the Company’s 100% share of the net income or loss of OFS Capital WM was included in “Income (loss) from equity interests in OFS Capital WM” in the consolidated statements of operations. Commencing with the execution of the WM 2012 Loan Amendment, effective April 1, 2012, OFS Capital consolidated the statement of operations of OFS Capital WM into its own.
In September and November 2011, in connection with its loan originations, Tamarix LP received a 14.9% LLC membership interest in one borrower and a 19.8% preferred stock ownership interest in another borrower which were valued at $500 and $1,955, respectively, at the date of the respective loan origination. The Company applied cost method of accounting to these equity interests until May 10, 2012, when Tamarix LP became an investment company and adopted fair value accounting on its portfolio investments
Effective July 27, 2012, the Company deconsolidated the financial statements of Tamarix LP from its own, and adopted the equity method of accounting to account for its investment in Tamarix LP (see Note 4). Accordingly, commencing July 27, 2012 through November 7, 2012, the Company’s share of the net income or loss of Tamarix LP was included in “Income from Tamarix LP” in the consolidated statements of operations under the equity method of accounting. Commencing November 8, 2012, upon the Company’s election to become a BDC, the Company accounts for its equity investment in Tamarix LP at fair value.
Interest income on loans receivable: Interest on loans receivable was credited to income as earned. Interest receivable was accrued only if deemed collectible. The Company would accrue interest income until certain events took place, which might place a loan into a non-accrual status. For loans with contractual payment-in-kind interest, which represented contractual interest accrued and added to the principal balance that generally became due at maturity, the Company would not accrue payment-in-kind interest if the portfolio company valuation indicated that the payment-in-kind interest was not collectible.
Interest expense: Interest expense is recognized on the accrual basis.
Syndication costs: Costs incurred in the private placement offering of Tamarix LP’s interests were charged against partners’ capital as incurred.
Organization costs: Costs incurred in organizing Tamarix LP were expensed as incurred and are included in general and administrative expenses on the Company’s consolidated statements of operations.
114
Table of Contents
OFS Capital Corporation and Subsidiaries
Notes to Consolidated Financial Statements
(Amounts in thousands, except share and per share data)
| Note 2. | Summary of Significant Accounting Policies (Continued) |
Concentration of credit risk: Financial instruments that potentially subject the Company to concentrations of credit risk consist principally of cash deposits at financial institutions. At various times during the year, the Company may exceed the federally insured limits. To mitigate this risk, the Company places cash deposits only with high credit quality institutions. Management believes the risk of loss is minimal.
Recent accounting pronouncements: In April 2011, the FASB issued ASU 2011-03, Transfers and Servicing (Topic 860) Reconsideration of Effective Control for Repurchase Agreements (ASU 2011-03). The amendments in this update apply to all entities, both public and nonpublic. The amendments affect all entities that enter into agreements to transfer financial assets that both entitle and obligate the transferor to repurchase or redeem the financial assets before their maturity. The amendments do not affect other transfers of financial assets. The amendments in this update remove from the assessment of effective control (1) the criterion requiring the transferor to have the ability to repurchase or redeem the financial assets on substantially the agreed terms, even in the event of default by the transferee, and (2) the collateral maintenance implementation guidance related to that criterion. The guidance in this update is effective for the first interim or annual period beginning on or after December 15, 2011. The guidance should be applied prospectively to transactions or modifications of existing transactions that occur on or after the effective date. Early adoption was not permitted. The adoption of this guidance did not have a material effect on the Company’s consolidated financial statements.
In May 2011, the FASB issued ASU No. 2011-04, Fair Value Measurement (Topic 820): Amendments to Achieve Common Fair Value Measurement and Disclosure Requirements in U.S. GAAP and IFRSs (ASU 2011-04). This ASU represents the converged guidance of the FASB and the IASB (the Boards) on fair value measurement. The collective efforts of the Boards and their staffs, reflected in ASU 2011-04, have resulted in common requirements for measuring fair value and for disclosing information about fair value measurements, including a consistent meaning of the term “fair value” and enhanced disclosure requirements for investments that do not have readily determinable fair values. The Boards have concluded the common requirements will result in greater comparability of fair value measurements presented and disclosed in financial statements prepared in accordance with U.S. GAAP and IFRS. The amendments to the FASB Codification in this ASU are to be applied prospectively. For public entities, the amendments are effective during interim and annual periods beginning after December 15, 2011. Early application by public entities was not permitted. The adoption of this guidance did not have a material effect on the Company’s consolidated financial statements.
| Note 3. | OFS Capital WM |
OFS Capital WM Transaction
On September 28, 2010, OFS Capital entered into a Loan Sale Agreement with OFS Capital WM, pursuant to which OFS Capital transferred eligible loans or its 100% participating interest in certain loans as defined by the agreement (“Eligible Loans”) with $96,906 in principal to OFS Capital WM in exchange for cash of $36,255 and a 100% ownership interest in OFS Capital WM (“OFS Capital WM Transaction”).
The OFS Capital WM Transaction was a true sale for legal purposes. Under the Loan Sale Agreement and other applicable transaction documents between the Company and OFS Capital WM (collectively, the “Loan Documents”), dated September 28, 2010, OFS Capital is not permitted to revoke the sale. Wells Fargo Delaware Trust Company, N.A., acts as the trustee for the benefit of the lenders under the credit facility that forms part of the Loan Documents. The Eligible Loans are pledged by OFS Capital WM to the trustee for the benefit of the lenders. OFS Capital is not entitled or obligated to repurchase or redeem the Eligible Loans, other than a
115
Table of Contents
OFS Capital Corporation and Subsidiaries
Notes to Consolidated Financial Statements
(Amounts in thousands, except share and per share data)
| Note 3. | OFS Capital WM (Continued) |
customary obligation to repurchase loans for breach of representations and warranties with respect to the eligibility of such loans. In addition, OFS Capital had the right, at its option, to purchase loans then owned by OFS Capital WM, at fair value, subject to a 20% purchase and substitution limit as prescribed in the Loan Documents (the “Call Right”).
OFS Capital accounted for the OFS Capital WM Transaction as a secured borrowing in accordance with the relevant provisions under ASC Topic 860 (Transfers and Servicing). Accordingly, on September 28, 2010, OFS Capital reclassified the loans it transferred to OFS Capital WM to loans receivable pledged to creditors on its consolidated balance sheet. In addition, on September 28, 2010, in consideration for the cash and 100% equity interest in OFS Capital WM, the Company recorded a corresponding payable under securities loan agreement.
Effective February 23, 2011, the Company amended the Loan Documents pursuant to which the Call Right and certain other rights of OFS Capital were removed. This amendment was entered into to ensure that the original intent of the parties to treat the OFS Capital WM Transaction as a true sale for both legal and accounting purposes was satisfied and to eliminate any provision that may be interpreted as contrary to that intent. For the period January 1, 2011 through February 23, 2011, OFS Capital recognized interest income on loans pledged to creditors in the amount of $831 and recorded interest expense of $831 on the payable under securities loan agreement for the same period. On February 23, 2011, as a result of the amendment to the Loan Documents, under the sale accounting treatment, the Company derecognized the loans pledged to creditors in the carrying value of $75,621 (net of loan loss allowance of $1,151 and net deferred revenue of $283), interest receivable pledged to creditors in the amount of $213, and the payable under securities agreement in the amount of $74,945. The difference between the receivables pledged to creditors and payable under securities agreement, was recognized as a loss from the sale in the amount of $889.
Consolidation of OFS Capital WM
OFS Capital WM is a wholly owned subsidiary of OFS Capital formed in August 2010 with the limited purpose of holding, acquiring, managing and financing senior secured loan investments to middle-market companies in the United States. Prior to March 30, 2012, the Company determined that OFS Capital WM was a VIE of OFS Capital under the applicable provisions of ASC Topic 810. OFS Capital, as the owner of 100% of the equity of OFS Capital WM, has the obligation to absorb losses and the right to receive benefits, either of which could be significant to the VIE. However, prior to March 30, 2012, despite its 100% equity interest in OFS Capital WM, OFS Capital was not the primary beneficiary of OFS Capital WM as OFS Capital lacked the power, through voting interests or similar rights, to direct the activities of OFS Capital WM that most significantly impact its economic performance. The Company had concluded that MCF Capital Management, LLC (the “Loan Manager”) was the primary beneficiary of OFS Capital WM, because (1) under the terms of the loan facility of OFS Capital WM, the Loan Manager had the sole authority to service, administer and exercise rights and remedies in respect of the assets in OFS Capital WM’s portfolio; (2) the Loan Manager had the sole authority to determine whether to cause assets to be sold or acquired by OFS Capital WM, subject to certain limited circumstances where the Company had consent rights, as administrative manager of OFS Capital WM; (3) OFS Capital, as the administrative manager of OFS Capital WM, carried out duties of OFS Capital WM primarily limited to administrative matters, and (4) for its service, the Loan Manager receives a fee. The Company had determined the Loan Manager’s right to receive a loan management fee from OFS Capital WM, the interest of its related party in the class B loans of OFS Capital WM, and the implicit financial responsibility of the Loan Manager to ensure the VIE operates as designed were significant to OFS Capital WM. Since the Loan Manager was the primary beneficiary of OFS Capital WM, prior to March30, 2012, the Company did not consolidate the financial statements of OFS Capital WM but instead accounted for its ownership interest under the equity method of accounting.
116
Table of Contents
OFS Capital Corporation and Subsidiaries
Notes to Consolidated Financial Statements
(Amounts in thousands, except share and per share data)
| Note 3. | OFS Capital WM (Continued) |
Through March 30, 2012, OFS Capital WM’s loan portfolio was essentially fully funded, which makes future management activities a critical component to ensure satisfactory credit quality and profitability of OFS Capital WM’s loan portfolio. Effective March 30, 2012, OFS Capital entered into an agreement with OFS Capital WM and the Loan Manager to amend the credit facility of OFS Capital WM (WM 2012 Loan Amendment), as a result of which, (1) instead of the Loan Manager having the sole authority to determine actions on any proposed amendment, modification, restructuring, and waiver of loans, the Loan Manager is required to consult with OFS Capital before taking any such actions with a borrower; (2) instead of the Loan Manager having the sole authority to call or waive any default with respect to any loan, the Loan Manager is required to consult with OFS Capital before taking any such actions with a borrower, and (3) instead of the Loan Manager having the sole authority to vote to accelerate the maturity of any loan, the Loan Manager is required to consult with OFS Capital before taking any such actions with a borrower. If OFS Capital indicates in writing that it is dissatisfied with any actions in respect of the foregoing ultimately taken by the Loan Manager, pursuant to the WM 2012 Loan Amendment, the Loan Manager may pursue the course of action which it has recommended; however, the Loan Manager will also be obligated to promptly engage a third party broker/dealer to sell the loan in question, with OFS Capital possessing the sole right to negotiate and approve the terms of any such sale transaction (including price), as well as the sole right to terminate any loan sale discussions and to block any prospective loan sale. In consideration for the rights received as a result of the WM 2012 Loan Amendment, OFS Capital agreed to give up a right of first refusal that it possessed with respect to future transactions substantially similar to the OFS Capital WM Transaction that the Loan Manager and/or its affiliates may seek to conduct with third parties.
The WM 2012 Loan Amendment granted OFS Capital significant participating rights. Additionally, owing to: (1) the significant repayment since September 28, 2010 of the preponderant portion of the loans transferred to OFS Capital WM on that date and over which OFS Capital did not have the right to consent to, or withhold consent from, loan purchase or sale recommendations made by the Loan Manager, as well as (2) the nearly full ramping and funding of OFS Capital WM’s loan portfolio as of March 2012, OFS Capital now has the right to consent to, or withhold consent from, purchase or sale recommendations made by the Loan Manager with respect to a very high percentage of loans in the OFS Capital WM loan portfolio. Therefore, effective March 30, 2012, OFS Capital possessed the power to direct the activities of OFS Capital WM that most significantly impact OFS Capital WM’s economic performance. This resulted in OFS Capital’s succeeding to the controlling financial interest in OFS Capital WM, OFS Capital WM’s discontinuation as a VIE, and OFS Capital’s consolidation of OFS Capital WM, effective March 30, 2012.
The following pro forma presentation assumes OFS Capital’s consolidation of OFS Capital WM took place on January 1, 2012, 2011 and 2010, respectively, and shows the pro forma effect on income (loss) from operations.
117
Table of Contents
OFS Capital Corporation and Subsidiaries
Notes to Consolidated Financial Statements
(Amounts in thousands, except share and per share data)
| Note 3. | OFS Capital WM (Continued) |
| Post-IPO as a Business Development Company |
Pre-IPO Prior to becoming a Business Development Company |
|||||||||||||||||||
| For the Period November 8, 2012 through December 31, 2012 |
For the Period January 1, 2012 through November 7, 2012 |
For the Year ended December 31, 2012 |
Pro Forma Adjustments |
Pro Forma |
||||||||||||||||
| (Historical) | ||||||||||||||||||||
| Investment income |
||||||||||||||||||||
| Interest income from non-affiliate investments |
$ | 2,593 | $ | 10,733 | $ | 13,326 | $ | 4,269 | (1) | $ | 17,595 | |||||||||
| Dividend and fee income |
— | 106 | 106 | — | 106 | |||||||||||||||
|
|
|
|
|
|
|
|
|
|
|
|||||||||||
| Total investment income |
2,593 | 10,839 | 13,432 | 4,269 | 17,701 | |||||||||||||||
|
|
|
|
|
|
|
|
|
|
|
|||||||||||
| Expenses |
||||||||||||||||||||
| Interest expense |
580 | 3,583 | 4,163 | 1,730 | (1) | 5,893 | ||||||||||||||
| Amortization of deferred financing closing costs |
127 | 345 | 472 | 143 | (1) | 615 | ||||||||||||||
| Management fee |
427 | 1,818 | 2,245 | 267 | (1) | 2,512 | ||||||||||||||
| Management fees—other related party |
— | 627 | 627 | — | 627 | |||||||||||||||
| Professional fees |
472 | 463 | 935 | (2 | )(1) | 933 | ||||||||||||||
| Administrative fee |
110 | — | 110 | — | 110 | |||||||||||||||
| General and administrative expenses |
216 | 569 | 785 | 34 | (1) | 819 | ||||||||||||||
|
|
|
|
|
|
|
|
|
|
|
|||||||||||
| Total expenses |
1,932 | 7,405 | 9,337 | 2,172 | 11,509 | |||||||||||||||
|
|
|
|
|
|
|
|
|
|
|
|||||||||||
| Net investment income |
661 | 3,434 | 4,095 | 2,097 | 6,192 | |||||||||||||||
|
|
|
|
|
|
|
|
|
|
|
|||||||||||
| Net realized and unrealized gain (loss) on investments |
||||||||||||||||||||
| Net realized loss on non-affiliate investments |
— | (1,112 | ) | (1,112 | ) | — | (1,112 | ) | ||||||||||||
| Net change in unrealized appreciation (depreciation) on non-affiliate investments |
(222 | ) | 161 | (61 | ) | 548 | (1) | 487 | ||||||||||||
| Net change in unrealized depreciation on affiliate investments |
(41 | ) | — | (41 | ) | — | (41 | ) | ||||||||||||
|
|
|
|
|
|
|
|
|
|
|
|||||||||||
| Net realized and unrealized gain (loss) on investments |
(263 | ) | (951 | ) | (1,214 | ) | 548 | (666 | ) | |||||||||||
|
|
|
|
|
|
|
|
|
|
|
|||||||||||
| Other income (loss) prior to becoming a business development company |
||||||||||||||||||||
| Income from equity interest in OFS Capital WM |
— | 2,645 | 2,645 | (2,645 | )(1) | — | ||||||||||||||
| Income from equity interest in Tamarix LP |
— | 378 | 378 | — | 378 | |||||||||||||||
| Net loss attributable to the non-controlling interests |
— | 61 | 61 | — | 61 | |||||||||||||||
| Other income |
— | 29 | 29 | — | 29 | |||||||||||||||
|
|
|
|
|
|
|
|
|
|
|
|||||||||||
| Total other income prior to becoming a business development company |
— | 3,113 | 3,113 | (2,645 | ) | 468 | ||||||||||||||
|
|
|
|
|
|
|
|
|
|
|
|||||||||||
| Net increase in net assets before cumulative effect of accounting change and extradinary gain (loss) |
398 | 5,596 | 5,994 | — | 5,994 | |||||||||||||||
| Cumulative effect of accounting change |
(348 | ) | 570 | 222 | — | 222 | ||||||||||||||
| Extraordinary gain (loss) |
873 | (873 | ) | — | — | — | ||||||||||||||
|
|
|
|
|
|
|
|
|
|
|
|||||||||||
| Net increase in net assets resulting from operations |
$ | 923 | $ | 5,293 | $ | 6,216 | $ | — | $ | 6,216 | ||||||||||
|
|
|
|
|
|
|
|
|
|
|
|||||||||||
118
Table of Contents
OFS Capital Corporation and Subsidiaries
Notes to Consolidated Financial Statements
(Amounts in thousands, except share and per share data)
| Note 3. | OFS Capital WM (Continued) |
| For the Year Ended December 31, 2011 | ||||||||||||
| Historical | Pro Forma Adjustments |
Pro Forma |
||||||||||
| Investment income |
||||||||||||
| Interest income from non-affiliate investments |
$ | 1,752 | $ | 13,576 | (1) | $ | 15,328 | |||||
| Dividend and fee income |
20 | — | 20 | |||||||||
|
|
|
|
|
|
|
|||||||
| Total investment income |
1,772 | 13,576 | 15,348 | |||||||||
|
|
|
|
|
|
|
|||||||
| Expenses |
||||||||||||
| Interest expense |
831 | 4,484 | (1) | 5,315 | ||||||||
| Amortization of deferred financing closing costs |
— | 572 | (1) | 572 | ||||||||
| Management fee—Loan Manager |
— | 912 | (1) | 912 | ||||||||
| Management fees—investment advisor |
1,365 | — | 1,365 | |||||||||
| Professional fees |
151 | 322 | (1) | 473 | ||||||||
| General and administrative expenses |
288 | 132 | (1) | 420 | ||||||||
|
|
|
|
|
|
|
|||||||
| Total expenses |
2,635 | 6,422 | 9,057 | |||||||||
|
|
|
|
|
|
|
|||||||
| Net investment income (expenses) |
(863 | ) | 7,154 | 6,291 | ||||||||
|
|
|
|
|
|
|
|||||||
| Net realized and unrealized loss on investments |
||||||||||||
| Net realized loss on non-affiliate investments |
— | (1,239 | )(1) | (1,239 | ) | |||||||
| Net change in unrealized depreciation on non-affiliate investments |
(156 | ) | (6,482 | )(1) | (6,638 | ) | ||||||
|
|
|
|
|
|
|
|||||||
| Net realized and unrealized loss on investments |
(156 | ) | (7,721 | ) | (7,877 | ) | ||||||
|
|
|
|
|
|
|
|||||||
| Other income (loss) prior to becoming a business development company |
||||||||||||
| Loan loss recovery on loans receivable and loans receivable pledged to creditors |
199 | — | 199 | |||||||||
| Loss from equity interest in OFS Capital WM |
(638 | ) | 638 | (1) | — | |||||||
| Loss on sale of loans to OFS Capital WM |
(889 | ) | 889 | (1) | — | |||||||
| Gain on payable under securities loan agreement |
71 | (71 | )(1) | — | ||||||||
| Other income |
89 | — | 89 | |||||||||
|
|
|
|
|
|
|
|||||||
| Total other income (loss) prior to becoming a business development company |
(1,168 | ) | 1,456 | 288 | ||||||||
|
|
|
|
|
|
|
|||||||
| Net increase (decrease) in net assets resulting from operations |
$ | (2,187 | ) | $ | 889 | $ | (1,298 | ) | ||||
|
|
|
|
|
|
|
|||||||
119
Table of Contents
OFS Capital Corporation and Subsidiaries
Notes to Consolidated Financial Statements
(Amounts in thousands, except share and per share data)
| Note 3. | OFS Capital WM (Continued) |
| For the Year Ended December 31, 2010 |
||||||||||||
| Historical | Pro Forma Adjustments |
Pro Forma |
||||||||||
| Investment income |
||||||||||||
| Interest income from non-affiliate investments |
$ | 10,253 | $ | 1,726 | (1) | $ | 11,979 | |||||
| Dividend and fee income |
185 | — | 185 | |||||||||
|
|
|
|
|
|
|
|||||||
| Total investment income |
10,438 | 1,726 | 12,164 | |||||||||
|
|
|
|
|
|
|
|||||||
| Expenses |
||||||||||||
| Interest expense |
3,654 | 707 | (1) | 4,361 | ||||||||
| Amortization of deferred financing closing costs |
1,500 | 151 | (1) | 1,651 | ||||||||
| Management fee—Loan Manager |
— | 111 | (1) | 111 | ||||||||
| Management fees—investment advisor |
1,850 | — | 1,850 | |||||||||
| Professional fees |
194 | — | 194 | |||||||||
| General and administrative expenses |
268 | 8 | (1) | 276 | ||||||||
|
|
|
|
|
|
|
|||||||
| Total expenses |
7,466 | 977 | 8,443 | |||||||||
|
|
|
|
|
|
|
|||||||
| Net investment income (expenses) |
2,972 | 749 | 3,721 | |||||||||
|
|
|
|
|
|
|
|||||||
| Net realized and unrealized loss on investments |
||||||||||||
| Net change in unrealized appreciation on non-affiliate investments |
19 | 546 | (1) | 565 | ||||||||
|
|
|
|
|
|
|
|||||||
| Net realized and unrealized loss on investments |
19 | 546 | 565 | |||||||||
|
|
|
|
|
|
|
|||||||
| Other income (loss) prior to becoming a business development company |
||||||||||||
| Loan loss recovery on loans receivable and loans receivable pledged to creditors |
2,390 | — | 2,390 | |||||||||
| Income from equity interest in OFS Capital WM |
2,353 | (2,353 | )(1) | — | ||||||||
| Loss on sale of other loans, net |
(1,641 | ) | — | (1,641 | ) | |||||||
| Unrealized loss on payable under securities loan agreement |
(1,058 | ) | 1,058 | (1) | — | |||||||
| Gain on restructuring of loans |
152 | — | 152 | |||||||||
| Other income |
52 | — | 52 | |||||||||
|
|
|
|
|
|
|
|||||||
| Total other income (loss) prior to becoming a business development company |
2,248 | (1,295 | ) | 953 | ||||||||
|
|
|
|
|
|
|
|||||||
| Net increase (decrease) in net assets resulting from operations |
$ | 5,239 | $ | — | $ | 5,239 | ||||||
|
|
|
|
|
|
|
|||||||
Pro Forma Adjustments:
(1) To eliminate OFS Capital’s income (loss) from equity investment in OFS Capital WM and consolidate OFS Capital WM’s statement of operations into OFS Capital’s for the years ended December 31, 2012, 2011, and 2010. To eliminate loss on sale of loans to OFS Capital WM for the year ended December 31, 2011.
| Note 4. | Tamarix LP |
Tamarix LP is a Delaware limited partnership formed in January 2010, which commenced operations in September 2011. Tamarix LP applied for an SBIC license from the Small Business Administration (“SBA”), in order to become a SBIC regulated fund under the Small Business Investment Company Act of 1958 (the “SBIC
120
Table of Contents
OFS Capital Corporation and Subsidiaries
Notes to Consolidated Financial Statements
(Amounts in thousands, except share and per share data)
| Note 4. | Tamarix LP (Continued) |
Act”). In September and November 2011, OFS Capital entered into loan agreements with Tamarix LP pursuant to which OFS Capital lent an aggregate of $16,750 to Tamarix LP. Tamarix LP utilized these funds to originate loans with an aggregate face value of $14,750 and acquire equity interests in its borrowers for $2,455. OFS Capital’s loans to Tamarix LP were fully secured by pledges of Tamarix LP’s loans and equity interests in its borrowers.
On May 10, 2012, Tamarix LP received the SBIC license. From September 29, 2011 through May 10, 2012, Tamarix LP was deemed to be a VIE of OFS Capital under ASC Topic 810 as the equity interests in Tamarix LP had not been called and, accordingly, it would not be possible for Tamarix LP to finance its activities without additional subordinated financial support. OFS Capital’s debt interest was considered the sole variable interest in Tamarix LP and OFS Capital was deemed to be the primary beneficiary in Tamarix LP for the period from September 29, 2011 to May 10, 2012. The investment and exit decisions, day-to-day investment activities and underlying assets of Tamarix LP are managed by its general partner, Tamarix Capital G.P., LLC (“Tamarix GP”), which is controlled by three individuals (“Tamarix Individuals) who were employed by an affiliate of OFS Capital, each of whom, together with Glenn Pittson, OFS Capital’s Chief Executive Officer, have previously been approved by the SBA to manage Tamarix LP. For accounting purposes, however, as secured lender to Tamarix LP, as well as employer (through affiliated entity) of the three individuals, OFS Capital ultimately was deemed under the applicable accounting literature to have the power to direct the activities of Tamarix LP that most significantly impacted Tamarix LP’s economic performance. Further, OFS Capital had the obligation as a secured lender to absorb losses of Tamarix LP that could potentially be significant to Tamarix LP.
Since, upon its licensure as an SBIC fund on May 10, 2012, (1) Tamarix LP had (and continues to have) sufficient equity at risk to finance its future activities without additional subordinated financial support, and (2) there continued to be a controlling financial interest holder in Tamarix LP, effective May 10, 2012, Tamarix LP was no longer a VIE, but instead a limited partnership guided under ASC Topic 810. Subsequent to May 10, 2012, OFS Capital was deemed under the applicable accounting literature to continue to hold the controlling financial interest in Tamarix LP since OFS Capital continued to have the power to direct the activities of Tamarix LP that most significantly impacted Tamarix LP’s economic performance, and the obligation to absorb losses that could potentially be significant to Tamarix LP. In addition, as the 68.4% limited partner in Tamarix LP, OFS Capital also possessed the right to receive benefits from Tamarix LP that could potentially be significant to Tamarix LP. Therefore, subsequent to May 10, 2012, OFS Capital continued to consolidate the financial statements of Tamarix LP into its own.
In June 2012, Tamarix LP received a $30,110 SBA leverage commitment, which is issuable by the SBA in the form of debenture securities and which terminates in September 2016. The SBA charges a 3% leverage fee and a 0.425% underwriter’s fee on these commitments. The fee is payable in two stages: (1) 1% of the committed amount when the leverage commitment is received and (2) the remaining 2% plus the underwriting fee as funds are drawn. The SBA may limit the amount that may be drawn each year under this commitment, and each issuance of leverage is conditioned on Tamarix LP’s full compliance, as determined by the SBA, with the terms and conditions set forth under the SBIC Act. In June 2012, Tamarix LP paid the 1% fee in the amount of $301 to the SBA. On July 27, 2012, in connection with a $14,000 leverage draw, Tamarix LP was charged fees of $339 by the SBA. The foregoing fees are recorded by Tamarix LP as deferred financing costs and will be amortized on a straight-line basis over a period of ten years as Tamarix LP draws down the leverage commitment.
The objective of Tamarix LP is to generate attractive returns for investors by making investments in United States-based, lower-middle-market companies. These investments typically will be comprised of debt-related
121
Table of Contents
OFS Capital Corporation and Subsidiaries
Notes to Consolidated Financial Statements
(Amounts in thousands, except share and per share data)
| Note 4. | Tamarix LP (Continued) |
securities with warrant coverage. The term of Tamarix LP runs through the later of March 2022 or two years after all of Tamarix LP’s Outstanding Leverage (as defined in the limited partnership agreement of Tamarix LP) has matured. Pursuant to the limited partnership agreement of Tamarix LP and the SBIC Act, a limited partner may not sell, transfer, assign, pledge, subdivide for resale or otherwise dispose of all or any part of its interest in Tamarix LP without the prior written consent of Tamarix GP, the granting or denying of which consent will be in Tamarix GP’s sole and absolute discretion. In addition, a limited partner may not transfer any interest of ten percent or more in the capital of Tamarix LP without the prior approval of the SBA.
Deconsolidation of Tamarix LP
On July 27, 2012, Tamarix LP received leverage of $14,000 from the SBA and repaid its loans due to OFS Capital, including accrued interest, in the total amount of approximately $16,577. Also effective July 27, 2012, Tamarix Individuals resigned as employees from the affiliated entity of OFS Capital.
Due to the resignation of Tamarix Individuals, effective July 27, 2012, OFS Capital was no longer deemed to have the power to direct the activities of Tamarix LP that most significantly impacted Tamarix LP’s economic performance. Effective July 27, 2012, Tamarix GP, as the general partner of Tamarix LP controlled by Tamarix Individuals, obtained the power from OFS Capital to direct the activities of Tamarix LP that most significantly impacted Tamarix LP’s economic performance. In addition, because of Tamarix LP’s payoff of its loans due to OFS Capital, OFS Capital no longer had the obligation to absorb losses from Tamarix LP that could be potentially significant to Tamarix LP as it had prior to July 27, 2012 as a secured lender to Tamarix LP. As a result, effective July 27, 2012, OFS Capital was no longer deemed to hold the controlling interest in Tamarix LP.
Since OFS Capital no longer held the controlling interest in Tamarix LP, effective July 27, 2012, OFS Capital deconsolidated Tamarix LP’s financial statements from its own, and adopted the equity method of accounting to record its equity investment in Tamarix LP. Accordingly, the Company’s December 31, 2012 consolidated balance sheet no longer includes the accounts of Tamarix LP, and the Company’s consolidated statement of operations for the year ended December 31, 2012 reflect the statements of operations from Tamarix LP only through July 27, 2012. Commencing November 8, 2012, as a result of Company’s election to become a BDC, it accounts for its equity investment in Tamarix LP at fair value and recorded a cumulative effect of accounting change in the amount of $348 (see Note 2).
The following pro forma presentation assumes OFS Capital’s deconsolidation of Tamarix LP took place on January 1, 2012 and shows the pro forma effect on income (loss) from operations. The pro forma statements of operations for the years ended December 31, 2011 and 2010 are not presented, as Tamarix LP had minimal activities that affected its net income during 2011 and no activities during 2010.
122
Table of Contents
OFS Capital Corporation and Subsidiaries
Notes to Consolidated Financial Statements
(Amounts in thousands, except share and per share data)
| Note 4. | Tamarix LP (Continued) |
| Post-IPO as a Business Development Company |
Pre-IPO Prior to becoming a Business Development Company |
|||||||||||||||||||
| For the Period November 8, 2012 through December 31, 2012 |
For the Period January 1, 2012 through November 7, 2012 |
For the Year ended December 31, 2012 |
Pro Forma Adjustments |
Pro Forma |
||||||||||||||||
| (Historical) | ||||||||||||||||||||
| Investment income |
||||||||||||||||||||
| Interest income from non-affiliate investments |
$ | 2,593 | $ | 10,733 | $ | 13,326 | $ | (428 | )(1) | $ | 12,898 | |||||||||
| Dividend and fee income |
— | 106 | 106 | — | 106 | |||||||||||||||
|
|
|
|
|
|
|
|
|
|
|
|||||||||||
| Total investment income |
2,593 | 10,839 | 13,432 | (428 | ) | 13,004 | ||||||||||||||
|
|
|
|
|
|
|
|
|
|
|
|||||||||||
| Expenses |
||||||||||||||||||||
| Interest expense |
580 | 3,583 | 4,163 | (3 | )(1) | 4,160 | ||||||||||||||
| Amortization of deferred financing closing costs |
127 | 345 | 472 | — | 472 | |||||||||||||||
| Management fee |
427 | 1,818 | 2,245 | — | 2,245 | |||||||||||||||
| Management fees—other related party |
— | 627 | 627 | (627 | )(1) | — | ||||||||||||||
| Professional fees |
472 | 463 | 935 | (45 | )(1) | 890 | ||||||||||||||
| Administrative fee |
110 | — | 110 | — | 110 | |||||||||||||||
| General and administrative expenses |
216 | 569 | 785 | (173 | )(1) | 612 | ||||||||||||||
|
|
|
|
|
|
|
|
|
|
|
|||||||||||
| Total expenses |
1,932 | 7,405 | 9,337 | (848 | ) | 8,489 | ||||||||||||||
|
|
|
|
|
|
|
|
|
|
|
|||||||||||
| Net investment income |
661 | 3,434 | 4,095 | 420 | 4,515 | |||||||||||||||
|
|
|
|
|
|
|
|
|
|
|
|||||||||||
| Net realized and unrealized gain (loss) on investments |
||||||||||||||||||||
| Net realized loss on non-affiliate investments |
— | (1,112 | ) | (1,112 | ) | 273 | (1) | (839 | ) | |||||||||||
| Net change in unrealized appreciation (depreciation) on non-affiliate investments |
(222 | ) | 161 | (61 | ) | — | (61 | ) | ||||||||||||
| Net change in unrealized depreciation on affiliate investments |
(41 | ) | — | (41 | ) | — | (41 | ) | ||||||||||||
|
|
|
|
|
|
|
|
|
|
|
|||||||||||
| Net realized and unrealized loss on investments |
(263 | ) | (951 | ) | (1,214 | ) | 273 | (941 | ) | |||||||||||
|
|
|
|
|
|
|
|
|
|
|
|||||||||||
| Other income (loss) prior to becoming a business development company |
||||||||||||||||||||
| Income from equity interest in OFS Capital WM |
— | 2,645 | 2,645 | — | 2,645 | |||||||||||||||
| Income from equity interest in Tamarix LP |
— | 378 | 378 | (62 | )(1) | 316 | ||||||||||||||
| Net loss attributable to the non-controlling interests |
— | 61 | 61 | (61 | )(1) | — | ||||||||||||||
| Other income |
— | 29 | 29 | — | 29 | |||||||||||||||
|
|
|
|
|
|
|
|
|
|
|
|||||||||||
| Total other incomeprior to becoming a business development company |
— | 3,113 | 3,113 | (123 | ) | 2,990 | ||||||||||||||
|
|
|
|
|
|
|
|
|
|
|
|||||||||||
| Net increase in net assets before cumulative effect of accounting change and extradinary gain (loss) effect of accounting change and extradinary gain (loss) |
398 | 5,596 | 5,994 | 570 | 6,564 | |||||||||||||||
| Cumulative effect of accounting change |
(348 | ) | 570 | 222 | (570 | )(1) | (348 | ) | ||||||||||||
| Extraordinary gain (loss) |
873 | (873 | ) | — | — | — | ||||||||||||||
|
|
|
|
|
|
|
|
|
|
|
|||||||||||
| Net increase in net assets resulting from operations |
$ | 923 | $ | 5,293 | $ | 6,216 | $ | — | $ | 6,216 | ||||||||||
|
|
|
|
|
|
|
|
|
|
|
|||||||||||
123
Table of Contents
OFS Capital Corporation and Subsidiaries
Notes to Consolidated Financial Statements
(Amounts in thousands, except share and per share data)
| Note 4. | Tamarix LP (Continued) |
Pro Forma Adjustments:
(1) To deconsolidate the statement of operations of Tamarix LP for the period January 1, 2012 through July 27, 2012 from OFS Capital’s consolidated statements of operations for the year ended December 31, 2012.
| Note 5. | Related Party Transactions |
Investment Advisory and Management Agreement: On November 7, 2012, OFS Capital entered into an Investment Advisory and Management Agreement (“Advisory Agreement”) with OFS Capital Management, the Company’s Investment Advisor, under which the Investment Advisor manages the day-to-day operations of, and provides investment advisory services to OFS Capital. Under the terms of the Advisory Agreement and subject to the overall supervision of our Board, the Investment Advisor is responsible for sourcing potential investments, conducting research and diligence on potential investments and equity sponsors, analyzing investment opportunities, structuring our investments and monitoring our investments and portfolio companies on an ongoing basis. The Investment Advisor is a subsidiary of OFSAM and a registered investment advisor under the Investment Advisers Act of 1940, as amended.
The Investment Advisor’s services under the Advisory Agreement are not exclusive to the Company, and the Investment Advisor is free to furnish similar services to other entities so long as its services to the Company are not impaired. The Investment Advisor receives fees for providing services, consisting of two components—a base management fee and an incentive fee. From the completion of the Company’s IPO through October 31, 2013, the base management fee is calculated at an annual rate of 0.875% based on the average value of the Company’s total assets (other than cash and cash equivalents but including assets purchased with borrowed amounts and including assets owned by any consolidated entity) at the end of the two most recently completed calendar quarters. After October 31, 2013, the base management fee will be calculated at an annual rate of 1.75% based on the average value of the Company’s total assets (other than cash and cash equivalents but including assets purchased with borrowed amounts and including assets owned by any consolidated entity) at the end of the two most recently completed calendar quarters. The base management fee is payable quarterly in arrears. The base management fee expense was $286 for the period from November 8, 2012 through December 31, 2012.
The incentive fee has two parts. The first part is calculated and payable quarterly in arrears based on the Company’s pre-incentive fee net investment income for the immediately preceding calendar quarter. For this purpose, pre-incentive fee net investment income means interest income, dividend income and any other income (including any other fees (other than fees for providing managerial assistance), such as commitment, origination, structuring, diligence and consulting fees or other fees received from portfolio companies) accrued during the calendar quarter, minus operating expenses for the quarter (including the base management fee, expenses payable under the Administration Agreement (as defined below), and any interest expense and any dividends paid on any issued and outstanding preferred stock, but excluding the incentive fee).
Pre-incentive fee net investment income includes, in the case of investments with a deferred interest feature (such as original issue discount, debt instruments with payment-in-kind interest and zero coupon securities), accrued income that the Company has not yet received in cash. The incentive fee with respect to the pre-incentive fee net income is 20.00% of the amount, if any, by which the pre-incentive fee net investment income for the immediately preceding calendar quarter exceeds a 2.00% (which is 8.00% annualized) hurdle rate and a “catch-up” provision measured as of the end of each calendar quarter. Under this provision, in any calendar quarter, the Investment Advisor receives no incentive fee until the net investment income equals the hurdle rate of 2.00%, but
124
Table of Contents
OFS Capital Corporation and Subsidiaries
Notes to Consolidated Financial Statements
(Amounts in thousands, except share and per share data)
| Note 5. | Related Party Transactions (Continued) |
then receives, as a “catch-up,” 100.00% of the pre-incentive fee net investment income with respect to that portion of such pre-incentive fee net investment income, if any, that exceeds the hurdle rate but is less than 2.5%. The effect of this provision is that, if pre-incentive fee net investment income exceeds 2.5% in any calendar quarter, the Investment Advisor will receive 20.00% of the pre-incentive fee net investment.
Pre-incentive fee net investment income does not include any realized capital gains, realized capital losses or unrealized capital appreciation or depreciation. Because of the structure of the incentive fee, it is possible that the Company may pay an incentive fee in a quarter in which the Company incurs a loss. For example, if the Company receives pre-incentive fee net investment income in excess of the quarterly minimum hurdle rate, the Company will pay the applicable incentive fee even if the Company has incurred a loss in that quarter due to realized and unrealized capital losses. The Company’s net investment income used to calculate this part of the incentive fee is also included in the amount of the Company’s gross assets used to calculate the base management fee. These calculations are appropriately prorated for any period of less than three months and adjusted for any share issuances or repurchases during the current quarter.
The second part of the incentive fee (the “Capital Gain Fee”) is determined and payable in arrears as of the end of each calendar year (or upon termination of the Advisory Agreement, as of the termination date), commencing on December 31, 2012, and equals 20% of the Company’s aggregate realized capital gains, if any, on a cumulative basis from the date of the election to be a BDC through the end of each calendar year, computed net of all realized capital losses and unrealized capital depreciation through the end of such year, less all previous amounts paid in respect of the capital gain incentive fee; provided that the incentive fee determined as of December 31, 2012 is calculated for a period of shorter than twelve calendar months to take into account any realized capital gains computed net of all realized capital losses and unrealized capital depreciation for the period beginning on the date of the Company’s election to be a BDC and ending December 31, 2012.
The Company did not incur any incentive fee expense for the period November 8, 2012 through December 31, 2012.
Prior to the Company’s election to become a BDC, the Investment Advisor served as its advisor effective September 28, 2010, under an Investment Advisory Agreement pursuant to which OFS Capital paid an annual base management fee to the Investment Advisor to compensate for its investment advisory services. The base management fee was calculated initially at 2% per annum of the Company’s average total assets (excluding cash) at the end of the two most recently completed calendar quarters and was amended on March 30, 2012, whereby OFS Capital paid a base management fee at 2% per annum of its average total assets excluding cash and the assets held by OFS Capital WM. For the assets held by OFS Capital WM at the subsidiary level, OFS Capital paid a base management fee of 0.5% per annum on the average total assets (excluding cash) of OFS Capital WM. For the period January 1, 2012 through November 7, 2012, and the years ended December 31, 2011 and 2010, the Company incurred management fee expenses to its investment advisor in the amount of $1,168, $1,365, and $343, respectively.
Prior to September 28, 2010, OFSAM was the manager of the Company, and for the period January 1, 2010 through September 27, 2010, the Company incurred management fee expense in the amount of $1,507 to OFSAM.
Administration Agreement: On November 7, 2012, OFS Capital entered into an administration agreement (“Administration Agreement”) with OFS Capital Services, LLC (“OFS Capital Services” or the “Administrator”), a wholly-owned subsidiary of OFSAM. Pursuant to the Administration Agreement, the
125
Table of Contents
OFS Capital Corporation and Subsidiaries
Notes to Consolidated Financial Statements
(Amounts in thousands, except share and per share data)
| Note 5. | Related Party Transactions (Continued) |
Administrator furnishes the Company with office facilities and equipment, necessary software licenses and subscriptions and clerical, bookkeeping and record keeping services at such facilities. Under the Administration Agreement, the Administrator performs, or oversees the performance of, the Company’s required administrative services, which include being responsible for the financial records that the Company is required to maintain and preparing reports to its stockholders and all other reports and materials required to be filed with the SEC or any other regulatory authority. In addition, the Administrator assists the Company in determining and publishing its net asset value, oversees the preparation and filing of its tax returns and the printing and dissemination of reports to its stockholders, and generally oversee the payment of the Company’s expenses and the performance of administrative and professional services rendered to the Company by others. Under the Administration Agreement, the Administrator also provides managerial assistance on the Company’s behalf to those portfolio companies that have accepted the Company’s offer to provide such assistance. Payment under the Administration Agreement is equal to an amount based upon the Company’s allocable portion (subject to the review and approval of its Board) of the Administrator’s overhead in performing its obligations under the Administration Agreement, including rent and the Company’s allocable portion of the cost of its officers, including its chief executive officer, chief financial officer, chief compliance officer, chief accounting officer, and their respective staffs. For the period November 8, 2012 through December 31, 2012, the Company incurred an administration fee expense of $110, which was accrued for at December 31, 2012.
Other Related Party Transactions:
Due to OFSAM
As of December 31, 2012 and 2011, OFS Capital owed $0 and $6,808 to OFSAM, respectively, due to advances of funds and repayment of funds advanced.
Due to Orchard First Source Capital, Inc. (“OFSC”)
As of December 31, 2012 and 2011, OFS Capital owed a total of $9 and $21, respectively, to OFSC, a wholly owned subsidiary of OFSAM, for operating expenses paid by OFSC for the benefit of OFS Capital, prior to November 7, 2012.
Distributions from OFS Capital WM
In January 2012, OFS Capital received a cash distribution from OFS Capital WM in the amount of $1,225.
Sale of Debt Investments by OFS Capital WM
In May 2012, OFS Capital WM sold a debt investment to OFS Funding I, LLC (“OFS Funding I”), a wholly owned subsidiary of OFSAM, for cash proceeds of $4,157. The debt investment had a carrying value of $4,095 and fair value of $2,930, respectively, on the date of the sale. OFS Capital WM recognized a realized loss of $1,165 from the sale for the difference between the carrying and fair value of the debt investment on the date of the sale. In addition, OFS Capital recorded an equity contribution of $1,227 from its parent to account for the difference between the fair value of the debt investment sold and cash proceeds received by OFS Capital WM from OFS Funding I.
In September 2012, OFS Capital WM sold a debt investment to OFS Funding I for $792. The debt investment had a carrying value of $884. OFS Capital WM recognized a realized loss of $92 on the sale.
126
Table of Contents
OFS Capital Corporation and Subsidiaries
Notes to Consolidated Financial Statements
(Amounts in thousands, except share and per share data)
| Note 5. | Related Party Transactions (Continued) |
Investment in and Due from Tamarix GP
OFS Capital holds a 23.35% membership interest in Tamarix GP. The membership interest in Tamarix GP was carried at zero ($0) as of December 31, 2012. As of December 31, 2012, OFS Capital had funded $20 for its investment in Tamarix GP. For the years ended December 31, 2012 and 2011, OFS Capital recorded income from its equity investment in Tamarix GP of $32 and $0, respectively. In April 2012, OFS Capital received a tax distribution from Tamarix GP in the amount of $52.
At December 31, 2012, OFS Capital had advances totaling $69 to Tamarix GP for certain operating expenses paid by OFS Capital for the benefit of Tamarix GP.
Investment in Tamarix Associates, LLC
OFS Capital holds a 23.33% membership interest in Tamarix Associates, LLC (“Tamarix Manager”), the investment manager for Tamarix LP, which is controlled by the three Tamarix Individuals, who, together with Glenn Pittson, OFS Capital’s Chief Executive Officer, own the remaining membership interests. As of December 31, 2012, OFS Capital was not obligated to make any capital contribution to Tamarix Manager, and its equity investment in Tamarix Manager was carried at zero ($0) at December 31, 2012.
Management Fee Payable – Related Party
Tamarix LP is charged a management fee by Tamarix Manager. During the investment period as defined under the SBIC Act, Tamarix LP incurs a management fee to Tamarix Manager at a per annum rate of 2.0% of the sum of Tamarix LP’s 1) unreduced regulatory capital as defined under the SBIC Act plus 2) the assumed leverage from the SBA equal to two times Tamarix LP’s unreduced regulatory capital. Thereafter, Tamarix LP will need to pay Tamarix Manager an annual management fee equal to 2.0% of Tamarix LP’s cost of loans and investments in active small businesses. Prior to the deconsolidation of Tamarix LP, for the period January 1, 2012 through July 27, 2012, OFS Capital recorded management fee expense in the amount of $627 on its consolidated statement of operations.
| Note 6. | Investments |
At December 31, 2012, investments consisted of the following:
| Principal | Cost | Fair Value | ||||||||||
| Senior secured debt |
$ | 234,635 | $ | 231,781 | $ | 227,542 | ||||||
| Equity investment in Tamarix LP |
N/A | 5,049 | 4,657 | |||||||||
|
|
|
|
|
|
|
|||||||
| Total |
$ | 234,635 | $ | 236,830 | $ | 232,199 | ||||||
|
|
|
|
|
|
|
|||||||
127
Table of Contents
OFS Capital Corporation and Subsidiaries
Notes to Consolidated Financial Statements
(Amounts in thousands, except share and per share data)
| Note 6. | Investments (Continued) |
At December 31, 2012, the industry compositions of the Company’s portfolio were as follows:
| Cost | Fair Value | |||||||||||||||
| Accounts Receivable Management Services |
$ | 4,868 | 2.1 | % | $ | 4,673 | 2.0 | % | ||||||||
| Aerospace & Defense |
4,514 | 1.9 | 4,440 | 1.9 | ||||||||||||
| Asset Management & Custody Banks |
4,659 | 2.0 | 4,598 | 2.0 | ||||||||||||
| Asset Management Services |
4,755 | 2.0 | 4,706 | 2.0 | ||||||||||||
| Automobile |
7,854 | 3.3 | 7,820 | 3.4 | ||||||||||||
| Automotive Aftermarket Manufacturing |
4,632 | 2.0 | 3,798 | 1.6 | ||||||||||||
| Beverage, Food and Tobacco |
3,942 | 1.7 | 3,942 | 1.7 | ||||||||||||
| Broadcasting and Entertainment |
4,549 | 1.9 | 4,549 | 2.0 | ||||||||||||
| Busines Equipment & Services |
8,266 | 3.5 | 8,203 | 3.5 | ||||||||||||
| Chemical / Plastics |
10,178 | 4.3 | 10,305 | 4.4 | ||||||||||||
| Commercial Fastener Manufactuing |
4,588 | 1.9 | 4,633 | 2.0 | ||||||||||||
| Distributors |
12,462 | 5.3 | 12,224 | 5.3 | ||||||||||||
| Diversified Commercial & Professional Services |
9,003 | 3.8 | 8,996 | 3.9 | ||||||||||||
| Diversified/Conglomerate Manufacturing |
3,564 | 1.5 | 3,544 | 1.5 | ||||||||||||
| Electrical Components & Equipment |
5,914 | 2.5 | 5,902 | 2.5 | ||||||||||||
| Energy: Oil & Gas |
3,187 | 1.3 | 3,187 | 1.4 | ||||||||||||
| Environmental Consulting & Services |
4,302 | 1.8 | 4,339 | 1.9 | ||||||||||||
| Environmental Equipment Manufacturer |
4,407 | 1.9 | 4,245 | 1.8 | ||||||||||||
| Environmental Industries |
2,780 | 1.2 | 2,737 | 1.2 | ||||||||||||
| Finance |
5,049 | 2.1 | 4,657 | 2.0 | ||||||||||||
| Financial Intermediaries |
7,170 | 3.0 | 7,266 | 3.1 | ||||||||||||
| Health Care Equipment |
9,406 | 4.0 | 9,254 | 4.0 | ||||||||||||
| Health Care Services |
18,783 | 7.9 | 18,864 | 8.1 | ||||||||||||
| Health Care Supplies |
3,545 | 1.5 | 2,881 | 1.2 | ||||||||||||
| Healthcare |
4,811 | 2.0 | 4,202 | 1.8 | ||||||||||||
| Healthcare Facilities |
4,911 | 2.1 | 4,896 | 2.1 | ||||||||||||
| High Tech Industries |
2,395 | 1.0 | 2,431 | 1.0 | ||||||||||||
| Household Products |
3,739 | 1.6 | 3,307 | 1.4 | ||||||||||||
| Industrial Conglomerates |
2,460 | 1.0 | 2,240 | 1.0 | ||||||||||||
| Industrial Gases |
4,316 | 1.8 | 4,242 | 1.8 | ||||||||||||
| Insurance |
4,915 | 2.1 | 4,915 | 2.1 | ||||||||||||
| Insurance Brokerage |
13,620 | 5.8 | 13,181 | 5.7 | ||||||||||||
| North American Commodities Brokerage |
4,520 | 1.9 | 4,652 | 2.0 | ||||||||||||
| Personal Products |
14,113 | 6.0 | 13,998 | 6.0 | ||||||||||||
| Printing & Publishing |
2,864 | 1.2 | 2,788 | 1.2 | ||||||||||||
| Property & Casualty Insurance |
4,903 | 2.1 | 4,777 | 2.1 | ||||||||||||
| Publishing |
4,741 | 2.0 | 4,795 | 2.1 | ||||||||||||
| Rehabilitation Products and Services |
4,900 | 2.1 | 4,699 | 2.0 | ||||||||||||
| Telecommunications |
7,246 | 3.1 | 7,313 | 3.1 | ||||||||||||
|
|
|
|
|
|
|
|
|
|||||||||
| $ | 236,830 | 100.0 | % | $ | 232,199 | 100.0 | % | |||||||||
|
|
|
|
|
|
|
|
|
|||||||||
128
Table of Contents
OFS Capital Corporation and Subsidiaries
Notes to Consolidated Financial Statements
(Amounts in thousands, except share and per share data)
| Note 6. | Investments (Continued) |
At December 31, 2011, OFS Capital did not consolidate the financial statements of OFS Capital WM, but recorded its equity investment in OFS Capital WM under the equity method of accounting. The following table summarizes OFS Capital’s investments at December 31, 2011 on both a historical and pro forma basis. The pro forma presentation assumes OFS Capital consolidated the financial statements of OFS Capital WM on December 31, 2011.
| Historical | Pro Forma | |||||||||||||||||||||||
| Principal |
Cost |
Fair Value |
Principal |
Cost |
Fair Value |
|||||||||||||||||||
| Senior secured debt |
$ | 9,963 | $ | 9,267 | $ | 9,809 | $ | 226,902 | $ | 223,029 | $ | 217,637 | ||||||||||||
| Subordinated debt |
4,863 | 4,756 | 4,756 | 4,863 | 4,756 | 4,756 | ||||||||||||||||||
| Equity investment in OFS Capital WM |
N/A | 43,120 | 41,217 | — | — | — | ||||||||||||||||||
| Other equity investments |
N/A | 2,455 | 2,619 | N/A | 2,455 | 2,619 | ||||||||||||||||||
|
|
|
|
|
|
|
|
|
|
|
|
|
|||||||||||||
| Total |
$ | 14,826 | $ | 59,598 | $ | 58,401 | $ | 231,765 | $ | 230,240 | $ | 225,012 | ||||||||||||
|
|
|
|
|
|
|
|
|
|
|
|
|
|||||||||||||
The following table reflects the industry compositions of the Company’s portfolio at December 31, 2011 on a pro forma basis as if OFS Capital consolidated the financial statements of OFS Capital WM on December 31, 2011.
| Pro Forma | ||||||||||||||||
| Cost |
Fair Value |
|||||||||||||||
| Aerospace & Defense |
16,144 | 7.0 | % | $ | 15,920 | 7.1 | % | |||||||||
| Automobile |
9,599 | 4.2 | 9,372 | 4.2 | ||||||||||||
| Buildings & Real Estate |
1,311 | 0.6 | 1,117 | 0.5 | ||||||||||||
| Chemicals, Plastics & Rubber |
487 | 0.2 | 466 | 0.2 | ||||||||||||
| Distributors |
13,051 | 5.7 | 12,688 | 5.6 | ||||||||||||
| Diversified/Conglomerate Manufacturing |
11,719 | 5.1 | 10,955 | 4.9 | ||||||||||||
| Diversified/Conglomerate Service |
19,106 | 8.3 | 18,700 | 8.3 | ||||||||||||
| Ecological |
4,939 | 2.1 | 4,724 | 2.1 | ||||||||||||
| Electrical Components & Equipment |
8,987 | 3.9 | 8,917 | 4.0 | ||||||||||||
| Electronics |
4,952 | 2.2 | 4,837 | 2.1 | ||||||||||||
| Environmental Consulting & Services |
4,662 | 2.0 | 4,599 | 2.0 | ||||||||||||
| Finance |
14,723 | 6.4 | 14,364 | 6.4 | ||||||||||||
| Healthcare Facilities |
4,939 | 2.1 | 4,810 | 2.1 | ||||||||||||
| Healthcare, Education & Childcare |
47,846 | 20.8 | 46,562 | 20.7 | ||||||||||||
| Hotels, Resorts, & Cruise Lines |
3,782 | 1.6 | 3,832 | 1.7 | ||||||||||||
| Household Products |
4,464 | 1.9 | 4,399 | 2.0 | ||||||||||||
| Industrial Gases |
4,596 | 2.0 | 4,419 | 2.0 | ||||||||||||
| Industrial Machinery and Equipment |
4,025 | 1.7 | 3,876 | 1.7 | ||||||||||||
| Insurance Brokerage |
9,714 | 4.2 | 9,556 | 4.2 | ||||||||||||
| Leisure Products |
4,389 | 1.9 | 4,229 | 1.9 | ||||||||||||
| Packaging |
8,882 | 3.9 | 8,478 | 3.8 | ||||||||||||
| Personal Products |
4,913 | 2.1 | 4,828 | 2.1 | ||||||||||||
| Personal, Food & Miscellaneous |
9,767 | 4.2 | 10,473 | 4.7 | ||||||||||||
| Printing & Publishing |
8,967 | 3.9 | 8,706 | 3.9 | ||||||||||||
| Specialized Consumer Services |
4,277 | 1.9 | 4,185 | 1.9 | ||||||||||||
|
|
|
|
|
|
|
|
|
|||||||||
| $ | 230,240 | 100.0 | % | $ | 225,012 | 100.0 | % | |||||||||
|
|
|
|
|
|
|
|
|
|||||||||
129
Table of Contents
OFS Capital Corporation and Subsidiaries
Notes to Consolidated Financial Statements
(Amounts in thousands, except share and per share data)
| Note 7. | Fair Value of Financial Instruments |
The Company follows ASC Topic 820 for measuring fair value. Prior to the Company’s election to become a BDC, the Company also followed the guidance in ASC Topic 820 in disclosing the fair value reported for all financial instruments that were either impaired or available for sale securities, using the definitions provided in Accounting Standards Codification Topic 320, “Investments – Debt and Equity Securities” (“ASC Topic 320”). Fair value is the price that would be received to sell an asset or paid to transfer a liability in an orderly transaction between market participants at the measurement date and sets out a fair value hierarchy. The fair value hierarchy gives the highest priority to quoted prices in active markets for identical assets or liabilities (Level 1) and the lowest priority to unobservable inputs (Level 3). Inputs are broadly defined under ASC Topic 820 as assumptions market participants would use in pricing an asset or liability. The three levels of the fair value hierarchy under ASC Topic 820 are described below:
Level 1: Unadjusted quoted prices in active markets for identical assets or liabilities that the reporting entity has the ability to access at the measurement date.
Level 2: Inputs other than quoted prices within Level 1 that are observable for the asset or liability, either directly or indirectly; and fair value is determined through the use of models or other valuation methodologies.
Level 3: Inputs are unobservable for the asset or liability and include situations where there is little, if any, market activity for the asset or liability. The inputs into the determination of fair value are based upon the best information under the circumstances and may require significant management judgment or estimation.
In certain cases, the inputs used to measure fair value may fall into different levels of the fair value hierarchy. In such cases, an investment’s level within the fair value hierarchy is based on the lowest level of input that is significant to the fair value measurement. The Company’s assessment of the significance of a particular input to the fair value measurement in its entirety requires judgment, and considers factors specific to the investment.
The Company assesses the levels of the investments at each measurement date, and transfers between levels are recognized on the subsequent measurement date closest in time to the actual date of the event or change in circumstances that caused the transfer. There were no transfers among Level 1, 2 and 3 for the period January 1, 2012 through November 7, 2012, the period November 8, 2012 through December 31, 2012, and the years ended December 31, 2012 and 2011. The following sections describe the valuation techniques used by the Company to measure different financial instruments at fair value and include the levels within the fair value hierarchy in which the financial instruments are categorized.
Investments for which prices are not observable are generally private investments in the equity and debt securities of operating companies. The primary analytical method used to estimate the fair value of Level 3 investments is the discounted cash flow method (although in certain instances a liquidation analysis or other methodology may be most appropriate). The discounted cash flow approach to determine fair value (or a range of fair values) involves applying an appropriate discount rate(s) to the estimated future cash flows using various relevant factors depending on investment type, including assumed growth rate (in cash flows) and capitalization rates/multiples (for determining terminal values of underlying portfolio companies). The valuation based on the inputs determined to be the most reasonable and probable is used as the fair value of the investment. The determination of fair value using these methodologies may take into consideration a range of factors including, but not limited to, the price at which the investment was acquired, the nature of the investment, local market conditions, trading values on public exchanges for comparable securities, current and projected operating performance, and financing transactions subsequent to the acquisitions of the investment. Application of these valuation methodologies involves a significant degree of judgment by management.
130
Table of Contents
OFS Capital Corporation and Subsidiaries
Notes to Consolidated Financial Statements
(Amounts in thousands, except share and per share data)
| Note 7. | Fair Value of Financial Instruments (Continued) |
The fair value of equity securities, including warrants, in portfolio companies may also consider the market approach—that is, through analyzing, and applying to the underlying portfolio companies, market valuation multiples of publicly-traded firms engaged in businesses similar to those of the portfolio companies. The market approach to determining the fair value of a portfolio company’s equity security (or securities) will typically involve: (1) applying to the portfolio company’s trailing twelve months (or current year projected) EBITDA a low to high range of enterprise value to EBITDA multiples that are derived from an analysis of publicly-traded comparable companies, in order to arrive at a range of enterprise values for the portfolio company; (2) subtracting from the range of calculated enterprise values the outstanding balances of any debt or equity securities that would be senior in right of payment to the equity securities held by the Company; and (3) multiplying the range of equity values derived therefrom by the Company’s ownership share of such equity tranche in order to arrive at a range of fair values for the Company’s equity security (or securities). Application of these valuation methodologies involves a significant degree of judgment by management.
Equity in a portfolio company that invests in loans, will typically be valued by arriving at a fair value of such vehicle’s loan assets (plus, when appropriate, the carrying value of certain other assets), and deducting the book value or fair value (as appropriate) of such vehicle’s liabilities to arrive at a fair value for the equity. When appropriate, in order to recognize value that would be created by growth opportunities of such portfolio company, equity in a portfolio company may also be valued by taking into consideration the magnitude, timing, and effective life of its expected future investments in loans.
Due to the inherent uncertainty of determining the fair value of Level 3 investments that do not have a readily available market value, the fair value of the investments may differ significantly from the values that would have been used had a ready market existed for such investments and may differ materially from the values that may ultimately be received or settled. Further, such investments are generally subject to legal and other restrictions or otherwise are less liquid than publicly traded instruments. If the Company were required to liquidate a portfolio investment in a forced or liquidation sale, the Company might realize significantly less than the value at which such investment had previously been recorded. With respect to level 3 investments, where sufficient market quotations are not readily available or for which no or an insufficient number of indicative prices from pricing services or brokers or dealers have been received, the Company undertakes, on a quarterly basis, a valuation process as described below:
| • | For each debt investment, a basic credit rating review process is completed. The risk rating on every credit facility is reviewed and either reaffirmed or revised by the Investment Advisor’s investment committee. |
| • | Each portfolio company or investment is valued by an investment professional. |
| • | Preliminary valuation conclusions are then documented and discussed with individual members of the investment committee. |
| • | The preliminary valuations are then submitted to the investment committee for ratification. |
| • | Third party valuation firm(s) will be engaged to provide valuation services as requested, by reviewing the investment committee’s preliminary valuations. The investment committee’s preliminary fair value conclusions on each of the Company’s assets for which sufficient market quotations are not readily available will be reviewed and assessed by a third-party valuation firm at least once every 12–month period, and more often as determined by the Company’s Board or required by our valuation policy. Such valuation assessment may be in the form of positive assurance, range of values or other valuation method based on the discretion of the Company’s Board. |
131
Table of Contents
OFS Capital Corporation and Subsidiaries
Notes to Consolidated Financial Statements
(Amounts in thousands, except share and per share data)
| Note 7. | Fair Value of Financial Instruments (Continued) |
| • | The Company’s Board will discuss valuations and determine the fair value of each investment in the portfolio in good faith based on the input of OFS Capital Management and, where appropriate, the respective independent valuation firms. |
The Company’s investments are subject to market risk. Market risk is the potential for changes in the value of investments due to market changes. Market risk is directly impacted by the volatility and liquidity in the markets in which the investments are traded. The Company manages its exposure to market risk related to its investments through monitoring the financial condition of its investments, as well as the volatility and liquidity trends of the markets in which it trades.
The following tables present fair value measurements of the Company’s investments and indicate the fair value hierarchy of the valuation techniques utilized by the Company to determine such fair value:
| December 31, 2012 | ||||||||||||||||
| Fair Value Measurements Using | ||||||||||||||||
| Description |
(Level I) | (Level II) | (Level III) | Total | ||||||||||||
| Assets: |
||||||||||||||||
| Debt investments |
$ | — | $ | — | $ | 227,542 | $ | 227,542 | ||||||||
| Equity investments |
— | — | 4,657 | 4,657 | ||||||||||||
| Money market funds * |
6,103 | — | — | 6,103 | ||||||||||||
|
|
|
|
|
|
|
|
|
|||||||||
| Total |
$ | 6,103 | $ | — | $ | 232,199 | $ | 238,302 | ||||||||
|
|
|
|
|
|
|
|
|
|||||||||
| * | included in cash and cash equivalents and restricted cash and cash equivalents on the consolidated balance sheet. |
The Company had one category of debt investments at December 31, 2012, consisting of senior loans to 58 portfolio companies. The debt investments were measured at fair value via application of the discounted cash flow method, based on discount rates (derived primarily from unobservable credit quality and unobservable market interest rate inputs) ranging from 7.44% to 15.80%, with a weighted average rate of 8.29% and unobservable EBITDA multiple inputs ranging from 3.75 to 9.03, with a weighted average multiple of 6.13. Changes in credit quality (which would impact the discount rate), as well as changes in EBITDA multiples, could have a significant impact on fair values, with the fair value of a particular debt investment susceptible to change in inverse relation to changes in the discount rate.
The Company determined the fair value of its equity investment in Tamarix LP at December 31, 2012 by determining the total of: 1) the fair value of the debt and equity securities held by Tamarix LP as of December 31, 2012 in the aggregate amount of $20,903; plus 2) the carrying value of Tamarix LP’s cash and receivables in the total amount of $944; less 3) the carrying value of Tamarix LP’s liabilities in the total amount of $14,383; times 4) the Company’s percentage share of Tamarix LP’s paid in capital as of December 31, 2012.
Tamarix LP’s debt investments in three portfolio companies were measured at fair value via application of the discounted cash flow method, based on discount rates (derived primarily from unobservable credit quality and unobservable market interest rate inputs) ranging from 13.02% to 15.0%, with a weighted average rate of 14.64%, and unobservable EBITDA multiple inputs ranging from 4.08 to 6.48, with a weighted average of
132
Table of Contents
OFS Capital Corporation and Subsidiaries
Notes to Consolidated Financial Statements
(Amounts in thousands, except share and per share data)
| Note 7. | Fair Value of Financial Instruments (Continued) |
4.81. Changes in credit quality (which would impact the discount rate), as well as changes in EBITDA multiples, could have a significant impact on fair values, with the fair value of a particular debt investment susceptible to change in inverse relation to changes in the discount rate.
Tamarix’s equity investments in three portfolio companies were measured at fair value via: 1) application of the discounted cash flow method, based on discount rates ranging from 20.0%-30.0% and unobservable EBITDA multiple inputs ranging from 4.08 to 6.48, as well as 2) application of the market approach, utilizing unobservable EBITDA multiple inputs of 3.23 to 8.44. Changes in EBITDA multiples, as well as changes in the discount rate, could have a significant impact on fair values, with the fair value of an equity investment susceptible to change in tandem with changes in EBITDA multiples, and in inverse relation to changes in the discount rate.
| December 31, 2011 | ||||||||||||||||
| Fair Value Measurements Using | ||||||||||||||||
| Description |
(Level I) | (Level II) | (Level III) | Total | ||||||||||||
| Money market funds * |
$ | 12 | $ | — | $ | — | $ | 12 | ||||||||
|
|
|
|
|
|
|
|
|
|||||||||
| Total |
$ | 12 | $ | — | $ | — | $ | 12 | ||||||||
|
|
|
|
|
|
|
|
|
|||||||||
| * | included in cash and cash equivalents on the consolidated balance sheet. |
The following tables present changes in investments measured at fair value using Level 3 inputs for the period January 1, 2012 through November 7, 2012, the period November 8, 2012 through December 31, 2012, and the years ended December 31, 2011 and 2010.
| Post-IPO as a BDC | ||||||||||||
| For the Period November 8, 2012 through December 31, 2012 |
||||||||||||
| Debt Investments |
Equity Investments |
Total | ||||||||||
| Level 3 assets, beginning of period |
$ | 201,720 | $ | — | $ | 201,720 | ||||||
| Net change in unrealized appreciation (depreciation) on investments |
(222 | ) | (41 | ) | (263 | ) | ||||||
| Purchase of portfolio investments |
32,125 | — | 32,125 | |||||||||
| Proceeds from principal payments on portfolio investments |
(6,242 | ) | (6,242 | ) | ||||||||
| Conversion to fair value upon election to become a BDC |
— | 4,698 | 4,698 | |||||||||
| Amortization of discounts and premium |
161 | — | 161 | |||||||||
|
|
|
|
|
|
|
|||||||
| Level 3 assets, end of period |
$ | 227,542 | $ | 4,657 | $ | 232,199 | ||||||
|
|
|
|
|
|
|
|||||||
133
Table of Contents
OFS Capital Corporation and Subsidiaries
Notes to Consolidated Financial Statements
(Amounts in thousands, except share and per share data)
| Note 7. | Fair Value of Financial Instruments (Continued) |
| Pre-IPO Prior to becoming a BDC | ||||||||||||
| For the Period January 1, 2012 through November 7, 2012 |
||||||||||||
| Debt Investments |
Equity Investments |
Total | ||||||||||
| Level 3 assets, beginning of period |
$ | — | $ | — | $ | — | ||||||
| Net change in unrealized appreciation (depreciation) on investments |
387 | (226 | ) | 161 | ||||||||
| Net realized loss on investment—related party |
(1,257 | ) | — | (1,257 | ) | |||||||
| Consolidation of investments held by OFS Capital WM |
197,765 | — | 197,765 | |||||||||
| Purchase of portfolio investments by OFS Capital WM |
42,748 | — | 42,748 | |||||||||
| Purchase of portfolio investments by Tamarix LP |
2,999 | — | 2,999 | |||||||||
| Accrued PIK |
99 | — | 99 | |||||||||
| Portfolio investments of Tamarix LP converted from cost to fair value accounting |
14,382 | 2,596 | 16,978 | |||||||||
| Proceeds from principal payments on portfolio investments held by OFS Capital WM |
(26,168 | ) | — | (26,168 | ) | |||||||
| Proceeds from principal payments on portfolio investments held by Tamarix LP |
(315 | ) | — | (315 | ) | |||||||
| Sale of portfolio investments to related party |
(3,722 | ) | — | (3,722 | ) | |||||||
| Sale of portfolio investments to others |
(8,800 | ) | — | (8,800 | ) | |||||||
| Portfolio investment received in connection with debt acquisition and restructuring by Tamarix LP |
— | 539 | 539 | |||||||||
| Deconsolidation of investments in Tamarix LP |
(17,200 | ) | (2,909 | ) | (20,109 | ) | ||||||
| Amortization of discounts and premium |
802 | — | 802 | |||||||||
|
|
|
|
|
|
|
|||||||
| Level 3 assets, end of period |
$ | 201,720 | $ | — | $ | 201,720 | ||||||
|
|
|
|
|
|
|
|||||||
| For the Years Ended December 31, | ||||||||
| 2011 | 2010 | |||||||
| Level 3 assets, beginning of period |
$ | 156 | $ | 53 | ||||
| Warrants received and classified as Level 3 |
— | 137 | ||||||
| Unrealized gain (loss) on warrants included in earnings |
(156 | ) | 19 | |||||
| Write-off of warrants |
— | (53 | ) | |||||
|
|
|
|
|
|||||
| Level 3 assets, end of period |
$ | — | $ | 156 | ||||
|
|
|
|
|
|||||
The net change in unrealized appreciation (depreciation) for the years ended December 31, 2012, 2011 and 2010 reported within the net change in unrealized appreciation (depreciation) on investments in the Company’s consolidated statements of operations attributable to the Company’s Level 3 assets held at the end of the year was ($102), ($156) and $19.
The Company discloses fair value information about financial instruments, whether or not recognized in the balance sheet, for which it is practicable to estimate that value. Certain financial instruments are excluded from the disclosure requirements. Accordingly, the aggregate fair value amounts presented do not represent the underlying value of the Company.
134
Table of Contents
OFS Capital Corporation and Subsidiaries
Notes to Consolidated Financial Statements
(Amounts in thousands, except share and per share data)
| Note 7. | Fair Value of Financial Instruments (Continued) |
The estimated fair value amounts have been measured as of December 31, 2012 and 2011, and have not been reevaluated or updated for purposes of these financial statements subsequent to that date. As such, the estimated fair values of these financial instruments subsequent to the reporting date may be different than amounts reported at year end.
The information presented should not be interpreted as an estimate of the fair value of the entire company since a fair value calculation is only required for a limited portion of the Company’s assets and liabilities. Due to the wide range of valuation techniques and the degree of subjectivity used in making the estimates, comparisons between the Company’s disclosures and those of other companies may not be meaningful.
As of December 31, 2012 and 2011, the recorded book balances and estimated fair values of the Company’s financial instruments were as follows:
| December 31, | ||||||||||||||||
| 2012 | 2011 | |||||||||||||||
| Carrying Amount |
Fair Value |
Carrying Amount |
Fair Value |
|||||||||||||
| Financial assets: |
||||||||||||||||
| Cash and cash equivalents |
$ | 8,270 | $ | 8,270 | $ | 814 | $ | 814 | ||||||||
| Restricted cash and cash equivalents |
623 | 623 | — | — | ||||||||||||
| Investments, at fair value |
||||||||||||||||
| Debt investments |
227,542 | 227,542 | ||||||||||||||
| Equity investments |
4,657 | 4,657 | — | — | ||||||||||||
| Equity interest in OFS Capital WM |
— | — | 43,120 | 41,217 | ||||||||||||
| Other equity interests |
— | — | 2,455 | 2,619 | ||||||||||||
| Loans receivable, net |
— | — | 13,804 | 14,565 | ||||||||||||
| Interest receivable and other assets |
1,549 | 1,549 | 468 | 468 | ||||||||||||
| Financial liabilities: |
||||||||||||||||
| Revolving line of credit—Wells Fargo |
$ | 99,224 | $ | 99,224 | $ | — | $ | — | ||||||||
| Interest payable |
1,222 | 1,222 | — | — | ||||||||||||
| Note 8. | Loans Receivable |
At December 31, 2011, Tamarix LP had two loans receivable, which were then accounted for at cost and consolidated into the Company’s balance sheet. Effective May 10, 2012, Tamarix LP accounted for its loans receivable at fair value, and since then, the Company did not have any loans receivable accounted for at cost.
As a result of the February 23, 2011 amendment to the Loan Documents (see Note 3), which resulted in the derecognition of the loans receivable pledged to creditors under the sale accounting, there were no outstanding balance on loans receivable pledged to creditors at December 31, 2011.
Average impaired loans during the years ended December 31, 2011 and 2010 were $1,096 and $29,630, respectively. Average impaired loans, net of the allowance for loan loss, during the years ended December 31, 2011 and 2010 were $964 and $23,475, respectively. Income recognized on the sole impaired loan, which was repaid on June 30, 2011, on the cash and accrual basis for the year ended December 31, 2011 was $0. Income recognized on impaired loans on the cash and accrual basis for the year ended December 31, 2012 was $177 and $1,223, respectively.
135
Table of Contents
OFS Capital Corporation and Subsidiaries
Notes to Consolidated Financial Statements
(Amounts in thousands, except share and per share data)
| Note 8. | Loans Receivable (Continued) |
There were no TDRs with respect to the Company’s loans during the year ended December 31, 2011. Following its distribution of certain assets to OFSAM in September 2010, the Company retained one loan that underwent a troubled debt restructuring in 2010. The loan was performing pursuant to its restructured terms, and was not an impaired loan as of December 31, 2010. On September 30, 2011, that loan was distributed to OFSAM.
As of December 31, 2011, OFS Capital had no non-accrual loans. The Company also had no past due loans at December 31, 2011.
The details of loan loss allowance for loans receivable for the period January 1, 2012 through November 7, 2012, and the years ended December 31, 2011 and 2010 are summarized as follows:
| Pre-IPO Prior to becoming a BDC | ||||||||||||
| For the Period | For the Years Ended December 31, |
|||||||||||
| January 1, 2012 through November 7, 2012 |
2011 | 2010 | ||||||||||
| Balance—beginning of period |
$ | 219 | $ | 356 | $ | 18,793 | ||||||
| Net provision charged to expense |
— | 506 | (1,625 | ) | ||||||||
| Recoveries |
— | (439 | ) | — | ||||||||
| Write-offs |
— | (314 | ) | (13,623 | ) | |||||||
| Reclassification to loan held for sale |
— | — | (1,490 | ) | ||||||||
| Reversal upon conversion from cost to fair value accounting on loan investments |
(219 | ) | — | — | ||||||||
| Paid-in-kind interest income reversed on non-accrual loans |
— | 110 | 483 | |||||||||
| Reclassification to loans receivable pledged to creditors |
— | — | (2,182 | ) | ||||||||
|
|
|
|
|
|
|
|||||||
| Balance—end of period |
$ | — | $ | 219 | $ | 356 | ||||||
|
|
|
|
|
|
|
|||||||
As a result of the cumulative effect of accounting change to convert Tamarix LP’s loans receivable from cost to fair value, on May 10, 2012, OFS Capital reversed the $219 loan loss allowance on the loans held by Tamarix LP. During 2011, as a result of the repayment of an impaired loan, the Company recorded a loan loss recovery for this loan in the amount of $439. For the year ended December 31, 2011, the Company wrote off loan loss reserves in the amount of $314 on loans it distributed to OFSAM on September 30, 2011. A $110 addition to loan allowance for the year ended December 31, 2011 represented reversal of paid-in-kind interest on non-accrual loans which were not deemed collectible by OFS Capital. For the year ended December 31, 2010, of the $13,623 of write-offs, $6,531 was related to loan loss reserves previously recognized on certain loans which were exchanged for equity interests in the borrowers during debt restructurings in 2010, $6,736 related to loans distributed to OFSAM and $356 related to loans sold to unrelated third parties. Upon the exchange of debt for equity, and the Company’s distribution of certain assets to OFSAM on September 28, 2010, the loan balance and related loss reserve were written off. The $483 addition to loan allowance for the year ended December 31, 2010 represented reversal of paid-in-kind interest on non-accrual loans which were not deemed collectible by OFS Capital at December 31, 2010.
136
Table of Contents
OFS Capital Corporation and Subsidiaries
Notes to Consolidated Financial Statements
(Amounts in thousands, except share and per share data)
| Note 8. | Loans Receivable (Continued) |
The details of loan loss allowance for loans receivable pledged to creditors for the period January 1, 2012 through November 7, 2012, and the years ended December 31, 2011 and 2010 are summarized as follows:
| Pre-IPO Prior to becoming a BDC | ||||||||||||
| For the Period | For the Years Ended December 31, |
|||||||||||
| January 1, 2012 through November 7, 2012 |
2011 | 2010 | ||||||||||
| Balance—beginning of period |
$ | — | $ | 1,417 | $ | — | ||||||
| Net provision (benefit) charged to expense |
— | (266 | ) | (765 | ) | |||||||
| Write-offs |
— | (1,151 | ) | — | ||||||||
| Reclassification to loans receivable pledged to creditors |
— | — | 2,182 | |||||||||
|
|
|
|
|
|
|
|||||||
| Balance—end of period |
$ | — | $ | — | $ | 1,417 | ||||||
|
|
|
|
|
|
|
|||||||
For the year ended December 31, 2011, the $1,151 write-off was related to the OFS Capital WM Transaction. Under the sale accounting treatment, effective February 23, 2011, the loan loss allowance was written off upon the sale of the loans to OFS Capital WM.
| Note 9. | Commitments and Contingencies |
At December 31, 2012 and 2011, the Company had a $1,500 unused line of credit granted to a borrower.
On March 27, 2012, we entered into a new subscription agreement (“Subscription Agreement”) with respect to an investment in Tamarix LP, which superseded prior agreements and was contingent upon issuance of the license from the SBA. Under the terms of the Subscription Agreement, our investment in Tamarix LP will not exceed $25,000. On April 2, 2012, OFS Capital funded $1,584 to Tamarix LP. In March and April 2012, Tamarix LP also received an aggregate of $207 and $709, respectively, from other investors. These funds, totaling $2,500, were called by Tamarix LP as requested by the SBA and would be used as initial capital of Tamarix LP once Tamarix LP received the SBIC license. On May 10, 2012, as a result of Tamarix LP’s receipt of the SBIC license, our equity investment in Tamarix LP was no longer contingent, and our advance to Tamarix LP in the amount of $1,584 was reclassified to an equity investment in Tamarix LP. In July 2012, we made an additional equity investment of $3,242 in Tamarix LP. As of December 31, 2012, our committed but uncalled capital investment in Tamarix LP was approximately $20,100.
From time to time, the Company is involved in legal proceedings in the normal course of its business. Although the outcome of such litigation cannot be predicted with any certainty, management is of the opinion, based on the advice of legal counsel, that final disposition of any litigation should not have a material adverse effect on the financial position of the Company.
In the normal course of business, the Company enters into contracts and agreements that contain a variety of representations and warranties that provide general indemnifications. The Company’s maximum exposure under these arrangements is unknown, as this would involve future claims that may be made against the Company that have not occurred. The Company believes the risk of any material obligation under these indemnifications to be unlikely.
137
Table of Contents
OFS Capital Corporation and Subsidiaries
Notes to Consolidated Financial Statements
(Amounts in thousands, except share and per share data)
| Note 10. | Revolving Line of Credit |
On September 28, 2010, OFS Capital WM entered into a $180,000 secured revolving credit facility with Wells Fargo and Madison Capital Funding, LLC (“Madison Capital”, an affiliated entity of the Loan Manager), with the Class A lenders (initially Wells Fargo) providing up to $135,000 in Class A loans (“Class A Facility”) and the Class B lenders (initially Madison Capital) providing up to $45,000 in Class B loans to OFS Capital WM (“Class B Facility”) (Class A Facility and Class B Facility are collectively referred to as the ‘WM Credit Facility”). The WM Credit Facility is secured by the Eligible Loans transferred to OFS Capital WM by OFS Capital on the date of the OFS Capital WM Transaction and any eligible loan assets subsequently acquired by OFS Capital WM. The loan facilities with Wells Fargo and Madison Capital had five- and six-year terms, respectively, and both facilities provided a one-year option for extension upon the approval of the Class A and Class B lenders. The loan facilities had a reinvestment period of two years after the closing date of the WM Credit Facility, which could be extended by one year with the consent of each lender. Outstanding borrowings on the loan facilities were limited to the lesser of (1) $180,000 and (2) the borrowing base as defined by the Loan Documents. OFS Capital WM is obligated to pay interest on outstanding Class A loans and Class B loans (until the termination of the Class B Facility) on each quarterly payment date. Prior to September 28, 2012, outstanding Class A loans accrued interest equal to LIBOR plus 3.00% per annum, and outstanding Class B loans accrued interest equal to LIBOR plus 4.00% per annum. OFS Capital WM has the right to repay loans outstanding under the facility in part from time to time, subject to applicable prepayment fee. The unused commitment fee on the Class A Facility is (1) 0.5% per annum of the first $25,000 of the unused facility and (2) 2% per annum of the balance in excess of $25,000. The unused commitment fee on the Class B Facility was 0.5% per annum. In connection with the closing of the WM Credit Facility, OFS Capital WM incurred financing costs of $3,501, which were deferred and amortized over the terms of WM Credit Facility.
Under the OFS Capital WM Credit Facility, the Loan Manager charges both a senior and subordinated management fee to OFS Capital WM for its services, each at 0.25% per annum of the assigned value of the underlying portfolio investments, which value is determined by the Controlling Lender (as defined in the OFS Capital WM loan documents), plus an accrued fee that is deferred until after the end of the investment period of the portfolio investments. For the period November 8, 2012 through December 31, 2012, and the period January 1, 2012 through November 7, 2012, the Company incurred management fee expense of $141 and $650, respectively, to the Loan Manager.
On September 28, 2012, the OFS Capital WM Credit Facility was amended (“Amended WM Credit Facility”). Under the Amended WM Credit Facility, (1) the loans with both Wells Fargo and Madison Capital were extended to December 31, 2016, and both loans provided for a one-year option for extension upon the approval of the Class A and Class B lenders; (2) the reinvestment period for both loans was extended to December 31, 2013, which could be further extended by one year with the consent of each lender; (3) the accrued interest rate on outstanding Class A loans was amended to LIBOR plus 2.75% per annum, and (4) the accrued interest rate on outstanding Class B loans was amended to LIBOR plus 6.50%. In connection with the Amended WM Credit Facility, OFS Capital WM incurred financing costs of $675. The deferred financing costs under the Amended WM Credit Facility, together with the unamortized deferred financing costs under the WM Credit Facility of $2,350 at September 28, 2012, are being amortized over the Amended WM Credit Facility (see Note 14 regarding an additional amendment to the WM Credit Facility in January 2013).
| Note 11. | Federal Income Tax |
The Company intends to be treated as a RIC under Subchapter M of the Code, and to distribute substantially all of its respective net taxable income. Accordingly, no provision for federal income tax has been recorded in the
138
Table of Contents
OFS Capital Corporation and Subsidiaries
Notes to Consolidated Financial Statements
(Amounts in thousands, except share and per share data)
| Note 11. | Federal Income Tax (Continued) |
financial statements. Taxable income differs from net increase in net assets resulting from operations primarily due to unrealized appreciation or depreciation on investments, as investment gains and losses are not included in taxable income until they are realized.
The following reconciles the net increase in net assets resulting from operations to taxable income for the period November 8, 2012 through December 31, 2012:
| Net increase in net assets resulting from operations |
$ | 923 | ||
| Net unrealized depreciation on investments |
611 | |||
| Permanent differences |
63 | |||
|
|
|
|||
| Taxable income before deductions for distributions * |
$ | 1,597 | ||
|
|
|
| *—The | Company’s taxable income for 2012 is an estimate and will not be finally determined until the Company files its 2012 federal income tax return in 2013. Therefore, the Company’s actual taxable income may be different than this estimate. |
The tax character of distributions paid in respect of the period November 8, 2012 through December 31, 2012 was as follows:
| Ordinary income |
$ | 1,597 | ||
| Return of capital |
31 | |||
|
|
|
|||
| Total |
$ | 1,628 | ||
|
|
|
| Note 12. | Financial Highlights |
The financial highlights for the Company are as follows: (1)
| Post-IPO as a Business Development Company |
||||
| November 8, 2012 through December 31, 2012 |
||||
| Per share data: |
||||
| Net asset value at beginning of period |
N/A | (2) | ||
| Issuance of common stock and capital contributions |
N/A | (2) | ||
| Dividend declared |
N/A | (2) | ||
| Offering costs |
N/A | (2) | ||
| Net investment income |
N/A | (2) | ||
| Realized gain (loss) on investments |
N/A | (2) | ||
| Unrealized appreciation (depreciation) on investments |
N/A | (2) | ||
| Net asset value at end of period |
$ | 14.80 | ||
| Per share market value, end of period |
$ | 13.69 | ||
| Total return based on market value |
(7.6 | %) (3) | ||
| Shares outstanding at end of period |
9,578,691 | |||
| Ratios to average assets: |
||||
| Expense without incentive fees |
13.6 | % (4) | ||
| Incentive fees |
— | (4) | ||
| Total expenses |
13.6 | % (4) | ||
| Net investment income without incentive fees |
4.6 | % (4) | ||
| Average net asset value |
$ | 98,164 | (5) | |
139
Table of Contents
OFS Capital Corporation and Subsidiaries
Notes to Consolidated Financial Statements
(Amounts in thousands, except share and per share data)
| Note 12. | Financial Highlights (Continued) |
| (1) | Years prior to the Company’s November 7, 2012 IPO are not presented in the financial highlights because the Company did not record all investment assets at fair value. Therefore, the information would not be meaningful. |
| (2) | Per share data is not provided as the Company did not have shares of common stock outstanding prior to its IPO. |
| (3) | Based on time period from November 7, 2012 (date of stock issuance) through December 31, 2012. Calculation is ending market value less beginning market value, adjusting for dividends. |
| (4) | Annualized. |
| (5) | Based on the average net asset value at November 8, 2012 and December 31, 2012. |
| Note 13. | Extraordinary Gain (Loss) |
OFS Capital WM settles its quarterly waterfall distributions twenty days following the end of each calendar quarter. As a result, the OFS Capital WM waterfall distribution for the fourth quarter of 2012 was made on January 22, 2013. Although the fourth quarter equity distribution included $873 relating to the pre-IPO period from October 1, 2012 through November 7, 2012, which could have been redistributed for the benefit of OFSAM—-which was the sole member of OFS Capital prior to the IPO—-the entire equity distribution from the January 22, 2013 waterfall was instead retained by OFS Capital WM’s sole member, OFS Capital. As a result, OFS Capital recorded an extraordinary gain in the amount of $873 for the post-IPO period from November 8, 2012 through December 31, 2012, and an extraordinary loss in the same amount for the period January 1, 2012 through November 7, 2012.
| Note 14. | Subsequent Events |
On January 22, 2013, the WM Credit Facility was further amended, pursuant to which the Class B Facility was terminated. As a result, the WM Credit Facility was reduced from $180,000 to $135,000.
On March 13, 2013, the Company made an additional equity investment in Tamarix LP pursuant to its capital call in the amount of $2,169. Also on March 13, 2013, the Company made an additional equity investment in Tamarix GP in the amount of $11.
On March 26, 2013, the Company announced that it had declared a dividend of $0.34 per share for the quarter ending March 31, 2013, payable on April 30, 2013 to stockholders of record as of the close of business on April 17, 2013.
In preparing these financial statements, the Company has evaluated subsequent events and transactions for potential recognition and/or disclosure.
140
Table of Contents
To the Member
OFS Capital WM, LLC
Rolling Meadows, Illinois
We have audited the accompanying statements of assets and liabilities, including the schedules of investments, of OFS Capital WM, LLC (the Company) as of December 31, 2011 and 2010, and the related statements of operations, changes in net assets and cash flows for the year ended December 31, 2011 and the period September 28, 2010 (commencement of operations) through December 31, 2010. These financial statements are the responsibility of the Company’s management. Our responsibility is to express an opinion on these financial statements based on our audits.
We conducted our audits in accordance with auditing standards generally accepted in the United States of America. Those standards require that we plan and perform the audit to obtain reasonable assurance about whether the financial statements are free of material misstatement. An audit includes examining, on a test basis, evidence supporting the amounts and disclosures in the financial statements. An audit also includes assessing the accounting principles used and significant estimates made by management, as well as evaluating the overall financial statement presentation. We believe that our audits provide a reasonable basis for our opinion.
In our opinion, the financial statements referred to above present fairly, in all material respects, the financial position of OFS Capital WM, LLC as of December 31, 2011 and 2010, and the results of its operations and its cash flows for the year ended December 31, 2011 and the period September 28, 2010 (commencement of operations) through December 31, 2010, in conformity with accounting principles generally accepted in the United States of America.
As explained in Note 5, the financial statements include investments valued at $207,828,000 (482% of net assets) and $32,785,000 (55% of net assets) at December 31, 2011 and 2010, respectively, whose fair values have been estimated by management in the absence of readily ascertainable fair values.
/s/ McGladrey & Pullen, LLP
Chicago, Illinois
March 13, 2012
141
Table of Contents
OFS Capital WM, LLC
Statements of Assets and Liabilities
(Amounts in thousands)
| December 31, | ||||||||
| 2011 | 2010 | |||||||
| Assets |
||||||||
| Investments, at fair value (cost of $213,762 and $32,239, respectively) |
$ | 207,828 | $ | 32,785 | ||||
| Cash and cash equivalents |
4,274 | 1,396 | ||||||
| Restricted cash and cash equivalents |
623 | 10,932 | ||||||
| Receivable repledged to creditor |
— | 81,351 | ||||||
| Interest receivable |
759 | 80 | ||||||
| Deferred financing closing costs, net of accumulated amortization of $721 and $151, respectively |
2,780 | 3,350 | ||||||
|
|
|
|
|
|||||
| 216,264 | 129,894 | |||||||
|
|
|
|
|
|||||
| Liabilities |
||||||||
| Revolving line of credit—Wells Fargo |
134,123 | 48,962 | ||||||
| Revolving line of credit—Madison Capital |
37,244 | 20,000 | ||||||
| Interest payable |
1,272 | 707 | ||||||
| Management fee payable |
253 | 111 | ||||||
| Due to affiliate |
10 | 7 | ||||||
| Accrued expenses and other liabilities |
242 | — | ||||||
|
|
|
|
|
|||||
| 173,144 | 69,787 | |||||||
|
|
|
|
|
|||||
| Net assets |
$ | 43,120 | $ | 60,107 | ||||
|
|
|
|
|
|||||
See Notes to Financial Statements.
142
Table of Contents
OFS Capital WM, LLC
(Amounts in thousands)
| For the Year Ended December 31, 2011 |
For the Period September 28, 2010 through December 31, 2010 |
|||||||
| Investment income: |
||||||||
| Interest |
$ | 13,576 | $ | 1,726 | ||||
|
|
|
|
|
|||||
| Expenses: |
||||||||
| Interest |
4,484 | 707 | ||||||
| Management fees |
912 | 111 | ||||||
| Amortization of deferred financing closing costs |
572 | 151 | ||||||
| Administrative expenses |
454 | 8 | ||||||
|
|
|
|
|
|||||
| Total expenses |
6,422 | 977 | ||||||
|
|
|
|
|
|||||
| Net investment income |
7,154 | 749 | ||||||
|
|
|
|
|
|||||
| Gain (loss) on investments and receivable repledged to creditor |
||||||||
| Net realized loss on investments |
(991 | ) | — | |||||
| Net realized loss on investments—related party |
(248 | ) | — | |||||
| Net realized loss on receivable repledged to creditor |
(71 | ) | — | |||||
| Net change in unrealized (depreciation) appreciation on investments |
(6,482 | ) | 546 | |||||
| Net change in unrealized appreciation on receivable repledged to creditor |
— | 1,058 | ||||||
|
|
|
|
|
|||||
| Net gain (loss) on investments and receivable repledged to creditor |
(7,792 | ) | 1,604 | |||||
|
|
|
|
|
|||||
| Net increase (decrease) in net assets resulting from operations |
$ | (638 | ) | $ | 2,353 | |||
|
|
|
|
|
|||||
See Notes to Financial Statements.
143
Table of Contents
OFS Capital WM, LLC
Statements of Changes in Net Assets
(Amounts in thousands)
| For the Year Ended December 31, 2011 |
For the Period September 28, 2010 through December 31, 2010 |
|||||||
| Increase (decrease) in net assets resulting from operations: |
||||||||
| Net investment income |
$ | 7,154 | $ | 749 | ||||
| Net gain (loss) on investments and receivable repledged to creditor |
(7,792 | ) | 1,604 | |||||
|
|
|
|
|
|||||
| Net increase (decrease) in net assets resulting from operations |
(638 | ) | 2,353 | |||||
|
|
|
|
|
|||||
| Capital contributions |
— | 57,754 | ||||||
| Distributions |
(16,349 | ) | — | |||||
|
|
|
|
|
|||||
| Total increase (decrease) in net assets |
(16,987 | ) | 60,107 | |||||
| Net assets, beginning of period |
60,107 | — | ||||||
|
|
|
|
|
|||||
| Net assets, end of period |
$ | 43,120 | $ | 60,107 | ||||
|
|
|
|
|
|||||
See Notes to Financial Statements.
144
Table of Contents
OFS Capital WM, LLC
(Amounts in thousands)
| For the Year Ended December 31, 2011 |
For the Period September 28, 2010 through December 31, 2010 |
|||||||
| Cash Flows From Operating Activities |
||||||||
| Net (decrease) increase in net assets resulting from operations |
$ | (638 | ) | $ | 2,353 | |||
| Adjustments to reconcile net (decrease) increase in net assets resulting from operations to net cash used in operating activities: |
||||||||
| Amortization of deferred financing closing costs |
572 | 151 | ||||||
| Amortization of discounts and premium |
(2,822 | ) | (17 | ) | ||||
| Amortization of deferred fee revenue |
(46 | ) | — | |||||
| Cash collection of deferred fee revenue |
116 | — | ||||||
| Net change in unrealized depreciation (appreciation) on investments |
6,482 | (546 | ) | |||||
| Net change in unrealized appreciation on receivable repledged to creditor |
— | (1,058 | ) | |||||
| Net realized loss on receivable repledged to creditor |
71 | — | ||||||
| Net realized loss on investments |
991 | — | ||||||
| Net realized loss on investments—related party |
248 | — | ||||||
| Purchase of portfolio investments |
(186,295 | ) | (32,537 | ) | ||||
| Proceeds from principal payments and sale of portfolio investments |
74,430 | 315 | ||||||
| Receivable repledged to creditors |
— | (36,255 | ) | |||||
| Collection of receivable repledged to creditors |
6,335 | 13,305 | ||||||
| Changes in operating assets and liabilities: |
||||||||
| Interest receivable |
(467 | ) | (80 | ) | ||||
| Due to affiliate |
3 | 7 | ||||||
| Interest payable |
565 | 707 | ||||||
| Management fee payable |
142 | 111 | ||||||
| Accrued expenses and other liabilities |
170 | — | ||||||
|
|
|
|
|
|||||
| Net cash used in operating activities |
(100,143 | ) | (53,544 | ) | ||||
|
|
|
|
|
|||||
| Cash Flows From Investing Activities |
||||||||
| Change in restricted cash balance |
10,309 | (10,932 | ) | |||||
|
|
|
|
|
|||||
| Net cash provided by (used in) investing activities |
10,309 | (10,932 | ) | |||||
|
|
|
|
|
|||||
| Cash Flows From Financing Activities |
||||||||
| Net proceeds from borrowings on revolving lines of credit |
102,405 | 68,962 | ||||||
| Distribution to member |
(9,693 | ) | — | |||||
| Contribution from member |
— | 411 | ||||||
| Payment of loan facility closing costs |
— | (3,501 | ) | |||||
|
|
|
|
|
|||||
| Net cash provided by financing activities |
92,712 | 65,872 | ||||||
|
|
|
|
|
|||||
| Net increase in cash and cash equivalents |
$ | 2,878 | $ | 1,396 | ||||
| Cash and cash equivalents—beginning of period |
1,396 | — | ||||||
|
|
|
|
|
|||||
| Cash and cash equivalents—end of period |
$ | 4,274 | $ | 1,396 | ||||
|
|
|
|
|
|||||
(Continued)
145
Table of Contents
OFS Capital WM, LLC
Statements of Cash Flows (Continued)
(Amounts in thousands)
| For the Year Ended December 31, 2011 |
For the Period September 28, 2010 through December 31, 2010 |
|||||||
| Supplemental Disclosure of Cash Flow Information: |
||||||||
| Cash paid during the period for interest |
$ | 3,919 | $ | — | ||||
| Supplemental Disclosure of Noncash Activities: |
||||||||
| Investments purchased from OFS Capital, LLC under sale accounting |
$ | 77,055 | $ | — | ||||
| Initial purchase discounts on investments purchased from OFS Capital, LLC |
2,322 | — | ||||||
| Derecognition of receivable repledged to creditors under sale accounting |
74,945 | — | ||||||
| Interest receivable recognized under sale accounting |
212 | — | ||||||
| Portfolio investments distributed to OFS Capital, LLC |
6,656 | — | ||||||
| Debt investments contributed by the Member in exchange for a membership interest of the same amount |
— | 57,343 | ||||||
See Notes to Financial Statements.
146
Table of Contents
OFS Capital WM , LLC
As of December 31, 2011
(Amounts in thousands)
| Name of Portfolio Company |
Type of Investment | Interest (1) | Maturity | Principal Amount |
Cost | Fair Value | Percent of Net Assets |
|||||||||||||||||
| United States |
||||||||||||||||||||||||
| Debt Investments |
||||||||||||||||||||||||
| Aerospace & Defense |
||||||||||||||||||||||||
| TronAir, Inc. |
Senior Secured | 7.25% | 12/3/2015 | $ | 4,750 | $ | 4,691 | $ | 4,624 | 10.7 | ||||||||||||||
| Loan | (LIBOR +5.50%) | |||||||||||||||||||||||
| Term Loan | (Prime +4.50%) | |||||||||||||||||||||||
| Whitcraft LLC |
Senior Secured | 6.50% | 12/16/2015 | 4,814 | 4,741 | 4,585 | 10.6 | |||||||||||||||||
| Loan | (LIBOR +5.00%) | |||||||||||||||||||||||
| Term Loan | (Prime +3.75%) | |||||||||||||||||||||||
|
|
|
|
|
|
|
|
|
|||||||||||||||||
| 9,564 | 9,432 | 9,209 | 21.3 | |||||||||||||||||||||
|
|
|
|
|
|
|
|
|
|||||||||||||||||
| Automobile |
||||||||||||||||||||||||
| BBB Industries, LLC |
Senior Secured | 6.50% | 6/29/2013 | 4,763 | 4,733 | 4,662 | 10.8 | |||||||||||||||||
| Loan | (LIBOR +4.50%) | |||||||||||||||||||||||
| Term Loan (First | (Prime +3.25%) | |||||||||||||||||||||||
| Lien) | ||||||||||||||||||||||||
| Trico Products |
Senior Secured | 6.25% | 7/22/2016 | 4,937 | 4,866 | 4,710 | 10.9 | |||||||||||||||||
| Corporation |
Loan | (LIBOR +4.75%) | ||||||||||||||||||||||
| Term Loan | (Prime +3.50%) | |||||||||||||||||||||||
|
|
|
|
|
|
|
|
|
|||||||||||||||||
| 9,700 | 9,599 | 9,372 | 21.7 | |||||||||||||||||||||
|
|
|
|
|
|
|
|
|
|||||||||||||||||
| Buildings & Real Estate |
||||||||||||||||||||||||
| ASP PDM Acquisition LLC |
Senior Secured | 5.75% | 12/31/2013 | 1,370 | 1,311 | 1,117 | 2.6 | |||||||||||||||||
| Loan | (LIBOR +4.75%) | |||||||||||||||||||||||
| Term Loan A | (Prime +3.75%) | |||||||||||||||||||||||
|
|
|
|
|
|
|
|
|
|||||||||||||||||
| 1,370 | 1,311 | 1,117 | 2.6 | |||||||||||||||||||||
|
|
|
|
|
|
|
|
|
|||||||||||||||||
| Chemicals, Plastics & Rubber |
||||||||||||||||||||||||
| CR Brands, Inc. |
Senior Secured | 8.25% | 12/31/2012 | 505 | 487 | 466 | 1.1 | |||||||||||||||||
| Loan | (LIBOR +5.50%) | |||||||||||||||||||||||
| Term Loan | (Prime +4.50%) | |||||||||||||||||||||||
|
|
|
|
|
|
|
|
|
|||||||||||||||||
| 505 | 487 | 466 | 1.1 | |||||||||||||||||||||
|
|
|
|
|
|
|
|
|
|||||||||||||||||
| Distributors |
||||||||||||||||||||||||
| Consolidated |
Senior Secured | 6.75% | 1/27/2016 | 4,813 | 4,751 | 4,601 | 10.7 | |||||||||||||||||
| Equipment Parts Inc |
Loan | (LIBOR +5.00%) | ||||||||||||||||||||||
| Term Loan | (Prime +4.00%) | |||||||||||||||||||||||
| Lindstrom Metric, LLC |
Senior Secured | 6.26% | 7/12/2016 | 5,000 | 4,939 | 4,777 | 11.1 | |||||||||||||||||
| Loan | (LIBOR +4.75%) | |||||||||||||||||||||||
| Term Loan | (Prime +3.50%) | |||||||||||||||||||||||
| Phillips Feed & Pet Supply |
Senior Secured | 7.50% | 10/13/2015 | 3,420 | 3,361 | 3,310 | 7.7 | |||||||||||||||||
| Loan | (LIBOR +5.25%) | |||||||||||||||||||||||
| Term Loan | (Prime +4.25%) | |||||||||||||||||||||||
|
|
|
|
|
|
|
|
|
|||||||||||||||||
| 13,233 | 13,051 | 12,688 | 29.5 | |||||||||||||||||||||
|
|
|
|
|
|
|
|
|
|||||||||||||||||
147
Table of Contents
OFS Capital WM , LLC
Schedule of Investments (Continued)
As of December 31, 2011
(Amounts in thousands)
| Name of Portfolio Company |
Type of Investment | Interest (1) | Maturity | Amount Principal |
Cost | Fair Value | Percent of Net Assets |
|||||||||||||||||||
| Diversified/Conglomerate Manufacturing |
|
|||||||||||||||||||||||||
| Jameson LLC |
Senior Secured | 7.50% | 10/1/2015 | 3,463 | 3,410 | 2,787 | 6.5 | |||||||||||||||||||
| Loan | (LIBOR +5.50%) | |||||||||||||||||||||||||
| Term Loan | (Prime +4.50%) | |||||||||||||||||||||||||
| Phillips Plastics |
Senior Secured | 6.50% | 8/12/2017 | 1,729 | 1,685 | 1,589 | 3.7 | |||||||||||||||||||
| Loan | (LIBOR +5.00%) | |||||||||||||||||||||||||
| Term Loan | (Prime +4.00%) | |||||||||||||||||||||||||
| Revere Industries, LLC |
Senior Secured | 9.00% | 6/30/2013 | 1,889 | 1,897 | 1,914 | 4.4 | |||||||||||||||||||
| Loan | (LIBOR +6.00%) | |||||||||||||||||||||||||
| Rollover Loans | (Prime +5.00%) | |||||||||||||||||||||||||
| Royal Adhesives |
Senior Secured | 7.25% | 11/29/2015 | 4,786 | 4,727 | 4,665 | 10.8 | |||||||||||||||||||
| Loan | (LIBOR +5.50%) | |||||||||||||||||||||||||
| Term Loan A | (Prime +4.50%) | |||||||||||||||||||||||||
|
|
|
|
|
|
|
|
|
|||||||||||||||||||
| 11,867 | 11,719 | 10,955 | 25.4 | |||||||||||||||||||||||
|
|
|
|
|
|
|
|
|
|||||||||||||||||||
| Diversified/Conglomerate Service |
|
|||||||||||||||||||||||||
| Charter Brokerage LLC |
Senior Secured | 8.00% | 7/13/2016 | 4,932 | 4,850 | 4,850 | 11.3 | |||||||||||||||||||
| Loan | (LIBOR +6.50%) | |||||||||||||||||||||||||
| Term Loan A | (Prime +5.50%) | |||||||||||||||||||||||||
| Elgin Fasteners Group |
Senior Secured | 7.75% | 8/26/2016 | 4,937 | 4,795 | 4,795 | 11.1 | |||||||||||||||||||
| Loan | (LIBOR +6.25%) | |||||||||||||||||||||||||
| Term Loan | (Prime +5.25%) | |||||||||||||||||||||||||
| Kellermeyer Building |
Senior Secured | 6.75% | 12/17/2015 | 4,862 | 4,772 | 4,658 | 10.8 | |||||||||||||||||||
| Services, LLC |
Loan | (LIBOR +5.00%) | ||||||||||||||||||||||||
| Term Loan | (Prime +3.75%) | |||||||||||||||||||||||||
| SM G |
Senior Secured | 3.37% | 7/27/2014 | 4,854 | 4,689 | 4,397 | 10.2 | |||||||||||||||||||
| Loan | (LIBOR +3.00%) | |||||||||||||||||||||||||
| Term B Loan | (Prime +2.00%) | |||||||||||||||||||||||||
|
|
|
|
|
|
|
|
|
|||||||||||||||||||
| 19,585 | 19,106 | 18,700 | 43.4 | |||||||||||||||||||||||
|
|
|
|
|
|
|
|
|
|||||||||||||||||||
| Ecological |
||||||||||||||||||||||||||
| JWC Environmental, |
Senior Secured | 6.00% | 8/3/2016 | 4,988 | 4,939 | 4,724 | 11.0 | |||||||||||||||||||
| LLC |
Loan | (LIBOR +4.50%) | ||||||||||||||||||||||||
| Term Loan | (Prime +3.50%) | |||||||||||||||||||||||||
|
|
|
|
|
|
|
|
|
|||||||||||||||||||
| 4,988 | 4,939 | 4,724 | 11.0 | |||||||||||||||||||||||
|
|
|
|
|
|
|
|
|
|||||||||||||||||||
| Electrical Components & Equipment |
|
|||||||||||||||||||||||||
| Barcodes, LLC |
Senior Secured | 7.25% | 7/27/2015 | 4,609 | 4,549 | 4,444 | 10.3 | |||||||||||||||||||
| Loan | (LIBOR +5.00%) | |||||||||||||||||||||||||
| Term Loan | (Prime +4.00%) | |||||||||||||||||||||||||
| Universal Air Filter |
Senior Secured | 8.00% | 6/30/2015 | 4,476 | 4,438 | 4,473 | 10.4 | |||||||||||||||||||
| Company |
Loan | (LIBOR +6.25%) | ||||||||||||||||||||||||
| Term Loan | (Prime +5.25%) | |||||||||||||||||||||||||
|
|
|
|
|
|
|
|
|
|||||||||||||||||||
| 9,085 | 8,987 | 8,917 | 20.7 | |||||||||||||||||||||||
|
|
|
|
|
|
|
|
|
|||||||||||||||||||
| Electronics |
||||||||||||||||||||||||||
| Strategic Products and |
Senior Secured | 7.00% | 10/21/2016 | 5,000 | 4,952 | 4,837 | 11.2 | |||||||||||||||||||
| Services, LLC |
Loan | (LIBOR +5.50%) | ||||||||||||||||||||||||
| Term Loan | (Prime +4.50%) | |||||||||||||||||||||||||
|
|
|
|
|
|
|
|
|
|||||||||||||||||||
| 5,000 | 4,952 | 4,837 | 11.2 | |||||||||||||||||||||||
|
|
|
|
|
|
|
|
|
|||||||||||||||||||
148
Table of Contents
OFS Capital WM , LLC
Schedule of Investments (Continued)
As of December 31, 2011
(Amounts in thousands)
| Name of Portfolio Company |
Type of Investment | Interest (1) | Maturity | Principal Amount |
Cost | Fair Value | Percent of Net Assets |
|||||||||||||||||
| Environmental Consulting & Services |
||||||||||||||||||||||||
| Apex Companies, LLC |
Senior Secured | 7.50% | 12/10/2016 | 4,723 | 4,662 | 4,599 | 10.7 | |||||||||||||||||
| Loan | (LIBOR +5.75%) | |||||||||||||||||||||||
| Term Loan | (Prime +4.75%) | |||||||||||||||||||||||
|
|
|
|
|
|
|
|
|
|||||||||||||||||
| 4,723 | 4,662 | 4,599 | 10.7 | |||||||||||||||||||||
|
|
|
|
|
|
|
|
|
|||||||||||||||||
| Finance |
||||||||||||||||||||||||
| Compass DPC Merger |
Senior Secured | 7.00% | 10/21/2016 | 5,000 | 4,952 | 4,843 | 11.2 | |||||||||||||||||
| Sub, Inc. |
Loan | (LIBOR +5.50%) | ||||||||||||||||||||||
| Term Loan | (Prime +4.50%) | |||||||||||||||||||||||
| H.D. Vest, Inc. |
Senior Secured | 7.00% | 10/3/2017 | 4,969 | 4,896 | 4,762 | 11.0 | |||||||||||||||||
| Loan | (LIBOR +5.50%) | |||||||||||||||||||||||
| Term Loan | (Prime +4.50%) | |||||||||||||||||||||||
| Townsend Acquisition |
Senior Secured | 7.00% | 5/18/2016 | 5,000 | 4,875 | 4,759 | 11.0 | |||||||||||||||||
| LLC |
Loan | (LIBOR +4.75%) | ||||||||||||||||||||||
| Term Loan | (Prime +3.75%) | |||||||||||||||||||||||
|
|
|
|
|
|
|
|
|
|||||||||||||||||
| 14,969 | 14,723 | 14,364 | 33.2 | |||||||||||||||||||||
|
|
|
|
|
|
|
|
|
|||||||||||||||||
| Healthcare, Education & Childcare |
||||||||||||||||||||||||
| Behavioral Health |
Senior Secured | 5.75% | 8/18/2016 | 4,987 | 4,939 | 4,700 | 10.9 | |||||||||||||||||
| Group |
Loan | (LIBOR +4.50%) | ||||||||||||||||||||||
| Term Loan A | (Prime +3.50%) | |||||||||||||||||||||||
| Cambridge Major |
Senior Secured | 6.51% | 8/11/2015 | 4,548 | 4,488 | 4,349 | 10.1 | |||||||||||||||||
| Laboratories, Inc |
Loan | (LIBOR +5.00%) | ||||||||||||||||||||||
| Term Loan | (Prime +4.00%) | |||||||||||||||||||||||
| Einstruction Corporation |
Senior Secured | 6.56% | 7/2/2013 | 4,721 | 4,636 | 4,529 | 10.5 | |||||||||||||||||
| Loan | (LIBOR +6.25%) | |||||||||||||||||||||||
| First Lien Term Loan | (Prime +5.00%) | |||||||||||||||||||||||
| Freedom Innovations |
Senior Secured | 6.50% | 7/13/2016 | 4,937 | 4,864 | 4,745 | 11.0 | |||||||||||||||||
| LLC |
Loan | (LIBOR +5.00%) | ||||||||||||||||||||||
| Term Loan | (Prime +4.00%) | |||||||||||||||||||||||
| MCMC LLC |
Senior Secured | 7.51% | 9/30/2016 | 5,000 | 4,926 | 4,908 | 11.4 | |||||||||||||||||
| Loan | (LIBOR +6.00%) | |||||||||||||||||||||||
| Term Loan A | (Prime +5.00%) | |||||||||||||||||||||||
| MedTech Group, Inc. |
Senior Secured | 7.00% | 9/7/2016 | 4,906 | 4,837 | 4,701 | 10.9 | |||||||||||||||||
| Loan | (LIBOR +5.50%) | |||||||||||||||||||||||
| Term Loan | (Prime +4.50%) | |||||||||||||||||||||||
| NeuroTherm , Inc |
Senior Secured | 6.50% | 2/1/2016 | 4,799 | 4,727 | 4,573 | 10.6 | |||||||||||||||||
| Loan | (LIBOR +5.00%) | |||||||||||||||||||||||
| Term Loan | (Prime +4.00%) | |||||||||||||||||||||||
| Strata Pathology |
Senior Secured | 6.50% | 6/30/2016 | 4,975 | 4,892 | 4,781 | 11.1 | |||||||||||||||||
| Services, Inc. |
Loan | (LIBOR +5.00%) | ||||||||||||||||||||||
| Term Loan | (Prime +4.00%) | |||||||||||||||||||||||
| Studer Group LLC |
Senior Secured | 7.00% | 9/28/2016 | 4,938 | 4,865 | 4,788 | 11.1 | |||||||||||||||||
| Loan | (LIBOR +5.50%) | |||||||||||||||||||||||
| Term Loan | (Prime +4.50%) | |||||||||||||||||||||||
| The Ritedose |
Senior Secured | 6.50% | 11/10/2016 | 4,750 | 4,672 | 4,488 | 10.4 | |||||||||||||||||
| Corporation |
Loan | (LIBOR +4.75%) | ||||||||||||||||||||||
| Term Loan | (Prime +3.75%) | |||||||||||||||||||||||
|
|
|
|
|
|
|
|
|
|||||||||||||||||
| 48,561 | 47,846 | 46,562 | 108.0 | |||||||||||||||||||||
|
|
|
|
|
|
|
|
|
|||||||||||||||||
149
Table of Contents
OFS Capital WM, LLC
Schedule of Investments (Continued)
As of December 31, 2011
(Amounts in thousands)
| Name of Portfolio Company |
Type of Investment | Interest (1) | Maturity | Principal Amount |
Cost | Fair Value | Percent of Net Assets |
|||||||||||||||||
| Healthcare Facilities |
||||||||||||||||||||||||
| Accelerated Health |
Senior Secured | 7.25% | 07/22/2017 | 4,987 | 4,939 | 4,810 | 11.2 | |||||||||||||||||
| Systems LLC |
Loan | (LIBOR +5.75%) | ||||||||||||||||||||||
| Term Loan | (Prime +4.75%) | |||||||||||||||||||||||
|
|
|
|
|
|
|
|
|
|||||||||||||||||
| 4,987 | 4,939 | 4,810 | 11.2 | |||||||||||||||||||||
|
|
|
|
|
|
|
|
|
|||||||||||||||||
| Hotels, Resorts, & Cruise Lines |
||||||||||||||||||||||||
| Premier Yachts |
Senior Secured | 6.75% | 12/01/2015 | 3,845 | 3,782 | 3,832 | 8.9 | |||||||||||||||||
| Loan | (LIBOR +5.25%) | |||||||||||||||||||||||
| Term Loan | (Prime +4.25%) | |||||||||||||||||||||||
|
|
|
|
|
|
|
|
|
|||||||||||||||||
| 3,845 | 3,782 | 3,832 | 8.9 | |||||||||||||||||||||
|
|
|
|
|
|
|
|
|
|||||||||||||||||
| Household Products |
||||||||||||||||||||||||
| Phoenix Brands LLC |
Senior Secured | 7.00% | 01/31/2016 | 4,531 | 4,464 | 4,399 | 10.2 | |||||||||||||||||
| Loan | (LIBOR +5.50%) | |||||||||||||||||||||||
| Term Loan A | (Prime +4.50%) | |||||||||||||||||||||||
|
|
|
|
|
|
|
|
|
|||||||||||||||||
| 4,531 | 4,464 | 4,399 | 10.2 | |||||||||||||||||||||
|
|
|
|
|
|
|
|
|
|||||||||||||||||
| Industrial Gases |
||||||||||||||||||||||||
| Engineered Controls |
Senior Secured | 6.75% | 08/05/2016 | 4,659 | 4,596 | 4,419 | 10.3 | |||||||||||||||||
| International, LLC |
Loan | (LIBOR +5.00%) | ||||||||||||||||||||||
| Term Loan | (Prime +4.00%) | |||||||||||||||||||||||
|
|
|
|
|
|
|
|
|
|||||||||||||||||
| 4,659 | 4,596 | 4,419 | 10.3 | |||||||||||||||||||||
|
|
|
|
|
|
|
|
|
|||||||||||||||||
| Industrial Machinery and Equipment |
||||||||||||||||||||||||
| FCX Performance, Inc |
Senior Secured | 7.01% | 10/06/2014 | 4,071 | 4,025 | 3,876 | 9.0 | |||||||||||||||||
| Loan | (LIBOR +4.00%) | |||||||||||||||||||||||
| Term Loan | (Prime +4.00%) | |||||||||||||||||||||||
|
|
|
|
|
|
|
|
|
|||||||||||||||||
| 4,071 | 4,025 | 3,876 | 9.0 | |||||||||||||||||||||
|
|
|
|
|
|
|
|
|
|||||||||||||||||
| Insurance Brokerage |
||||||||||||||||||||||||
| AssuredPartners |
Senior Secured | 7.25% | 09/20/2016 | 1,205 | 1,185 | 1,173 | 2.7 | |||||||||||||||||
| Capital, Inc. |
Loan | (LIBOR +5.75%) | ||||||||||||||||||||||
| Term Loan | (Prime +4.75%) | |||||||||||||||||||||||
| AssuredPartners |
Senior Secured | 7.75% | 03/31/2017 | 3,795 | 3,795 | 3,751 | 8.7 | |||||||||||||||||
| Capital, Inc. |
Loan | (LIBOR +6.25%) | ||||||||||||||||||||||
| Term Loan B | (Prime +5.25%) | |||||||||||||||||||||||
| Frenkel Benefits LLC |
Senior Secured | 6.75% | 12/28/2015 | 4,813 | 4,734 | 4,632 | 10.7 | |||||||||||||||||
| Loan | (LIBOR +5.50%) | |||||||||||||||||||||||
| Term Loan A | (Prime +4.50%) | |||||||||||||||||||||||
|
|
|
|
|
|
|
|
|
|||||||||||||||||
| 9,813 | 9,714 | 9,556 | 22.1 | |||||||||||||||||||||
|
|
|
|
|
|
|
|
|
|||||||||||||||||
| Leisure Products |
||||||||||||||||||||||||
| McKenzie Sports |
Senior Secured | 7.03% | 10/29/2016 | 4,452 | 4,389 | 4,229 | 9.8 | |||||||||||||||||
| Products, LLC |
Loan | (LIBOR +5.25%) | ||||||||||||||||||||||
| Term Loan A | (Prime +4.25%) | |||||||||||||||||||||||
|
|
|
|
|
|
|
|
|
|||||||||||||||||
| 4,452 | 4,389 | 4,229 | 9.8 | |||||||||||||||||||||
|
|
|
|
|
|
|
|
|
|||||||||||||||||
150
Table of Contents
OFS Capital WM, LLC
Schedule of Investments (Continued)
As of December 31, 2011
(Amounts in thousands)
| Name of Portfolio Company |
Type of Investment | Interest (1) | Maturity | Principal Amount |
Cost | Fair Value | Percent of Net Assets |
|||||||||||||||||
| Packaging |
||||||||||||||||||||||||
| Fort Dearborn Company |
Senior Secured | 6.64% | 08/24/2015 | 9 | 9 | 9 | — | |||||||||||||||||
| Loan | (LIBOR +4.75%) | |||||||||||||||||||||||
| Term Loan A CN | (Prime +3.75%) | |||||||||||||||||||||||
| Fort Dearborn Company |
Senior Secured | 6.50% | 08/24/2015 | 609 | 603 | 582 | 1.4 | |||||||||||||||||
| Loan | (LIBOR +4.75%) | |||||||||||||||||||||||
| Term Loan A US | (Prime +3.75%) | |||||||||||||||||||||||
| Fort Dearborn Company |
Senior Secured | 7.12% | 08/24/2016 | 53 | 53 | 51 | 0.1 | |||||||||||||||||
| Loan | (LIBOR +5.25%) | |||||||||||||||||||||||
| Term Loan B CN | (Prime +4.25%) | |||||||||||||||||||||||
| Fort Dearborn Company |
Senior Secured | 7.00% | 08/24/2016 | 3,515 | 3,480 | 3,351 | 7.8 | |||||||||||||||||
| Loan | (LIBOR +5.25%) | |||||||||||||||||||||||
| Term Loan B US | (Prime +4.25%) | |||||||||||||||||||||||
| Mold-Rite Plastics, LLC |
Senior Secured | 6.25% | 08/05/2016 | 4,805 | 4,737 | 4,485 | 10.3 | |||||||||||||||||
| Loan | (LIBOR +4.50%) | |||||||||||||||||||||||
| Term Loan | (Prime +3.50%) | |||||||||||||||||||||||
|
|
|
|
|
|
|
|
|
|||||||||||||||||
| 8,991 | 8,882 | 8,478 | 19.6 | |||||||||||||||||||||
|
|
|
|
|
|
|
|
|
|||||||||||||||||
| Personal Products |
||||||||||||||||||||||||
| Pacific World |
Senior Secured | 7.00% | 10/31/2016 | 5,000 | 4,913 | 4,828 | 11.2 | |||||||||||||||||
| Loan | (LIBOR +5.50%) | |||||||||||||||||||||||
| Term Loan | (Prime +4.50%) | |||||||||||||||||||||||
|
|
|
|
|
|
|
|
|
|||||||||||||||||
| 5,000 | 4,913 | 4,828 | 11.2 | |||||||||||||||||||||
|
|
|
|
|
|
|
|
|
|||||||||||||||||
| Printing & Publishing |
||||||||||||||||||||||||
| Media Source |
Senior Secured | 6.75% | 11/07/2016 | 1,469 | 1,440 | 1,416 | 3.3 | |||||||||||||||||
| Loan | (LIBOR +5.25%) | |||||||||||||||||||||||
| Term Loan A | (Prime +4.25%) | |||||||||||||||||||||||
| Media Source |
Senior Secured | 7.25% | 11/07/2016 | 3,531 | 3,460 | 3,444 | 8.0 | |||||||||||||||||
| Loan | (LIBOR +6.00%) | |||||||||||||||||||||||
| Term Loan B | (Prime +5.00%) | |||||||||||||||||||||||
| Pamarco Technologies, Inc. |
Senior Secured | N/A | 12/31/2014 | — | (12 | ) | (77 | ) | (0.2 | ) | ||||||||||||||
| Loan | (LIBOR +3.75%) | |||||||||||||||||||||||
| Revolver | (Prime +2.25%) | |||||||||||||||||||||||
| (LOC Fee 4.25%) | ||||||||||||||||||||||||
| (Unused Fee 0.50%) | ||||||||||||||||||||||||
| Pamarco Technologies, Inc. |
Senior Secured | 6.00% | 12/31/2014 | 4,111 | 4,079 | 3,923 | 9.1 | |||||||||||||||||
| Loan | (LIBOR +3.75%) | |||||||||||||||||||||||
| Term Loan A | (Prime +2.25%) | |||||||||||||||||||||||
|
|
|
|
|
|
|
|
|
|||||||||||||||||
| 9,111 | 8,967 | 8,706 | 20.2 | |||||||||||||||||||||
|
|
|
|
|
|
|
|
|
|||||||||||||||||
| Specialized Consumer Services |
||||||||||||||||||||||||
| Dwyer Group |
Senior Secured | 7.00% | 12/23/2015 | 4,329 | 4,277 | 4,185 | 9.7 | |||||||||||||||||
| Loan | (LIBOR +5.25%) | |||||||||||||||||||||||
| Term Loan | (Prime +4.25%) | |||||||||||||||||||||||
|
|
|
|
|
|
|
|
|
|||||||||||||||||
| 4,329 | 4,277 | 4,185 | 9.7 | |||||||||||||||||||||
|
|
|
|
|
|
|
|
|
|||||||||||||||||
| Sub -total Debt Investments |
216,939 | 213,762 | 207,828 | 482.0 | ||||||||||||||||||||
|
|
|
|
|
|
|
|
|
|||||||||||||||||
151
Table of Contents
OFS Capital WM, LLC
Schedule of Investments (Continued)
As of December 31, 2011
(Amounts in thousands)
| Name of Portfolio Company |
Type of Investment | Interest (1) | Maturity | Principal Amount |
Cost | Fair Value | Percent of Net Assets |
|||||||||||||||||||
| Equity Investments |
||||||||||||||||||||||||||
| WF Prime INVT MM (2) |
Money Market | N/A | N/A | N/A | 1,628 | 1,628 | 3.8 | |||||||||||||||||||
| # 1752 |
||||||||||||||||||||||||||
| WFB Secured |
Money Market | N/A | N/A | N/A | 623 | 623 | 1.4 | |||||||||||||||||||
| Institutional MM (3) |
||||||||||||||||||||||||||
|
|
|
|
|
|
|
|||||||||||||||||||||
| Sub -total Equity Investments |
2,251 | 2,251 | 5.2 | |||||||||||||||||||||||
|
|
|
|
|
|
|
|
|
|||||||||||||||||||
| Total Investments (United States) |
$ | 216,939 | $ | 216,013 | $ | 210,079 | 487.2 | % | ||||||||||||||||||
|
|
|
|
|
|
|
|
|
|||||||||||||||||||
| (1) | The majority of the investments bear interest at a rate that may be determined by reference to LIBOR or Prime and which is reset daily, quarterly or semi-annually. The Company has provided the current interest rate in effect at December 31, 2011 for each investment. Certain investments are subject to a LIBOR or Prime interest rate floor. |
| (2) | Included in cash and cash equivalents on the statements of assets and liabilities. |
| (3) | Included in restricted cash and cash equivalents on the statements of assets and liabilities. |
See Notes to Financial Statements.
152
Table of Contents
OFS Capital WM , LLC
Schedule of Investments
As of December 31, 2010
(Amounts in thousands)
| Name of Portfolio |
Type of Investment | Interest (1) | Maturity | Principal Amount |
Cost | Fair Value | Percent of Net Assets |
|||||||||||||||||
| United States |
||||||||||||||||||||||||
| Debt Investments |
||||||||||||||||||||||||
| Automobile |
||||||||||||||||||||||||
| The Ritedose Corporation |
Senior Secured Loan | 6.75% | 11/10/2016 | $ | 5,000 | $ | 4,901 | $ | 5,000 | 8.4 | % | |||||||||||||
| Term Loan | (LIBOR +5.00%) | |||||||||||||||||||||||
| (Prime +4.00%) | ||||||||||||||||||||||||
|
|
|
|
|
|
|
|
|
|||||||||||||||||
| 5,000 | 4,901 | 5,000 | 8.4 | |||||||||||||||||||||
|
|
|
|
|
|
|
|
|
|||||||||||||||||
| Distributors |
||||||||||||||||||||||||
| Phillips Feed & Pet Supply |
Senior Secured Loan | 7.50% | 10/13/2015 | 3,555 | 3,477 | 3,555 | 5.9 | |||||||||||||||||
| Term Loan | (LIBOR +5.25%) | |||||||||||||||||||||||
| (Prime +4.25%) | ||||||||||||||||||||||||
|
|
|
|
|
|
|
|
|
|||||||||||||||||
| 3,555 | 3,477 | 3,555 | 5.9 | |||||||||||||||||||||
|
|
|
|
|
|
|
|
|
|||||||||||||||||
| Electrical Components & Equipment |
||||||||||||||||||||||||
| Universal Air Filter Company |
Senior Secured Loan | 8.25% | 6/30/2015 | 4,899 | 4,840 | 4,899 | 8.1 | |||||||||||||||||
| Term Loan | (LIBOR +6.50%) | |||||||||||||||||||||||
| (Prime +5.50%) | ||||||||||||||||||||||||
|
|
|
|
|
|
|
|
|
|||||||||||||||||
| 4,899 | 4,840 | 4,899 | 8.1 | |||||||||||||||||||||
|
|
|
|
|
|
|
|
|
|||||||||||||||||
| Industrial Conglomerates |
||||||||||||||||||||||||
| Jameson LLC |
Senior Secured Loan | 7.55% | 10/1/2015 | 4,862 | 4,768 | 4,862 | 8.1 | |||||||||||||||||
| Term Loan | (LIBOR +5.50%) | |||||||||||||||||||||||
| (Prime +4.50%) | ||||||||||||||||||||||||
|
|
|
|
|
|
|
|
|
|||||||||||||||||
| 4,862 | 4,768 | 4,862 | 8.1 | |||||||||||||||||||||
|
|
|
|
|
|
|
|
|
|||||||||||||||||
| Leisure Products |
||||||||||||||||||||||||
| McKenzie Sports Products, LLC |
Senior Secured Loan | 7.25% | 10/29/2016 | 4,988 | 4,902 | 4,988 | 8.2 | |||||||||||||||||
| Term Loan A | (LIBOR +5.50%) | |||||||||||||||||||||||
| (Prime +4.50%) | ||||||||||||||||||||||||
|
|
|
|
|
|
|
|
|
|||||||||||||||||
| 4,988 | 4,902 | 4,988 | 8.2 | |||||||||||||||||||||
|
|
|
|
|
|
|
|
|
|||||||||||||||||
153
Table of Contents
OFS Capital WM , LLC
Schedule of Investments (Continued)
As of December 31, 2010
(Amounts in thousands)
| Name of Portfolio Company |
Type of Investment | Interest (1) | Maturity | Principal Amount |
Cost | Fair Value | Percent of Net Assets |
|||||||||||||||||
| United States |
||||||||||||||||||||||||
| Debt Investments |
||||||||||||||||||||||||
| Packaging |
||||||||||||||||||||||||
| Fort Dearborn Company |
Senior Secured Loan | 6.86% | 8/24/2015 | 42 | 42 | 42 | 0.1 | |||||||||||||||||
| Term Loan A CN | (LIBOR +5.00%) | |||||||||||||||||||||||
| (Prime +4.00%) | ||||||||||||||||||||||||
| Fort Dearborn Company |
Senior Secured Loan | 6.76% | 8/24/2015 | 644 | 636 | 644 | 1.1 | |||||||||||||||||
| Term Loan A US | (LIBOR +5.00%) | |||||||||||||||||||||||
| (Prime +4.00%) | ||||||||||||||||||||||||
| Fort Dearborn Company |
Senior Secured Loan | 7.37% | 8/24/2016 | 244 | 241 | 244 | 0.4 | |||||||||||||||||
| Term Loan B CN | (LIBOR +5.50%) | |||||||||||||||||||||||
| (Prime +4.50%) | ||||||||||||||||||||||||
| Fort Dearborn Company |
Senior Secured Loan | 7.26% | 8/24/2016 | 3,551 | 3,507 | 3,551 | 5.9 | |||||||||||||||||
| Term Loan B US | (LIBOR +5.50%) | |||||||||||||||||||||||
| (Prime +4.50%) | ||||||||||||||||||||||||
|
|
|
|
|
|
|
|
|
|||||||||||||||||
| 4,481 | 4,426 | 4,481 | 7.5 | |||||||||||||||||||||
|
|
|
|
|
|
|
|
|
|||||||||||||||||
| Specialized Consumer Services |
||||||||||||||||||||||||
| Dwyer Group |
Senior Secured Loan | 7.50% | 12/23/2015 | 5,000 | 4,925 | 5,000 | 8.3 | |||||||||||||||||
| Term Loan | (LIBOR +5.25%) | |||||||||||||||||||||||
| (Prime +4.25%) | ||||||||||||||||||||||||
|
|
|
|
|
|
|
|
|
|||||||||||||||||
| 5,000 | 4,925 | 5,000 | 8.3 | |||||||||||||||||||||
|
|
|
|
|
|
|
|
|
|||||||||||||||||
| Sub -total (Debt Investments) |
32,785 | 32,239 | 32,785 | 54.5 | % | |||||||||||||||||||
|
|
|
|
|
|
|
|
|
|||||||||||||||||
| Equity Investments |
||||||||||||||||||||||||
| WF Prime INVT MM |
||||||||||||||||||||||||
| #1752 (2) |
Money Market | N/A | N/A | N/A | 1,396 | (2) | 1,396 | (2) | 2.3 | % | ||||||||||||||
| WFB Securred Institutional |
Money Market | N/A | N/A | N/A | 10,932 | (3) | 10,932 | (3) | 18.2 | % | ||||||||||||||
| M M (3) |
||||||||||||||||||||||||
|
|
|
|
|
|
|
|||||||||||||||||||
| Sub -total (Equity Investments) |
12,328 | 12,328 | 20.5 | % | ||||||||||||||||||||
|
|
|
|
|
|
|
|||||||||||||||||||
| Total (United States) |
$ | 32,785 | $ | 44,567 | $ | 45,113 | 75.0 | % | ||||||||||||||||
|
|
|
|
|
|
|
|
|
|||||||||||||||||
| (1) | The majority of the investments bear interest at a rate that may be determined by reference to LIBOR or Prime and which reset daily, quarterly or semi-annually. The Company has provided the current interest rate in effect at December 31, 2010 for each investment. Certain investments are subject to a LIBOR or prime interest rate floor. |
| (2) | Included in cash and cash equivalents and restricted cash and cash equivalents on the statements of assets and liabilities |
| (3) | Included in restricted cash and cash equivalents on the statements of assets and liabilities. |
See Notes to Financial Statements.
154
Table of Contents
OFS Capital WM, LLC
(Amounts in thousands)
| Note 1. | Nature of Business |
OFS Capital WM, LLC (“OFS Capital WM”, or the “Company”), is a Delaware limited liability company and wholly owned subsidiary of OFS Capital, LLC (“OFS Capital”) (see Note 3 for details about the September 28, 2010 OFS Capital WM Transaction and Note 6 about the OFS Capital WM Facility). OFS Capital WM was formed on August 11, 2010, commenced operations on September 28, 2010, and was organized with the limited purpose of holding, acquiring, managing and financing senior secured loan investments to middle-market companies in the United States. Under its Limited Liability Company Operating Agreement (“LLC Operating Agreement”), the Company has a perpetual existence until dissolved and terminated in accordance with its LLC Operating Agreement.
OFS Capital is the sole member of the Company and also acts as the administrative manager that carries out limited duties of the Company. MCF Capital Management, LLC, an affiliate of Madison Capital Funding, LLC (“Madison Capital”), acts as the loan manager (“Loan Manager”) under the terms of the OFS Capital WM Facility. The Loan Manager has the authority to service, administer and exercise rights and remedies with respect to the assets in OFS Capital WM’s portfolio. The Loan Manager also has the authority to determine whether to cause assets to be sold or acquired by OFS Capital WM, subject to certain limited circumstances where OFS Capital has consent rights (which were further limited pursuant to an Amended and Restated Consent Procedures Letter effective February 23, 2011), as administrative manager of OFS Capital WM.
| Note 2. | Summary of Significant Accounting Policies |
Basis of presentation: The accompanying financial statements of the Company and related financial information have been prepared in accordance with generally accepted accounting principles in the United States of America (“GAAP”), as established by the Financial Accounting Standards Board (“FASB”). In the opinion of management, the financial statements reflect all adjustments and reclassifications that are necessary for the fair presentation of financial results as of and for the periods presented.
Fair value of financial instruments: All investments are recorded at their estimated fair value, as described in Note 5.
Use of estimates: The preparation of the financial statements in conformity with generally accepted accounting principles requires management to make estimates and assumptions that affect the reported amounts of assets and liabilities and disclosure of contingent assets and liabilities at the date of the financial statements and the reported amounts of revenues and expenses during the reporting period. Actual results could differ from those estimates.
Cash and cash equivalents: Cash and cash equivalents consist of cash and highly liquid investments not held for resale with original maturities of three months or less. The Company places its cash in financial institutions and at times, such balances may be in excess of the Federal Deposit Insurance Corporation insurance limits.
Restricted cash and cash equivalents: Restricted cash and cash equivalents represent amounts maintained in the Unfunded Exposure Account of OFS Capital WM as defined by the Loan Sale Agreement and other applicable transaction documents between OFS Capital WM and OFS Capital and are subject to the lien of the trustee for the benefit of the secured parties of OFS Capital WM (see Note 3). Proceeds in the Unfunded Exposure Account along with advances under the OFS Capital WM Credit Facility (see Note 6) are utilized to fund certain eligible loans owned by OFS Capital WM that have unfunded revolving commitments. During the year ended December 31, 2011, as a result of the sale and payoff of most of the Company’s revolving loan investments, a
155
Table of Contents
OFS Capital WM, LLC
Notes to Financial Statements
(Amounts in thousands)
| Note 2. | Summary of Significant Accounting Policies (Continued) |
substantial portion of restricted cash and cash equivalents maintained in the Company’s Unfunded Exposure Account was released. As of December 31, 2011 and 2010, the restricted cash balance was $623 and $10,932, respectively.
Investments and related investment income: OFS Capital, the Company’s administrative manager, determines the fair value of its portfolio investments. Interest income is accrued based upon the outstanding principal amount and contractual interest terms of debt investments. The Company accrues interest income until certain events take place, which may place a loan into a non-accrual status. Premiums, discounts and origination fees are amortized or accreted into interest income over the life of the respective debt investment. For the year ended December 31, 2011 and the period September 28, 2010 through December 31, 2010, interest income included $2,868 and $17 of such amounts, respectively.
For investment with contractual payment-in-kind interest (“PIK”), which represent contractual interest accrued and added to the principal balance that generally becomes due at maturity, the Company will not accrue PIK interest if the portfolio company valuation indicates that the PIK interest is not collectible. Investment transactions are accounted for on a trade-date basis. Realized gains or losses on investments are measured by the difference between the net proceeds from the disposition and the cost basis of investment, without regard to unrealized gains or losses previously recognized. The Company reports changes in fair value of investments that are measured at fair value as a component of the net change in unrealized appreciation (depreciation) on investments in the statement of operations.
Non-accrual loans: Loans on which the accrual of interest income has been discontinued are designated as non-accrual loans, and further designated as either non-accrual cash method or non-accrual cost recovery method. Loans are generally placed on non-accrual when a loan either: (i) is delinquent for 90 days or more on principal or interest based on contractual terms of the loan (unless well secured and in the process of collection), or (ii) in the opinion of management, has reasonable doubt about the collectability. When loans are placed on non-accrual status, all interest previously accrued but not collected is reversed against current period interest income. Interest payments received on non-accrual loans may be recognized as income or applied to principal depending upon management’s judgment. Interest accruals are resumed on non-accrual loans only when they are brought current with respect to interest and principal and when, in the judgment of management, the loans are estimated to be fully collectible as to all principal and interest. There were no loans with non-accrual status as of December 31, 2011 and 2010.
Deferred financing closing costs: Deferred financing costs represent fees and other direct incremental costs incurred in connection with the Company’s borrowings. These amounts are amortized over the estimated average life of the borrowings. For the year ended December 31, 2011 and the period September 28, 2010 through December 31, 2010, amortization expense amounted to $572 and $151, respectively.
Interest expense: Interest expense is recognized on the accrual basis.
Income taxes: OFS Capital WM does no record a provision for federal income taxes or deferred tax benefits because its income is taxable to its sole member.
ASC Topic 740 – Income Taxes provides guidelines for how uncertain tax positions should be recognized, measured, presented and disclosed in financial statements. ASC Topic 740 requires the evaluation of tax positions taken in the course of preparing the Fund’s tax returns to determine whether the tax positions are
156
Table of Contents
OFS Capital WM, LLC
Notes to Financial Statements
(Amounts in thousands)
| Note 2. | Summary of Significant Accounting Policies (Continued) |
“more-likely-than-not” to be sustained by the applicable tax authority. Tax benefits of positions not deemed to meet the more-likely-than-not threshold would be recorded as a tax expense in the current year. Generally, the 2010 tax year remains subject to examination by U.S. federal and most state tax authorities. There were no material uncertain income tax positions as of December 31, 2011.
Recent accounting pronouncements: In May 2011, the FASB has issued Accounting Standards Update (ASU) No. 2011-04, Amendments to Achieve Common Fair Value Measurement and Disclosure Requirements in U.S. GAAP and IFRSs (ASU 2011-04). ASU 2011-04 amended ASC 820, Fair Value Measurements and Disclosures, to converge the fair value measurement guidance in GAAP and International Financial Reporting Standards (IFRSs). Some of the amendments clarify the application of existing fair value measurement requirements, while other amendments change a particular principal in ASC 820. In addition, ASU 2011-04 requires additional fair value disclosures. The amendments are to be applied prospectively and are effective for annual periods beginning after December 15, 2011. The Company is currently evaluating the effect that the provisions of ASU 2011-04 will have on the Company’s financial statements.
In November 2011, the FASB issued ASU 2011-11 — Balance Sheet (Topic 210) containing new guidance that requires an entity to disclose information about offsetting and related arrangements to enable users of its financial statements to understand the effect of those arrangements on its financial position. This guidance is effective for annual and interim periods beginning on or after January 1, 2013. An entity should provide the disclosures required by those amendments retrospectively for all comparative periods presented. The Company is currently assessing the impact of ASU 2011-11 on its future financial statements.
| Note 3. | OFS Capital WM, LLC Transaction |
On September 28, 2010, OFS Capital WM entered into a Loan Sale Agreement with OFS Capital, pursuant to which OFS Capital WM acquired eligible loans or 100% participating interest in certain loans as defined by the agreement (“Eligible Loans”) from OFS Capital, in consideration for which OFS Capital WM paid cash of $36,255 and issued 100% membership interest in OFS Capital WM to OFS Capital (“OFS Capital WM Transaction”). OFS Capital WM financed the OFS Capital WM Transaction with Wells Fargo Bank, N.A. (“Wells Fargo”) and Madison Capital (collectively, the “lenders”) by repledging the Eligible Loans to the trustee for the benefit of the Lenders (see Note 6 for more details about the OFS Capital WM Credit Facility).
The OFS Capital WM Transaction was a true sale for legal purposes. Under the Loan Sale Agreement and other applicable closing documents (“Loan Documents”) dated September 28, 2010, OFS Capital is not permitted to revoke the sale. Wells Fargo acts as both custodian and trustee for the benefit of the lenders under the WM Credit Facility. The Eligible Loans are repledged by OFS Capital WM for the benefit of the lenders. OFS Capital is not entitled or obligated to repurchase or redeem the Eligible Loans, other than a customary obligation to repurchase loans for breach of representations and warranties with respect to the eligibility of such loans. OFS Capital had the right, at its option, to purchase loans then owned by OFS Capital WM, at fair value, subject to a 20% Purchase and Substitution limit as prescribed in the Loan Documents (the “Call Right”).
OFS Capital WM accounted for the OFS Capital WM Transaction as a secured borrowing in accordance with the relevant provisions under ASC Topic 860 (Transfers and Servicing). Accordingly, on September 28, 2010, OFS Capital WM recorded a receivable under securities loan agreement due from OFS Capital in the aggregate amount of $93,598 for the cash and fair value of 100% membership interest it issued to OFS Capital in
157
Table of Contents
OFS Capital WM, LLC
Notes to Financial Statements
(Amounts in thousands)
| Note 3. | OFS Capital WM, LLC Transaction (Continued) |
connection with the OFS Capital WM Transaction. OFS Capital WM reclassified this to receivable repledged to creditor on the statements of assets and liabilities upon its repledging of the Eligible Loans under the custody of Wells Fargo, the trustee and a related party of OFS Capital WM, for the benefit of the lenders on September 28, 2010.
Effective February 23, 2011, the Loan Documents were amended pursuant to which the Call Right and certain other rights of OFS Capital were removed. This amendment was entered into to ensure that the original intent of the parties to treat the OFS Capital WM Transaction as a true sale for both legal, accounting and any other purpose was satisfied and to sever any provision that may be interpreted as contrary to the intent of the parties. For the period January 1, 2011 through February 23, 2011, OFS Capital WM recognized interest income on the receivable repledged to creditor in the amount of $831 and a loss of $71 based on the realized depreciation of the Eligible Loans repledged for the benefit of the Lenders for the period January 1, 2011 through February 23, 2011. On February 23, 2011, as a result of the amendment to the Loan Documents, under the sale accounting, the Company recorded the acquisition of investments from OFS Capital in the aggregate principal amount of $77,055. These investments were valued at $74,733 on February 23, 2011, resulting in an initial purchase discount of $2,322, which is being amortized over the terms of the debt investments. The Company also recorded interest receivable of $212 related to these investments on February 23, 2011. In addition, the Company derecognized the receivable repledged to creditor in the amount of $74,945 under the sale accounting.
| Note 4. | Related Party Transactions |
For the year ended December 31, 2011 and the period September 28, 2010 through December 31, 2010, OFS Capital WM incurred $41 and $8 of administrative expenses, respectively, funded by an affiliated entity of OFS Capital. As of December 31, 2011 and 2010, $10 and $7 of these expenses remained outstanding, respectively. During 2011, OFS Capital WM received a total of $45 from OFS Capital, which represented interest collected by OFS Capital on behalf of OFS Capital WM on certain loans sold by OFS Capital to the Company on September 28, 2010.
The Loan Manager is a related party of the Company as it is deemed to be the Company’s primary beneficiary under the applicable provisions of ASC Topic 810 since it has the power to direct the activities of the Company that most significantly impact its economic performance. The Loan Manager charges both a senior and subordinated management fee to the Company for its services each at 0.25% per annum of the assigned value of the underlying portfolio investments, which value is determined by the controlling lender, plus an accrued fee that is deferred until after the end of the reinvestment period of the portfolio investments. For the year ended December 31, 2011 and the period September 28, 2010 through December 31, 2010, the Company incurred senior and subordinated management fees totaling $912 and $111 respectively. At December 31, 2011, the Company also owed an additional accrued management fee of $65 to the Loan Manager, which will not be due until after the end of the reinvestment period of the portfolio investments.
In April, July, and October 2011, OFS Capital WM made cash distributions to OFS Capital in the amount of $1,970, $6,000, and $1,723, respectively.
On June 30, 2011, OFS Capital WM sold various revolving loan facilities to Madison Capital with an aggregate cost basis of $575 on the date of the sale for total cash consideration of $327. Accordingly, OFS Capital WM recorded a realized loss of $248 from the sale.
158
Table of Contents
OFS Capital WM, LLC
Notes to Financial Statements
(Amounts in thousands)
| Note 4. | Related Party Transactions (Continued) |
On June 30, 2011, OFS Capital WM made an in-kind distribution of three loans to OFS Capital with an aggregate cost basis of $7,245. OFS Capital WM recorded the loan distribution at fair value in the total amount of $6,656 on the date of distribution, under the applicable guidance from ASC Topic 845 (Nonmonetary Transactions). In connection with this distribution, OFS Capital WM recorded a realized loss of $589.
In July 2011, OFS Capital WM paid $5 to OFS Capital, which represented principal collections it received on behalf of OFS Capital on loans that were distributed to OFS Capital on June 30, 2011.
| Note 5. | Fair Value of Financial Instruments |
The Company follows the guidance in ASC Topic 820 for measuring the fair value of the portfolio investments. Fair value is the price that would be received to sell an asset or paid to transfer a liability in an orderly transaction between market participants at the measurement date and sets out a fair value hierarchy. The fair value hierarchy gives the highest priority to quoted prices in active markets for identical assets or liabilities (Level 1) and the lowest priority to unobservable inputs (Level 3). Inputs are broadly defined under ASC Topic 820 as assumptions market participants would use in pricing an asset or liability. The three levels of the fair value hierarchy under ASC Topic 820 are described below:
Level 1: Unadjusted quoted prices in active markets for identical assets or liabilities that the reporting entity has the ability to access at the measurement date.
Level 2: Inputs other than quoted prices within Level 1 that are observable for the asset or liability, either directly or indirectly; and fair value is determined through the use of models or other valuation methodologies.
Level 3: Inputs are unobservable for the asset or liability and include situations where there is little, if any, market activity for the asset or liability. The inputs into the determination of fair value are based upon the best information under the circumstances and may require significant management judgment or estimation.
In certain cases, the inputs used to measure fair value may fall into different levels of the fair value hierarchy. In such cases, an investment’s level within the fair value hierarchy is based on the lowest level of input that is significant to the fair value measurement. The Company’s assessment of the significance of a particular input to the fair value measurement in its entirety requires judgment, and considers factors specific to the investment.
The Company assesses the levels of the investments at each measurement day, and transfers between levels are recognized on the subsequent measurement date closest in time to the actual date of the event or change in circumstances that caused the transfer. There were no transfers among Levels 1, 2 and 3 during the year. The following sections describe the valuation techniques used by the Company to measure different financial instruments at fair value and includes the level within the fair value hierarchy in which the financial instrument is categorized.
Investments for which prices are not observable are generally private investments in the equity and debt securities of operating companies. The primary analytical method used to estimate the fair value of Level 3 investments is the discounted cash flow method (although in certain instances a liquidation analysis or other methodology may be most appropriate). The discounted cash flow approach to determine fair value (or a range of fair values) involves applying an appropriate discount rate(s) to the estimated future cash flows using various
159
Table of Contents
OFS Capital WM, LLC
Notes to Financial Statements
(Amounts in thousands)
| Note 5. | Fair Value of Financial Instruments (Continued) |
relevant factors depending on investment type, including assumed growth rate (in cash flows) and capitalization rates/multiples (for determining terminal values of underlying portfolio companies). The valuation based on the inputs determined to be the most reasonable and probable is used as the fair value of the investment. The determination of fair value
using these methodologies may take into consideration a range of factors including, but not limited to, the price at which the investment was acquired, the nature of the investment, local market conditions, trading values on public exchanges for comparable securities, current and projected operating performance, and financing transactions subsequent to the acquisitions of the investment. Application of these valuation methodologies involves a significant degree of judgment by management.
The fair value of equity securities in portfolio companies may also consider the market approach—that is, through analyzing, and applying to the underlying portfolio companies, market valuation multiples of publicly-traded firms engaged in businesses similar to those of the portfolio companies. The market approach to determining the fair value of a portfolio company’s equity security (or securities) will typically involve: 1) applying to the portfolio company’s trailing twelve months (or current year projected) EBITDA a low to high range of enterprise value to EBITDA multiples that are derived from an analysis of publicly-traded comparable companies, in order to arrive at a range of enterprise values for the portfolio company; 2) subtracting from the range of calculated enterprise values the outstanding balances of any debt or equity securities that would be senior in right of payment to the equity securities held by the Company; and 3) multiplying the range of equity values derived therefrom by the Company’s ownership share of such equity tranche in order to arrive at a range of fair values for the Company’s equity security (or securities). Application of these valuation methodologies involves a significant degree of judgment by management.
Due to the inherent uncertainty of determining the fair value of Level 3 investments that do not have a readily available market value, the fair value of the investments may differ significantly from the values that would have been used had a ready market existed for such investments and may differ materially from the values that may ultimately be received or settled. Further, such investments are generally subject to legal and other restrictions or otherwise are less liquid than publicly traded instruments. If the Company were required to liquidate a portfolio investment in a forced or liquidation sale, the Company may realize significantly less than the value at which such investment had previously been recorded.
The Company’s investments are subject to market risk. Market risk is the potential for changes in the value of investments due to market changes. Market risk is directly impacted by the volatility and liquidity in the markets in which the investments are traded. The Company manages its exposure to market risk related to its investments through monitoring the financial condition of its investments, as well as the volatility and liquidity trends of the markets it trades in.
ASC Topic 820 requires disclosure of the fair value of financial instruments for which it is practical to estimate the value. All assets and liabilities approximate fair value on the financial statements as they are measured at fair value, short-term or replaceable on demand.
160
Table of Contents
OFS Capital WM, LLC
Notes to Financial Statements
(Amounts in thousands)
| Note 5. | Fair Value of Financial Instruments (Continued) |
The following table presents information about the Company’s investments measured at fair value on a recurring basis at December 31, 2011 and 2010, respectively, and indicates the fair value hierarchy of the valuation techniques utilized by the Company to determine such fair value:
| December 31, 2011 | ||||||||||||||||
| Fair Value Measurements Using | ||||||||||||||||
| Description |
(Level I) | (Level II) | (Level III) | Total | ||||||||||||
| Assets: |
||||||||||||||||
| Debt investments |
$ | — | $ | — | $ | 207,828 | $ | 207,828 | ||||||||
| Money market funds * |
2,251 | — | — | 2,251 | ||||||||||||
| — | ||||||||||||||||
|
|
|
|
|
|
|
|
|
|||||||||
| $ | 2,251 | $ | — | $ | 207,828 | $ | 210,079 | |||||||||
|
|
|
|
|
|
|
|
|
|||||||||
| * | Included in cash and cash equivalents and restricted cash and cash equivalents on the statements of assets and liabilities. |
| December 31, 2010 | ||||||||||||||||
| Fair Value Measurements Using | ||||||||||||||||
| Description |
(Level I) | (Level II) | (Level III) | Total | ||||||||||||
| Assets: |
||||||||||||||||
| Debt investments |
$ | — | $ | — | $ | 32,785 | $ | 32,785 | ||||||||
| Receivable repledged |
— | |||||||||||||||
| to creditor |
— | — | 81,351 | 81,351 | ||||||||||||
| Money market funds * |
12,328 | — | — | 12,328 | ||||||||||||
|
|
|
|
|
|
|
|
|
|||||||||
| $ | 12,328 | $ | — | $ | 114,136 | $ | 126,464 | |||||||||
|
|
|
|
|
|
|
|
|
|||||||||
| * | Included in cash and cash equivalents and restricted cash and cash equivalents on the statements of assets and liabilities. |
The following table presents the changes in investments and receivable repledged to creditor measured at fair value using Level 3 inputs:
| For the Year ended December 31, 2011 | ||||||||
| Debt Investments | Receivable Repledged to Creditor |
|||||||
| Fair value, beginning of year |
$ | 32,785 | $ | 81,351 | ||||
| Net change in unrealized depreciation on investments |
(6,482 | ) | — | |||||
| Net realized loss on investments |
(991 | ) | — | |||||
| Net realized loss on investments - related party |
(248 | ) | — | |||||
| Net realized loss on receivable repledged to creditor |
— | (71 | ) | |||||
| Purchase of portfolio investments from OFS Capital under sale accounting |
74,733 | — | ||||||
| Purchase of other portfolio investments |
186,295 | — | ||||||
| Proceeds from principal payments and sale of portfolio investments/ |
(74,430 | ) | (6,335 | ) | ||||
| collection of receivable repledged to creditor |
||||||||
| Amortization of discounts and premium |
2,822 | — | ||||||
| Distribution of investments to OFS Capital LLC |
(6,656 | ) | — | |||||
| Derecognition of receivable repledged to creditor under the sale accounting |
— | (74,945 | ) | |||||
|
|
|
|
|
|||||
| Fair value, end of year |
$ | 207,828 | $ | — | ||||
|
|
|
|
|
|||||
161
Table of Contents
OFS Capital WM, LLC
Notes to Financial Statements
(Amounts in thousands)
| Note 5. | Fair Value of Financial Instruments (Continued) |
| September 28, 2010 through December 31, 2010 |
||||||||
| Debt Investments |
Receivable Repledged To Creditor |
|||||||
| Fair value, beginning of period |
$ | — | $ | — | ||||
| Net change in unrealized appreciation on investments |
546 | — | ||||||
| Net change in unrealized appreciation on receivable repledged to creditor |
— | 1,058 | ||||||
| Purchase of portfolio investments |
32,537 | — | ||||||
| Receivable repledged to creditor |
— | 93,598 | ||||||
| Proceeds from principal payments of portfolio investments/collection of receivable repledged to creditor |
(315 | ) | (13,305 | ) | ||||
| Amortization of discounts and premium |
17 | — | ||||||
|
|
|
|
|
|||||
| Fair value, end of period |
$ | 32,785 | $ | 81,351 | ||||
|
|
|
|
|
|||||
| Note 6. | OFS Capital WM Facility |
On September 28, 2010, OFS Capital WM entered into a new $180,000 secured revolving credit facility (the “WM Credit Facility”) with Wells Fargo and Madison Capital, with the Class A lenders (initially Wells Fargo) providing up to $135,000 in the Class A loans and the Class B lenders (initially Madison Capital) providing up to $45,000 in Class B loans to OFS Capital WM. The WM Credit Facility is secured by the Eligible Loans transferred to OFS Capital WM by OFS Capital on the date of the OFS Capital WM Transaction and any eligible loan assets subsequently acquired by OFS Capital WM. The loan facilities with Wells Fargo and Madison Capital have five- and six-year terms, respectively, and both facilities provide a one-year option for extension upon the approval of the Class A and Class B lenders. The loan facilities have a reinvestment period of two years after the closing date of the WM Credit Facility, which can be extended by one year with the consent of each lender. Outstanding borrowings on the loan facilities are limited to the lesser of (1) $180,000 and (2) the borrowing base as defined by the Loan Documents. OFS Capital WM is obligated to pay interest on outstanding Class A loans and Class B loans on each quarterly payment date. Outstanding Class A loans accrue interest at a daily rate equal to LIBOR plus 3.00%. Outstanding Class B loans accrue interest at a daily rate equal to LIBOR plus 4.00%. OFS Capital WM has the right to repay loans outstanding under the facility in part from time to time. OFS Capital WM also has the right to repay the facility in full at any time. However, in the event of a repayment of the facility in full in the first or second year of the facility, OFS Capital WM is subject to a prepayment penalty of 2.0% in year one and 1.0% in year two, respectively, of the maximum facility amount. The unused commitment fee on the Class A loan facility is 0.5% per annum for the first six months after the WM Credit Facility closing date and thereafter (1) 0.5% of the first $25,000 of the unused facility and (2) 2% of the balance in excess of $25,000. The unused commitment fee on the Class B loan facility is 0.5% per annum. In connection with the WM Credit Facility, OFS Capital WM incurred financing costs of $3,501, which are deferred and being amortized over the terms of WM Credit Facility.
162
Table of Contents
OFS Capital WM, LLC
Notes to Financial Statements
(Amounts in thousands)
| Note 7. | Commitments and Contingencies |
At December 31, 2011, the Company had $1,500 of unused lines of credit granted to borrowers. At December 31, 2010, the Company had no outstanding commitments to fund its portfolio investments.
From time to time, the Company is involved in legal proceedings in the normal course of its business. Although the outcome of such litigation cannot be predicted with any certainty, management is of the opinion, based on the advice of legal counsel, that final disposition of any litigation should not have a material adverse effect on the financial position of the Company.
In the normal course of business, the Company enters into contracts and agreements that contain a variety of representations and warranties that provide general indemnifications. The Company’s maximum exposure under these arrangements is unknown, as this would involve future claims that may be made against the Company that have not occurred. The Company expects the risk of any future obligation under these indemnifications to be remote.
| Note 8. | Financial Highlights |
The financial highlights for the year ended December 31, 2011 and the period September 28, 2010 through December 31, 2010 are as follows:
| For the Year Ended December 31, 2011 |
For the Period September 28, 2010 through December 31, 2010 |
|||||||
| Ratio to average net assets: |
||||||||
| Expenses (including interest) 2 |
12.2 | % | 6.4 | % | ||||
|
|
|
|
|
|||||
| Net investment income 2 |
13.6 | % | 4.9 | % | ||||
|
|
|
|
|
|||||
| Total return1 |
-1.2 | % | 4.0 | % | ||||
|
|
|
|
|
|||||
| 1 | The total return is computed based on net increase (decrease) in net assets resulting from operations divided by weighted average net assets. |
| 2 | Annualized. |
The inception-to-date internal rate of return (“IRR”) is 2.6% and is computed on actual dates of cash inflows (capital contributions), outflows (capital distributions) and the ending net assets at the end of the period (residual value of net assets as of each measurement date).
| Note 9. | Subsequent Events |
In preparing these financial statements, the Company has evaluated subsequent events and transactions for potential recognition and/or disclosure. Except as disclosed below and under other footnote sections, there are no additional subsequent events to disclose.
In January 2012, the Company made a cash distribution of $1,225 to OFS Capital.
163
Table of Contents
| Item 9. | Changes in and Disagreements with Accountants on Accounting and Financial Disclosure |
Not applicable.
| Item 9A. | Controls and Procedures |
| (a) | Evaluation of Disclosure Controls and Procedures |
As of December 31, 2012, we, including our Chief Executive Officer and Chief Financial Officer, evaluated the effectiveness of the design and operation of our disclosure controls and procedures (as defined in Rule 13a-15(e) under the Securities Exchange Act of 1934, as amended). Based on that evaluation, the Chief Executive Officer and Chief Financial Officer concluded that our disclosure controls and procedures were effective in timely alerting management, including the Chief Executive Officer and Chief Financial Officer, of material information about us required to be included in periodic SEC filings.
There have been no changes in our internal control over financial reporting (as defined in Rule 13a-15(f) under the Securities Exchange Act of 1934) that occurred during the quarter ended December 31, 2012 that have materially affected, or are reasonably likely to materially affect, our internal control over financial reporting.
| (b) | Management’s Report on Internal Control Over Financial Reporting |
This annual report does not include a report of management’s assessment regarding internal control over financial reporting or an attestation report of the company’s registered public accounting firm due to a transition period established by rules of the Securities and Exchange Commission for newly public companies.
| (c) | Attestation Report of the Independent Registered Public Accounting Firm |
Not applicable.
| (d) | Changes in Internal Controls Over Financial Reporting |
Management did not identify any change in the Company’s internal control over financial reporting that occurred during the period of November 7, 2012 to December 31, 2012 that has materially affected, or is reasonably likely to materially affect, the Company’s internal control over financial reporting.
| Item 9B. | Other Information |
On March 25, 2013, we filed with the Secretary of State of the State of Delaware a Certificate of Correction (the “Certificate of Correction”) to our Certificate of Incorporation to correct an inadvertent typographical error in our Certificate of Incorporation, which incorrectly provided Marc Abrams as a Class II Director and Bilal Rashid as a Class III Director. As filed, the Certificate of Correction corrects our Certificate of Incorporation to provide Marc Abrams as a Class III Director and Bilal Rashid as a Class II Director.
164
Table of Contents
| Item 10. | Directors, Executive Officers and Corporate Governance |
The information required by Item 10 is hereby incorporated by reference from the Company’s definitive Proxy Statement relating to the Company’s 2013 Annual Meeting of Stockholders, to be filed with the Securities and Exchange Commission within 120 days following the end of the Company’s fiscal year.
| Item 11. | Executive Compensation |
The information required by Item 11 is hereby incorporated by reference from the Company’s definitive Proxy Statement relating to the Company’s 2013 Annual Meeting of Stockholders, to be filed with the Securities and Exchange Commission within 120 days following the end of the Company’s fiscal year.
| Item 12. | Security Ownership of Certain Beneficial Owners and Management and Related Stockholder Matters |
The information required by Item 12 is hereby incorporated by reference from the Company’s definitive Proxy Statement relating to the Company’s 2013 Annual Meeting of Stockholders, to be filed with the Securities and Exchange Commission within 120 days following the end of the Company’s fiscal year.
| Item 13. | Certain Relationships and Related Transactions, and Director Independence |
The information required by Item 13 is hereby incorporated by reference from the Company’s definitive Proxy Statement relating to the Company’s 2013 Annual Meeting of Stockholders, to be filed with the Securities and Exchange Commission within 120 days following the end of the Company’s fiscal year.
| Item 14. | Principal Accountant Fees and Services |
The information required by Item 14 is hereby incorporated by reference from the Company’s definitive Proxy Statement relating to the Company’s 2013 Annual Meeting of Stockholders, to be filed with the Securities and Exchange Commission within 120 days following the end of the Company’s fiscal year.
165
Table of Contents
| Item 15. | Exhibits and Financial Statement Schedules |
a. Documents Filed as Part of this Report
The following financial statements are set forth in Item 8:
| Page | ||||
| 94 | ||||
| Consolidated Balance Sheets as of December 31, 2012 and 2011 |
95 | |||
| 96 | ||||
| 98 | ||||
| 99 | ||||
| Consolidated Schedules of Investments as of December 31, 2012 and 2011 |
103 | |||
| 108 | ||||
| 141 | ||||
| Statements of Assets and Liabilities as of December 31, 2011 and 2010 |
142 | |||
| 143 | ||||
| 144 | ||||
| 145 | ||||
| 147 | ||||
| 155 | ||||
The following financial statement schedule is filed herewith:
Schedule 12-14: Investments In and Advances to Affiliates
166
Table of Contents
OFS Capital Corporation and Subsidiaries
Schedule of Investments In and Advances to Affiliates
As of and for the Period November 8, 2012 Through December 31, 2012
(Amounts in thousands)
| Portfolio Company |
Investment | As of November 8, 2012 Fair Value |
Gross Reductions (1) |
As of December 31, 2012 Fair Value |
||||||||||||
| Affiliate Investments |
||||||||||||||||
| Tamarix Capital Partners, LP |
Limited Partnership Interest | $ | 4,701 | $ | (44 | ) | $ | 4,657 | ||||||||
|
|
|
|
|
|
|
|||||||||||
| Total Affiliate Investments |
$ | 4,701 | $ | (44 | ) | $ | 4,657 | |||||||||
|
|
|
|
|
|
|
|||||||||||
| (1) | Gross reductions include net increase in unrealized depreciation or net decrease in unrealized appreciation. |
b. Exhibits
The following exhibits are filed as part of this report or hereby incorporated by reference to exhibits previously filed with the SEC:
| Exhibit Number |
Description | |
| 3.1 | Amended and Restated Certificate of Formation of OFS Capital, LLC (2) | |
| 3.2 | Certificate of Incorporation of OFS Capital Corporation (2) | |
| 3.3 | Certificate of Correction to Certificate of Incorporation of OFS Capital Corporation* | |
| 3.4 | Amended and Restated Limited Liability Company Agreement of OFS Capital, LLC (2) | |
| 3.5 | Bylaws of OFS Capital Corporation (2) | |
| 4.1 | Form of Stock Certificate of OFS Capital Corporation (2) | |
| 10.1 | Form of Dividend Reinvestment Plan (2) | |
| 10.2 | Investment Advisory and Management Agreement between OFS Capital Corporation and OFS Capital Management, LLC (2) | |
| 10.3 | Form of Custody Agreement (2) | |
| 10.4 | Administration Agreement between OFS Capital Corporation and OFS Capital Services, LLC (2) | |
| 10.5 | License Agreement between OFS Capital Corporation and Orchard First Source Asset Management, LLC (2) | |
| 10.6 | Loan and Security Agreement among MCF Capital Management LLC, OFS Capital WM, LLC, each of the Class A Lenders from time to time party thereto, each of the Class B lenders from time to time party thereto, Wells Fargo Securities, LLC, and Wells Fargo Delaware Trust Company, N.A., dated as of September 28, 2010 (1) | |
| 10.7 | Pledge Agreement made by OFS Capital, LLC, OFS Capital WM, LLC and OFS Funding, LLC in favor of Wells Fargo Delaware Trust Company, N.A., as Trustee, for the benefit of the Secured Parties, dated as of September 28, 2010 (1) | |
| 10.8 | Account Control Agreement among OFS Capital WM, LLC, Wells Fargo Delaware Trust Company, N.A., Wells Fargo Securities, LLC and Wells Fargo Bank, National Association, dated as of September 28, 2010 (1) | |
| 10.9 | Participation Agreement dated as of September 28, 2010, between OFS Funding, LLC and OFS Capital, LLC (1) | |
167
Table of Contents
| Exhibit Number |
Description | |
| 10.10 | Loan Sale Agreement between OFS Capital, LLC, and OFS Capital WM, LLC, dated as of September 28, 2010 (1) | |
| 10.11 | First Amendment to Loan Sale Agreement among OFS Capital WM, LLC and OFS Capital, LLC, dated February 23, 2011(2) | |
| 10.12 | Amended and Restated Consent Procedures Letter among OFS Capital, LLC, OFS Capital WM, LLC, Madison Capital Funding LLC, and MCF Capital Management LLC, dated February 23, 2011 (Loan and Security Agreement – Exhibit L) (2) | |
| 10.13 | Form of Indemnification Agreement between OFS Capital Corporation and each of its directors and executive officers (2) | |
| 10.14 | Form of Registration Rights Agreement between OFS Capital Corporation and Orchard First Source Asset Management, LLC (4) | |
| 10.15 | Second Amended and Restated Consent Procedures Letter among OFS Capital, LLC, OFS Capital WM, LLC, Madison Capital Funding LLC, and MCF Capital Management LLC, dated March 30, 2012 (3) | |
| 10.16 | Amendment to Second Amended and Restated Consent Procedures Letter among OFS Capital, LLC, OFS Capital WM, LLC, Madison Capital Funding LLC, and MCF Capital Management LLC, dated September 28, 2012 (5) | |
| 10.17 | First Amendment to Loan and Security Agreement among OFS Capital WM, LLC, MCF Capital Management LLC, Wells Fargo Bank, National Association, Madison Capital Funding LLC, Wells Fargo Securities, LLC, and Wells Fargo Delaware Trust Company, N.A., dated November 27, 2010 (5) | |
| 10.18 | Second Amendment to Loan and Security Agreement among OFS Capital WM, LLC, MCF Capital Management LLC, Wells Fargo Bank, National Association, Madison Capital Funding LLC, Wells Fargo Securities, LLC, and Wells Fargo Delaware Trust Company, N.A., dated January 26, 2011(5) | |
| 10.19 | Third Amendment to Loan and Security Agreement among OFS Capital WM, LLC, MCF Capital Management LLC, Wells Fargo Bank, National Association, Madison Capital Funding LLC, Wells Fargo Securities, LLC, and Wells Fargo Delaware Trust Company, N.A., dated September 28, 2012 (5) | |
| 10.20 | Fourth Amendment to Loan and Security Agreement among OFS Capital WM, LLC, MCF Capital Management LLC, Wells Fargo Bank, National Association, Madison Capital Funding LLC, Wells Fargo Securities, LLC, and Wells Fargo Delaware Trust Company, N.A., dated January 22, 2013 (7) | |
| 11.1 | Computation of Per Share Earnings (included in the notes to the financial statements contained in this report). | |
| 14.1 | Code of Ethics of OFS Capital Corporation (3) | |
| 14.2 | Code of Ethics of OFS Advisor (incorporated by reference to Exhibit 14.1 hereto) (3) | |
| 21.1 | List of Subsidiaries* | |
| 31.1 | Certification of Chief Executive Officer pursuant to Rule 13a-14 of the Securities Exchange Act of 1934, as amended* | |
| 31.2 | Certification of Chief Financial Officer pursuant to Rule 13a-14 of the Securities Exchange Act of 1934, as amended* | |
| 32.1 | Certification of Chief Executive Officer pursuant to Section 906 of the Sarbanes-Oxley Act of 2002* | |
| 32.2 | Certificate of Chief Financial Officer pursuant to Section 906 of the Sarbanes-Oxley Act of 2002* | |
| * | Filed herewith. |
168
Table of Contents
| (1) | Previously filed as part of Pre-Effective Amendment No. 2 to the Company’s Registration Statement on Form N-2 (File No. 333-166363), filed on October 5, 2010. |
| (2) | Previously filed as part of Pre-Effective Amendment No. 3 to the Company’s Registration Statement on Form N-2 (File No. 333-166363), filed on March 17, 2011. |
| (3) | Previously filed as part of Pre-Effective Amendment No. 6 to the Company’s Registration Statement on Form N-2 (File No. 333-166363), filed on May 3, 2012. |
| (4) | Previously filed as part of Pre-Effective Amendment No. 7 to the Company’s Registration Statement on Form N-2 (File No. 333-166363), filed on July 24, 2012. |
| (5) | Previously filed as part of Pre-Effective Amendment No. 8 to the Company’s Registration Statement on Form N-2 (File No. 333-166363), filed on October 19, 2012. |
| (6) | Previously filed as part of Pre-Effective Amendment No. 9 to the Company’s Registration Statement on Form N-2 (File No. 333-166363), filed on October 24, 2012. |
| (7) | Previously filed as part of the Current Report on Form 8-K of the Company, filed on January 23, 2013. |
c. Financial statement schedules
No financial statement schedules are filed herewith because (1) such schedules are not required or (2) the information has been presented in the aforementioned financial statements.
169
Table of Contents
Pursuant to the requirements of Section 13 or 15(d) of the Securities Exchange Act of 1934, the registrant has duly caused this report to be signed on its behalf by the undersigned, thereunto duly authorized.
| OFS CAPITAL CORPORATION | ||
| Date: March 26, 2013 | /s/ Glenn R. Pittson | |
| Glenn R. Pittson, Chief Executive Officer, President and Chairman of the Board of Directors | ||
Pursuant to the requirements of the Securities Exchange Act of 1934, this report has been signed below by the following persons on behalf of the registrant and in the capacity and on the dates indicated.
| Date: March 26, 2013 | /s/ Glenn R. Pittson | |
| Glenn R. Pittson, Chief Executive Officer, President and Chairman of the Board of Directors (Principal Executive Officer) | ||
| Date: March 26, 2013 | /s/ Bilal Rashid | |
| Bilal Rashid, Director | ||
| Date: March 26, 2013 | /s/ Marc Abrams | |
| Marc Abrams, Director | ||
| Date: March 26, 2013 | /s/ Robert J. Cresci | |
| Robert J. Cresci, Director | ||
| Date: March 26, 2013 | /s/ Elaine E. Healy | |
| Elaine E. Healy, Director | ||
| Date: March 26, 2013 | /s/ Robert S. Palmer | |
| Robert S. Palmer, Chief Financial Officer and Treasurer (Principal Financial Officer) | ||
| Date: March 26, 2013 | /s/ Bei Zhang | |
| Bei Zhang, Chief Accounting Officer (Principal Accounting Officer) | ||
170