Attached files
| file | filename |
|---|---|
| 8-K - 8-K - MATTRESS FIRM HOLDING CORP. | a13-8858_18k.htm |
Exhibit 99.1

FOR IMMEDIATE RELEASE
MATTRESS FIRM ANNOUNCES FOURTH FISCAL QUARTER AND FULL FISCAL YEAR FINANCIAL RESULTS
— Net Sales Increased 37.0% in the Fourth Fiscal Quarter —
— Fourth Fiscal Quarter Earnings per Diluted Share of $0.30 on an Adjusted Basis, $0.22 on a GAAP Basis —
— Provides Financial Guidance for Fiscal Year 2013 —
HOUSTON, March 26, 2013 /BUSINESSWIRE/ — Mattress Firm Holding Corp. (NASDAQ: MFRM) today announced its financial results for the fourth fiscal quarter (13 weeks) and full fiscal year (52 weeks) ended January 29, 2013. Net sales for the fourth fiscal quarter increased 37.0% to $258.2 million, reflecting incremental sales from new and acquired stores, offset by a comparable-store sales decline of 1.6%. For the full fiscal year, net sales increased 43.1% to $1,007.3 million and comparable-store sales for the full fiscal year increased 6.1%. The Company reported fourth fiscal quarter earnings per diluted share (“EPS”) on a generally accepted accounting principles (“GAAP”) basis of $0.22, and EPS on a non-GAAP adjusted basis, excluding acquisition-related, noncash impairment and other costs (“Adjusted”), of $0.30. Diluted EPS on a GAAP basis and Adjusted basis are reconciled in the table below:
Fourth Fiscal Quarter Reconciliation of GAAP to Adjusted EPS
See “Reconciliation of Reported (GAAP) to Adjusted Statements of Operations Data” for Notes
|
|
|
Thirteen Weeks |
|
Fifty-Two Weeks |
| ||
|
|
|
Ended |
|
Ended |
| ||
|
|
|
January 29, 2013 |
|
January 29, 2013 |
| ||
|
GAAP EPS |
|
$ |
0.22 |
|
$ |
1.18 |
|
|
Acquisition-related costs (2) |
|
0.03 |
|
0.23 |
| ||
|
Secondary offering costs (3) |
|
0.00 |
|
0.04 |
| ||
|
Impairment and other expenses (4)(5) |
|
0.04 |
|
0.04 |
| ||
|
Adjusted EPS * |
|
$ |
0.30 |
|
$ |
1.49 |
|
* Due to rounding to the nearest cent, totals may not equal the sum of the lines in the table above.
“We achieved significant growth in 2012, unprecedented in our industry, as we drove net sales by 43.1% to above the $1 billion mark and increased our store base by 45.0% to over 1,000 store units. We also delivered meaningful year-over-year increases across key financial metrics, including a 50.6% increase in Adjusted operating income and 6.1% comparable-store sales growth during our first full year as a public company,” remarked Steve Stagner, Mattress Firm’s president and chief executive officer. “Overall, fiscal 2012 was a record year for Mattress Firm; an impressive accomplishment in light of the challenges associated with adding 328 stores, including 242 stores through accretive acquisitions. Looking to 2013, with the integration of the acquired stores substantially complete, we expect to drive sales and operating margin expansion from the ongoing sales growth of acquired stores, which will be enhanced as we pass the anniversary dates of our 2012 acquisitions. We envision that this growth, combined with a third consecutive year of opening more than 100 organic new stores in line with the continued execution of our relative market share strategy of penetrating markets, will further strengthen and fortify our leadership positions. We are extremely excited about our potential for fiscal 2013 and believe we are well positioned to drive additional value for our shareholders as we move through the year.”
5815 Gulf Freeway · Houston, TX · 77023 · Phone: 713-923-1090 · Fax: 713-923-1096
Fourth Quarter Financial Summary
· Net sales for the fourth fiscal quarter increased 37.0% to $258.2 million, reflecting incremental sales from new and acquired stores, offset by a comparable-store sales decline of 1.6%.
· Opened 30 new stores, closed 11, and acquired 27 former Mattress Source stores in December 2012, bringing the total number of Company-operated stores to 1,057 as of the end of the fiscal year.
· Income from operations was $17.2 million. Excluding $4.3 million of acquisition-related costs, impairment charges and debt amendment expenses, Adjusted income from operations was $21.5 million, representing an increase of $5.8 million, or 37.0%, over Adjusted income from operations for the comparable prior year period. Please refer to “Reconciliation of Reported (GAAP) to Adjusted Statements of Operations Data” for a reconciliation of income from operations to Adjusted income from operations and other information.
· Adjusted operating margin remained unchanged at 8.3% of net sales as compared to the same quarter of fiscal 2011, and consisted of a 230 basis-point improvement in general and administrative expense leverage, offset by a 200 basis-point decrease in gross margin from lower sales productivity of acquired stores, a 20 basis point decline in franchise fees due to the Company growing its sales at a rate faster than the franchise base, and 10 basis-points of deleverage in other expense categories.
· Net income was $7.6 million and GAAP EPS was $0.22. Excluding $2.4 million, net of income taxes, of acquisition-related costs and impairment charges and other costs, Adjusted net income was $10.0 million and Adjusted EPS was $0.30, representing increases of approximately 43.0% over Adjusted net income and Adjusted EPS for the comparable prior year period. Please refer to “Reconciliation of Reported (GAAP) to Adjusted Statements of Operations Data” for a reconciliation net income and GAAP EPS to Adjusted net income and Adjusted EPS, respectively, and other information.
Acquisitions
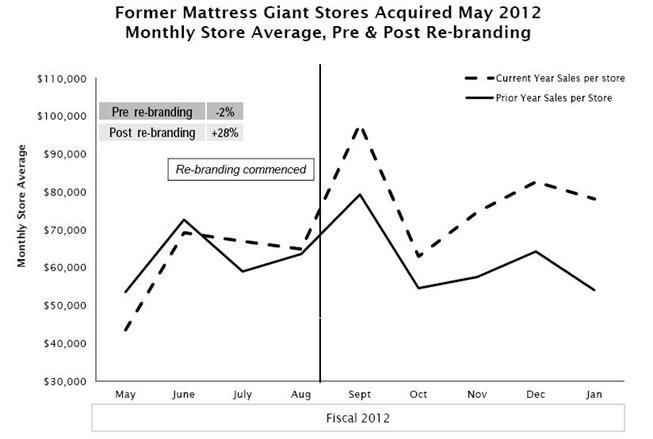
In December 2012, the Company completed the acquisition of the assets and operations of Factory Mattress & Water Bed Outlet of Charlotte, Inc. (dba “Mattress Source”), including 27 mattress specialty stores in North Carolina and South Carolina, for approximately $11.4 million. The Company has commenced rebranding of the former Mattress Source stores as Mattress Firm, with completion anticipated to occur in the first half of fiscal 2013.
Consistent with our core relative market share strategy, the Mattress Source acquisition added stores in markets where Company-operated Mattress Firm stores were already established. The addition of the acquired stores, once rebranded, is expected to drive advertising efficiency and improve market-level profitability in those markets.
With respect to the acquisitions of former Mattress Giant stores in November 2011 and May 2012, the rebranding of the acquired stores was substantially complete by the end of fiscal 2012. The per store sales results of those stores both prior to and subsequent to their rebranding is demonstrated by the charts below:
Full Fiscal Year Financial Summary (52 weeks ended January 29, 2013)
· Net sales increased $303.4 million, or 43.1%, to $1,007.3 million as a result of incremental sales from new and acquired stores and comparable-store sales growth of 6.1%.
· Company-operated stores increased 328, or 45.0%, to 1,057 at year end, as a result of opening 118 new stores, while closing 32 stores, and acquisitions that added 242 stores.
· Net income for fiscal 2012 was $39.9 million and GAAP EPS was $1.18. Excluding $10.5 million, net of income taxes, of acquisition-related costs, secondary offering costs and impairment charges and other costs, Adjusted net income was $50.4 million and Adjusted EPS was $1.49, representing an increase of approximately 60.0% over prior year Adjusted net income and 58.5% over prior year Adjusted EPS, respectively. Please refer to “Reconciliation of Reported (GAAP) to Adjusted Statements of Operations Data” for a reconciliation net income and GAAP EPS to Adjusted net income and Adjusted EPS, respectively, and other information.
· The Company had cash and cash equivalents of $14.6 million at the end of fiscal 2012. Net cash provided by operating activities was $78.7 million for fiscal 2012. As of January 29, 2013, there was $21.0 million of borrowings under the revolving portion of the 2012 Senior Credit Facility and approximately $1.4 million in outstanding letters of credit, with additional borrowing capacity of $77.6 million.
Senior Credit Facility Amendment
On November 5, 2012, the Company completed a restatement amendment of its senior credit facility (“2012 Senior Credit Facility”). As a result of the restatement amendment, the maturity of term loan borrowings in the aggregate amount of $200 million was extended by two years to January 18, 2016, the maturity of the revolving loan facility was extended by two years to January 18, 2015 and the revolving loan commitment was increased from $35 million to $100 million. The interest rate on the extended term loan borrowings was revised to LIBOR plus a margin of 3.5%, representing a 1.25% increase over the previous interest rate. Furthermore, the annual amount of permitted capital expenditures was increased to $80 million from the previous annual amount of $40 million, beginning with fiscal 2012.
.Financial Guidance
The Company is issuing guidance for the fiscal year (52 weeks) ending January 28, 2014 (“fiscal year 2013”).
|
Full Fiscal Year Ending January 28, 2014 |
|
Range |
|
|
|
|
|
|
|
Net sales (in billions) |
|
$1.237 to $1.250 |
|
|
New stores |
|
110 to 120 |
|
|
Net store unit increase |
|
90 to 95 |
|
|
GAAP EPS |
|
$1.81 to $1.89 |
|
|
Acquisition-related costs |
|
$0.01 |
|
|
ERP system implementation costs |
|
$0.07 to $0.09 |
|
|
Adjusted EPS |
|
$1.90 to $1.98 |
|
|
Comparable-store sales growth |
|
low single digit |
|
Call Information
A conference call to discuss fourth fiscal quarter and full fiscal year results is scheduled for today, March 26, 2013, at 5:00 p.m. Eastern Time. The call will be hosted by Steve Stagner, president and chief executive officer, and Jim Black, chief financial officer.
The conference call will be accessible by telephone and the Internet. To access the call, participants from within the U.S. may dial (877) 407-3982, and participants from outside the U.S. may dial (201) 493-6780. Participants may also access the call via live webcast by visiting the Company’s investor relations Web site at http://www.mattressfirm.com.
The replay of the call will be available from approximately 8:00 p.m. Eastern Time on March 26, 2013 through midnight Eastern Time on April 9, 2013. To access the replay, the domestic dial-in number is (877) 870-5176, the international dial-in number is (858) 384-5517, and the passcode is 410722. The archive of the webcast will be available on the Company’s Web site for a limited time.
Net Sales and Store Unit Information
The components of the net sales increase were as follows (in millions):
|
|
|
Increase (Decrease) in Net Sales |
| ||||
|
|
|
Thirteen Weeks |
|
Fifty-Two Weeks |
| ||
|
|
|
Ended |
|
Ended |
| ||
|
|
|
January 29, 2013 |
|
January 29, 2013 |
| ||
|
Comparable-store sales |
|
$ |
(2.9 |
) |
$ |
41.9 |
|
|
New stores |
|
27.0 |
|
120.8 |
| ||
|
Acquired stores |
|
47.5 |
|
148.8 |
| ||
|
Closed stores |
|
(1.9 |
) |
(8.1 |
) | ||
|
|
|
$ |
69.7 |
|
$ |
303.4 |
|
The composition of net sales by major category of product and services were as follows (in millions):
|
|
|
Thirteen Weeks Ended |
|
Fifty-Two Weeks Ended |
| ||||||||||||||||
|
|
|
January 31, |
|
% of |
|
January 29, |
|
% of |
|
January 31, |
|
% of |
|
January 29, |
|
% of |
| ||||
|
|
|
2012 |
|
Total |
|
2013 |
|
Total |
|
2012 |
|
Total |
|
2013 |
|
Total |
| ||||
|
Specialty mattresses |
|
$ |
93.8 |
|
49.7 |
% |
$ |
126.2 |
|
48.9 |
% |
$ |
318.9 |
|
45.3 |
% |
$ |
504.9 |
|
50.1 |
% |
|
Conventional mattresses |
|
78.4 |
|
41.6 |
% |
110.8 |
|
42.9 |
% |
323.4 |
|
45.9 |
% |
418.0 |
|
41.5 |
% | ||||
|
Furniture and accessories |
|
12.6 |
|
6.7 |
% |
16.5 |
|
6.4 |
% |
46.4 |
|
6.6 |
% |
65.7 |
|
6.5 |
% | ||||
|
Total product sales |
|
184.8 |
|
98.0 |
% |
253.5 |
|
98.2 |
% |
688.7 |
|
97.8 |
% |
988.6 |
|
98.1 |
% | ||||
|
Delivery service revenues |
|
3.8 |
|
2.0 |
% |
4.7 |
|
1.8 |
% |
15.2 |
|
2.2 |
% |
18.7 |
|
1.9 |
% | ||||
|
Total net sales |
|
$ |
188.6 |
|
100.0 |
% |
$ |
258.2 |
|
100.0 |
% |
$ |
703.9 |
|
100.0 |
% |
$ |
1,007.3 |
|
100.0 |
% |
Prior-year components of the Company’s net sales have been reallocated between specialty mattresses and conventional mattresses to be consistent with current-year presentation.
The activity with respect to the number of Company-operated store units was as follows:
|
|
|
Thirteen Weeks |
|
Fifty-Two Weeks |
|
|
|
|
Ended |
|
Ended |
|
|
|
|
January 29, 2013 |
|
January 29, 2013 |
|
|
Store units, beginning of period |
|
1,011 |
|
729 |
|
|
New stores |
|
30 |
|
118 |
|
|
Acquired stores |
|
27 |
|
242 |
|
|
Closed stores |
|
(11 |
) |
(32 |
) |
|
Store units, end of period |
|
1,057 |
|
1,057 |
|
Forward-Looking Statements
Certain statements contained in this press release are not based on historical fact and are “forward-looking statements” within the meaning of applicable federal securities laws and regulations. In many cases, you can identify forward-looking statements by terminology such as “may,” “would,” “should,” “could,” “forecast,” “feel,” “project,” “expect,” “plan,” “anticipate,” “believe,” “estimate,” “predict,” “intend,” “potential,” “continue” or the negative of these terms or other comparable terminology; however, not all forward-looking statements contain these identifying words. The forward-looking statements contained in this press release, such as those relating to our net sales, GAAP and Adjusted EPS and net store unit change for fiscal year 2013, are subject to various risks and uncertainties, including but not limited to downturns in the economy; reduction in discretionary spending by consumers; our ability to execute our key business strategies and advance our market-level profitability; our ability to profitably open and operate new stores and capture additional market share; our relationship with our primary mattress suppliers; our dependence on a few key employees; the possible impairment of our goodwill or other acquired intangible assets; the effect of our planned growth and the integration of our acquisitions on our business infrastructure; the impact of seasonality on our financial results and
comparable-store sales; our ability to raise adequate capital to support our expansion strategy; our success in pursuing and completing strategic acquisitions; the effectiveness and efficiency of our advertising expenditures; our success in keeping warranty claims and comfort exchange return rates within acceptable levels; our ability to deliver our products in a timely manner; our status as a holding company with no business operations; our ability to anticipate consumer trends; risks related to our controlling stockholder, J.W. Childs Associates, L.P.; heightened competition; changes in applicable regulations; risks related to our franchises, including our lack of control over their operation and our liabilities if they default on note or lease obligations; risks related to our stock and other factors set forth under “Risk Factors” in our Annual Report on Form 10-K for the fiscal year ended January 31, 2012 filed with the Securities and Exchange Commission (“SEC”) on April 20, 2012 (as amended on May 30, 2012) and our other SEC filings. Forward-looking statements relate to future events or our future financial performance and reflect management’s expectations or beliefs concerning future events as of the date of this press release. Actual results of operations may differ materially from those set forth in any forward-looking statements, and the inclusion of a projection or forward-looking statement in this press release should not be regarded as a representation by us that our plans or objectives will be achieved. We do not undertake to publicly update or revise any of these forward-looking statements, whether as a result of new information, future events or otherwise.
Non-GAAP Financial Measures
Adjusted EBITDA is defined as net income before income tax expense, interest income, interest expense, depreciation and amortization (“EBITDA”), without giving effect to non-cash goodwill and intangible asset impairment charges, gains or losses on store closings and impairment of store assets, gains or losses related to the early extinguishment of debt, financial sponsor fees and expenses, non-cash charges related to stock based awards and other items that are excluded by management in reviewing the results of operations. We have presented Adjusted EBITDA because we believe that the exclusion of these items is appropriate to provide additional information to investors about our ongoing operating performance excluding certain non-cash and other items and to provide additional information with respect to our ability to comply with various covenants in documents governing our indebtedness and as a means to evaluate our period-to-period results. In evaluating Adjusted EBITDA, you should be aware that in the future we may incur expenses that are the same as or similar to some of the adjustments in this presentation. Our presentation of Adjusted EBITDA should not be construed to imply that our future results will be unaffected by any such adjustments. We have provided this information to analysts, investors and other third parties to enable them to perform more meaningful comparisons of past, present and future operating results and as a means to evaluate the results of our ongoing operations. Management also uses Adjusted EBITDA to determine executive incentive compensation payment levels. In addition, our compliance with certain covenants under the credit agreement between our indirect wholly owned subsidiary, Mattress Holding Corp., certain lenders, and UBS Securities LLC, as sole arranger and bookrunner and a lender, are calculated based on similar measures, which differ from Adjusted EBITDA primarily by the inclusion of pro forma results for acquired businesses in those similar measures. Other companies in our industry may calculate Adjusted EBITDA differently than we do. Adjusted EBITDA is not a measure of performance under U.S. GAAP and should not be considered as a substitute for net income prepared in accordance with U.S. GAAP. Adjusted EBITDA has significant limitations as an analytical tool, and you should not consider it in isolation or as a substitute for analysis of our results as reported under U.S. GAAP.
The following table contains a reconciliation of our net income determined in accordance with U.S. GAAP to EBITDA and Adjusted EBITDA for the periods indicated (in thousands):
|
|
|
Thirteen Weeks Ended |
|
Fifty-Two Weeks Ended |
| ||||||||
|
|
|
January 31, |
|
January 29, |
|
January 31, |
|
January 29, |
| ||||
|
|
|
2012 |
|
2013 |
|
2012 |
|
2013 |
| ||||
|
Net income |
|
$ |
17,372 |
|
$ |
7,594 |
|
$ |
34,351 |
|
$ |
39,871 |
|
|
Income tax expense |
|
(9,685 |
) |
6,726 |
|
(8,815 |
) |
26,698 |
| ||||
|
Interest income |
|
(5 |
) |
(10 |
) |
(9 |
) |
(11 |
) | ||||
|
Interest expense |
|
3,831 |
|
2,872 |
|
29,310 |
|
9,258 |
| ||||
|
Depreciation and amortization |
|
4,499 |
|
7,075 |
|
17,450 |
|
23,507 |
| ||||
|
Intangible assets and other amortization |
|
464 |
|
534 |
|
1,718 |
|
1,506 |
| ||||
|
EBITDA |
|
16,476 |
|
24,791 |
|
74,005 |
|
100,829 |
| ||||
|
Intangible asset impairment charge |
|
— |
|
2,100 |
|
— |
|
2,100 |
| ||||
|
Loss on store closings and impairment of store assets |
|
435 |
|
783 |
|
759 |
|
1,050 |
| ||||
|
Loss from debt extinguishment |
|
3,831 |
|
— |
|
5,704 |
|
— |
| ||||
|
Financial sponsor fees and expenses |
|
350 |
|
11 |
|
644 |
|
74 |
| ||||
|
Stock-based compensation |
|
465 |
|
1,203 |
|
523 |
|
2,856 |
| ||||
|
Secondary offering costs |
|
— |
|
(20 |
) |
— |
|
1,915 |
| ||||
|
Vendor new store funds (a) |
|
2,396 |
|
16 |
|
3,169 |
|
953 |
| ||||
|
Acquisition-related costs (b) |
|
708 |
|
1,906 |
|
886 |
|
11,980 |
| ||||
|
Other (c) |
|
873 |
|
107 |
|
1,797 |
|
(789 |
) | ||||
|
Adjusted EBITDA |
|
$ |
25,534 |
|
$ |
30,897 |
|
$ |
87,487 |
|
$ |
120,968 |
|
(a) Adjustment to recognize vendor funds received upon the opening of a new store in the period opened, rather than over 36-months as presented in our financial statements, which is consistent with how management has historically reviewed our results of operations.
(b) Consists of noncash purchase accounting adjustments made to inventories resulting from acquisitions and other acquisition-related cash costs included in net income, such as direct acquisition costs and costs related to training and integration of acquired businesses.
(c) Consists of various items that management excludes in reviewing the results of operations.
Adjusted EPS and the other “Adjusted” data provided in this press release are also considered non-GAAP financial measures. We report our financial results in accordance with GAAP; however, management believes evaluating our ongoing operating results may be enhanced if investors have additional non-GAAP basis financial measures to facilitate year-over-year comparisons. Management reviews non-GAAP financial measures to assess ongoing operations and considers them to be effective indicators, for both management and investors, of our financial performance over time. Our management does not advocate that investors consider such non-GAAP financial measures in isolation from, or as a substitute for, financial information prepared in accordance with GAAP. For more information, please refer to “Reconciliation of Reported (GAAP) to Adjusted Statements of Operations Data” below.
MATTRESS FIRM HOLDING CORP.
Consolidated Balance Sheets
(In thousands, except share amounts)
|
|
|
January 31, |
|
January 29, |
| ||
|
|
|
2012 |
|
2013 |
| ||
|
Assets |
|
|
|
|
| ||
|
Current assets: |
|
|
|
|
| ||
|
Cash and cash equivalents |
|
$ |
47,946 |
|
$ |
14,556 |
|
|
Accounts receivable, net |
|
18,607 |
|
26,246 |
| ||
|
Inventories |
|
40,961 |
|
63,228 |
| ||
|
Deferred income taxes |
|
12,574 |
|
3,710 |
| ||
|
Prepaid expenses and other current assets |
|
12,054 |
|
18,855 |
| ||
|
Total current assets |
|
132,142 |
|
126,595 |
| ||
|
Property and equipment, net |
|
95,674 |
|
144,612 |
| ||
|
Intangible assets, net |
|
84,795 |
|
82,479 |
| ||
|
Goodwill |
|
291,141 |
|
358,978 |
| ||
|
Debt issue costs and other, net |
|
9,729 |
|
12,015 |
| ||
|
Total assets |
|
$ |
613,481 |
|
$ |
724,679 |
|
|
|
|
|
|
|
| ||
|
Liabilities and Stockholders’ Equity |
|
|
|
|
| ||
|
Current liabilities: |
|
|
|
|
| ||
|
Notes payable and current maturities of long-term debt |
|
$ |
2,414 |
|
$ |
33,930 |
|
|
Accounts payable |
|
42,396 |
|
64,642 |
| ||
|
Accrued liabilities |
|
31,780 |
|
41,106 |
| ||
|
Customer deposits |
|
6,294 |
|
8,012 |
| ||
|
Total current liabilities |
|
82,884 |
|
147,690 |
| ||
|
Long-term debt, net of current maturities |
|
225,940 |
|
219,069 |
| ||
|
Deferred income taxes |
|
31,045 |
|
26,800 |
| ||
|
Other noncurrent liabilities |
|
49,353 |
|
63,624 |
| ||
|
Total liabilities |
|
389,222 |
|
457,183 |
| ||
|
|
|
|
|
|
| ||
|
Commitments and Contingencies |
|
|
|
|
| ||
|
|
|
|
|
|
| ||
|
Stockholders’ equity: |
|
|
|
|
| ||
|
Common stock, $0.01 par value; 120,000,000 shares authorized; 33,768,828 and 33,795,630 shares issued and outstanding at January 31, 2012 and January 29, 2013, respectively |
|
338 |
|
338 |
| ||
|
Additional paid-in capital |
|
361,717 |
|
365,083 |
| ||
|
Accumulated deficit |
|
(137,796 |
) |
(97,925 |
) | ||
|
Total stockholders’ equity |
|
224,259 |
|
267,496 |
| ||
|
Total liabilities and stockholders’ equity |
|
$ |
613,481 |
|
$ |
724,679 |
|
MATTRESS FIRM HOLDING CORP.
Consolidated Statements of Operations
(In thousands, except share and per share amounts)
|
|
|
Thirteen Weeks Ended |
|
Fifty-Two Weeks Ended |
| ||||||||||||||||
|
|
|
January 31, |
|
% of |
|
January 29, |
|
% of |
|
January 31, |
|
% of |
|
January 29, |
|
% of |
| ||||
|
|
|
2012 |
|
Sales |
|
2013 |
|
Sales |
|
2012 |
|
Sales |
|
2013 |
|
Sales |
| ||||
|
Net sales |
|
$ |
188,558 |
|
100 |
% |
$ |
258,246 |
|
100 |
% |
$ |
703,910 |
|
100 |
% |
$ |
1,007,337 |
|
100 |
% |
|
Cost of sales |
|
112,685 |
|
59.8 |
% |
160,273 |
|
62.1 |
% |
428,018 |
|
60.8 |
% |
614,572 |
|
61.0 |
% | ||||
|
Gross profit from retail operations |
|
75,873 |
|
40.2 |
% |
97,973 |
|
37.9 |
% |
275,892 |
|
39.2 |
% |
392,765 |
|
39.0 |
% | ||||
|
Franchise fees and royalty income |
|
1,296 |
|
0.7 |
% |
1,374 |
|
0.6 |
% |
4,697 |
|
0.7 |
% |
5,396 |
|
0.5 |
% | ||||
|
|
|
77,169 |
|
40.9 |
% |
99,347 |
|
38.5 |
% |
280,589 |
|
39.9 |
% |
398,161 |
|
39.5 |
% | ||||
|
Operating expenses: |
|
|
|
|
|
|
|
|
|
|
|
|
|
|
|
|
| ||||
|
Sales and marketing expenses |
|
45,471 |
|
24.2 |
% |
62,388 |
|
24.2 |
% |
167,605 |
|
23.9 |
% |
245,555 |
|
24.4 |
% | ||||
|
General and administrative expenses |
|
15,919 |
|
8.4 |
% |
16,894 |
|
6.5 |
% |
51,684 |
|
7.3 |
% |
73,640 |
|
7.3 |
% | ||||
|
Intangible asset impairment charge |
|
— |
|
0.0 |
% |
2,100 |
|
0.8 |
% |
— |
|
0.0 |
% |
2,100 |
|
0.2 |
% | ||||
|
Loss on store closings and impairment of store assets |
|
435 |
|
0.2 |
% |
783 |
|
0.3 |
% |
759 |
|
0.1 |
% |
1,050 |
|
0.1 |
% | ||||
|
Total operating expenses |
|
61,825 |
|
32.8 |
% |
82,165 |
|
31.8 |
% |
220,048 |
|
31.3 |
% |
322,345 |
|
32.0 |
% | ||||
|
Income from operations |
|
15,344 |
|
8.1 |
% |
17,182 |
|
6.7 |
% |
60,541 |
|
8.6 |
% |
75,816 |
|
7.5 |
% | ||||
|
Other expense (income): |
|
|
|
|
|
|
|
|
|
|
|
|
|
|
|
|
| ||||
|
Interest income |
|
(5 |
) |
0.0 |
% |
(10 |
) |
0.1 |
% |
(9 |
) |
0.0 |
% |
(11 |
) |
0.0 |
% | ||||
|
Interest expense |
|
3,831 |
|
2.0 |
% |
2,872 |
|
1.1 |
% |
29,310 |
|
4.2 |
% |
9,258 |
|
0.9 |
% | ||||
|
Loss from debt extinguishment |
|
3,831 |
|
2.0 |
% |
— |
|
0.0 |
% |
5,704 |
|
0.8 |
% |
— |
|
0.0 |
% | ||||
|
|
|
7,657 |
|
4.0 |
% |
2,862 |
|
1.2 |
% |
35,005 |
|
5.0 |
% |
9,247 |
|
0.9 |
% | ||||
|
Income before income taxes |
|
7,687 |
|
4.1 |
% |
14,320 |
|
5.5 |
% |
25,536 |
|
3.6 |
% |
66,569 |
|
6.6 |
% | ||||
|
Income tax expense (benefit) |
|
(9,685 |
) |
-5.1 |
% |
6,726 |
|
2.6 |
% |
(8,815 |
) |
-1.3 |
% |
26,698 |
|
2.6 |
% | ||||
|
Net income |
|
$ |
17,372 |
|
9.2 |
% |
$ |
7,594 |
|
2.9 |
% |
$ |
34,351 |
|
4.9 |
% |
$ |
39,871 |
|
4.0 |
% |
|
|
|
|
|
|
|
|
|
|
|
|
|
|
|
|
|
|
| ||||
|
Basic net income per common share |
|
$ |
0.56 |
|
|
|
$ |
0.22 |
|
|
|
$ |
1.40 |
|
|
|
$ |
1.18 |
|
|
|
|
Diluted net income per common share |
|
$ |
0.56 |
|
|
|
$ |
0.22 |
|
|
|
$ |
1.40 |
|
|
|
$ |
1.18 |
|
|
|
|
Reconciliation of weighted-average shares outstanding: |
|
|
|
|
|
|
|
|
|
|
|
|
|
|
|
|
| ||||
|
|
|
|
|
|
|
|
|
|
|
|
|
|
|
|
|
|
| ||||
|
Basic weighted average shares outstanding |
|
31,145,241 |
|
|
|
33,776,630 |
|
|
|
24,586,274 |
|
|
|
33,770,779 |
|
|
| ||||
|
Effect of dilutive securities: |
|
|
|
|
|
|
|
|
|
|
|
|
|
|
|
|
| ||||
|
Stock options |
|
— |
|
|
|
17,999 |
|
|
|
— |
|
|
|
76,669 |
|
|
| ||||
|
Restricted shares |
|
— |
|
|
|
3,361 |
|
|
|
— |
|
|
|
5,828 |
|
|
| ||||
|
Diluted weighted average shares outstanding |
|
31,145,241 |
|
|
|
33,797,990 |
|
|
|
24,586,274 |
|
|
|
33,853,276 |
|
|
| ||||
MATTRESS FIRM HOLDING CORP.
Consolidated Statements of Cash Flows
(In thousands)
|
|
|
Fiscal |
|
Fiscal |
| ||
|
|
|
2011 |
|
2012 |
| ||
|
Cash flows from operating activities: |
|
|
|
|
|
|
|
|
Net income |
|
$ |
34,351 |
|
$ |
39,871 |
|
|
Adjustments to reconcile net income to cash flows provided by operating activities: |
|
|
|
|
| ||
|
Depreciation and amortization |
|
17,450 |
|
23,507 |
| ||
|
Interest expense accrued and paid-in-kind |
|
20,575 |
|
— |
| ||
|
Loan fee and other amortization |
|
2,530 |
|
2,361 |
| ||
|
Loss from debt extinguishment |
|
5,704 |
|
— |
| ||
|
Deferred income tax expense (benefit) |
|
(11,271 |
) |
17,131 |
| ||
|
Stock-based compensation |
|
523 |
|
2,856 |
| ||
|
Inangible asset impairment charge |
|
— |
|
2,100 |
| ||
|
Loss on store closings and impairment of store assets |
|
324 |
|
894 |
| ||
|
Effects of changes in operating assets and liabilities, excluding business acquisitions: |
|
|
|
|
| ||
|
Accounts receivable |
|
(6,574 |
) |
(4,947 |
) | ||
|
Inventories |
|
(10,555 |
) |
(15,714 |
) | ||
|
Prepaid expenses and other current assets |
|
(1,306 |
) |
(3,616 |
) | ||
|
Other assets |
|
(2,914 |
) |
(3,219 |
) | ||
|
Accounts payable |
|
13,159 |
|
9,324 |
| ||
|
Accrued liabilities |
|
9,333 |
|
1,389 |
| ||
|
Customer deposits |
|
1,518 |
|
(218 |
) | ||
|
Other noncurrent liabilities |
|
8,828 |
|
7,019 |
| ||
|
Net cash provided by operating activities |
|
81,675 |
|
78,738 |
| ||
|
Cash flows from investing activities: |
|
|
|
|
| ||
|
Purchases of property and equipment |
|
(34,356 |
) |
(68,604 |
) | ||
|
Business acquisitions, net of cash acquired |
|
(7,958 |
) |
(63,051 |
) | ||
|
Net cash used in investing activities |
|
(42,314 |
) |
(131,655 |
) | ||
|
Cash flows from financing activities: |
|
|
|
|
| ||
|
Proceeds from issuance of debt |
|
40,198 |
|
56,000 |
| ||
|
Principal payments of debt |
|
(145,231 |
) |
(36,983 |
) | ||
|
Proceeds from issuance of common stock, net of costs |
|
110,446 |
|
— |
| ||
|
Proceeds from exercise of common stock options |
|
— |
|
510 |
| ||
|
Debt issuance costs |
|
(1,273 |
) |
— |
| ||
|
Net cash provided by financing activities |
|
4,140 |
|
19,527 |
| ||
|
Net increase (decrease) in cash and cash equivalents |
|
43,501 |
|
(33,390 |
) | ||
|
Cash and cash equivalents, beginning of period |
|
4,445 |
|
47,946 |
| ||
|
Cash and cash equivalents, end of period |
|
$ |
47,946 |
|
$ |
14,556 |
|
MATTRESS FIRM HOLDING CORP.
Reconciliation of Reported (GAAP) to Adjusted Statements of Operations Data
(In thousands, except share and per share amounts)
|
|
|
Thirteen Weeks Ended |
| ||||||||||||||||||||||||||
|
|
|
January 31, 2012 |
|
January 29, 2013 |
| ||||||||||||||||||||||||
|
|
|
Income |
|
Income |
|
|
|
Diluted |
|
|
|
Income |
|
Income |
|
|
|
Diluted |
|
|
| ||||||||
|
|
|
From |
|
Before |
|
Net |
|
Weighted |
|
Diluted |
|
From |
|
Before |
|
Net |
|
Weighted |
|
Diluted |
| ||||||||
|
|
|
Operations |
|
Income Taxes |
|
Income |
|
Shares |
|
EPS* |
|
Operations |
|
Income Taxes |
|
Income |
|
Shares |
|
EPS* |
| ||||||||
|
As Reported |
|
$ |
15,344 |
|
$ |
7,687 |
|
$ |
17,372 |
|
31,145,241 |
|
$ |
0.56 |
|
$ |
17,182 |
|
$ |
14,320 |
|
$ |
7,594 |
|
33,797,990 |
|
$ |
0.22 |
|
|
% of sales |
|
8.1 |
% |
4.1 |
% |
9.2 |
% |
|
|
|
|
6.7 |
% |
5.5 |
% |
2.9 |
% |
|
|
|
| ||||||||
|
IPO Pro Forma Adjustments (1) |
|
|
|
|
|
|
|
|
|
|
|
|
|
|
|
|
|
|
|
|
| ||||||||
|
Diluted share count adjustment |
|
|
|
|
|
|
|
2,623,587 |
|
(0.04 |
) |
|
|
|
|
|
|
|
|
|
| ||||||||
|
Management fees |
|
350 |
|
350 |
|
220 |
|
|
|
0.01 |
|
— |
|
— |
|
— |
|
|
|
— |
| ||||||||
|
Interest expense |
|
— |
|
1,746 |
|
1,098 |
|
|
|
0.03 |
|
— |
|
— |
|
— |
|
|
|
— |
| ||||||||
|
Loss from debt extinguishment |
|
— |
|
3,831 |
|
2,410 |
|
|
|
0.07 |
|
— |
|
— |
|
— |
|
|
|
— |
| ||||||||
|
Other Adjustments |
|
|
|
|
|
|
|
|
|
|
|
|
|
|
|
|
|
|
|
|
| ||||||||
|
Acquisition-related costs (2) |
|
— |
|
— |
|
— |
|
|
|
— |
|
1,906 |
|
1,906 |
|
937 |
|
|
|
0.03 |
| ||||||||
|
Secondary offering costs (3) |
|
— |
|
— |
|
— |
|
|
|
— |
|
(20 |
) |
(20 |
) |
(40 |
) |
|
|
(0.00 |
) | ||||||||
|
Impairment charges (4) |
|
— |
|
— |
|
— |
|
|
|
— |
|
2,256 |
|
2,256 |
|
1,386 |
|
|
|
0.04 |
| ||||||||
|
Other expenses (5) |
|
— |
|
— |
|
— |
|
|
|
— |
|
180 |
|
180 |
|
111 |
|
|
|
0.00 |
| ||||||||
|
Release of valuation allowance on deferred tax assets (6) |
|
— |
|
— |
|
(14,107 |
) |
|
|
(0.42 |
) |
— |
|
— |
|
— |
|
|
|
— |
| ||||||||
|
Total adjustments |
|
350 |
|
5,927 |
|
(10,379 |
) |
2,623,587 |
|
(0.35 |
) |
4,322 |
|
4,322 |
|
2,394 |
|
— |
|
0.07 |
| ||||||||
|
As Adjusted |
|
$ |
15,694 |
|
$ |
13,614 |
|
$ |
6,993 |
|
33,768,828 |
|
$ |
0.21 |
|
$ |
21,504 |
|
$ |
18,642 |
|
$ |
9,988 |
|
33,797,990 |
|
$ |
0.30 |
|
|
% of sales |
|
8.3 |
% |
7.2 |
% |
3.7 |
% |
|
|
|
|
8.3 |
% |
7.2 |
% |
3.9 |
% |
|
|
|
| ||||||||
|
|
|
Fiscal Year (Fifty-Two Weeks) Ended |
| ||||||||||||||||||||||||||
|
|
|
January 31, 2012 |
|
January 29, 2013 |
| ||||||||||||||||||||||||
|
|
|
Income |
|
Income |
|
|
|
Diluted |
|
|
|
Income |
|
Income |
|
|
|
Diluted |
|
|
| ||||||||
|
|
|
From |
|
Before |
|
Net |
|
Weighted |
|
Diluted |
|
From |
|
Before |
|
Net |
|
Weighted |
|
Diluted |
| ||||||||
|
|
|
Operations |
|
Income Taxes |
|
Income |
|
Shares |
|
EPS* |
|
Operations |
|
Income Taxes |
|
Income |
|
Shares |
|
EPS* |
| ||||||||
|
As Reported |
|
$ |
60,541 |
|
$ |
25,536 |
|
$ |
34,351 |
|
24,586,274 |
|
$ |
1.40 |
|
$ |
75,816 |
|
$ |
66,569 |
|
$ |
39,871 |
|
33,853,276 |
|
$ |
1.18 |
|
|
% of sales |
|
8.6 |
% |
3.6 |
% |
4.9 |
% |
|
|
|
|
7.5 |
% |
6.6 |
% |
4.0 |
% |
|
|
|
| ||||||||
|
IPO Pro Forma Adjustments (1) |
|
|
|
|
|
|
|
|
|
|
|
|
|
|
|
|
|
|
|
|
| ||||||||
|
Diluted share count adjustment |
|
|
|
|
|
|
|
9,182,554 |
|
(0.38 |
) |
|
|
|
|
|
|
|
|
|
| ||||||||
|
Management fees |
|
644 |
|
644 |
|
405 |
|
|
|
0.01 |
|
— |
|
— |
|
— |
|
|
|
— |
| ||||||||
|
Interest expense |
|
— |
|
21,131 |
|
13,291 |
|
|
|
0.39 |
|
— |
|
— |
|
— |
|
|
|
— |
| ||||||||
|
Loss from debt extinguishment |
|
— |
|
5,688 |
|
3,578 |
|
|
|
0.11 |
|
— |
|
— |
|
— |
|
|
|
— |
| ||||||||
|
Other Adjustments |
|
|
|
|
|
|
|
|
|
|
|
|
|
|
|
|
|
|
|
|
| ||||||||
|
Acquisition-related costs (2) |
|
— |
|
— |
|
— |
|
|
|
— |
|
11,980 |
|
11,980 |
|
7,616 |
|
|
|
0.23 |
| ||||||||
|
Secondary offering costs (3) |
|
— |
|
— |
|
— |
|
|
|
— |
|
1,915 |
|
1,915 |
|
1,403 |
|
|
|
0.04 |
| ||||||||
|
Impairment charges (4) |
|
— |
|
— |
|
— |
|
|
|
— |
|
2,256 |
|
2,256 |
|
1,386 |
|
|
|
0.04 |
| ||||||||
|
Other expenses (5) |
|
— |
|
— |
|
— |
|
|
|
— |
|
180 |
|
180 |
|
111 |
|
|
|
0.00 |
| ||||||||
|
Release of valuation allowance on deferred tax assets (6) |
|
— |
|
— |
|
(20,050 |
) |
|
|
(0.59 |
) |
— |
|
— |
|
— |
|
|
|
— |
| ||||||||
|
Total adjustments |
|
644 |
|
27,463 |
|
(2,776 |
) |
9,182,554 |
|
(0.46 |
) |
16,331 |
|
16,331 |
|
10,516 |
|
— |
|
0.31 |
| ||||||||
|
As Adjusted |
|
$ |
61,185 |
|
$ |
52,999 |
|
$ |
31,575 |
|
33,768,828 |
|
$ |
0.94 |
|
$ |
92,147 |
|
$ |
82,900 |
|
$ |
50,387 |
|
33,853,276 |
|
$ |
1.49 |
|
|
% of sales |
|
8.7 |
% |
7.5 |
% |
4.5 |
% |
|
|
|
|
9.1 |
% |
8.2 |
% |
5.0 |
% |
|
|
|
| ||||||||
* Due to rounding to the nearest cent per diluted share, totals may not equal the sum of the line items in the table above.
(1) IPO Pro Forma Adjustments give effect to the initial public offering that was completed on November 23, 2011, as if the offering had occurred at the beginning of fiscal 2011 (February 2, 2011). These pro forma adjustments reflect the following assumptions: (i) the application of the net proceeds from the initial public offering to repay debt resulting in a decrease to interest expense and a loss from debt extinguishment, (ii) the conversion of a significant portion of convertible debt for which such conversion was elected into shares of our common stock, resulting in a decrease to interest expense, a loss from debt extinguishment, (iii) the reduction in management fee expense in connection with the termination of the management agreement between J.W. Childs Associates, L.P. and the Company that became effective with the completion of the initial public offering, and (iv) the effect on diluted EPS as if the common stock shares outstanding at the completion of the offering had been outstanding for the entire period presented.
(2) On May 2, 2012, we acquired all of the equity interests of MGHC Holding Corporation (“Mattress Giant”), including 181 specialty retail stores. On September 25, 2012, we acquired the leasehold interests, store assets, distribution center assets and related inventories, and assumption of certain liabilities of Mattress XPress, Inc. and Mattress XPress of Georgia, Inc. (collectively, “Mattress X-Press”), including 34 mattress specialty retail stores. On December 11, 2012, we acquired the assets and operations of Factory Mattress & Water Bed Outlet of Charlotte, Inc. (“Mattress Source”), including 27 mattress specialty stores. Acquisition-related costs, consisting of direct transaction costs and integration costs, are included in the results of operations as incurred. During the thirteen and fifty-two weeks ended January 29, 2013, we incurred $1.9 million and $12.0 million of acquisition-related costs, respectively.
(3) Reflects $1.9 million of costs that we incurred in connection with a secondary offering of shares of common stock by certain of our selling stockholders, which was completed in October 2012.
(4) Reflects an intangible trade name impairment charge in the amount of $2.1 million related to the Mattress Discounters trade name and a $0.2 million impairment of store assets recorded during the thirteen weeks ended January 29, 2013.
(5) Reflects $0.2 million in expensed legal fees related to our November 2012 debt amendment and extension recorded during the thirteen weeks ended January 29, 2013.
(6) The release of the valuation allowance on deferred tax assets reflects utilization of net operating loss carryforwards throughout fiscal 2011 and an expectation of increased future taxable income effective with the completion of our initial public offering and the resulting elimination of interest expense, which provided sufficient evidence that it was more-likely-than-not that deferred tax assets would be realized in future periods and supported the release of the remaining valuation allowance in the fiscal fourth quarter of 2011.
Our “As Adjusted” data is considered a non-U.S. GAAP financial measure and is not in accordance with, or preferable to, “As Reported,” or GAAP financial data. However, we are providing this information as we believe it facilitates year-over-year comparisons for investors and financial analysts.
About Mattress Firm
Houston-based Mattress Firm is one of the nation’s leading specialty bedding retailers, offering a broad selection of both traditional and specialty mattresses from leading manufacturers, including Sealy, Serta, Simmons, Stearns & Foster and Tempur-Pedic.
Investor Relations Contact: Brad Cohen, ir@mattressfirm.com, 713.343.3652
Media Contact: Sari Martin, mattressfirm@icrinc.com, 203.682.8345
###