Attached files
| file | filename |
|---|---|
| 8-K - FORM 8-K - Healthcare Corp of America | v338957_8k.htm |
| EX-99.1 - EXHIBIT 99.1 - Healthcare Corp of America | v338957_ex99-1.htm |
| EX-99.2 - EXHIBIT 99.2 - Healthcare Corp of America | v338957_ex99-2.htm |

Healthcare Corporation of America (HCCA) Company Overview Presentation 2013 MAR
2 Table of Contents Introduction 4 Industry & Market 14 Comparable Valuation 19 Appendix 23
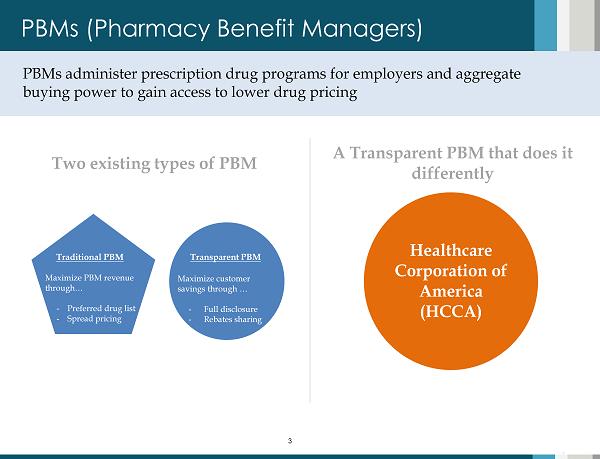
3 PBMs (Pharmacy Benefit Managers) PBMs administer prescription drug programs for employers and aggregate buying power to gain access to lower drug pricing 3 Traditional PBM Maximize PBM revenue through… - Preferred drug list - Spread pricing Transparent PBM Healthcare Corporation of America (HCCA) - Maximize customer savings through … - F ull disclosure - Rebates sharing Two existing types of PBM A Transparent PBM that does it differently
Introduction to HCCA 1 section
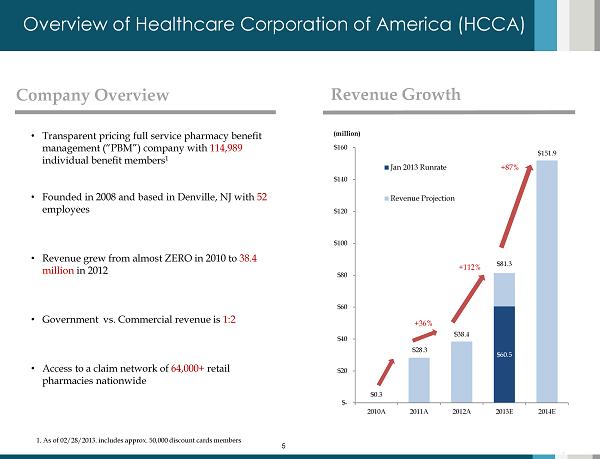
5 $0.3 $60.5 $28.3 $38.4 $81.3 $151.9 $- $20 $40 $60 $80 $100 $120 $140 $160 2010A 2011A 2012A 2013E 2014E (million) Jan 2013 Runrate Revenue Projection Overview of Healthcare Corporation of America (HCCA) 5 Company Overview • Transparent pricing full service pharmacy benefit management (“PBM”) company with 114,989 individual benefit members 1 • Founded in 2008 and based in Denville, NJ with 52 employees • Revenue grew from almost ZERO in 2010 to 38.4 million in 2012 • G overnment vs. Commercial revenue is 1:2 • Access to a claim network of 64,000 + retail pharmacies nationwide Revenue Growth 1. As of 02/28/2013. includes approx. 50,000 discount cards members +112% +87% +36%
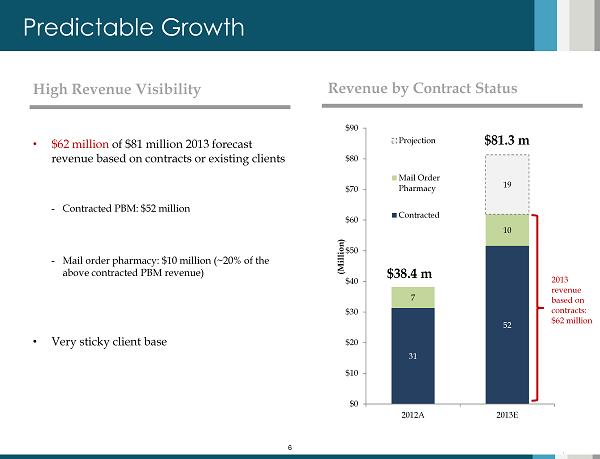
6 31 52 7 10 19 $0 $10 $20 $30 $40 $50 $60 $70 $80 $90 2012A 2013E (Million) Projection Mail Order Pharmacy Contracted Predictable Growth 6 High Revenue Visibility • $62 million of $81 million 2013 forecast revenue based on contracts or existing clients - Contracted PBM: $52 million - Mail order pharmacy: $10 million (~20% of the above contracted PBM revenue) • Very sticky client base Revenue by Contract Status $38.4 m $81.3 m 2013 revenue based on contracts : $62 million
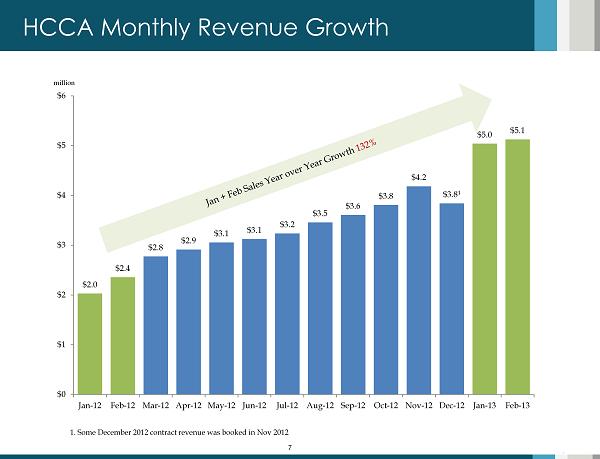
7 HCCA Monthly Revenue Growth 7 1. Some December 2012 contract revenue was booked in Nov 2012 $2.0 $2.4 $2.8 $2.9 $3.1 $3.1 $3.2 $3.5 $3.6 $3.8 $4.2 $ 3.8 1 $5.0 $5.1 $0 $1 $2 $3 $4 $5 $6 Jan-12 Feb-12 Mar-12 Apr-12 May-12 Jun-12 Jul-12 Aug-12 Sep-12 Oct-12 Nov-12 Dec-12 Jan-13 Feb-13 million
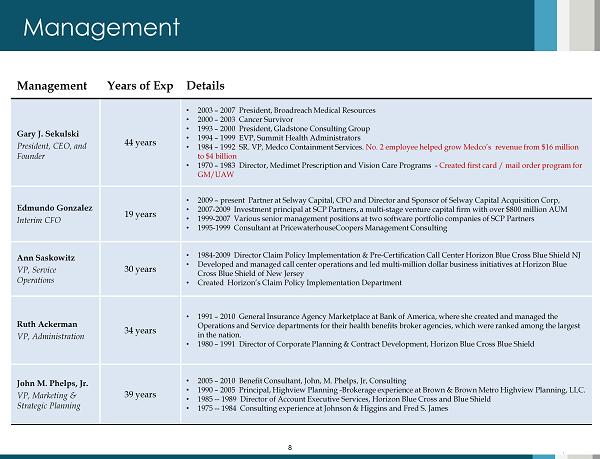
8 Management Management Years of Exp Details Gary J. Sekulski President, CEO, and Founder 44 years • 2003 – 2007 President, Broadreach Medical Resources • 2000 – 2003 Cancer Survivor • 1993 – 2000 President, Gladstone Consulting Group • 1994 – 1999 EVP, Summit Health Administrators • 1984 – 1992 SR. VP, Medco Containment Services. No. 2 employee helped grow Medco’s revenue from $16 million to $4 billion • 1970 – 1983 Director, Medimet Prescription and Vision Care Programs - Created first card / mail order program for GM/UAW Edmundo Gonzalez Interim CFO 19 years • 2009 – present Partner at Selway Capital, CFO and Director and Sponsor of Selway Capital Acquisition Corp, • 2007 - 2009 Investment principal at SCP Partners, a multi - stage venture capital firm with over $800 million AUM • 1999 - 2007 Various senior management positions at two software portfolio companies of SCP Partners • 1995 - 1999 Consultant at PricewaterhouseCoopers Management Consulting Ann Saskowitz VP, Service Operations 30 years • 1984 - 2009 Director Claim Policy Implementation & Pre - Certification Call Center Horizon Blue Cross Blue Shield NJ • Developed and managed call center operations and led multi - million dollar business initiatives at Horizon Blue Cross Blue Shield of New Jersey • Created Horizon’s Claim Policy Implementation Department Ruth Ackerman VP, Administration 34 years • 1991 – 2010 General Insurance Agency Marketplace at Bank of America, where she created and managed the Operations and Service departments for their health benefits broker agencies, which were ranked among the largest in the nation. • 1980 – 1991 Director of Corporate Planning & Contract Development, Horizon Blue Cross Blue Shield John M. Phelps, Jr. VP, Marketing & Strategic Plannin g 39 years • 2005 – 2010 Benefit Consultant, John, M. Phelps, Jr , Consulting • 1990 – 2005 Principal, Highview Planning - Brokerage experience at Brown & Brown Metro Highview Planning, LLC. • 1985 -- 1989 Director of Account Executive Services, Horizon Blue Cross and Blue Shield • 1975 -- 1984 Consulting experience at Johnson & Higgins and Fred S. James 8
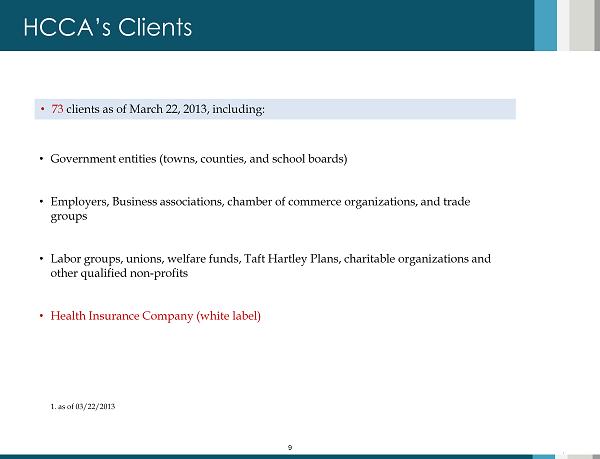
9 HCCA’s Clients • G overnment entities (towns , counties, and school boards) • Employers , Business associations, chamber of commerce organizations, and trade groups • Labor groups, unions, welfare funds, Taft Hartley Plans, charitable organizations and other qualified non - profits • Health Insurance Company (white label) • 73 clients as of March 22, 2013, including : 9 1. as of 03/22/2013
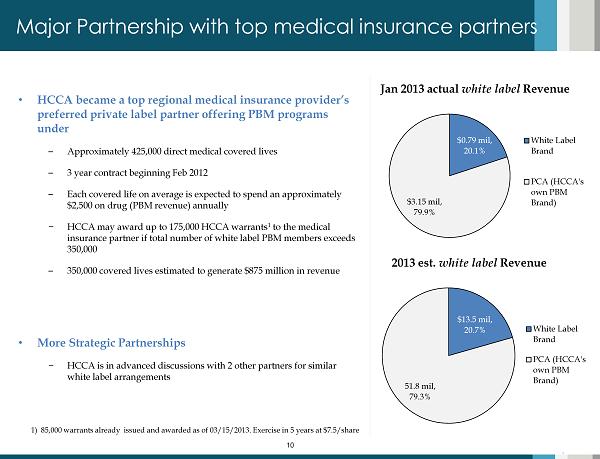
10 Major Partnership with top medical insurance partners 10 • HCCA became a top regional medical insurance provider’s preferred private label partner offering PBM programs under – Approximately 425,000 direct medical covered lives – 3 year contract beginning Feb 2012 – Each covered life on average is expected to spend an approximately $2,500 on drug (PBM revenue) annually − HCCA may award up to 175,000 HCCA warrants 1 to the medical insurance partner if total number of white label PBM members exceeds 350,000 – 350,000 covered lives estimated to generate $875 million in revenue • More Strategic Partnerships − HCCA is in advanced discussions with 2 other partners for similar white label arrangements 1) 85,000 warrants already issued and awarded as of 03/15/2013. Exercise in 5 years at $7.5/share Jan 2013 actual white label Revenue 2013 est. white label Revenue $0.79 mil, 20.1% $3.15 mil, 79.9% White Label Brand PCA (HCCA's own PBM Brand) $13.5 mil, 20.7% 51.8 mil, 79.3% White Label Brand PCA (HCCA's own PBM Brand)
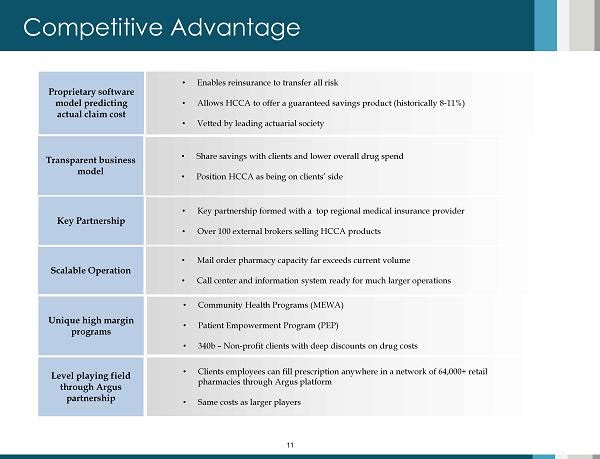
11 Competitive Advantage 11 • Enables reinsurance to transfer all risk • Allows HCCA to offer a guaranteed savings product (historically 8 - 11%) • Vetted by leading actuarial society • Key partnership formed with a top regional medical insurance provider • Over 100 external brokers selling HCCA products • Share savings with clients and lower overall drug spend • Position HCCA as being on clients’ side Proprietary software model predicting actual claim cost Transparent business model Key Partnership • Community Health Programs (MEWA) • Patient Empowerment Program (PEP) • 340b – Non - profit clients with deep discounts on drug costs Unique high margin programs Level playing field through Argus partnership • Clients employees can fill prescription anywhere in a network of 64,000+ retail pharmacies through Argus platform • Same costs as larger players • Mail order pharmacy capacity far exceeds current volume • Call center and information system ready for much larger operations Scalable Operation
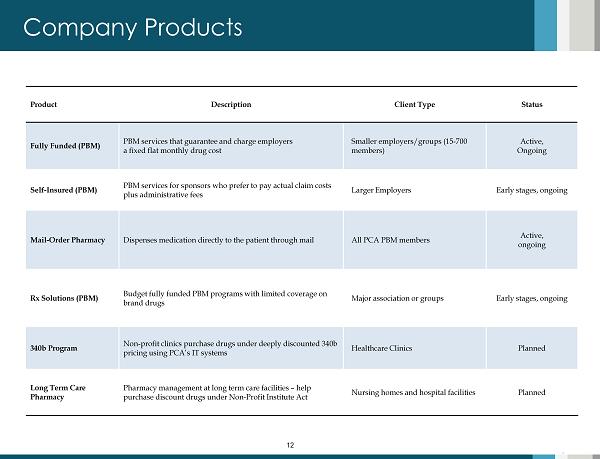
12 Company Products 12 Product Description Client Type Status Fully Funded ( PBM) PBM services that guarantee and charge employers a fixed flat monthly drug cost Smaller employers/groups (15 - 700 members) Active, Ongoing Self - Insured (PBM) PBM services for sponsors who prefer to pay actual claim costs plus administrative fees Larger Employers Early stages, ongoing Mail - Order Pharmacy Dispenses medication directly to the patient through mail All PCA PBM members Active, ongoing Rx Solutions (PBM) Budget fully funded PBM programs with limited coverage on brand drugs Major association or groups Early stages, ongoing 340b Program Non - profit clinics purchase drugs under deeply discounted 340b pricing using PCA’s IT systems Healthcare Clinics Planned Long Term Care Pharmacy Pharmacy management at long term care facilities – help purchase discount drugs under Non - Profit Institute Act Nursing homes and hospital facilities Planned
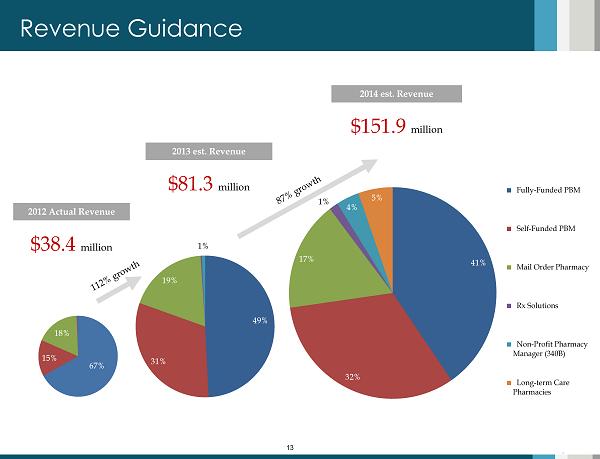
13 41% 32% 17% 1% 4% 5% Fully-Funded PBM Self-Funded PBM Mail Order Pharmacy Rx Solutions Non-Profit Pharmacy Manager (340B) Long-term Care Pharmacies 49% 31% 19% 1% 13 Revenue Guidance 67% 15% 18% 2013 est. Revenue $81.3 million 2014 est. Revenue $151.9 million 2012 Actual Revenue $38.4 million
Industry & Market 2 section
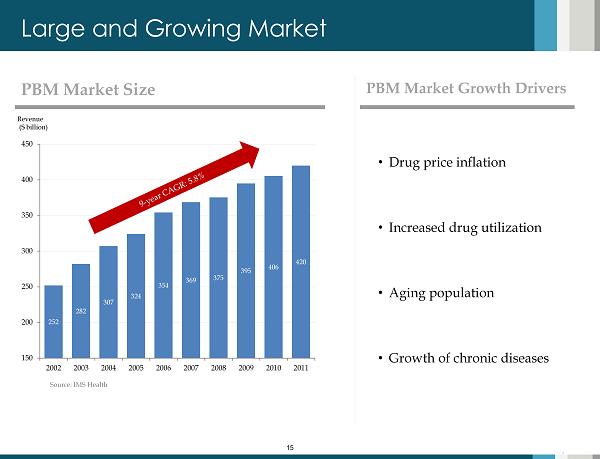
15 Large and Growing Market PBM Market Size Revenue ($ billion) • D rug price inflation • Increased drug utilization • Aging population • Growth of chronic diseases Source: IMS Health 15 252 282 307 324 354 369 375 395 406 420 150 200 250 300 350 400 450 2002 2003 2004 2005 2006 2007 2008 2009 2010 2011 PBM Market Growth Drivers
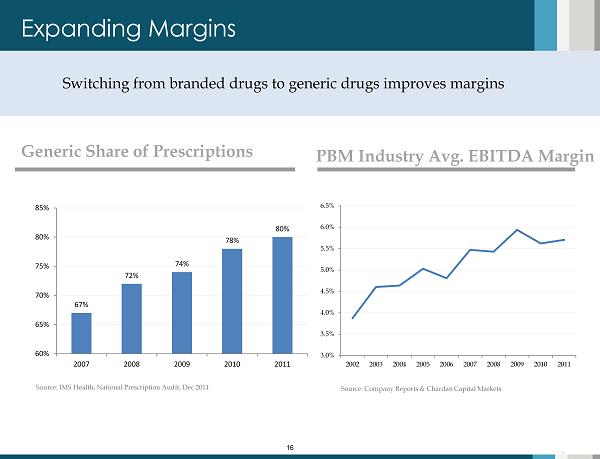
16 Expanding Margins Source: IMS Health, National Prescription Audit, Dec 2011 16 Switching from branded drugs to generic drugs improves margins 3.0% 3.5% 4.0% 4.5% 5.0% 5.5% 6.0% 6.5% 2002 2003 2004 2005 2006 2007 2008 2009 2010 2011 PBM Industry Avg. EBITDA Margin Source: Company Reports & Chardan Capital Markets 67% 72% 74% 78% 80% 60% 65% 70% 75% 80% 85% 2007 2008 2009 2010 2011 Generic Share of Prescriptions

17 Favorable Market Segmentation Source: Atlantic Information System and Chardan Estimates Captive PBMs • Capitive PBMs are PBMs offered by healthcare plan companies • They are moving toward outsourcing to 3 rd parties Fragmented Market • 58 % market (non - top 3) is still fragmented within over 100 PBMs and can be aggregated • 23 M&A deals since 2010 • Customer fallout from mega mergers creates opportunity for HCCA to pick up market share Opportunities in smaller employers • Fully funded small employers are typically not pursued by the big three PBMs (Express Scripts, CVS, and Catamaran) • Less competition and higher margin segment for HCCA 17 Market Share by Company Market Share by PBM category Source: Atlantic Information System and Chardan Estimates 22.3% 17.5% 4.4% 2.5% 2.4% 50.9% Express Scripts CVS Caremark Optum Rx (United Health) Humana Pharmacy Solutions (Humana) Catamaran Others 42.2% 21.0% 36.8% Top 3 non-Captive PBMs Captive PBMs Others
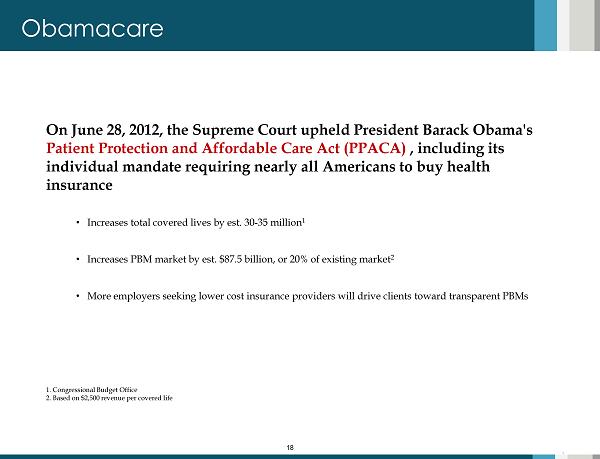
18 Obamacare 18 On June 28, 2012, the Supreme Court upheld President Barack Obama's Patient Protection and Affordable Care Act (PPACA) , including its individual mandate requiring nearly all Americans to buy health insurance • Increases total covered lives by est. 30 - 35 million 1 • Increases PBM market by est. $87.5 billion, or 20% of existing market 2 • More employers seeking lower cost insurance providers will drive clients toward transparent PBMs 1. Congressional B udget Office 2. Based on $2,500 revenue per covered life
Comparable Valuation 3 section
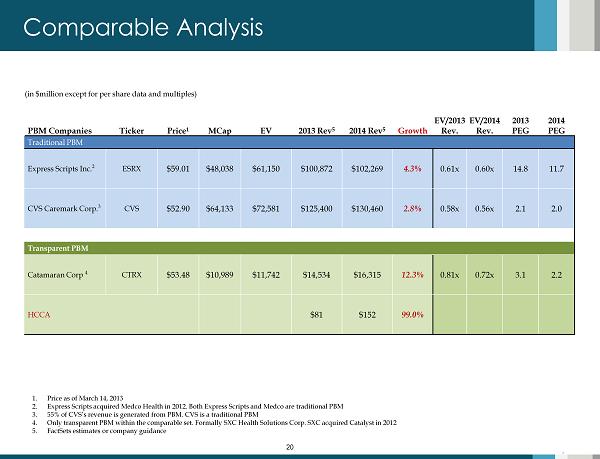
20 Comparable Analysis 20 1. Price as of March 14, 2013 2. Express Scripts acquired Medco Health in 2012. Both Express Scripts and Medco are traditional PBM 3. 55% of CVS’s revenue is generated from PBM. CVS is a traditional PBM 4. Only transparent PBM within the comparable set. Formally SXC Health Solutions Corp. SXC acquired Catalyst in 2012 5. FactSets estimates or company guidance (in $million except for per share data and multiples) PBM Companies Ticker Price 1 MCap EV 2013 Rev 5 2014 Rev 5 Growth EV/2013 Rev. EV/2014 Rev. 2013 PEG 2014 PEG Traditional PBM Express Scripts Inc. 2 ESRX $ 59.01 $48,038 $61,150 $100,872 $102,269 4.3% 0.61x 0.60x 14.8 11.7 CVS Caremark Corp. 3 CVS $ 52.90 $64,133 $72,581 $125,400 $130,460 2.8% 0.58x 0.56x 2.1 2.0 Transparent PBM Catamaran Corp 4 CTRX $53.48 $10,989 $11,742 $14,534 $16,315 12.3% 0.81x 0.72x 3.1 2.2 HCCA $81 $152 99.0%

21 Recent PBM M&A Activity 21 Date Target Buyers Implied EV ($million) Revenue ($million) EBITDA ($million) EV/Revenue EV/EBITDA Apr-12 Catalyst Health Solutions SXC Health Solutions 4,400 5,714 205 0.77x 21.5x Feb-12 Community Specialty Pharmacies and Centralized Specialty and Mail Service Pharmacy Walgreen Co. (WAG) 230 Jan-12 HealthTrans SXC Health Solutions 250 0.90x 12.5x Nov-11 HealthDataInsights, Inc. HMS Holdings Corp. (HMSY) 381 Sep-11 CareCentrix, Inc. Summit Partners Jul-11 Medco Health Solutions, Inc. Express Scripts Holding Company (ESRX) 29,100 0.50x 11.0x May-11 Prometheus Laboratories Inc. Nestlé Health Science S.A. May-11 Walgreens Health Initiatives, Inc. Catalyst Health Solutions, Inc. (CHSI) 525 Dec-10 PorSanos Corporation United BioSource Corporation Dec-10 Total Healthcare Gtoup United BioSource Corporation Dec-10 Careology Ltd. Medco Health Soulutions Limited Dec-10 MedfusionRx, LLC and Medtown South LLC SXC Health Solutions, Corp. (SXC) 106 Aug-10 United BioSource Corporation Medco Health Soulutions Inc. (MHS) 733 Aug-10 Immediate Pharmaceutical Services, Inc. Catalyst Health Solutions, Inc. (CHSI) 40 Jun-10 RxHub LLC SureScript Systems, Inc May-10 DS Pharmacy, Inc. Bioscrip Pharmacy Services, Inc. Feb-10 DNA Direct, Inc. MedcoHealth Solutions Inc. () Jan-10 Critical Homecare Solutions Holdings, Inc. BioScrip Inc. (BIOS) 377 252 34 1.50x 11.1X Dec-09 Fortuna Apotheke AG Europa Apotheek Venlo B.V. Jul-10 Total Script LLC Catalyst Health Solutions, Inc. (CHSI) 27 Jul-10 jaScorp Health Business Systems Inc. 2 2 1.00x Apr-10 NextRx, Inc. Express Scripts Inc. (ESRX) 3,553 Apr-10 NextRx, Inc. Express Scripts Inc. (ESRX) 841 Mar-10 SironaHealth Inc. - Dec-08 Owens & Minor Inc. Liberty Healthcare Group, Inc. 63 Dec-08 AOM Healthcare Solutions Liberty Medical Supply, Inc. 63 Avg Transaction Multples 0.93x 17.0x Source: Company Reports, Chardan Capital Markets Estimates and Bourne Partners PBM Market Overview
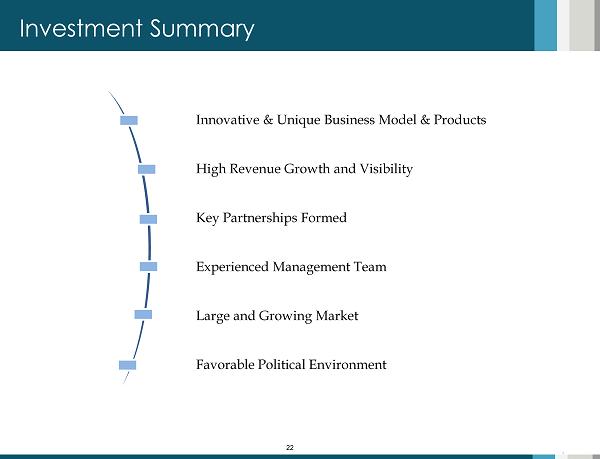
22 22 Investment Summary Innovative & Unique Business Model & Products High Revenue Growth and Visibility Key Partnerships Formed Experienced Management Team Large and Growing Market Favorable Political Environment
Appendix 4 section
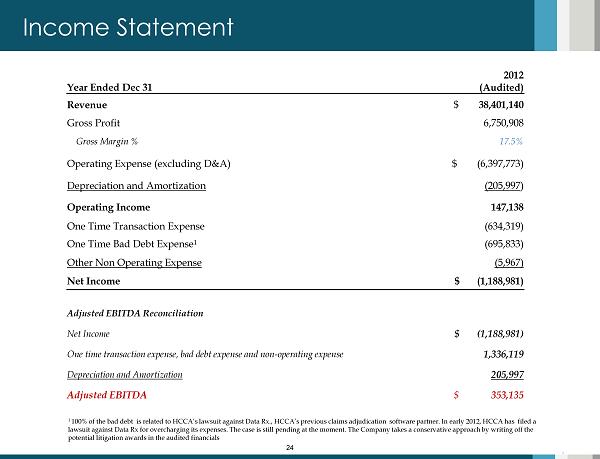
24 Income Statement 24 Year Ended Dec 31 2012 (Audited) Revenue $ 38,401,140 Gross Profit 6,750,908 Gross Margin % 17.5% Operating Expense (excluding D&A) $ (6,397,773) Depreciation and Amortization ( 205,997 ) Operating Income 147,138 One Time Transaction Expense (634,319) One Time Bad Debt Expense 1 (695,833) Other Non Operating Expense (5,967) Net Income $ (1,188,981) Adjusted EBITDA Reconciliation Net Income $ (1,188,981) One time transaction expense , bad debt expense and non - operating expense 1,336,119 Depreciation and Amortization 205,997 Adjusted EBITDA $ 353,135 1 100% of the bad debt is related to HCCA’s lawsuit against Data Rx ., HCCA’s previous claims adjudication software partner. In early 2012, HCCA has filed a lawsuit against Data Rx for overcharging its expenses. The case is still pending at the moment. The Company takes a conservative approach by writing off the potential litigation awards in the audited financials
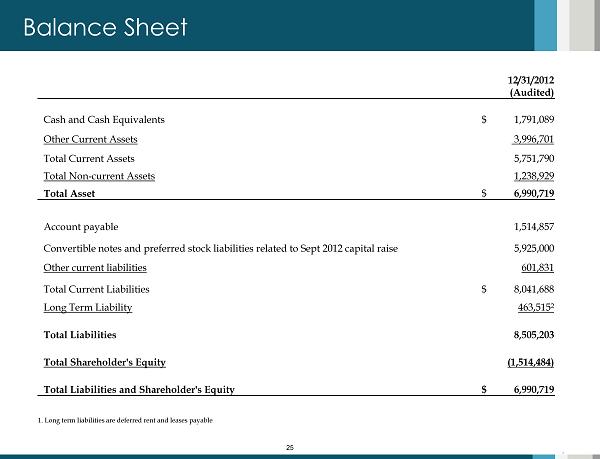
25 Balance Sheet 25 12/31/2012 (Audited) Cash and Cash Equivalents $ 1,791,089 Other Current Assets 3,996,701 Total Current Assets 5,751,790 Total Non - current Assets 1,238,929 Total Asset $ 6,990,719 Account payable 1,514,857 Convertible notes and preferred stock l iabilities related to Sept 2012 capital raise 5,925,000 Other current liabilities 601,831 Total Current Liabilities $ 8,041,688 Long Term Liability 463,515 2 Total Liabilities 8,505,203 Total Shareholder's Equity (1,514,484) Total Liabilities and Shareholder's Equity $ 6,990,719 1. Long term liabilities are deferred rent and leases payable
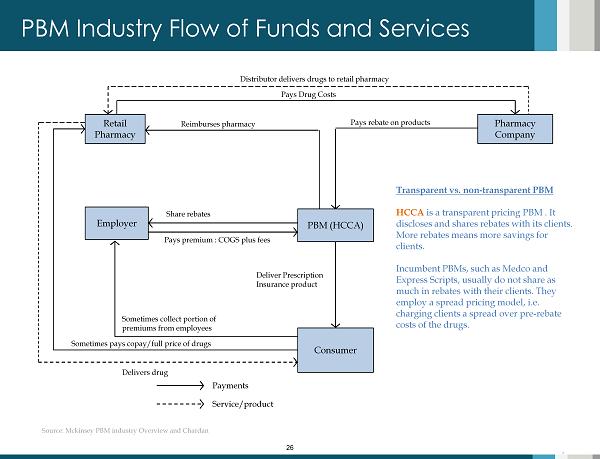
26 PBM Industry Flow of Funds and Services PBM (HCCA) Transparent vs. non - transparent PBM HCCA is a transparent pricing PBM . It discloses and shares rebates with its clients. More rebates means more savings for clients. Incumbent PBMs, such as Medco and Express Scripts, usually do not share as much in rebates with their clients. They employ a spread pricing model, i.e. charging clients a spread over pre - rebate costs of the drugs. Employer Retail Pharmacy Pharmacy Company Consumer Pays premium : COGS plus fees Share rebates Deliver Prescription Insurance product Sometimes collect portion of premiums from employees Sometimes pays copay/full price of drugs Delivers drug Pays rebate on products Reimburses pharmacy Distributor delivers drugs to retail pharmacy Payments Service/product Source: Mckinsey PBM industry Overview and Chardan 26 Pays Drug Costs
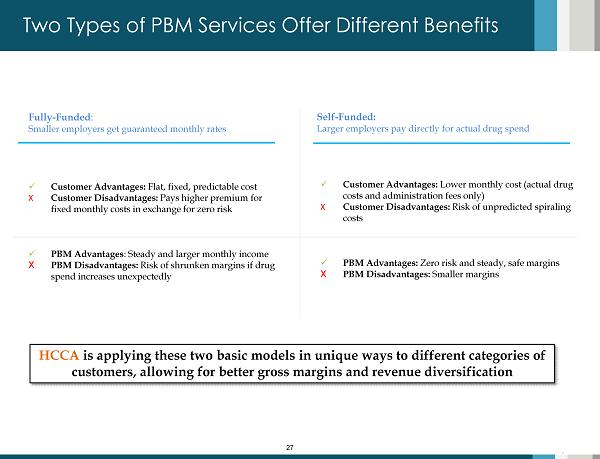
27 Two Types of PBM Services Offer Different Benefits x Customer Advantages: Flat, fixed, predictable cost X Customer Disadvantages: Pays higher premium for fixed monthly costs in exchange for zero risk x PBM Advantages : Steady and larger monthly income X PBM Disadvantages: Risk of shrunken margins if drug spend increases unexpectedly x Customer Advantages: Lower monthly cost (actual drug costs and administration fees only) X Customer Disadvantages: Risk of unpredicted spiraling costs x PBM Advantages: Zero risk and steady, safe margins X PBM Disadvantages: Smaller margins Fully - Funded : Smaller employers get guaranteed monthly rates Self - Funded: Larger employers pay directly for actual drug spend HCCA is applying these two basic models in unique ways to different categories of customers, allowing for better gross margins and revenue diversification 27
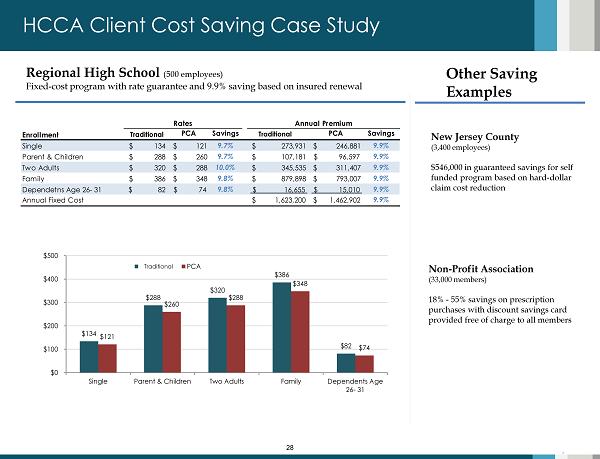
28 HCCA Client Cost Saving Case Study Regional High School ( 500 employees) Fixed - cost program with rate guarantee and 9.9% saving based on insured renewal $134 $288 $320 $386 $82 $121 $260 $288 $348 $74 $0 $100 $200 $300 $400 $500 Single Parent & Children Two Adults Family Dependents Age 26- 31 Incumbent PCA Incumbent PCA Savings Incumbent PCA Savings Single $ 134 $ 121 9.7% $ 273,931 $ 246,881 9.9% Parent & Children $ 288 $ 260 9.7% $ 107,181 $ 96,597 9.9% Two Adults $ 320 $ 288 10.0% $ 345,535 $ 311,407 9.9% Family $ 386 $ 348 9.8% $ 879,898 $ 793,007 9.9% Dependetns Age 26- 31 $ 82 $ 74 9.8% $ 16,655 $ 15,010 9.9% Annual Fixed Cost $ 1,623,200 $ 1,462,902 9.9% Enrollment Rates Annual Premium Other Saving Examples New Jersey County (3,400 employees) $546,000 in guaranteed savings for self funded program based on hard - dollar claim cost reduction Non - Profit Association (33,000 members) 18% - 55% savings on prescription purchases with discount savings card provided free of charge to all members 28 Traditional Traditional Traditional
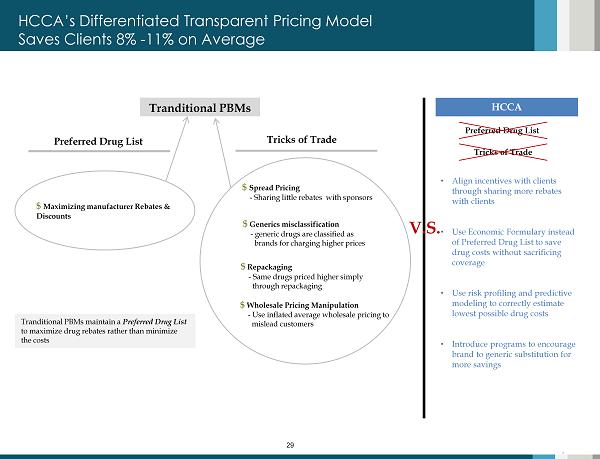
29 Tranditional PBMs 29 $ Maximizing manufacturer Rebates & Discounts Preferred Drug List Tranditional PBMs maintain a Preferred D rug L ist to maximize drug rebates rather than minimize the costs Tricks of Trade $ Spread Pricing - Sharing little rebates with sponsors $ Repackaging - Same drugs priced higher simply through repackaging $ G enerics misclassification - generic drugs are classified as brands for charging higher prices $ Wholesale Pricing Manipulation - Use inflated average wholesale pricing to mislead customers HCCA’s Differentiated Transparent Pricing Model Saves Clients 8% - 11% on Average HCCA • Align incentives with clients through sharing more rebates with clients • Use Economic Formulary instead of Preferred Drug List to save drug costs without sacrificing coverage • Use risk profiling and predictive modeling to correctly estimate lowest possible drug costs • Introduce programs to encourage brand to generic substitution for more savings Preferred Drug List Tricks of Trade V.S.
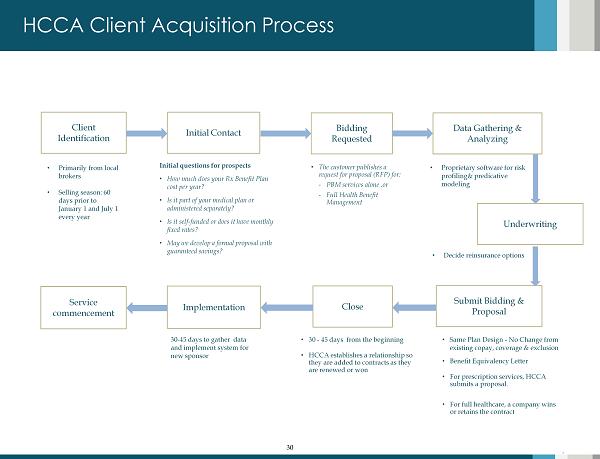
30 HCCA Client Acquisition Process Client Identification Initial Contact Bidding Requested Data Gathering & Analyzing Underwriting Close Implementation Initial questions for prospects • How much does your Rx Benefit Plan cost per year? • Is it part of your medical plan or administered separately? • Is it self - funded or does it have monthly fixed rates? • May we develop a formal proposal with guaranteed savings? • Primarily from local brokers • Selling season: 60 days prior to January 1 and July 1 every year • Proprietary software for risk profiling& predicative modeling Service commencement • Same Plan Design - No Change from existing copay, coverage & exclusion • Benefit Equivalency Letter • For prescription services, HCCA submits a proposal. • For full healthcare, a company wins or retains the contract 30 Submit Bidding & Proposal • 30 - 45 days from the beginning • HCCA establishes a relationship so they are added to contracts as they are renewed or won 30 - 45 days to gather data and implement system for new sponsor • The customer publishes a request for proposal (RFP) for: - PBM services alone ,or - Full Health Benefit Management • Decide reinsurance options

Healthcare Corporation of America (HCCA) Company Overview Presentation 2013 MAR