Attached files
| file | filename |
|---|---|
| 8-K - CHINA FUND INC | fp0006823_8k.htm |
|
FEB 28, 2013
|
Monthly Insight
The China Fund, Inc. (CHN)
|
|
Investment Objective
|
The investment objective of the Fund is to achieve long term capital appreciation. The Fund seeks to achieve its objective through investment in the equity securities of companies and other entities with significant assets, investments, production activities, trading or other business interests in China or which derive a significant part of their revenue from China.
The Fund has an operating policy that the Fund will invest at least 80% of its assets in China companies. For this purpose, ‘China companies’ are (i) companies for which the principal securities trading market is in China; (ii) companies for which the principal securities trading market is outside of China or in companies organized outside of China, that in both cases derive at least 50% of their revenues from goods or services sold or produced, or have a least 50% of their assets in China; or (iii) companies organized in China. Under the policy, China will mean the People’s Republic of China, including Hong Kong, and Taiwan. The Fund will provide its stockholders with at least 60 days’ prior notice of any change to this policy.
|
Performance Overview
|
|
Performance History
|
1 month
|
3 months
|
YTD
|
1 Year
|
3 Years
(p.a.)
|
5 Years
(p.a.)
|
10 Years
(p.a.)
|
Since
Inception
|
|
NAV (%)
|
0.13
|
9.34
|
4.78
|
5.95
|
4.64
|
2.37
|
18.11
|
10.91
|
|
Market price (%)
|
-4.49
|
9.67
|
0.23
|
6.88
|
4.40
|
5.02
|
17.83
|
9.96
|
|
Benchmark (%)
|
-1.96
|
4.21
|
1.41
|
5.45
|
7.41
|
1.35
|
13.45
|
N/A
|
|
Performance History
|
2012
|
2011
|
2010
|
2009
|
2008
|
2007
|
2006
|
2005
|
|
NAV (%)
|
12.07
|
-24.37
|
27.25
|
72.82
|
-46.95
|
86.20
|
57.10
|
6.09
|
|
Market price (%)
|
20.46
|
-27.51
|
23.60
|
72.19
|
-40.65
|
50.24
|
65.67
|
-21.51
|
|
Benchmark (%)
|
22.65
|
-18.36
|
13.60
|
67.12
|
-49.37
|
37.97
|
39.50
|
10.27
|
Source: State Street Bank and Trust Company. Source for index data: MSCI as at February 28, 2013.
|
Portfolio Analysis
|
|
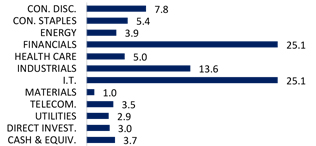
Sector allocation (%)
|
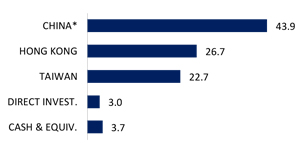
Country allocation (%)
|
 |
 |
|
Source: State Street Bank and Trust Company as at February 28, 2013.
|
* China includes A-shares (5.6%), A-share equity linked securities (8.0%),
B-shares (0.0%), H-shares (13.4%) and Red-chips (16.9%).
|

The China Fund, Inc. (CHN)
|
Portfolio Analysis (continued)
|
|
Top 10 Holdings
|
Sector
|
%
|
|
TAIWAN SEMICONDUCTOR MANUFACTURING CO., LTD.
|
I.T.
|
5.7
|
|
INDUSTRIAL & COMMERCIAL BANK OF CHINA
|
FINANCIALS
|
5.7
|
|
HAND ENTERPRISE SOLUTIONS CO., LTD.
|
I.T.
|
5.7
|
|
SUN HUNG KAI PROPERTIES, LTD.
|
FINANCIALS
|
5.2
|
|
CHINA EVERBRIGHT INTERNATIONAL, LTD.
|
INDUSTRIALS
|
4.7
|
|
CHINA MOBILE, LTD.
|
TELECOM
|
3.5
|
|
DIGITAL CHINA HOLDINGS, LTD.
|
I.T.
|
3.0
|
|
ENN ENERGY HOLDINGS, LTD.
|
UTILITIES
|
2.9
|
|
CHINA MEDICAL SYSTEM HOLDINGS, LTD.
|
HEALTHCARE
|
2.9
|
|
PING AN INSURANCE , LTD.
|
FINANCIALS
|
2.8
|
|
Total
|
42.1
|
|
|
Direct Investments
|
Sector
|
%
|
|
GOLDEN MEDITECH HOLDINGS, LTD. 15.0%, 5/16/13
|
OTHERS
|
1.5
|
|
GOLDEN MEDITECH HOLDINGS, LTD. 15.0%, 11/16/13
|
OTHERS
|
1.5
|
|
Total
|
3.0
|
|
Source: State Street Bank and Trust Company as at February 28, 2013.
|
Fund Details
|
|
NAV
|
$23.66
|
|
Market price
|
$21.46
|
|
Premium/Discount
|
-9.30%
|
|
Market cap
|
US$340.5m
|
|
Shares outstanding
|
15,868,433
|
|
Exchange listed
|
NYSE
|
|
Listing date
|
July 10, 1992
|
|
Benchmark
|
MSCI Golden Dragon Index (Total Return)
|
|
Fund Manager
|
Christina Chung
|
|
Listed and direct investment manager
|
RCM Asia Pacific Limited
|
Source: State Street Bank and Trust Company as at February 28, 2013.
|
Dividend History (10 years)
|
|
Declaration
date
|
Ex-dividend
date
|
Record
date
|
Payable
date
|
Dividend/
Share
|
Income
|
Long-term Capital
|
Short-term Capital
|
|
10 Dec 2012
|
20 Dec 2012
|
24 Dec 2012
|
28 Dec 2012
|
3.2517
|
0.3473
|
2.9044
|
0.0000
|
|
8 Dec 2011
|
21 Dec 2011
|
23 Dec 2011
|
29 Dec 2011
|
2.9964
|
0.1742
|
2.8222
|
0.0000
|
|
8 Dec 2010
|
21 Dec 2010
|
24 Dec 2010
|
29 Dec 2010
|
2.2742
|
0.3746
|
1.8996
|
0.0000
|
|
9 Dec 2009
|
22 Dec 2009
|
24 Dec 2009
|
29 Dec 2009
|
0.2557
|
0.2557
|
0.0000
|
0.0000
|
|
8 Dec 2008
|
22 Dec 2008
|
24 Dec 2008
|
23 Jan 2009
|
5.8174
|
0.4813
|
5.3361
|
0.0000
|
|
7 Dec 2007
|
19 Dec 2007
|
21 Dec 2007
|
25 Jan 2008
|
12.1200
|
0.2800
|
9.0000
|
2.8400
|
|
8 Dec 2006
|
19 Dec 2006
|
21 Dec 2006
|
29 Dec 2006
|
4.0117
|
0.2996
|
2.7309
|
0.9812
|
|
9 Dec 2005
|
19 Dec 2005
|
21 Dec 2005
|
29 Dec 2005
|
2.5119
|
0.2172
|
2.2947
|
0.0000
|
|
13 Dec 2004
|
20 Dec 2004
|
22 Dec 2004
|
7 Jan 2005
|
3.5701
|
0.1963
|
3.2664
|
0.1074
|
|
19 Dec 2003
|
29 Dec 2003
|
31 Dec 2003
|
15 Jan 2004
|
1.7800
|
0.0700
|
0.6700
|
1.0400
|
Source : State Street Bank and Trust Company as at December 31, 2012
2
The China Fund, Inc. (CHN)
The China Fund Inc. NAV Performance of USD $10,000 since inception (with dividends reinvested at NAV price)
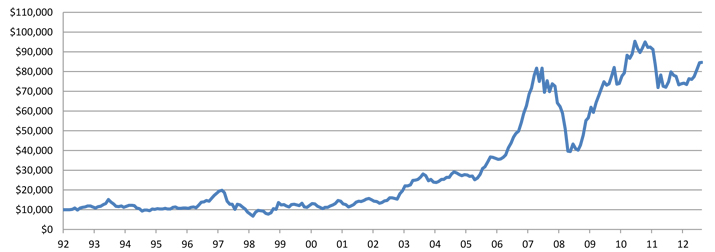
Past performance is not a guide to future returns.
Source: State Street Bank and Trust Company as at February 28, 2013.
The China Fund Inc. Premium / Discount
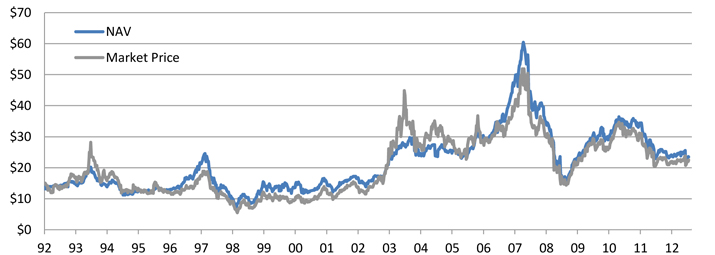
Past performance is not a guide to future returns.
Source: State Street Bank and Trust Company as at February 28, 2013.
3
The China Fund, Inc. (CHN)
Manager’s Commentary
Market review
In February, the off-shore China equity market was in a consolidation mode after a strong rebound since September 2012. The market pulled back on tightening concerns after the People’s Bank of China (PBoC) conducted an open market operation to absorb excess liquidity. We believe that this latest PBoC action did not indicate a shift towards policy tightening. Rather, this action likely was largely driven by liquidity normalization following the usual easier credit conditions before Chinese New Year. On the other hand, the State Council was urging local governments to tackle surging property prices. As of now, local governments have not yet implemented any measures. Investors are distressed about another possible round of policy tightening in property sector. On the macroeconomic front, the February Purchasing Managers’ Index (PMI) eased modestly to 50.1 but was still above the threshold of 50 for the fifth consecutive month. Banking and property sectors, being the outperformers in the previous rally, were under selling pressure on profit taking.
In Hong Kong, the government launched another round of cooling measures to curb overheating property prices by doubling stamp duties to buyers who are already residential unit owners. We believe that this will lead to a significant fall in transactions in the physical market and potentially some adjustment in property prices. Investors’ sentiment towards property developers were undermined. Even so, valuations of property developers are attractive.
In Taiwan, macro-economic data continued to be supportive of equity performance. For external sectors, both imports and exports rose significantly year-on-year in January; while industrial production increase 19.2% year-on-year compared to low single digit growth the previous month. Taiwan’s fourth quarter GDP grew at 3.7% year-on-year, leading to full year growth of 1.3%. On the other hand, January CPI inflation remained low at approximately 1.2% year-on-year compared to a 1.6% year-on-year rise the previous month.
Fund review
In February, the Fund outperformed relative to the benchmark mainly due to stock selection in the industrials sector.
The top contributor for the month was China Everbright International. Share price performed well in February since the market anticipated a possible acceleration of new projects to resolve pollution in China. In the medium term, the stock may be re-rated as its revenues will become increasingly driven by operating service revenue. On the other hand, the share price of Natural Beauty continued to be weak, undermined by a profit warning for 2012. Consumers tended to be conservative in their discretionary spending.
Outlook
We expect China equities to range trade in the short term awaiting economic reform initiatives by the new government. As valuations and earnings expectations are still reasonable, we believe downside risk is limited. While investors are increasingly wary of policy tightening controls for the property sector, the existing policy stance remains relatively neutral. Nevertheless, there will be an on-going fine-tuning of property market measures to avert any sharp appreciation of property prices. Although property stocks may be undermined, we do not think that this will have a significant impact on the equity market in general.
We remain cautious in the Taiwan market, on the back of the concern with the sustainability of Taiwan pension plans, as well as the structural weakness in its export sector. The potential collapse in confidence in the national pension funds possibly as a result of either a tax hike or a cut in pension payments would likely weigh negatively on domestic consumption growth and business sentiment. In addition, the global trend of weakening PC shipments will continue to negatively impact PC-related manufacturers in Taiwan. However, investment opportunities exist in companies that could benefit from the commoditization trend in smart-device components.
Source: RCM Asia Pacific Limited as at February 28, 2013.
4
The China Fund, Inc. (CHN)
Portfolio Holdings
|
CUSIP
|
Security Description
|
Cost Base
|
Base MV
|
Shares
|
Percentage of Net Assets
|
|||||||
|
688910900
|
Taiwan Semiconductor Manufacturing Co., Ltd.
|
16,072,089.00 | 21,430,839.00 | 6,084,000 | 5.7 | |||||||
|
B1G1QD902
|
Industrial & Commercial Bank of China
|
20,739,449.00 | 21,425,536.00 | 29,829,000 | 5.7 | |||||||
|
B3VN92906
|
HAND Enterprise Solutions Co., Ltd.
|
1,793,493.00 | 21,142,625.00 | 6,369,715 | 5.7 | |||||||
|
685992000
|
Sun Hung Kai Properties, Ltd.
|
17,289,798.00 | 19,604,521.00 | 1,269,000 | 5.2 | |||||||
|
663094902
|
China Everbright International, Ltd.
|
12,183,629.00 | 17,786,335.00 | 26,730,000 | 4.7 | |||||||
|
607355906
|
China Mobile, Ltd.
|
12,606,802.00 | 13,116,182.00 | 1,191,000 | 3.5 | |||||||
|
635186901
|
Digital China Holdings, Ltd.
|
13,205,899.00 | 11,396,785.00 | 7,256,000 | 3.0 | |||||||
|
633393905
|
Enn Energy Holdings, Ltd.
|
606,420.00 | 10,970,759.00 | 2,204,000 | 2.9 | |||||||
|
B6WY99909
|
China Medical System Holdings, Ltd.
|
853,792.00 | 10,684,174.00 | 11,669,300 | 2.9 | |||||||
|
913BMZ902
|
Ping An Insurance (Group) Company of China, Ltd. Access Product (expiration 04/01/13)
|
9,494,980.00 | 10,632,091.00 | 1,418,047 | 2.8 | |||||||
|
619376908
|
China Resources Land, Ltd.
|
5,946,869.00 | 10,058,120.00 | 3,436,000 | 2.7 | |||||||
|
674842901
|
Ruentex Development Co., Ltd.
|
3,423,335.00 | 9,661,333.00 | 4,416,301 | 2.6 | |||||||
|
B01CT3905
|
Tencent Holdings, Ltd.
|
7,312,795.00 | 9,071,672.00 | 262,100 | 2.4 | |||||||
|
644094906
|
Taiwan FamilyMart Co., Ltd.
|
1,631,072.00 | 8,741,983.00 | 1,942,652 | 2.3 | |||||||
|
17313A533
|
Gree Electric Appliances, Inc. Access Product (expiration 01/17/14)
|
6,453,442.00 | 8,506,953.00 | 1,838,546 | 2.3 | |||||||
|
B00G0S903
|
CNOOC, Ltd.
|
8,859,687.00 | 8,320,076.00 | 4,228,000 | 2.2 | |||||||
|
B2R2ZC908
|
CSR Corp., Ltd.
|
7,466,210.00 | 8,092,899.00 | 9,930,000 | 2.2 | |||||||
|
671815900
|
Qingling Motors Co., Ltd.
|
8,718,221.00 | 7,954,556.00 | 28,960,000 | 2.1 | |||||||
|
B1YMYT902
|
Hiwin Technologies Corp.
|
9,693,067.00 | 7,785,676.00 | 942,750 | 2.1 | |||||||
|
643648900
|
Shenzhen International Holdings, Ltd.
|
3,288,964.00 | 7,694,319.00 | 54,242,500 | 2.0 | |||||||
|
670039007
|
Uni-President Enterprises Corp.
|
1,090,258.00 | 6,861,163.00 | 3,667,508 | 1.8 | |||||||
|
959GRNII9
|
Taiwan Life Insurance Co., Ltd., 4.0%, 12/28/14
|
6,178,274.00 | 6,685,548.00 | 200,000,000 | 1.8 | |||||||
|
B15456906
|
Bank of China, Ltd.
|
6,465,433.00 | 6,513,065.00 | 13,762,000 | 1.7 | |||||||
|
634007900
|
Kunlun Energy Co., Ltd.
|
5,034,472.00 | 6,489,866.00 | 3,122,000 | 1.7 | |||||||
|
637248907
|
MediaTek Inc.
|
6,194,126.00 | 6,284,075.00 | 559,000 | 1.7 | |||||||
|
626073902
|
Delta Electronics, Inc.
|
4,550,608.00 | 6,015,455.00 | 1,615,000 | 1.6 | |||||||
|
620267906
|
Advantech Co., Ltd.
|
4,104,779.00 | 5,713,111.00 | 1,284,000 | 1.5 | |||||||
|
99ZMCS903
|
Kweichow Moutai Co., Ltd. Access Product (expiration 10/26/15)
|
7,383,669.00 | 5,707,557.00 | 204,751 | 1.5 | |||||||
|
986PLG005
|
Golden Meditech Holdings, Ltd. 15.0%, 11/16/13
|
5,557,209.00 | 5,555,167.00 |
58,222,500
|
^ | 1.5 | ||||||
|
986PLF007
|
Golden Meditech Holdings, Ltd. 15.0%, 05/16/13
|
5,557,209.00 | 5,555,166.00 |
58,222,500
|
^ | 1.5 | ||||||
|
626735906
|
Hong Kong Exchanges and Clearing, Ltd.
|
4,947,274.00 | 5,521,597.00 | 306,500 | 1.5 | |||||||
|
644806002
|
Hutchison Whampoa, Ltd.
|
4,088,916.00 | 4,883,625.00 | 453,000 | 1.3 | |||||||
|
B1L8PB906
|
Tong Hsing Electronic Industries Ltd
|
4,274,408.00 | 4,230,361.00 | 1,000,000 | 1.1 | |||||||
|
643055908
|
Golden Meditech Holdings, Ltd.
|
4,555,715.00 | 4,202,279.00 | 35,040,000 | 1.1 | |||||||
|
B633D9904
|
Zhongsheng Group Holdings, Ltd.
|
3,466,065.00 | 4,119,335.00 | 2,662,000 | 1.1 | |||||||
|
651795908
|
Natural Beauty Bio-Technology, Ltd.
|
4,906,910.00 | 3,999,084.00 | 47,710,000 | 1.1 | |||||||
|
B3ZVDV905
|
Sinopharm Group Co., Ltd.
|
2,527,529.00 | 3,821,372.00 | 1,212,000 | 1.0 | |||||||
|
613623909
|
Hengan International Group Co Ltd
|
3,889,897.00 | 3,801,171.00 | 375,500 | 1.0 | |||||||
|
600245005
|
ASM Pacific Technology, Ltd.
|
3,728,874.00 | 3,725,785.00 | 281,600 | 1.0 | |||||||
|
B236JB905
|
Tiangong International Co., Ltd.
|
3,744,634.00 | 3,693,051.00 | 12,616,000 | 1.0 | |||||||
|
665157905
|
Comba Telecom Systems Holdings, Ltd.
|
7,565,579.00 | 3,645,932.00 | 10,958,500 | 1.0 | |||||||
|
B1CKXF901
|
Zhengzhou Yutong Bus Co., Ltd. Access Product (expiration 01/20/15)
|
3,096,799.00 | 3,626,285.00 | 825,469 | 1.0 | |||||||
|
B60LZR903
|
Agricultural Bank of China Ltd
|
2,895,784.00 | 2,701,863.00 | 5,238,000 | 0.7 | |||||||
|
629099904
|
WT Microelectronics Co., Ltd.
|
1,579,112.00 | 1,613,899.00 | 1,335,530 | 0.4 | |||||||
|
B1TDQL904
|
Ping An Insurance (Group) Company of China, Ltd. Access Product (expiration 01/17/14)
|
1,566,145.00 | 1,573,830.00 | 209,900 | 0.4 | |||||||
|
B4PTR3906
|
Fook Woo Group Holdings, Ltd.
|
7,974,083.00 | 1,119,677.00 | 25,314,000 | 0.3 | |||||||
|
B04W2V905
|
FU JI Food and Catering Services Holdings Ltd.
|
4,246,696.00 | 0.00 | 5,462,000 | 0.0 | |||||||
|
ACI0090H8
|
Zong Su Foods (acquired 09/21/10)
|
15,000,034.00 | 0.00 | 2,677 | 0.0 | |||||||
^Nominal value owed in HK dollars.
Source: State Street Bank and Trust Company as at February 28, 2013.
5
The China Fund, Inc. (CHN)
The information contained herein has been obtained from sources believed to be reliable but RCM and its affiliates do not warrant the information to be accurate, complete or reliable. The opinions expressed herein are subject to change at any time and without notice. Past performance is not indicative of future results. This material is not intended as an offer or solicitation for the purchase or sale of any financial instrument. Investors should consider the investment objectives, risks, charges and expenses of any mutual fund carefully before investing. This and other information is contained in the fund’s annual and semiannual reports, proxy statement and other fund information, which may be obtained by contacting your financial advisor or visiting the fund’s website at www.chinafundinc.com. This information is unaudited and is intended for informational purposes only. It is presented only to provide information on investment strategies and opportunities. The Fund seeks to achieve its objective through investment in the equity securities of companies and other entities with significant assets, investments, production activities, trading or other business interests in China or which derive a significant part of their revenue from China. Investing in non-U.S. securities entails additional risks, including political and economic risk and the risk of currency fluctuations, as well as lower liquidity. These risks, which can result in greater price volatility, will generally be enhanced in less diversified funds that concentrate investments in a particular geographic region. The Fund is a closed-end exchange traded management investment company. This material is presented only to provide information and is not intended for trading purposes. Closed-end funds, unlike open-end funds, are not continuously offered. After the initial public offering, shares are sold on the open market through a stock exchange, where shares may trade at a premium or a discount. Holdings are subject to change daily.