Attached files
| file | filename |
|---|---|
| 8-K - FORM 8-K - DESTINATION XL GROUP, INC. | d508160d8k.htm |
 1
Exhibit 99.1
Destination XL Group, Inc. |
 Certain
information contained in this presentation, including, but not limited to, cash flows,
operating margins, store counts, earnings expectations for fiscal 2012 and estimates through
fiscal 2016, constitute forward-looking statements under the federal securities
laws. The discussion of forward-looking information requires management of the
Company to make certain estimates and assumptions regarding the Company's strategic
direction and the effect of such plans on the Company's financial results. Such
forward-looking statements are subject to various risks and uncertainties that
could cause actual results to differ materially from those indicated.
Such
risks
and
uncertainties
may
include,
but
are
not
limited
to:
the
failure
to
implement the Company's business plan for increased profitability and growth in the
Company's retail stores sales and direct-to-consumer business, the failure to achieve
improvement
in
the
Company's
competitive
position,
changes
in
or
miscalculation
of
fashion
trends, extreme or unseasonable weather conditions, economic downturns, a weakness in
overall
consumer
demand,
trade
and
security
restrictions
and
political
or
financial
instability
in
countries where goods are manufactured, increases in raw material costs from inflation and
other factors, the interruption of merchandise flow from the Company's distribution
facility, competitive pressures, and the adverse effects of natural disasters, war,
acts of terrorism or threats
of
either,
or
other
armed
conflict,
on
the
United
States
and
international
economies.
These, and other risks and uncertainties, are detailed in the Company's Annual Report on Form
10-K filed with the Securities and Exchange Commission for the fiscal year ended
February 2, 2013 filed on March 15, 2013 and other Company filings with the Securities
and Exchange Commission.
Destination
XL
Group,
Inc.
assumes
no
duty
to
update
or
revise
its
forward-
looking statements even if experience or future changes make it clear that any projected
results expressed or implied therein will not be realized.
2
Safe Harbor |
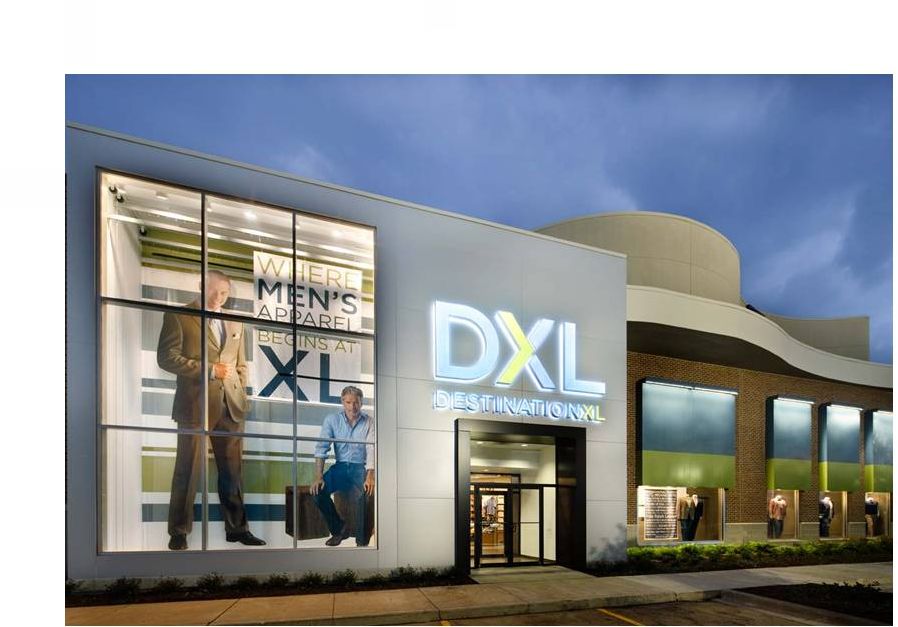
 Who
is Destination XL Group, Inc.? 3
Largest multi-channel specialty
retailer in niche men’s big and
tall (B&T) market
Offering unique blend
of wardrobe solutions
Private label & leading
apparel name brands |
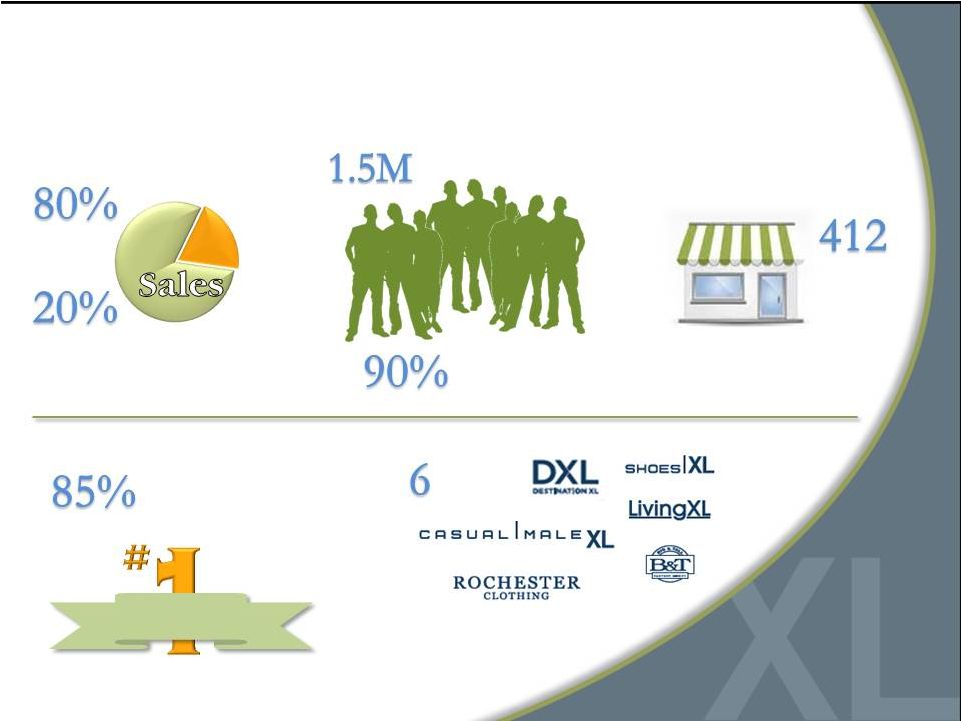 DXLG by the Numbers
4
Active customers
Enrolled in loyalty program
Highest rated retailer
in 2011 CSI
Customer Survey
Retail
Direct
Retail Stores
Brands
Customer
Satisfaction |
 Who
is Our Customer? 5
Males with a waist size 40”
and
greater (40M men).
Determined by physical
characteristic, not demographic.
Not dependent on age, income,
race or nationality
Seeking greater selection in size.
Values convenience, selection
and fit over price. |
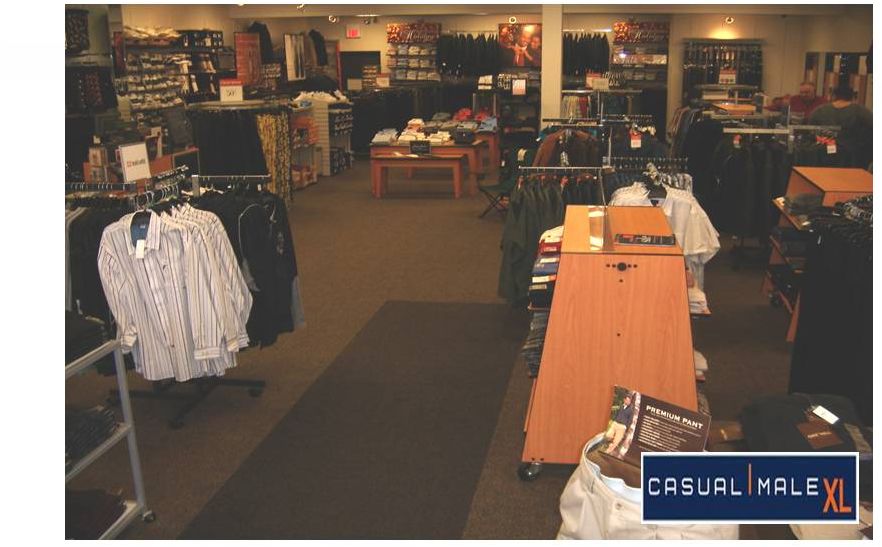 6
Our Current Casual Male XL Stores |
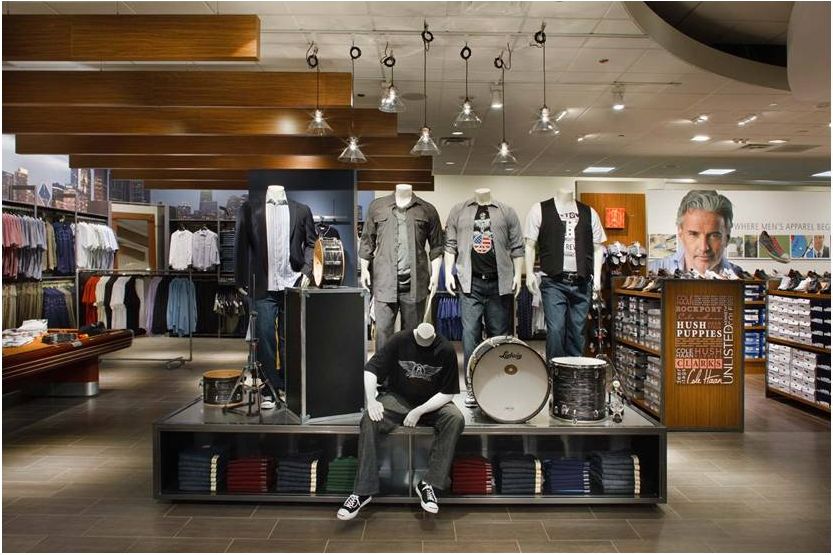
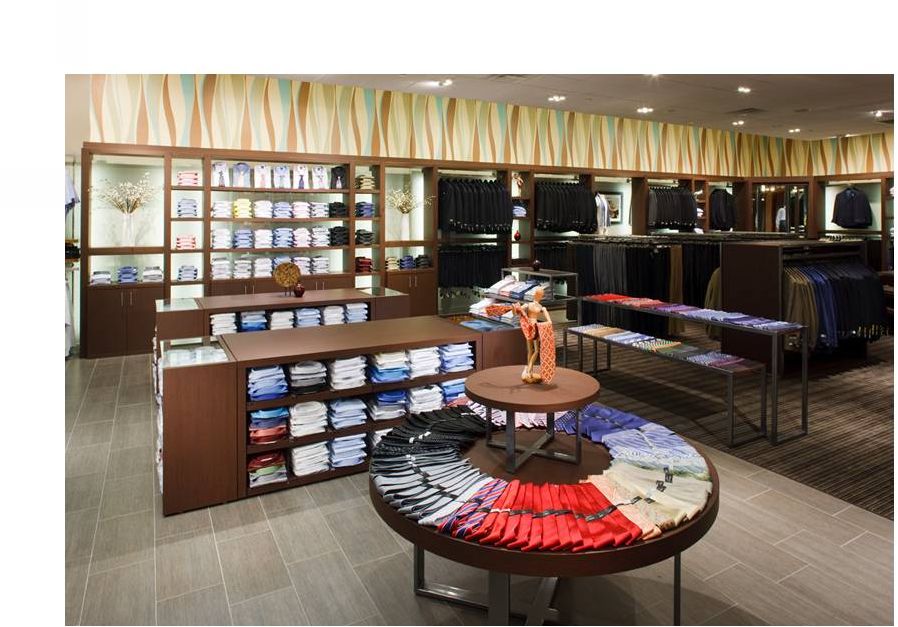
 7
What Our Customer Wants
Large
changing
rooms
More brand
selections
On-site
tailoring
Bright
atmosphere
Suggested
wardrobe
solutions
Wide aisles
One-stop
shopping |
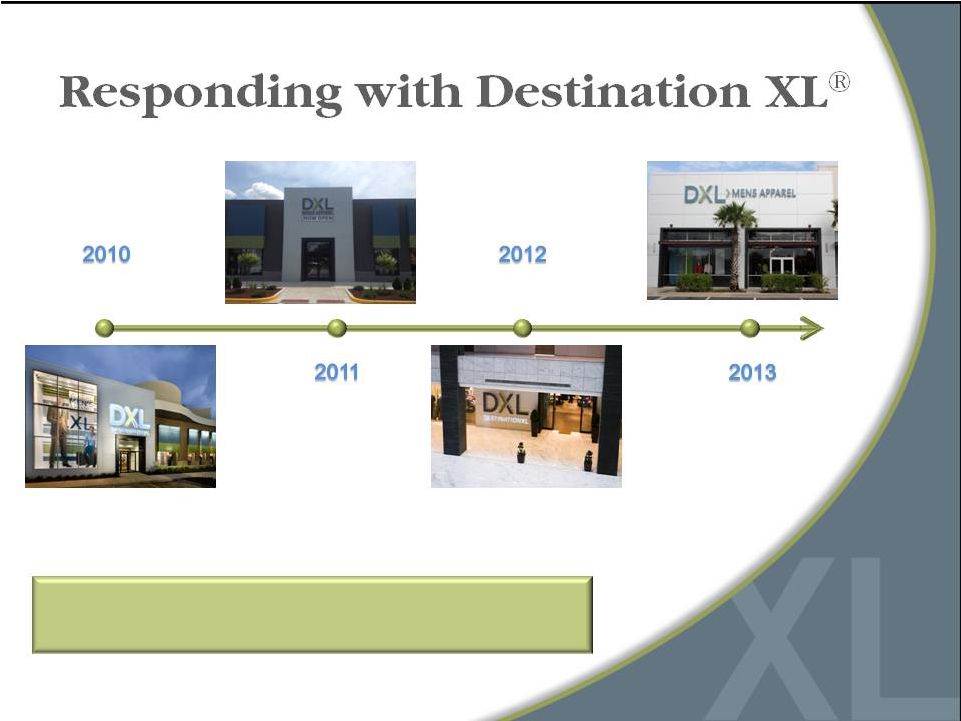 8
Opened 4 DXL
concept stores
Opened 32
DXL stores
Opened 12
DXL stores
Opportunity for accelerated growth and profitability
Expect to Open
~60 DXL stores |
 9
*
*
*
* |
 10
|
 11
*
*
*
*
**** |
 12
*
*
*
* |
 13
* |
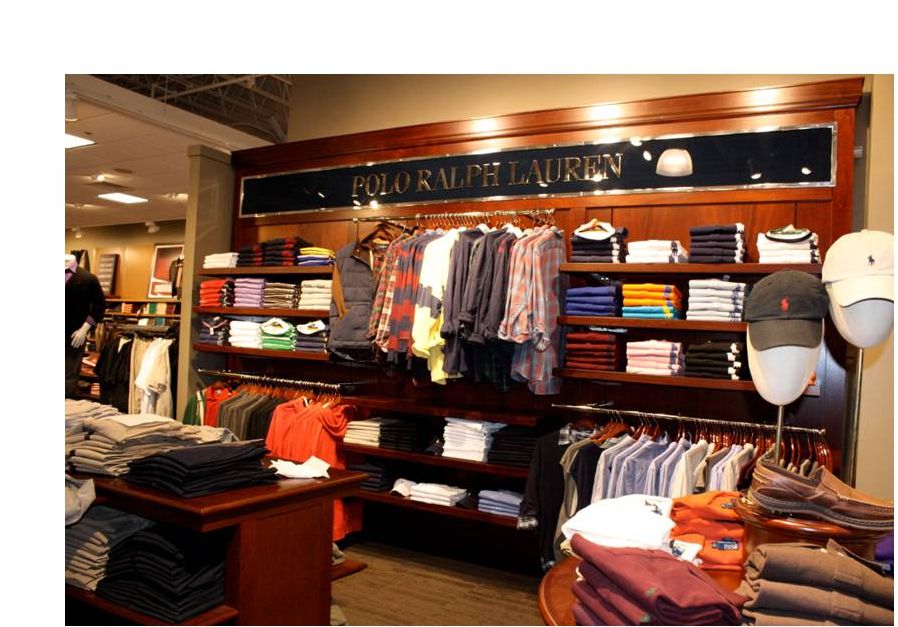
 14
Large Selection of Name Brands |
 15
Average
Store size
3,600 sq. ft.
8,400 sq. ft.
Sales per sq. ft.
$172
$147 ($230 by 2016)
Build out costs
$50
$70
Occupancy costs
$30
$30
Dollars per
transaction
$97
$137
Style choices
600
2,000
Private label brands
10
15
Name brands
8
30 |
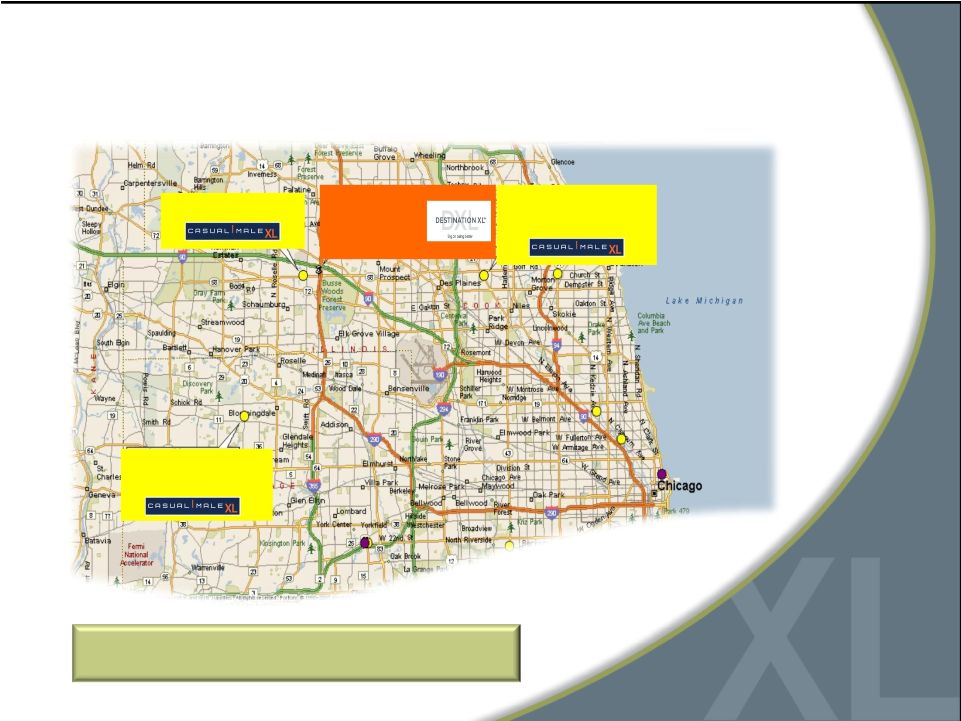 9451 Schaumburg, IL
9183 Niles, IL
11.4 miles
9512 Bloomingdale, IL
11.2 miles
Market Consolidation to DXL
Chicago Metro
Customers are willing to drive up to 20 miles
DXL
Schaumburg, IL
0.9 miles
16 |
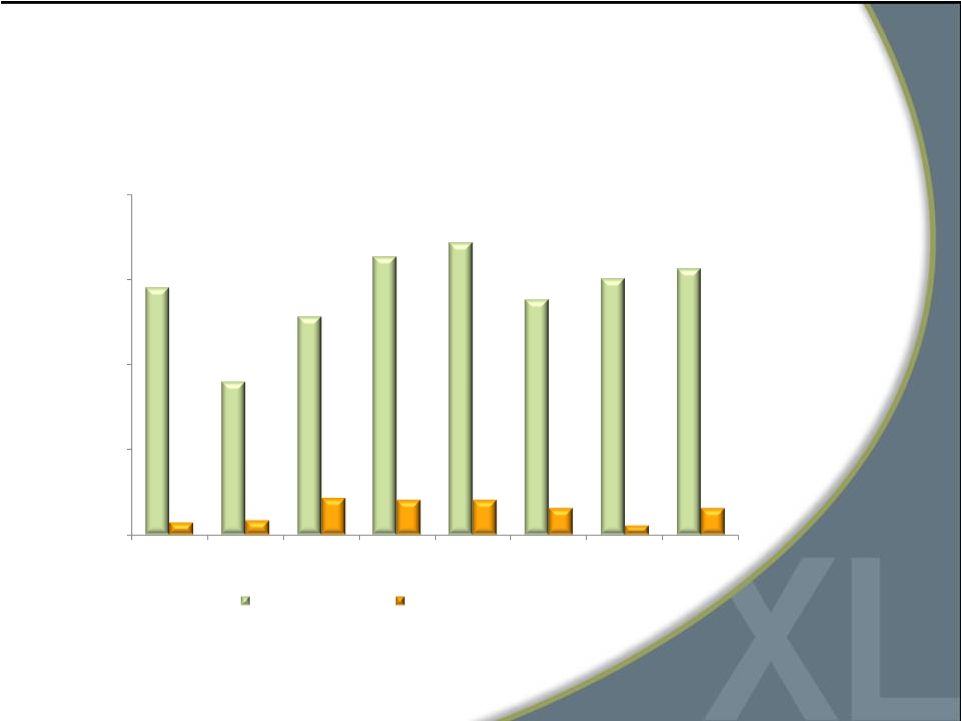 17
DXL Comps Reflect Growth Opportunity
** Total DXLG Comparables consist of all stores, including DXL stores and
direct channel
* The 16 DXL stores opened for more than 1 year produced a 7.6% comp in Q4
2012 20.0%
15.0%
10.0%
5.0%
0.0%
14.5%
0.7%
9.0%
0.8%
2.1%
2.0%
2.0%
1.5%
0.5%
1.5%
12.8%
16.3%
17.1%
13.8%
15.0%
*
15.6%
Q3 2011
Q4 2011
FY 2011
FY 2012
Q1 2012
Q2 2012
Q3 2012
Q4 2012
DXL Comparables
Total DXLG Comparables** |
 18
Compelling DXL Returns
Expect greater store productivity
Better leveraging of expenses --
occupancy, labor productivity and
local/district management
Projecting higher 4-wall profits than
combined profits of individual stores
Targeting between 25%-30% store
operating margin
Potential to capture additional
market share
Attract new customers
Better cross-selling environment to
capture greater share of apparel
wallet from existing customers
Opportunity to improve
operating margins
Expect to increase margins
significantly after the transition to
DXL is complete
and profitability |
 19
Accelerated DXL Openings
2015 Store Count Target
Destination XL
®
215-230
Casual Male XL
Outlet
~60
Rochester Clothing
3-4
Accelerated rollout based on
success of DXL stores in 2011
500
450
400
350
300
250
200
150
100
50
0
2010
2011
2012
2013
2014
2015
Total Stores:
(460)
(450) (412)
(348-358) (308-318) (283-298) |
 20
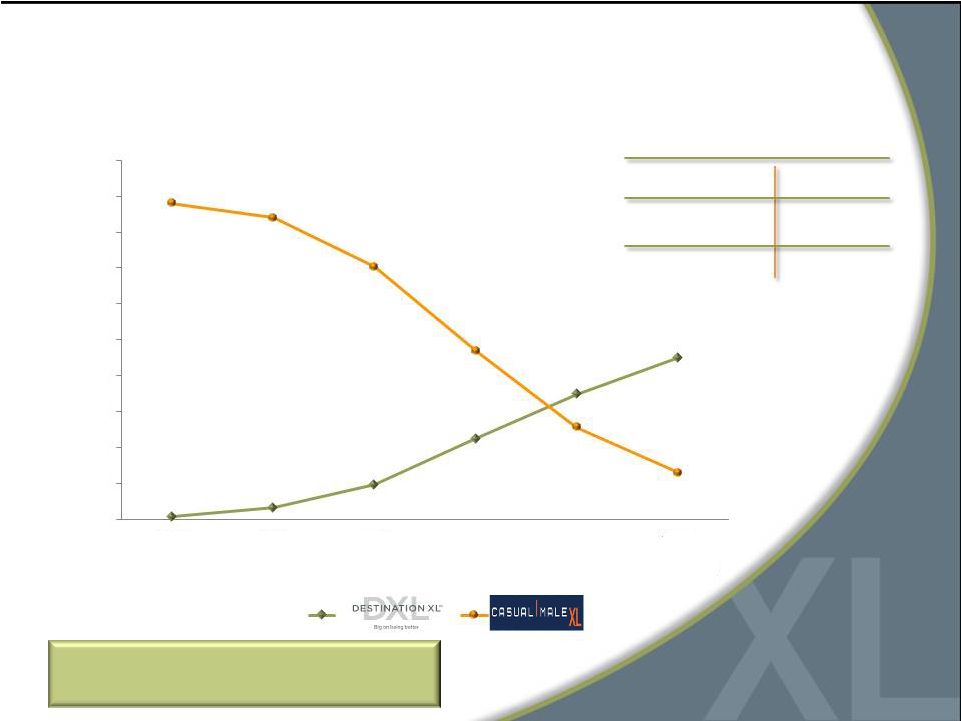
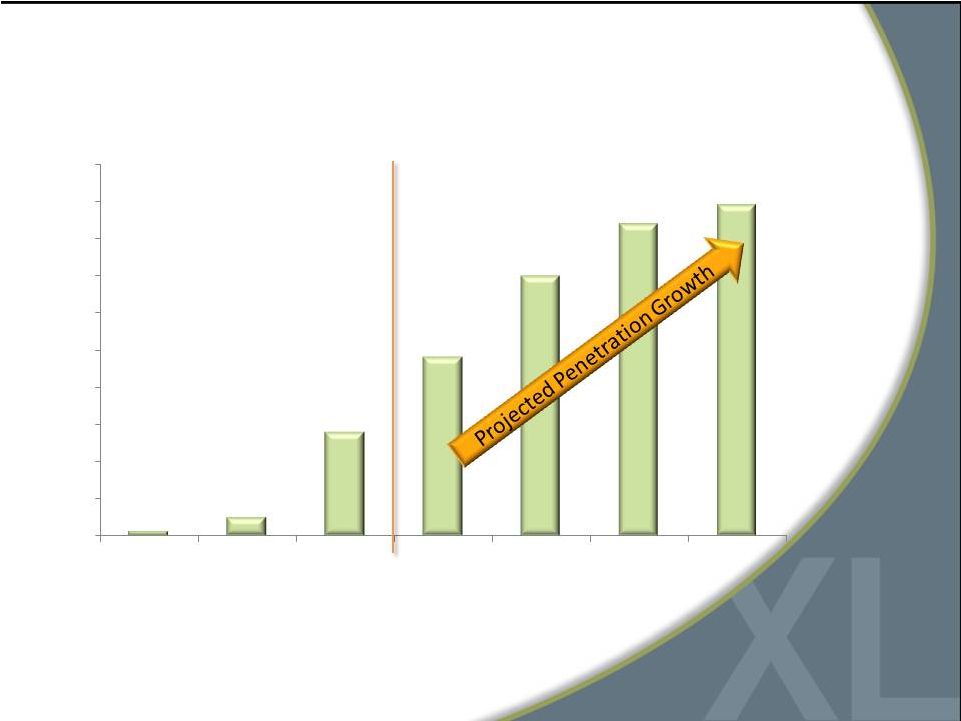
DXL Sales Increase as % of Total Revenue
* DXL sales include direct sales via the DestinationXL.com website.
2010
2011
2012
2013
2014
2015
2016
0%
10%
20%
30%
40%
50%
60%
70%
80%
90%
100%
1%
5%
28%
48%
70%
84%
89% |
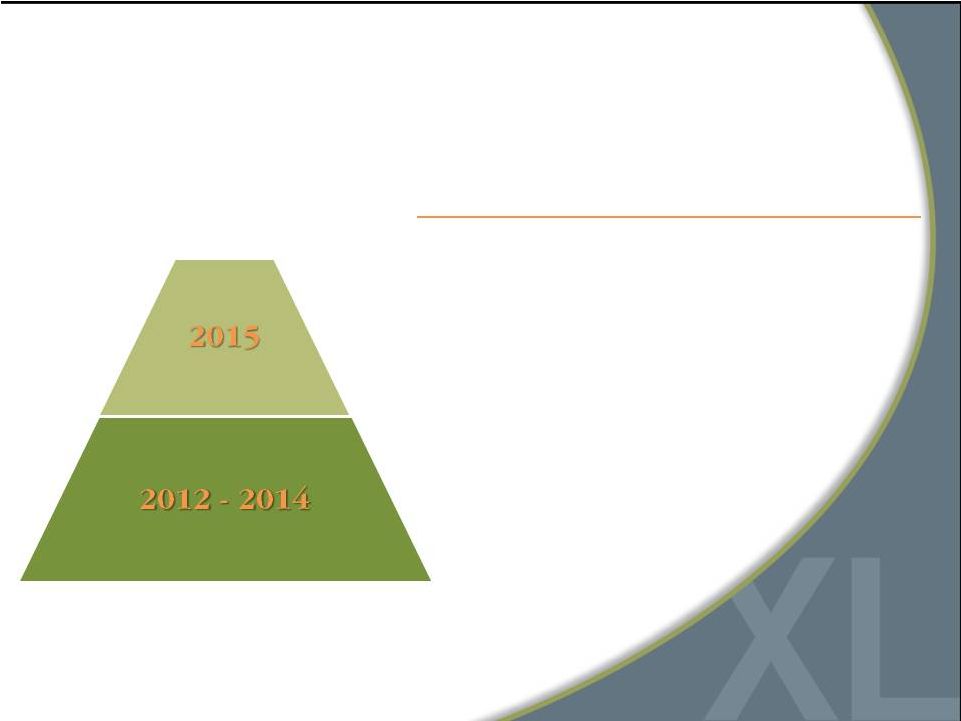
 21
2012
Opened
32
DXL
stores
/
Closed
70
stores
Operating
margins
were
approximately
3.5%
CapEx
was
$32.4M
Accelerated Rollout of DXL |
 22
2013
Open
57-
64
DXL
stores
/
Close
110-119
stores
Sales
of
$415
-
$420M
Expected
borrowing
level
of
$10
-
$15M
at
year
end
Commence
new
marketing
strategy
with
incremental
$10M
spend
Lease
exit
and
asset
impairment
charges
in
the
range
of
$3-$4M
Operating
margins
of
~
breakeven
to
0.5%
CapEx
expected
to
peak
at
$45M
2014
Open
60
DXL
stores
/
Close
99
stores
Annual
sales
growth
of
~
10%
-
15%
Expected
borrowing
level
of
$10
-
$15M
at
year
end
Lease
exit
and
asset
impairment
charges
in
the
range
of
$3-$4M
Operating
margins
of
~4%
CapEx
expected
to
be
$40M
Accelerated Rollout of DXL
1
Net of subleases
2
Net of expected tenant allowances
1
2
1 |
 23
2015
Complete
rollout
with
215
-
230
opened
DXL
stores
and
Closure
of
remaining
63
Casual
Male
XL
anchor
stores
Annual
sales
growth
of
~10%
–
15%
Operating margins gain traction and increase to ~8%
(from 4.2% in ‘11)
Expected
ending
cash
balance
of
$5
-
$10M
CapEx
expected
to
be
approximately
$38M
Lease exit and asset impairment charges in the range
of $2-$3M
Accelerated Rollout of DXL
1
Net of subleases
2
Net of expected tenant allowances
1
2 |
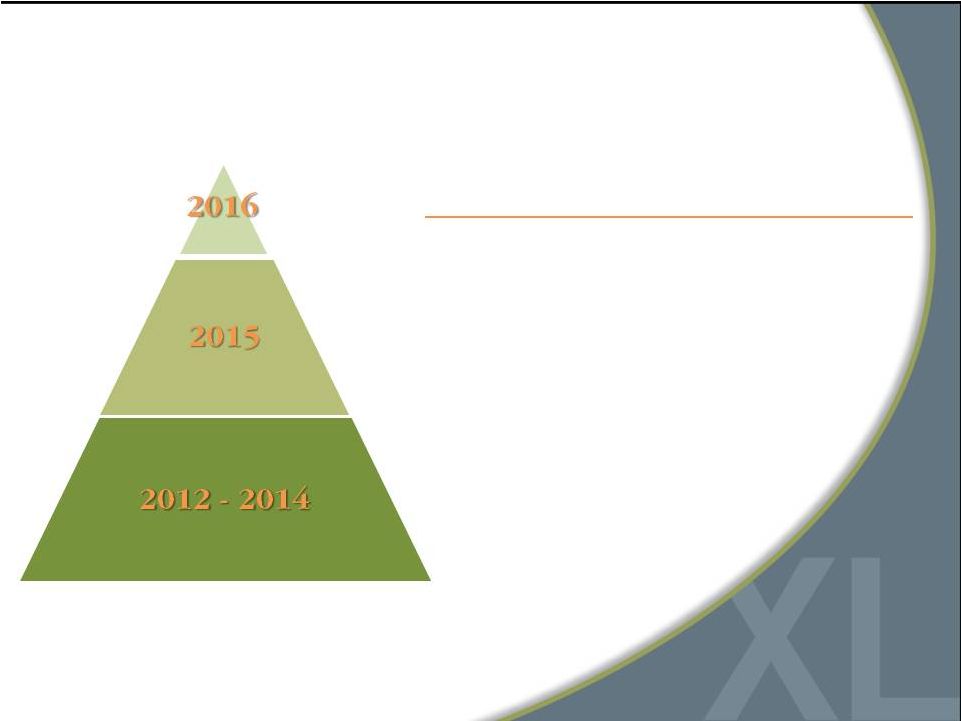 24
2016
Full
benefit
of
DXL
concept
drives
revenue
>$600M
Open
average
of
10
DXL
stores
per
year
Operating
margins
>10%
Accelerated Rollout of DXL
Generating
free
cash
flow
in
the
range
of
$60
-
$70M
|
 25
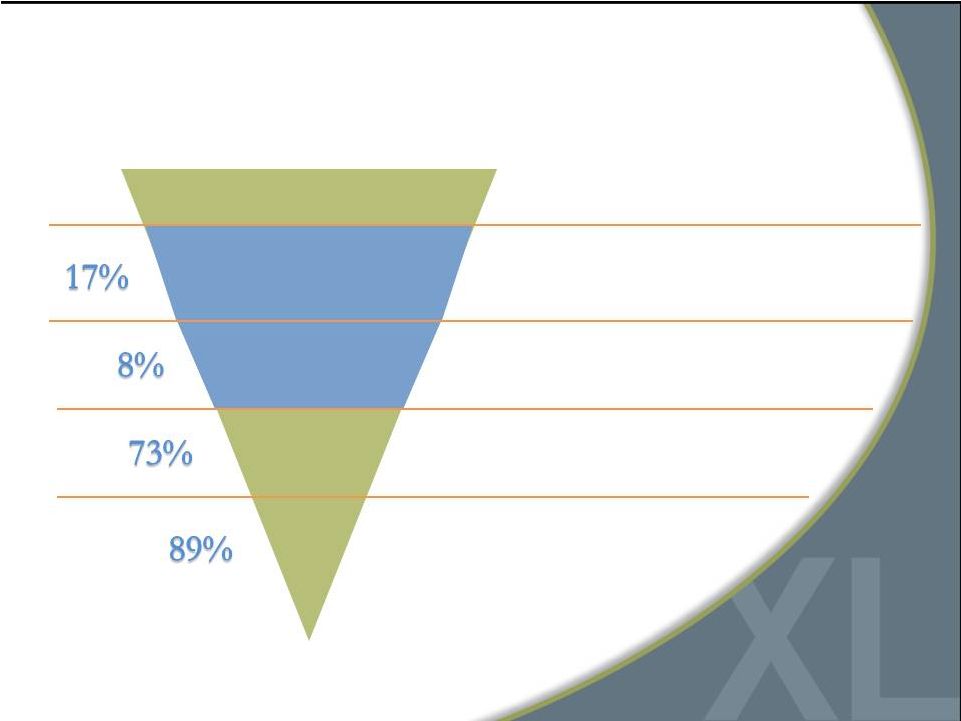
Increased Awareness = Opportunity
DXL Customer Purchase Funnel*
Addressable Population
Aware of DXL
Visiting DXL
Purchasing
from DXL
Repeat
DXL’s
addressable
market
is
primarily
men
with
over
40”
waist
Awareness of DXL is low across its markets, directly impacting
ability to attract new customers
Of those aware of DXL, only 8% are visiting the store
73% of those that visit the store make a purchase
89% of those that make a purchase
intend to return
*Based on consumers’
stated responses per L.E.K’s survey within DXL markets
Source: L.E.K analysis |
 26
Grow direct
business with new website
Paradigm shift in marketing improves awareness
Target “end-of-rack”
customers
Attract
a
broader
customer
audience
with
one-stop-shop
Capture greater wallet share with DXL concept
Opportunity to Grow Market Share
Addressable Market = 40M Customers
1.5M Currently Active Customers
Goal = Grow Customers by 40% Over 3 Years |
 27
Increased awareness by 100%
in new markets & 38% in
established markets
“End-of-rack”
customer
base grew by 38%
Launched test campaign in 5 markets:
Memphis, Minneapolis, Denver, Atlanta and Oklahoma City
Built Stronger Brand
to Attract and Serve
Customers
Results Demonstrate
Ability to Grow
Market Share |
 28
Established Effective Marketing Mix
15% sales
24% traffic
64% new customer purchases
84% web traffic
7% web sales
38% market awareness
Established Market
Memphis DXL Opened in 2010
6-Week Test Demonstrated TV, Radio and Digital is
Most Effective Marketing Combination |
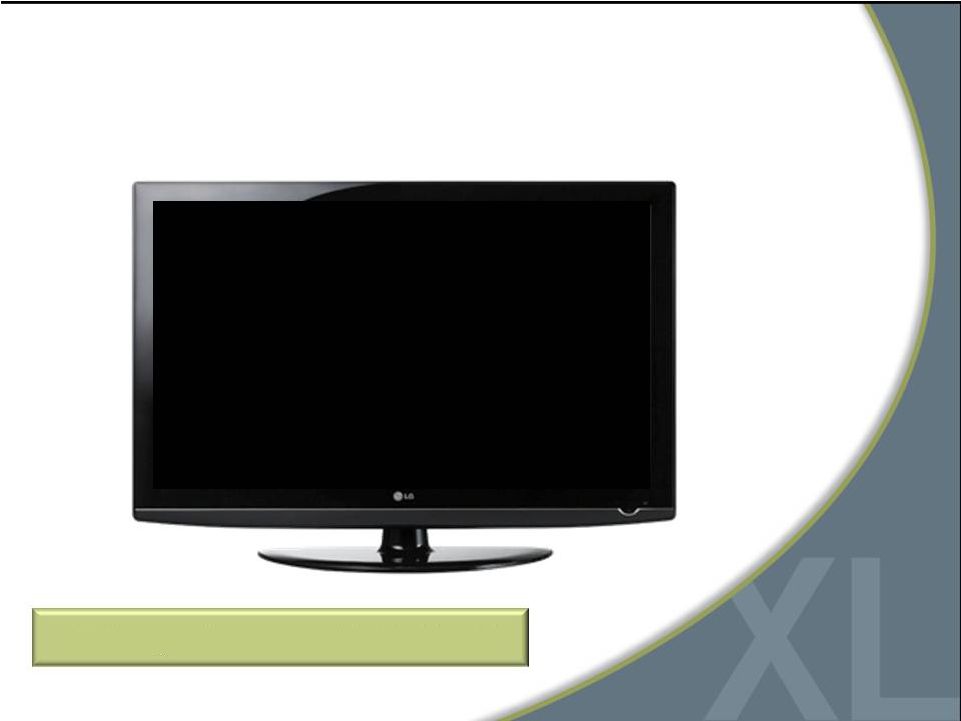 29
DXL Test TV Commercial
Marketing to Customers in “No Man’s Land”
|
 •
Increase marketing spend as percent of sales from 4.6% to 6.7%
•
Launch national DXL Media marketing campaign in spring 2013
2013 Marketing Spend
$M
Total 50% Increase YOY
to Drive DXL Awareness
30
DXL Media
Direct
Digital
Visual
Loyalty
Other
2012
2013
0
10
20 |
 Financial Performance
31 |
 Q4
2012 Results •
Comparable sales increased 0.5% and total sales were $114.9M
•
DXL stores represented 18% of comparable retail sales
•
Comp sales for Casual Male XL stores decreased 2.3%
•
U.S. direct e-commerce sales increased 13%
•
Income from continuing operations was $4.2 million,
or $0.09 per diluted share
32 |
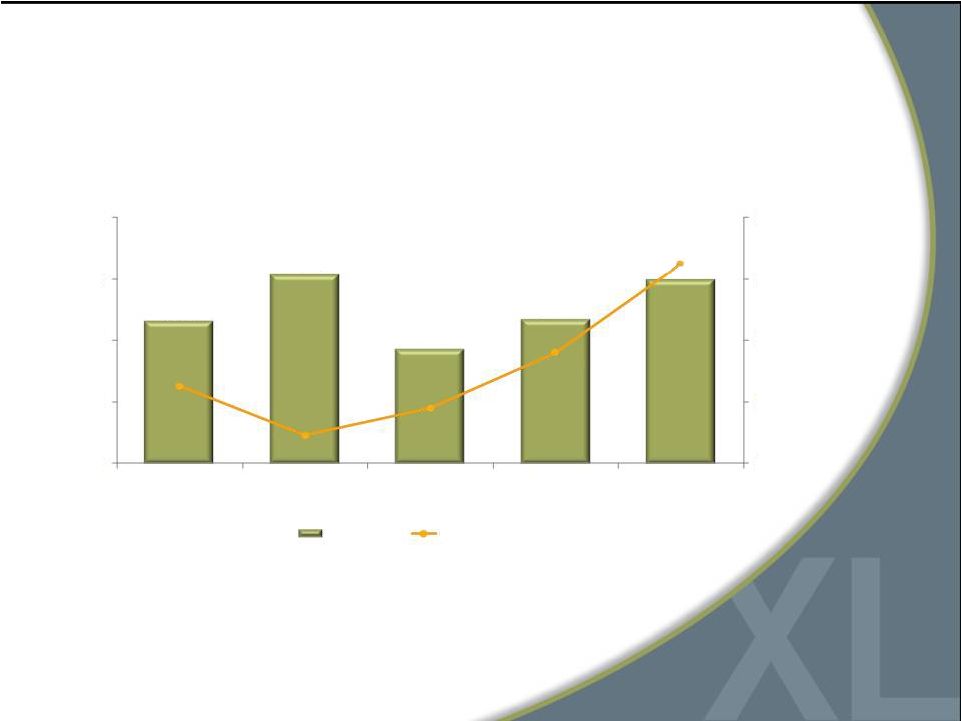
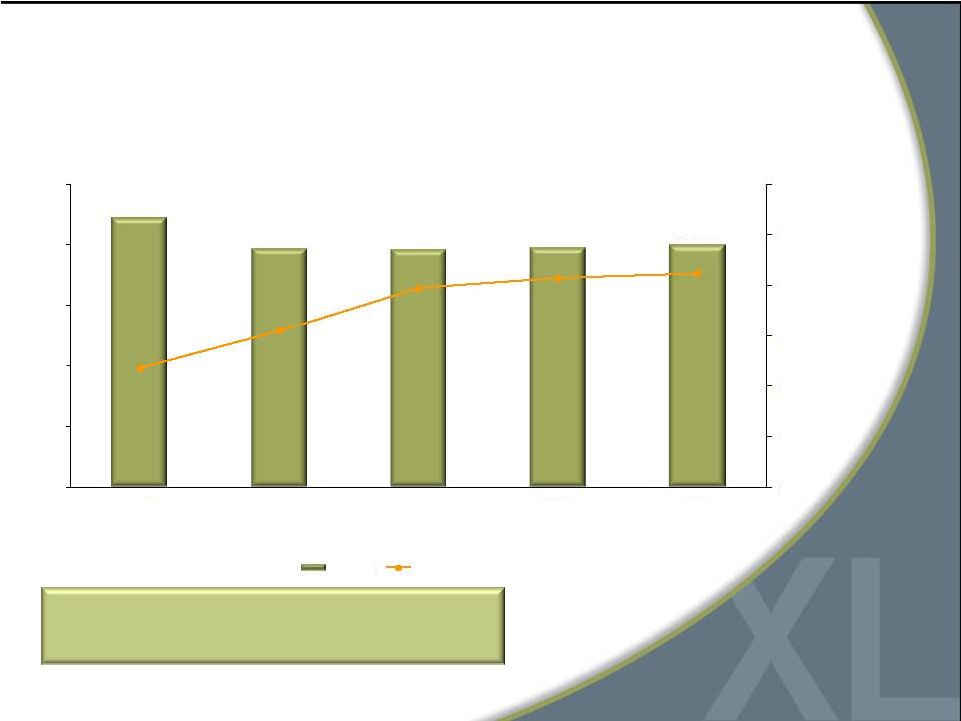 33
Sales and Gross Margin
Strong gross margins provide opportunity for
significant sales leverage
Revenue ($ mm)
$500
$400
$300
$200
$100
$0
2008
2009
2010
2011
2012
$443.9
$393.9
$392.0
$395.9
$399.6
42.7%
44.2%
45.9%
46.3%
46.5%
50%
48%
46%
44%
42%
40%
38%
Revenue
Gross Margin |
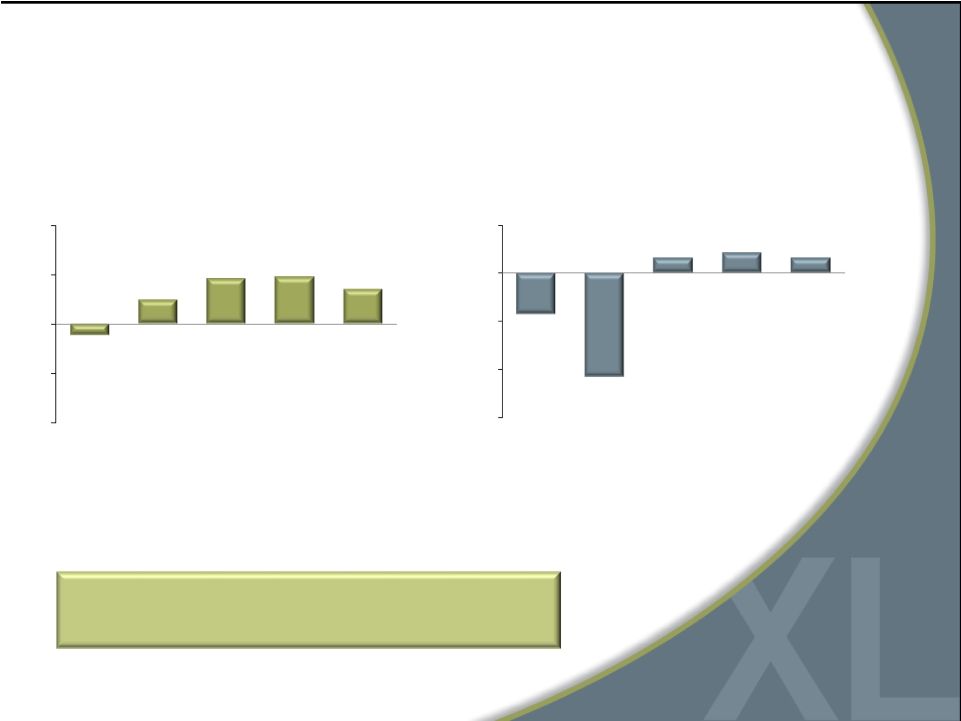 34
* Before impairment charge of $23.1m
Operating Margin & Comparable Sales
(continuing operations)
Focus on improving operating margins
through greater DXL sales
CMRG Annual Historic Operating Margin
10%
(10%)
(5%)
5%
0%
2008
2009
2010
2011*
2012
5%
(15%)
(10%)
0%
(5%)
2008
2009
2010
2011
2012
CMRG Historical Annual Comp Sales
2.4%
4.6%
4.7%
3.5%
(1.1)%
(10.8)%
1.5%
2.1%
1.5%
(4.3)% |
 35
Strict Expense Management
39.9%
37.9%
37.9%
38.4%
39.1%
($ mm)
Marketing Expense
Total SG&A
SG&A as a Percentage of Sales
$0
$50
$100
$150
$200
$177.3
$149.2
$148.4
$152.0
$156.4
30%
33%
36%
39%
42%
45%
2008
2009
2010
2011
2012
$34.1
$19.1
$19.0
$19.6
$18.5 |
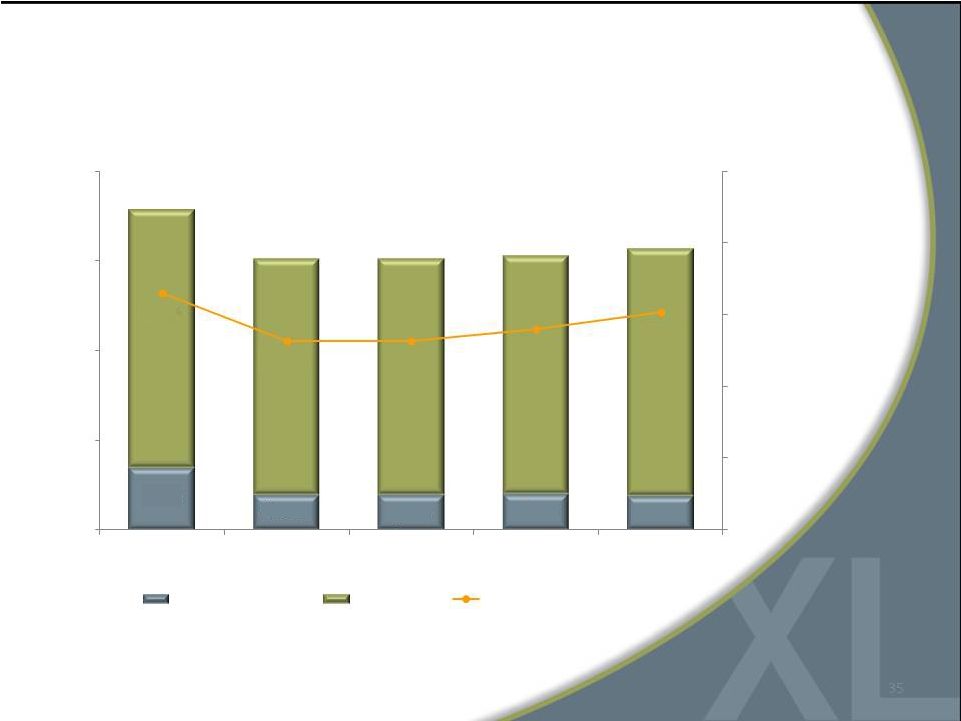
 2008
2009
2010
2011
2012
$98.6M
$90.0M
$92.9M
$104.2M
$104.2M
$38.7M
$3.5M
$0
$0
$0
$5.0
$4.3
$4.1M
$10.4M
$8.2M
$12.5M
$7.6M
$0
$0
$0
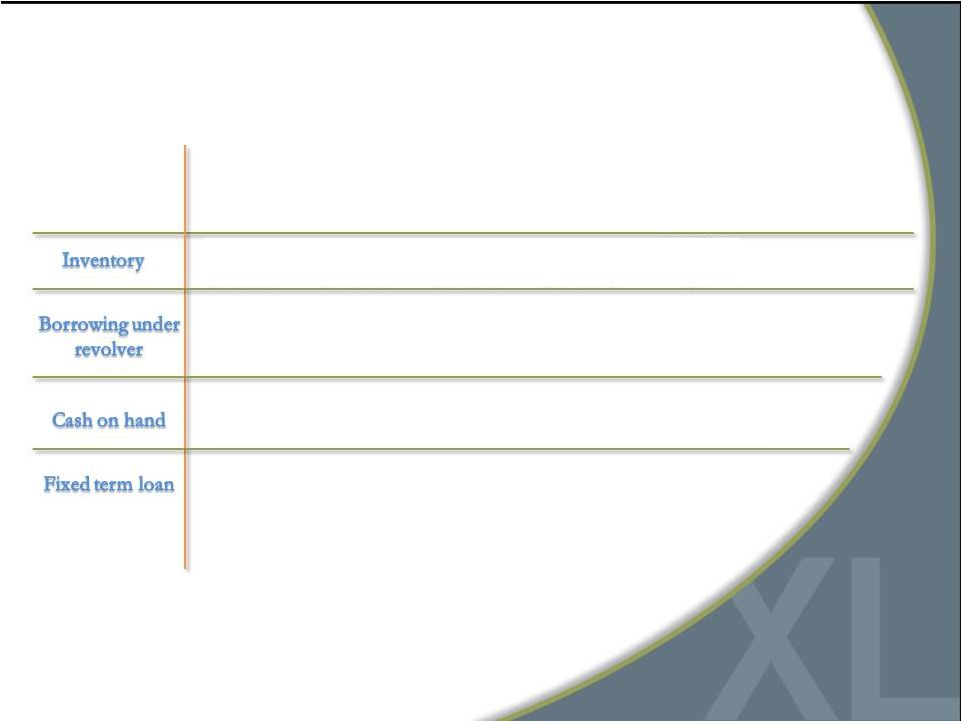
36
Strong Debt-Free Balance Sheet |
 37
Cash Flow and Capital Expenditures
$40
$30
$20
$10
$0
$23.2
$30.8
$7.6
$23.4
$29.9
$32.4
$40
$30
$20
$10
$0
2008
2009
2010
2011
2012
($ mm)
CAPEX
Cash Flow
$12.6
$4.6
$9.0
$18.0 |
 38
Why Invest in DXLG?
Accelerated conversion to DXL
concept creates compelling
investment opportunity
Strong gross margins; Ability
to greatly improve operating
margins
Significant market share/sales
growth opportunity
Leader in large and growing
B&T
market
Three-year $150M investment
in DXL rollout to be funded
primarily by free cash flow
and deferred tax benefits
Strong balance sheet
with borrowing capacity |
 For additional information:
Jeffrey Unger
Destination XL Group, Inc.
V. P. Investor Relations
561-482-9715 Office
561-543-9806 Cell
jeffunger@usa.net
www.destinationxl.com
39 |