Attached files
| file | filename |
|---|---|
| 8-K - FORM 8-K - UNIFI INC | unifi_8k-031813.htm |

Seventeenth Annual Emerging GrowthInstitutional Investor ForumMarch 18-19, 2013
Cautionary Statement
Certain statements included herein contain forward-looking statements within the meaning of federal securities laws about the financial condition and results of operations of Unifi, Inc. (the “Company”) that are based on management’s current expectations, estimates and projections about the markets in which the Company operates, as well as management's beliefs and assumptions. Words such as "expects," "anticipates," "believes," "estimates," variations of such words and other similar expressions are intended to identify such forward-looking statements. In addition, forward-looking statements include information about the Company’s future business strategy. These statements are not guarantees of future performance and involve certain risks, uncertainties and assumptions, which are difficult to predict. Therefore, actual outcomes and results may differ materially from what is expressed or forecasted in, or implied by, such forward-looking statements. Readers are cautioned not to place undue reliance on these forward-looking statements, which reflect management's judgment only as of the date hereof. The Company undertakes no obligation to update publicly any of these forward-looking statements to reflect new information, future events or otherwise.Factors that may cause actual outcome and results to differ materially from those expressed in, or implied by, these forward-looking statements include, but are not necessarily limited to, availability, sourcing and pricing of raw materials, the success of our subsidiaries, pressures on sales prices and volumes due to competition and economic conditions, reliance on and financial viability of significant customers, operating performance of subsidiaries, joint ventures, alliances and other equity investments, technological advancements, employee relations, changes in construction spending, capital expenditures and long-term investments (including those related to unforeseen acquisition opportunities), continued availability of financial resources through financing arrangements and operations, market price of the Company’s stock, restrictions imposed by the Company’s credit facility, outcomes of pending or threatened legal proceedings, negotiations of new or modifications of existing contracts for asset management and for property construction and acquisition, regulations governing tax laws, other governmental and authoritative bodies' policies and legislation, and proceeds received from the sale of assets held for disposal. In addition to these representative factors, forward-looking statements could be impacted by general domestic and international economic and industry conditions in the markets where the Company competes, such as changes in currency exchange rates, interest and inflation rates, recession and other economic and political factors over which the Company has no control. Other risks and uncertainties may be described from time to time in the Company’s other reports and filings with the Securities and Exchange Commission.
|
|
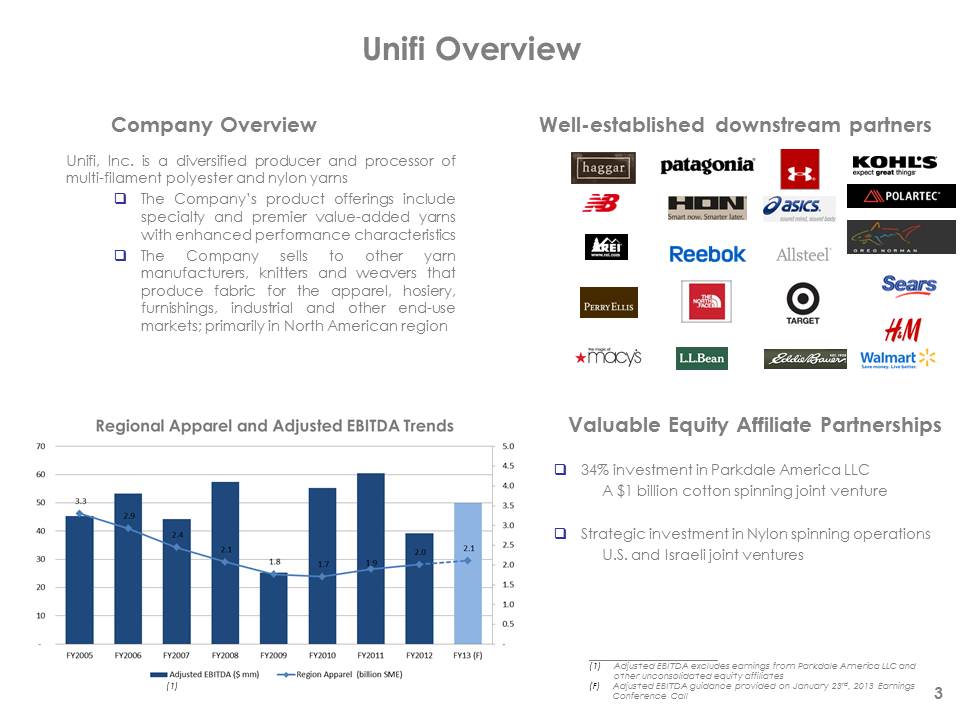
Company Overview
|
Unifi, Inc. is a diversified producer and processor of multi-filament polyester and nylon yarns
|
q
|
The Company’s product offerings include specialty and premier value-added yarns with enhanced performance characteristics
|
|
q
|
The Company sells to other yarn manufacturers, knitters and weavers that produce fabric for the apparel, hosiery, furnishings, industrial and other end-use markets; primarily in North American region
|
Well-established downstream partners
|
|
Valuable Equity Affiliate Partnerships
|
|
q
|
34% investment in Parkdale America LLC
|
A $1 billion cotton spinning joint venture
|
q
|
Strategic investment in Nylon spinning operations
|
U.S. and Israeli joint ventures

Market and Company Overview
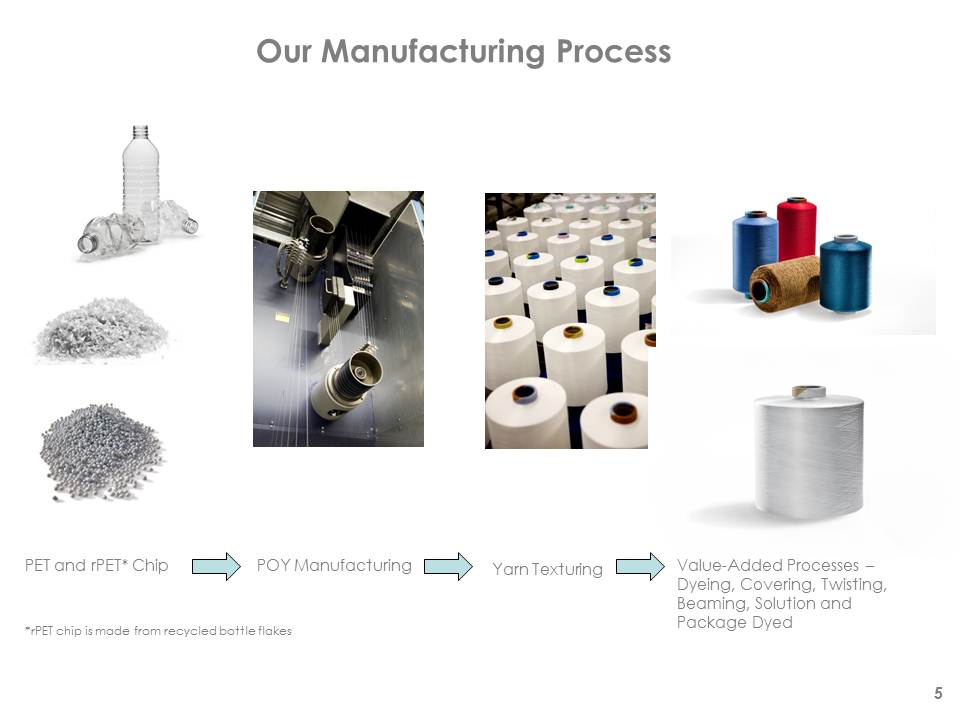
Our Manufacturing Process
PET and rPET* Chip
POY Manufacturing
Yarn Texturing
Value-Added Processes – Dyeing, Covering, Twisting, Beaming, Solution and Package Dyed
*rPET chip is made from recycled bottle flakes
Source: PCI Fibers
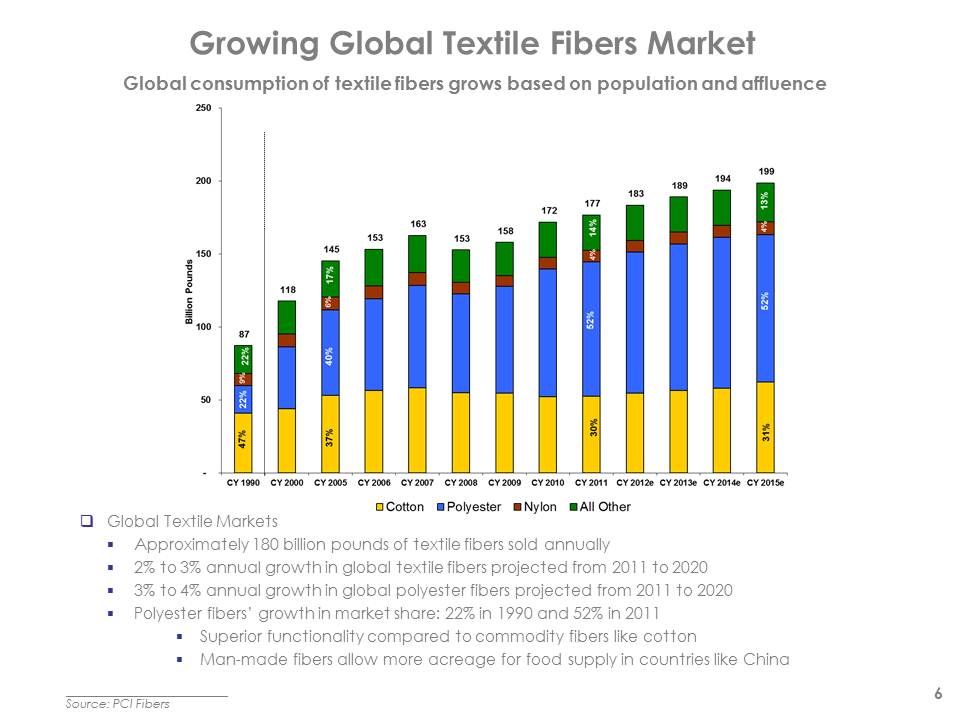
Global consumption of textile fibers grows based on population and affluence
Global Textile MarketsApproximately 180 billion pounds of textile fibers sold annually2% to 3% annual growth in global textile fibers projected from 2011 to 20203% to 4% annual growth in global polyester fibers projected from 2011 to 2020Polyester fibers’ growth in market share: 22% in 1990 and 52% in 2011Superior functionality compared to commodity fibers like cottonMan-made fibers allow more acreage for food supply in countries like China
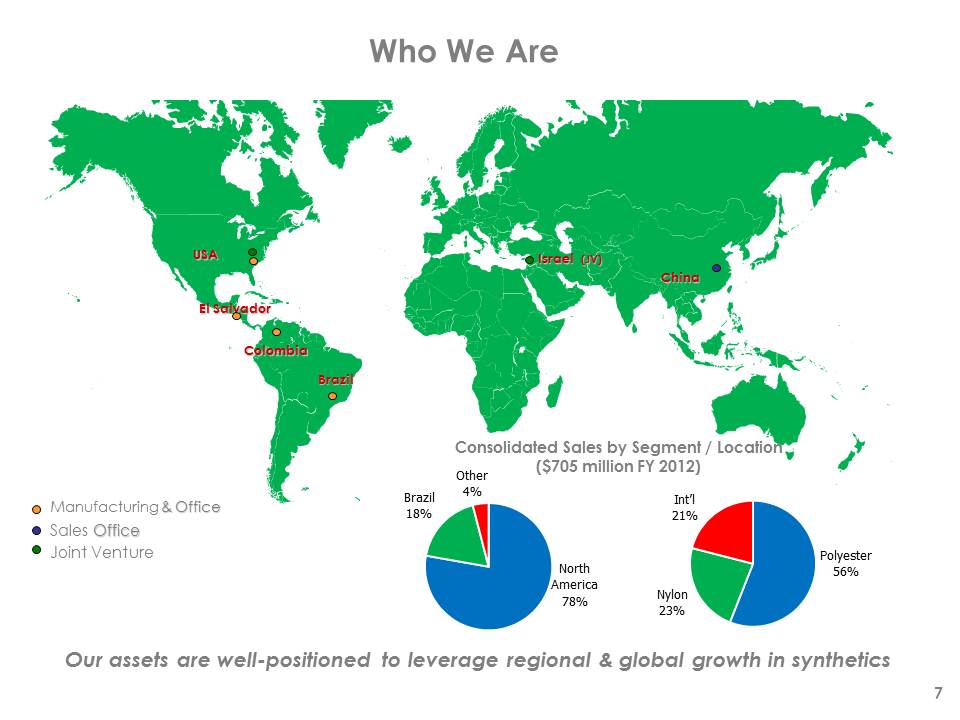
Manufacturing & Office
Sales Office
Joint Venture
Consolidated Sales by Segment / Location ($705 million FY 2012)
Who We Are
Our assets are well-positioned to leverage regional & global growth in synthetics
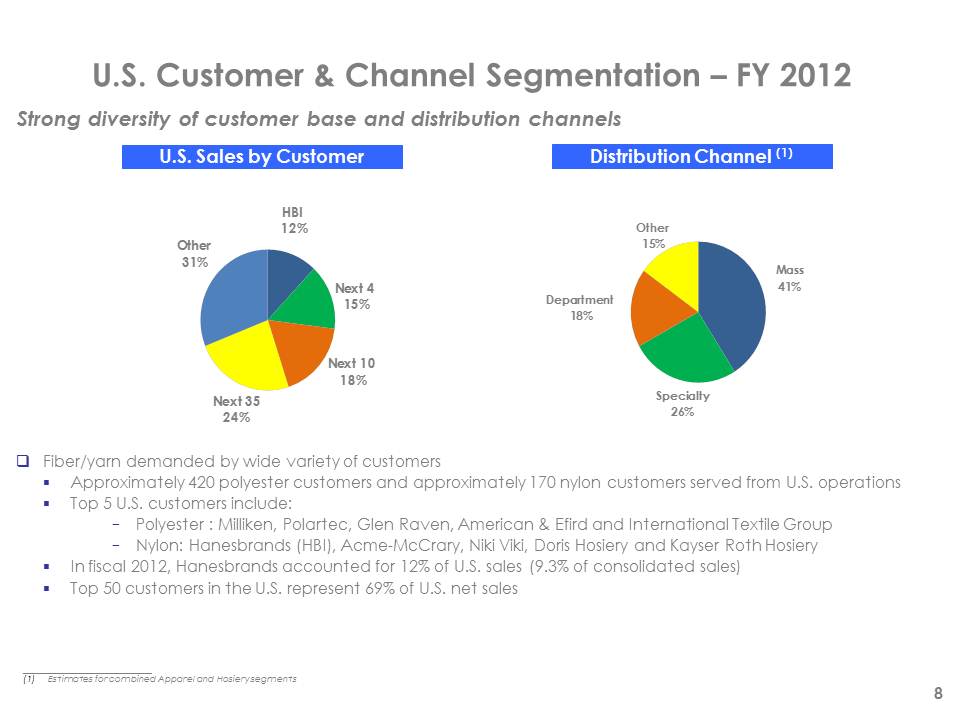
U.S. Customer & Channel Segmentation – FY 2012
Estimates for combined Apparel and Hosiery segments
U.S. Sales by Customer8Strong diversity of customer base and distribution channels
Distribution Channel (1)
Fiber/yarn demanded by wide variety of customersApproximately 420 polyester customers and approximately 170 nylon customers served from U.S. operationsTop 5 U.S. customers include:Polyester : Milliken, Polartec, Glen Raven, American & Efird and International Textile GroupNylon: Hanesbrands (HBI), Acme-McCrary, Niki Viki, Doris Hosiery and Kayser Roth HosieryIn fiscal 2012, Hanesbrands accounted for 12% of U.S. sales (9.3% of consolidated sales)Top 50 customers in the U.S. represent 69% of U.S. net sales
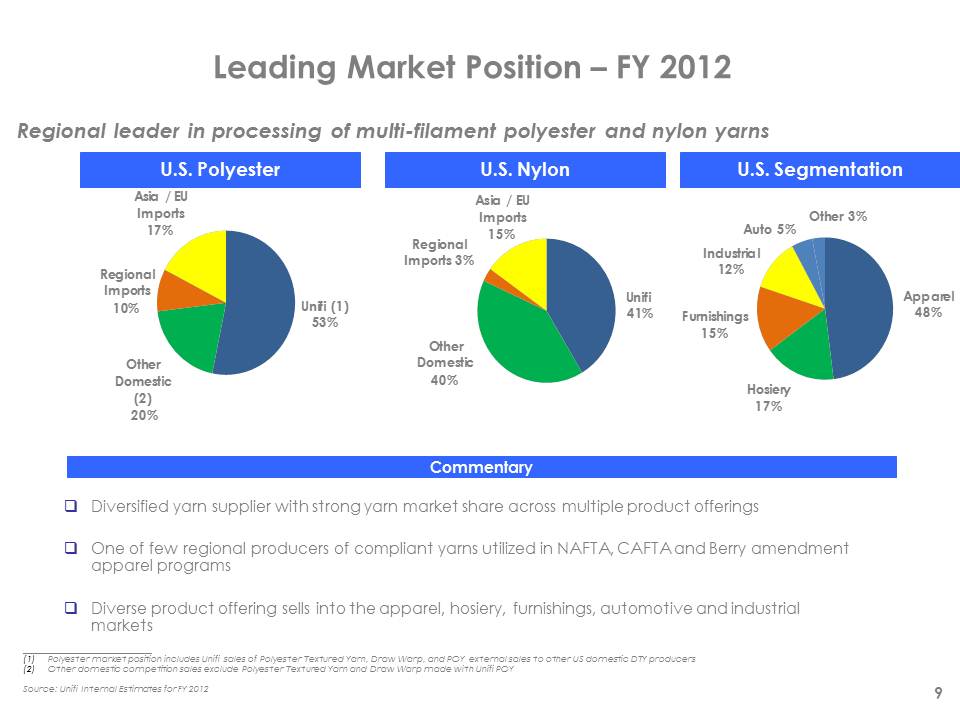
Leading Market Position – FY 2012
Polyester market position includes Unifi sales of Polyester Textured Yarn, Draw Warp, and POY external sales to other US domestic DTY producersOther domestic competition sales exclude Polyester Textured Yarn and Draw Warp made with Unifi POY Source: Unifi Internal Estimates for FY 2012U.S. Polyester9
Regional leader in processing of multi-filament polyester and nylon yarnsU.S. NylonDiversified yarn supplier with strong yarn market share across multiple product offeringsOne of few regional producers of compliant yarns utilized in NAFTA, CAFTA and Berry amendment apparel programsDiverse product offering sells into the apparel, hosiery, furnishings, automotive and industrial marketsCommentaryU.S. Segmentation
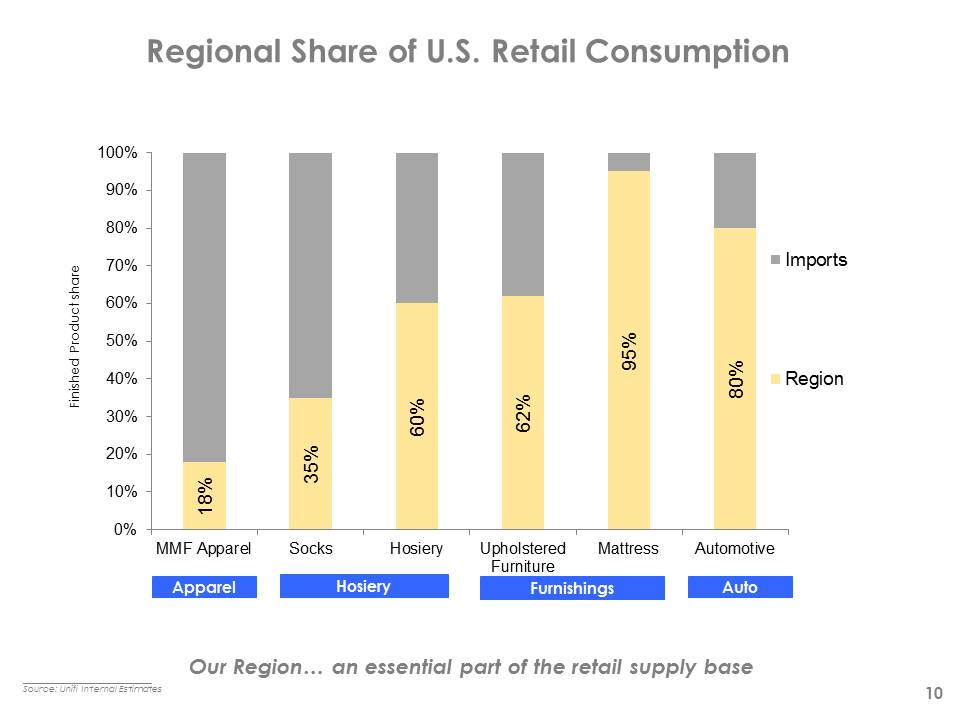
Regional Share of U.S. Retail Consumption
10
Our Region… an essential part of the retail supply base
Finished Product share
Source: Unifi Internal Estimates
Hosiery
Apparel
Auto
Furnishings
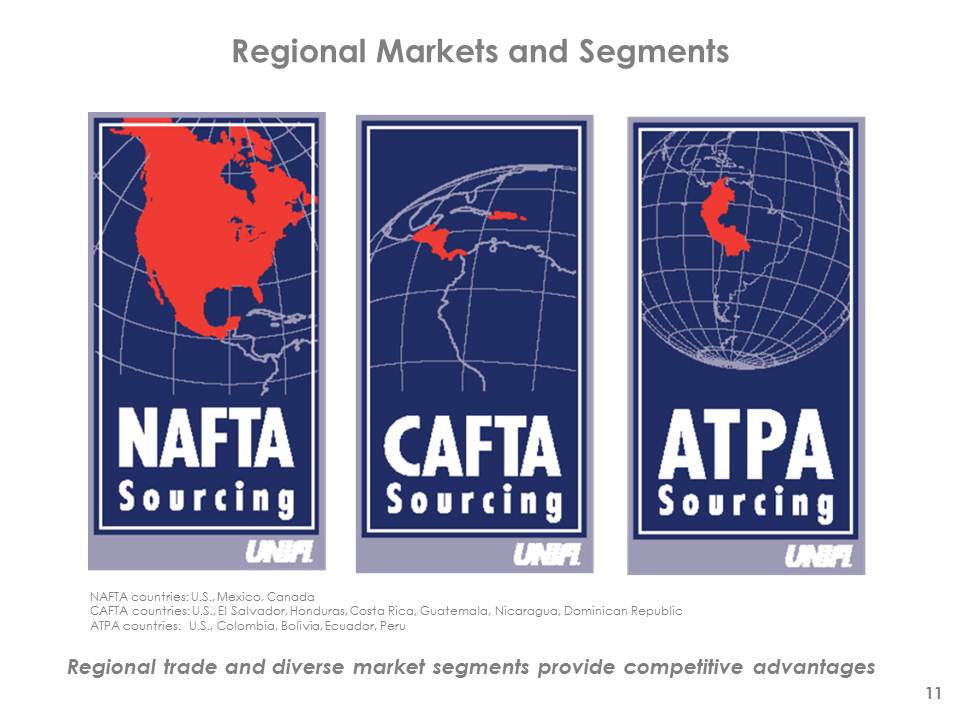
Regional Markets and Segments
11
NAFTA countries: U.S., Mexico, Canada CAFTA countries: U.S., El Salvador, Honduras, Costa Rica, Guatemala, Nicaragua, Dominican RepublicATPA countries: U.S., Colombia, Bolivia, Ecuador, Peru
Regional trade and diverse market segments provide competitive advantages
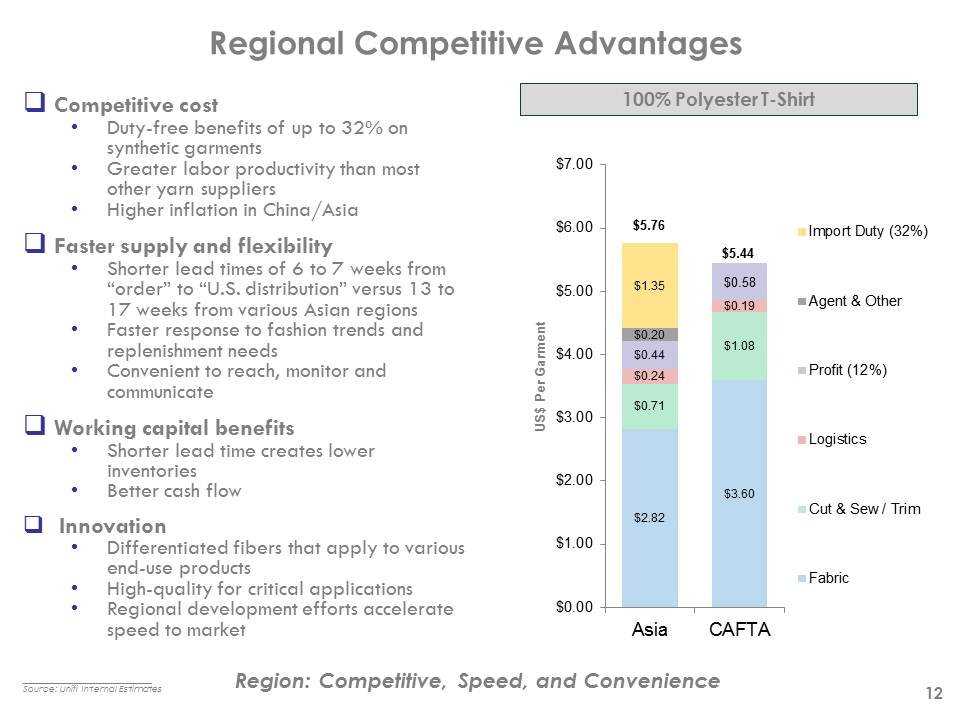
Regional Competitive Advantages
12
Competitive costDuty-free benefits of up to 32% on synthetic garmentsGreater labor productivity than most other yarn suppliersHigher inflation in China/Asia Faster supply and flexibilityShorter lead times of 6 to 7 weeks from “order” to “U.S. distribution” versus 13 to 17 weeks from various Asian regionsFaster response to fashion trends and replenishment needsConvenient to reach, monitor and communicate Working capital benefitsShorter lead time creates lower inventoriesBetter cash flowInnovationDifferentiated fibers that apply to various end-use productsHigh-quality for critical applicationsRegional development efforts accelerate speed to market
Region: Competitive, Speed, and Convenience
Source: Unifi Internal Estimates
100% Polyester T-Shirt
$5.76
$5.44
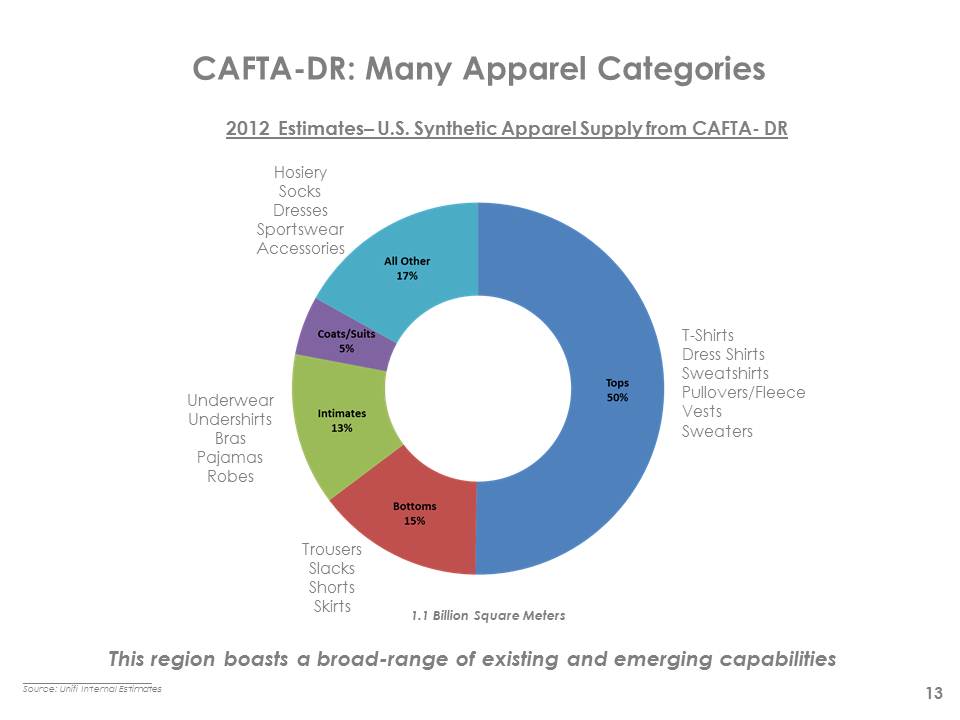
CAFTA-DR: Many Apparel Categories
13
This region boasts a broad-range of existing and emerging capabilities
2012 Estimates– U.S. Synthetic Apparel Supply from CAFTA- DR
HosierySocksDressesSportswearAccessories
T-ShirtsDress ShirtsSweatshirtsPullovers/FleeceVestsSweaters
TrousersSlacksShortsSkirts
UnderwearUndershirtsBrasPajamasRobes
1.1 Billion Square Meters
Source: Unifi Internal Estimates
Operating Environment
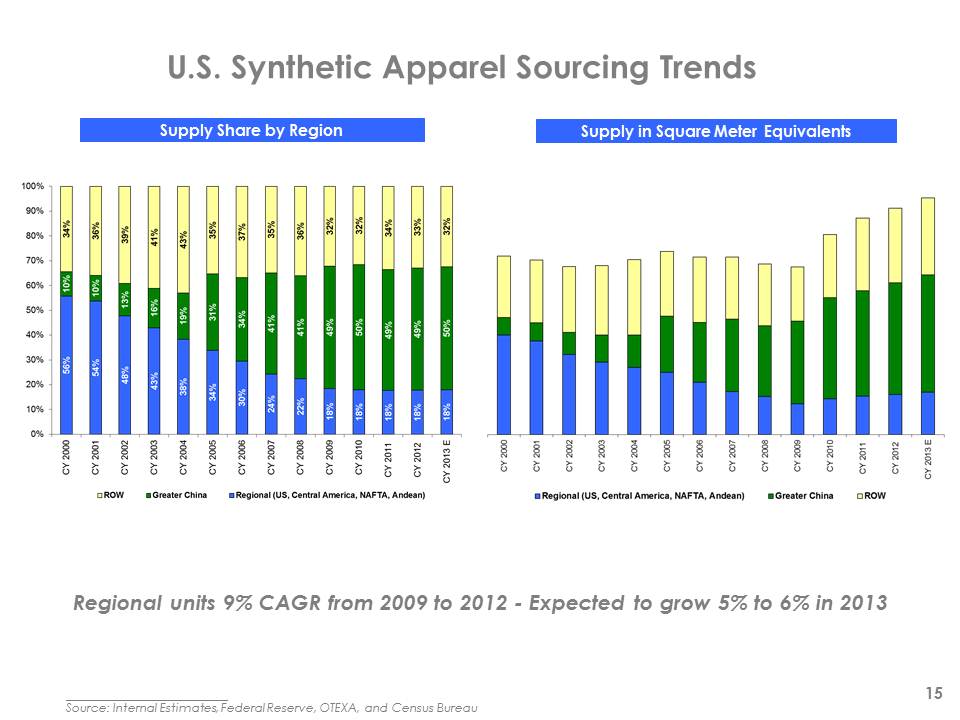
U.S. Synthetic Apparel Sourcing Trends
Regional units 9% CAGR from 2009 to 2012 - Expected to grow 5% to 6% in 2013
Source: Internal Estimates, Federal Reserve, OTEXA, and Census Bureau
Supply Share by Region
Supply in Square Meter Equivalents
15
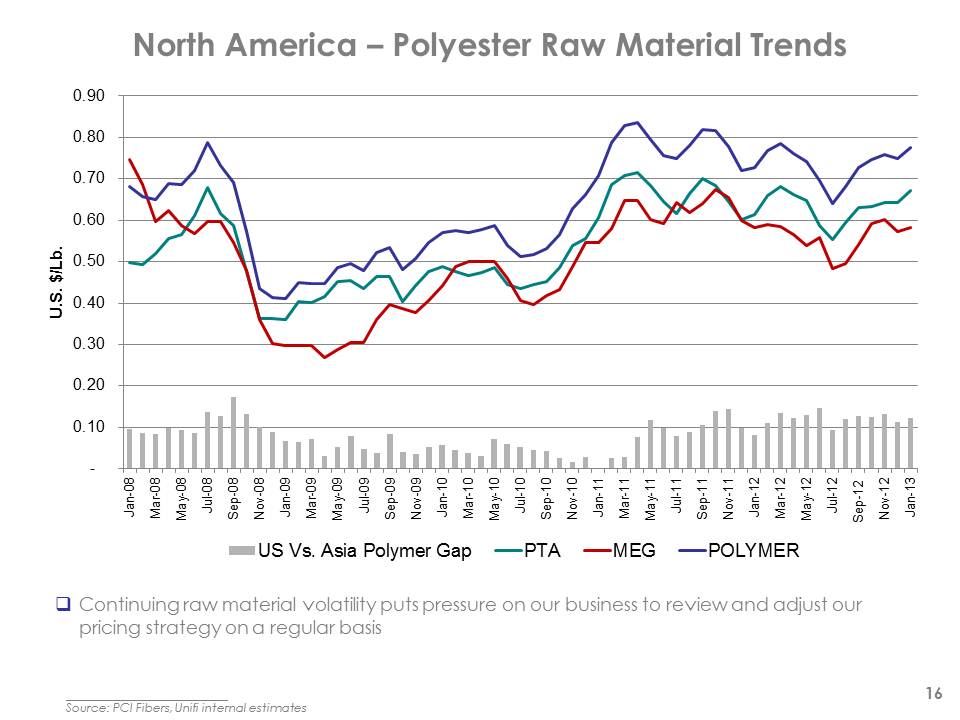
North America – Polyester Raw Material Trends
16 Source: PCI Fibers, Unifi internal estimates
Continuing raw material volatility puts pressure on our business to review and adjust our pricing strategy on a regular basis
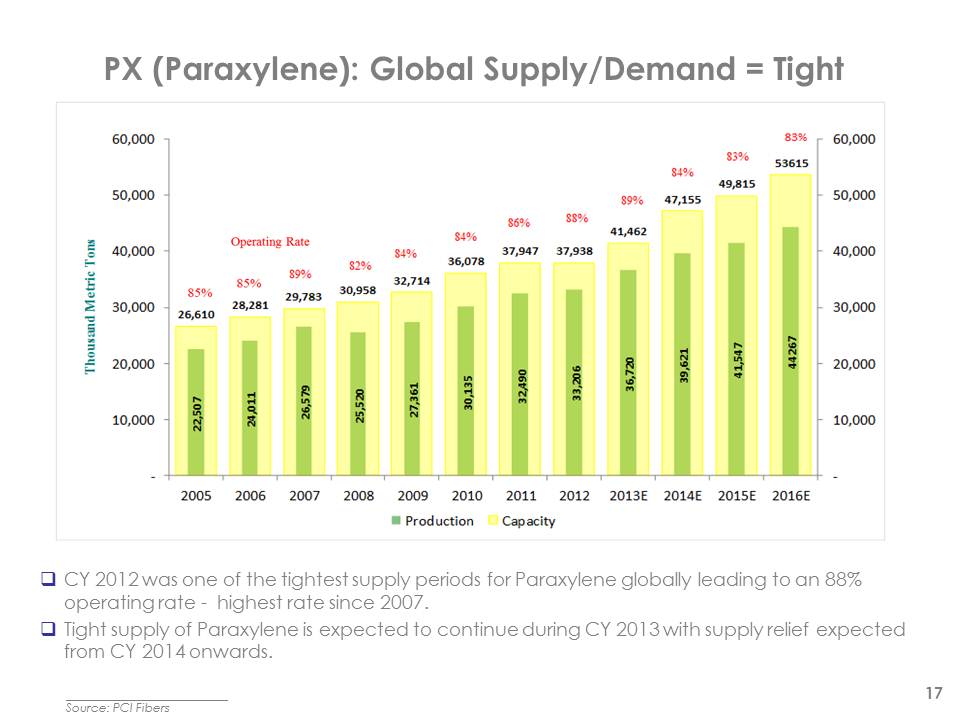
PX (Paraxylene): Global Supply/Demand = Tight
17
Source: PCI Fibers
CY 2012 was one of the tightest supply periods for Paraxylene globally leading to an 88% operating rate - highest rate since 2007.Tight supply of Paraxylene is expected to continue during CY 2013 with supply relief expected from CY 2014 onwards.
Business Strategy
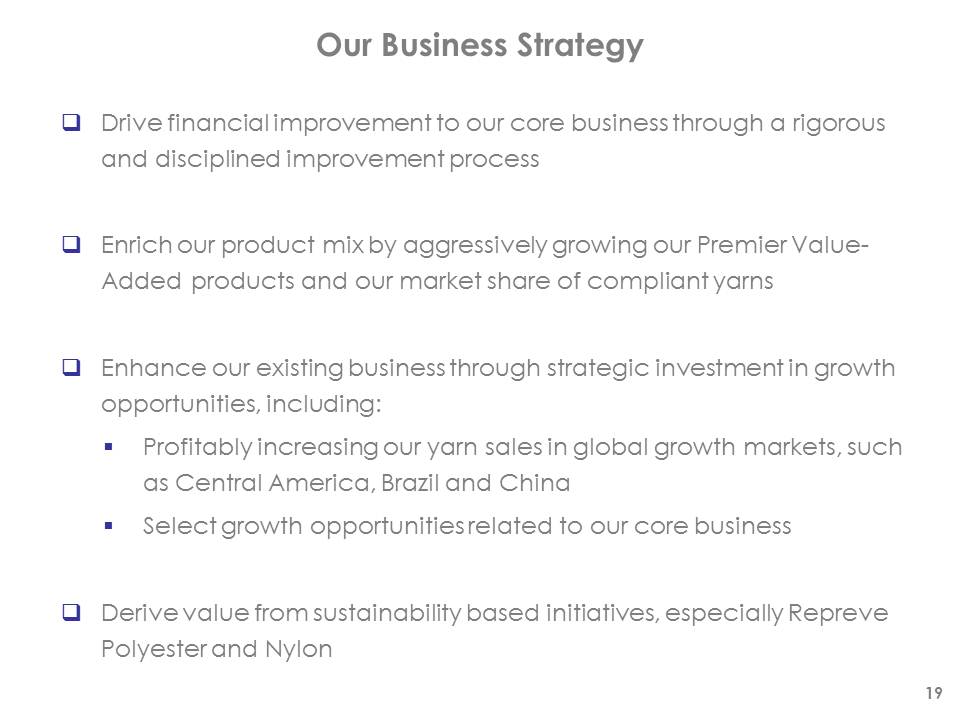
Our Business Strategy
19
Drive financial improvement to our core business through a rigorous and disciplined improvement processEnrich our product mix by aggressively growing our Premier Value- Added products and our market share of compliant yarns Enhance our existing business through strategic investment in growth opportunities, including:Profitably increasing our yarn sales in global growth markets, such as Central America, Brazil and ChinaSelect growth opportunities related to our core businessDerive value from sustainability based initiatives, especially Repreve Polyester and Nylon
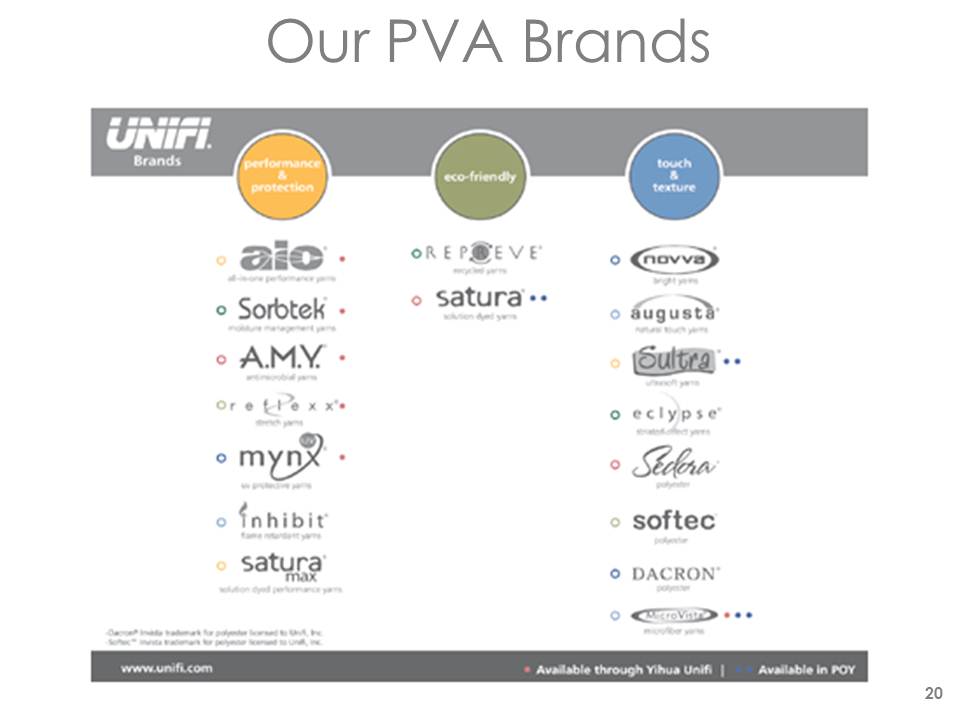
Our PVA Brands
20
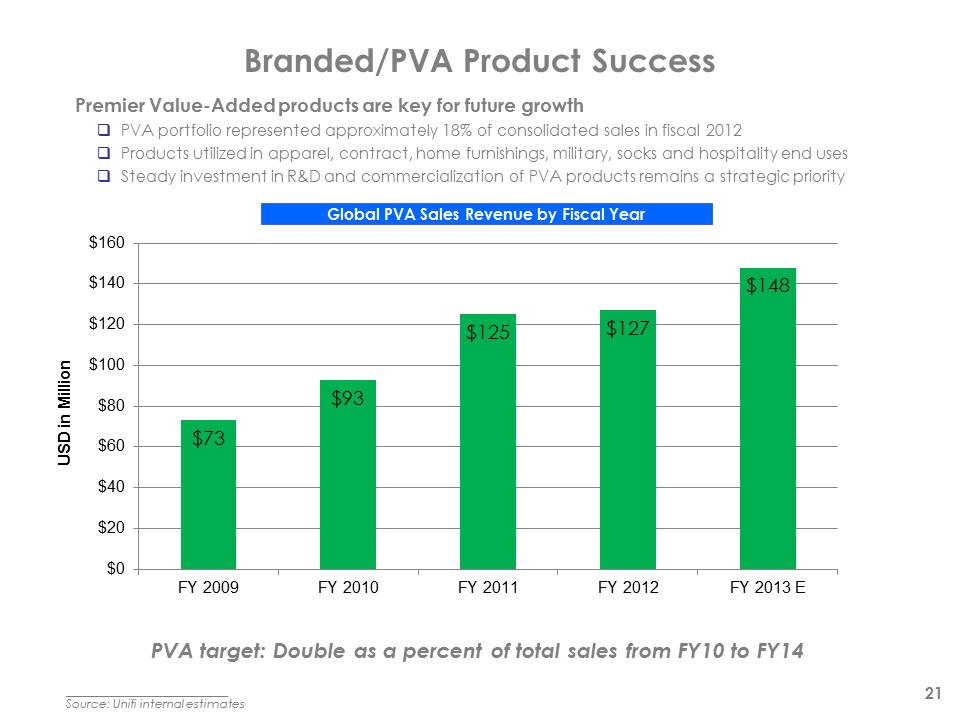
Global PVA Sales Revenue by Fiscal Year
PVA portfolio represented approximately 18% of consolidated sales in fiscal 2012Products utilized in apparel, contract, home furnishings, military, socks and hospitality end usesSteady investment in R&D and commercialization of PVA products remains a strategic priority
Premier Value-Added products are key for future growth
Branded/PVA Product Success
Source: Unifi internal estimates
PVA target: Double as a percent of total sales from FY10 to FY14
21
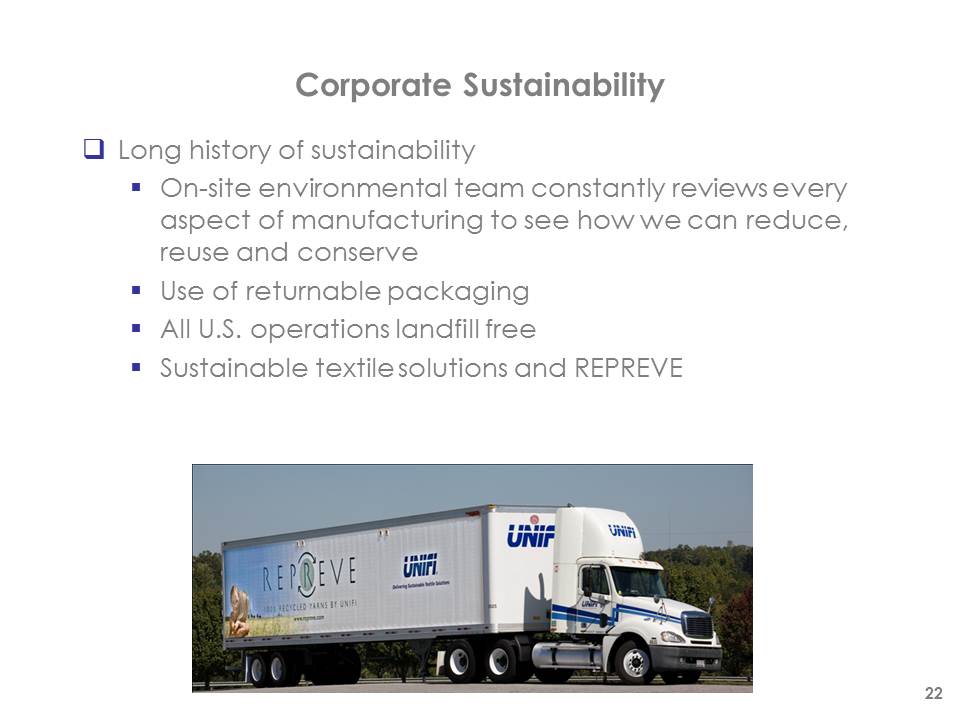
Corporate Sustainability
Long history of sustainabilityOn-site environmental team constantly reviews every aspect of manufacturing to see how we can reduce, reuse and conserveUse of returnable packagingAll U.S. operations landfill free Sustainable textile solutions and REPREVE
22

Commitment to Innovation
23
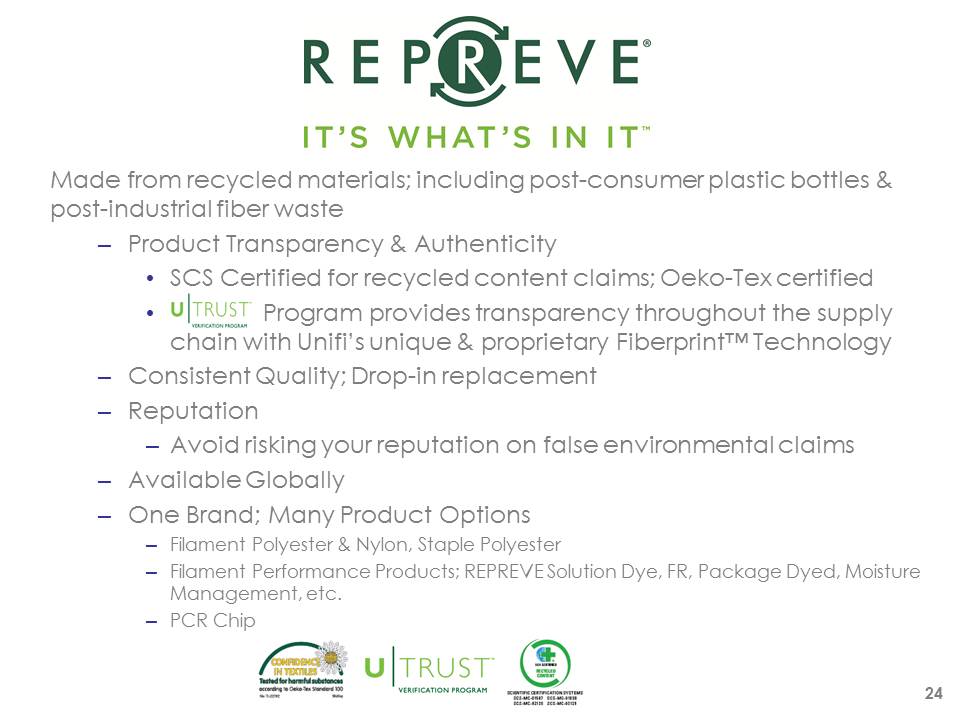
Made from recycled materials; including post-consumer plastic bottles & post-industrial fiber wasteProduct Transparency & AuthenticitySCS Certified for recycled content claims; Oeko-Tex certified
Program provides transparency throughout the supply chain with Unifi’s unique & proprietary Fiberprint™ TechnologyConsistent Quality; Drop-in replacementReputationAvoid risking your reputation on false environmental claimsAvailable GloballyOne Brand; Many Product OptionsFilament Polyester & Nylon, Staple PolyesterFilament Performance Products; REPREVE Solution Dye, FR, Package Dyed, Moisture Management, etc. PCR Chip
24
25

26
Financial Overview
27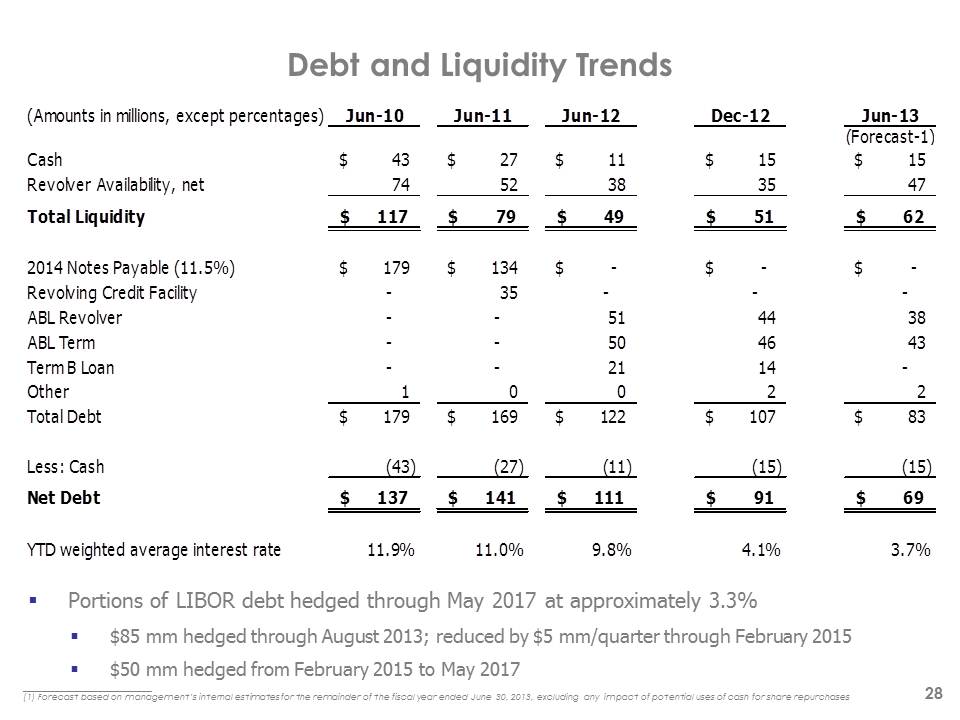
Debt and Liquidity Trends
28
Portions of LIBOR debt hedged through May 2017 at approximately 3.3%$85 mm hedged through August 2013; reduced by $5 mm/quarter through February 2015$50 mm hedged from February 2015 to May 2017
(1) Forecast based on management’s internal estimates for the remainder of the fiscal year ended June 30, 2013, excluding any impact of potential uses of cash for share repurchases
|
(Amounts in millions, except percentages)
|
Jun-10
|
Jun-11
|
Jun-12
|
Dec-12
|
Jun-13
|
|||||
|
(Forecast-1)
|
||||||||||
|
Cash
|
$ 43
|
$ 27
|
$ 11
|
$ 15
|
$ 15
|
|||||
|
Revolver Availability, net
|
74
|
52
|
38
|
35
|
47
|
|||||
|
Total Liquidity
|
$ 117
|
$ 79
|
$ 49
|
$ 51
|
$ 62
|
|||||
|
2014 Notes Payable (11.5%)
|
$ 179
|
$ 134
|
$ -
|
$ -
|
$ -
|
|||||
|
Revolving Credit Facility
|
-
|
35
|
-
|
-
|
-
|
|||||
|
ABL Revolver
|
-
|
-
|
51
|
44
|
38
|
|||||
|
ABL Term
|
-
|
-
|
50
|
46
|
43
|
|||||
|
Term B Loan
|
-
|
-
|
21
|
14
|
-
|
|||||
|
Other
|
1
|
0
|
0
|
2
|
2
|
|||||
|
Total Debt
|
$ 179
|
$ 169
|
$ 122
|
$ 107
|
$ 83
|
|||||
|
Less: Cash
|
(43)
|
(27)
|
(11)
|
(15)
|
(15)
|
|||||
|
Net Debt
|
$ 137
|
$ 141
|
$ 111
|
$ 91
|
$ 69
|
|||||
|
YTD weighted average interest rate
|
11.9%
|
11.0%
|
9.8%
|
4.1%
|
3.7%
|
|||||
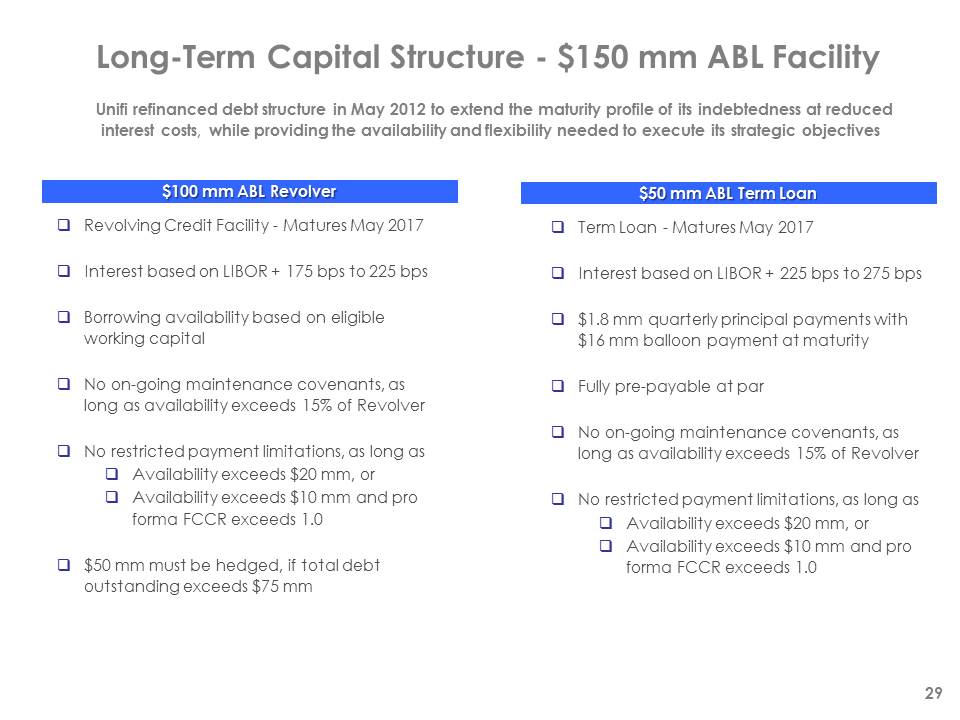
Revolving Credit Facility - Matures May 2017Interest based on LIBOR + 175 bps to 225 bpsBorrowing availability based on eligible working capitalNo on-going maintenance covenants, as long as availability exceeds 15% of RevolverNo restricted payment limitations, as long asAvailability exceeds $20 mm, orAvailability exceeds $10 mm and pro forma FCCR exceeds 1.0$50 mm must be hedged, if total debt outstanding exceeds $75 mm
$100 mm ABL Revolver
$50 mm ABL Term Loan
Unifi refinanced debt structure in May 2012 to extend the maturity profile of its indebtedness at reduced interest costs, while providing the availability and flexibility needed to execute its strategic objectives
29
Long-Term Capital Structure - $150 mm ABL Facility
Term Loan - Matures May 2017Interest based on LIBOR + 225 bps to 275 bps$1.8 mm quarterly principal payments with $16 mm balloon payment at maturityFully pre-payable at parNo on-going maintenance covenants, as long as availability exceeds 15% of RevolverNo restricted payment limitations, as long asAvailability exceeds $20 mm, orAvailability exceeds $10 mm and pro forma FCCR exceeds 1.0
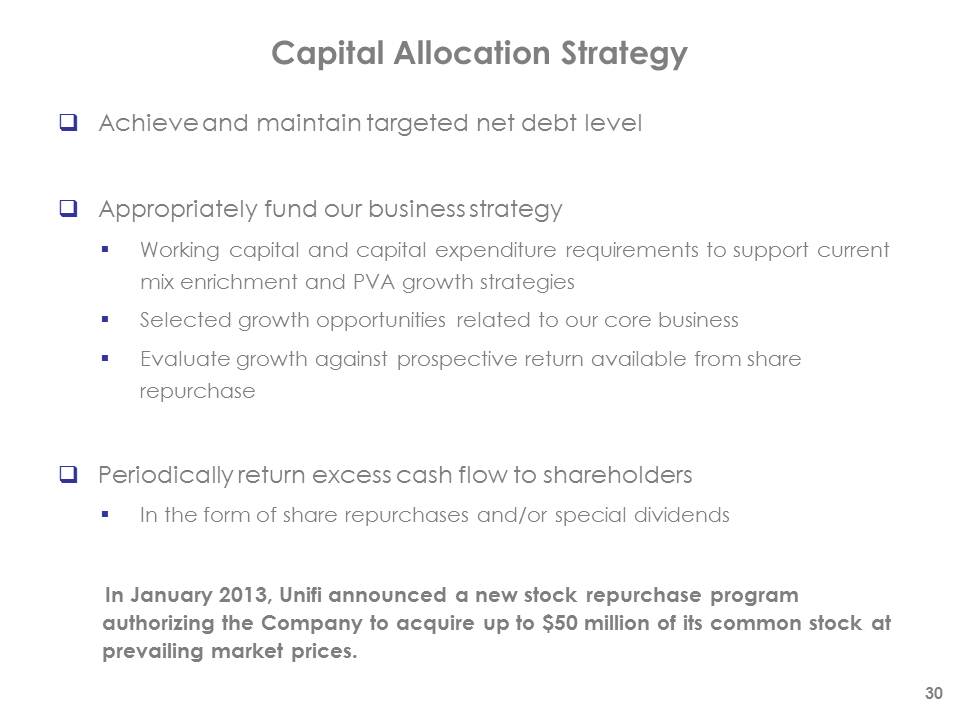
Capital Allocation Strategy
30
Achieve and maintain targeted net debt levelAppropriately fund our business strategyWorking capital and capital expenditure requirements to support current mix enrichment and PVA growth strategiesSelected growth opportunities related to our core businessEvaluate growth against prospective return available from share repurchasePeriodically return excess cash flow to shareholdersIn the form of share repurchases and/or special dividends
In January 2013, Unifi announced a new stock repurchase program authorizing the Company to acquire up to $50 million of its common stock at prevailing market prices.
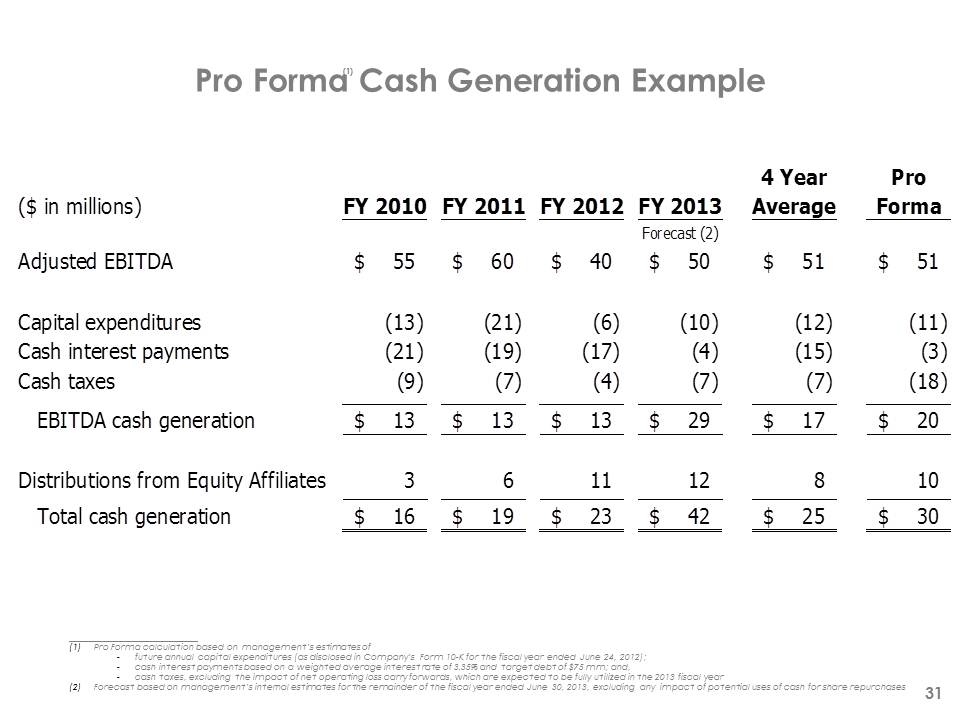
Pro Forma Cash Generation Example 31 Pro Forma calculation based on management’s estimates of future annual capital expenditures (as disclosed in Company’s Form 10-K for the fiscal year ended June 24, 2012); cash interest payments based on a weighted average interest rate of 3.35% and target debt of $75 mm; and,cash taxes, excluding the impact of net operating loss carry forwards, which are expected to be fully utilized in the 2013 fiscal yearForecast based on management’s internal estimates for the remainder of the fiscal year ended June 30, 2013, excluding any impact of potential uses of cash for share repurchases (1)
|
4 Year
|
Pro
|
|||||||||||
|
($ in millions)
|
FY 2010
|
FY 2011
|
FY 2012
|
FY 2013
|
Average
|
Forma
|
||||||
|
Forecast (2)
|
||||||||||||
|
Adjusted EBITDA
|
$ 55
|
$ 60
|
$ 40
|
$ 50
|
$ 51
|
$ 51
|
||||||
|
Capital expenditures
|
(13)
|
(21)
|
(6)
|
(10)
|
(12)
|
(11)
|
||||||
|
Cash interest payments
|
(21)
|
(19)
|
(17)
|
(4)
|
(15)
|
(3)
|
||||||
|
Cash taxes
|
(9)
|
(7)
|
(4)
|
(7)
|
(7)
|
(18)
|
||||||
|
EBITDA cash generation
|
$ 13
|
$ 13
|
$ 13
|
$ 29
|
$ 17
|
$ 20
|
||||||
|
Distributions from Equity Affiliates
|
3
|
6
|
11
|
12
|
8
|
10
|
||||||
|
Total cash generation
|
$ 16
|
$ 19
|
$ 23
|
$ 42
|
$ 25
|
$ 30
|
||||||

Questions

Appendix Slides
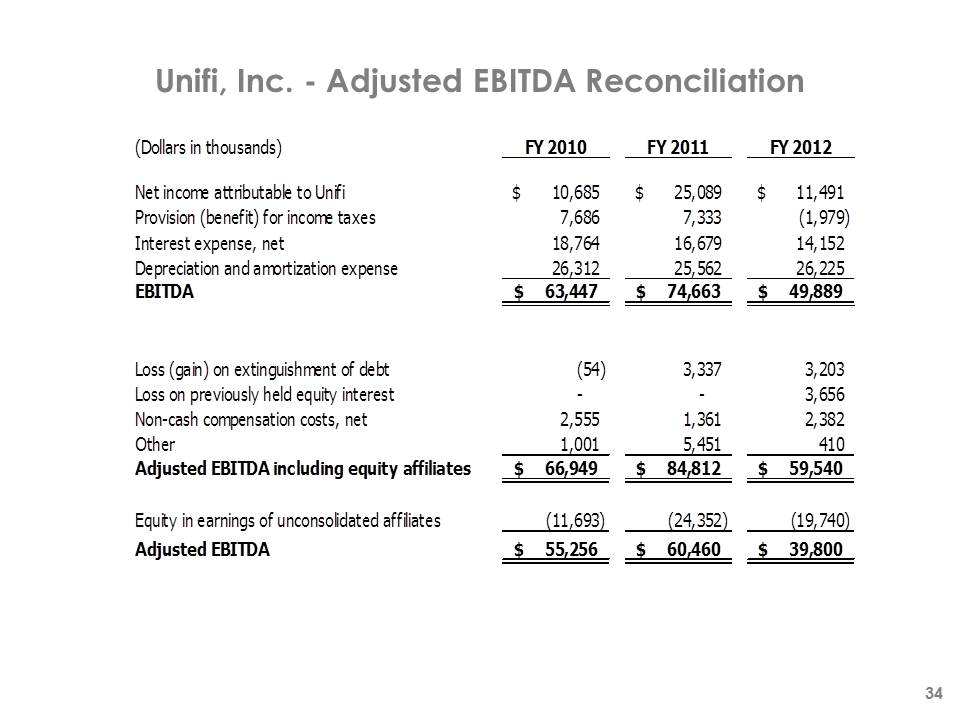
Unifi, Inc. - Adjusted EBITDA Reconciliation
|
(Dollars in thousands)
|
FY 2010
|
FY 2011
|
FY 2012
|
|||
|
Net income attributable to Unifi
|
$ 10,685
|
$ 25,089
|
$ 11,491
|
|||
|
Provision (benefit) for income taxes
|
7,686
|
7,333
|
(1,979)
|
|||
|
Interest expense, net
|
18,764
|
16,679
|
14,152
|
|||
|
Depreciation and amortization expense
|
26,312
|
25,562
|
26,225
|
|||
|
EBITDA
|
$ 63,447
|
$ 74,663
|
$ 49,889
|
|||
|
Loss (gain) on extinguishment of debt
|
(54)
|
3,337
|
3,203
|
|||
|
Loss on previously held equity interest
|
-
|
-
|
3,656
|
|||
|
Non-cash compensation costs, net
|
2,555
|
1,361
|
2,382
|
|||
|
Other
|
1,001
|
5,451
|
410
|
|||
|
Adjusted EBITDA including equity affiliates
|
$ 66,949
|
$ 84,812
|
$ 59,540
|
|||
|
Equity in earnings of unconsolidated affiliates
|
(11,693)
|
(24,352)
|
(19,740)
|
|||
|
Adjusted EBITDA
|
$ 55,256
|
$ 60,460
|
$ 39,800
|
|||
34
Non-GAAP Financial Measures
35
Included in this presentation are certain non-GAAP financial measures designed to complement the financial information presented in accordance with generally accepted accounting principles in the United States of America ("GAAP") because management believes such measures are useful to investors. EBITDA, Adjusted EBITDA including equity affiliates, Adjusted EBITDA, EBITDA cash generation and Total cash generation. EBITDA represents net income or loss attributable to Unifi, Inc. before income tax expense, net interest expense, and depreciation and amortization expense (excluding interest portion of amortization). Adjusted EBITDA including equity affiliates represents EBITDA adjusted to exclude non-cash compensation expense net of distributions, gains or losses on extinguishment of debt, loss on previously held equity interest, refund of Brazilian non-income related tax, operating expenses for Repreve Renewables and certain other adjustments. Other adjustments include gains or losses on sales or disposals of property, plant and equipment, currency and derivative gains or losses, restructuring and employee severance expenses and certain other operating or non-operating income or expense items. Adjusted EBITDA represents Adjusted EBITDA including equity affiliates adjusted to exclude equity in earnings and losses of unconsolidated affiliates. EBITDA cash generation represents Adjusted EBITDA less capital expenditures, cash interest payments and cash taxes. Total cash generation represents EBITDA cash generation adjusted to include distributions from equity affiliates. We present Adjusted EBITDA as a supplemental measure of our operating performance. We also present Adjusted EBITDA because we believe such measure is frequently used by securities analysts, investors and other interested parties in the evaluation of companies in our industry. EBITDA, Adjusted EBITDA including equity affiliates, Adjusted EBITDA, EBITDA cash generation and Total cash generation are alternative views of performance used by management and we believe that investors’ understanding of our performance is enhanced by disclosing these performance measures. Our management uses Adjusted EBITDA: (i) as a measurement of operating performance because it assists us in comparing our operating performance on a consistent basis as it removes the impact of (a) items directly related to our asset base (primarily depreciation and amortization) and (b) items that we would not expect to occur as a part of our normal business; (ii) for planning purposes, including the preparation of our annual operating budget; (iii) as a valuation measure for evaluating our operating performance and our capacity to incur and service debt, fund capital expenditures and expand our business; and (iv) as one measure in determining the value of other acquisitions and dispositions. Adjusted EBITDA is also a key performance metric utilized in the determination of variable compensation. We believe that the use of EBITDA, Adjusted EBITDA including equity affiliates, Adjusted EBITDA, EBITDA cash generation and Total cash generation as operating performance measures provides investors and analysts with a measure of operating results unaffected by differences in capital structures, capital investment cycles, and ages of related assets, among otherwise comparable companies. We also believe Adjusted EBITDA is an appropriate supplemental measure of debt service capacity, because cash expenditures on interest are, by definition, available to pay interest, and tax expense is inversely correlated to interest expense because tax expense decreases as deductible interest expense increases; depreciation and amortization are non-cash charges. Equity in earnings and losses of unconsolidated affiliates is excluded because such earnings or losses do not reflect our operating performance. The other items excluded from Adjusted EBITDA are excluded in order to better reflect the performance of our continuing operations. In evaluating EBITDA, Adjusted EBITDA including equity affiliates, Adjusted EBITDA, EBITDA cash generation and Total cash generation, you should be aware that in the future we may incur expenses similar to the adjustments in this presentation. Our presentation of EBITDA, Adjusted EBITDA including equity affiliates, Adjusted EBITDA, EBITDA cash generation and Total cash generation should not be construed as an inference that our future results will be unaffected by unusual or non-recurring items. EBITDA, Adjusted EBITDA including equity affiliates, Adjusted EBITDA, EBITDA cash generation and Total cash generation are not measurements of our financial performance under GAAP and should not be considered as alternatives to net income, operating income or any other performance measures derived in accordance with GAAP or as an alternative to cash flow from operating activities as a measure of our liquidity.
Continued
Non-GAAP Financial Measures
36
Each of our EBITDA, Adjusted EBITDA including equity affiliates, Adjusted EBITDA, EBITDA cash generation and Total cash generation measures has limitations as an analytical tool, and you should not consider it in isolation or as a substitute for analysis of our results as reported under GAAP. Some of these limitations are: • it does not reflect our cash expenditures, future requirements for capital expenditures or contractual commitments; • it does not reflect changes in, or cash requirements for, our working capital needs; • it does not reflect the significant interest expense or the cash requirements necessary to service interest or principal payments on our debt; • although depreciation and amortization are non-cash charges, the assets being depreciated and amortized will often have to be replaced in the future, and our Adjusted EBITDA (or our Adjusted EBITDA including equity affiliates) measure does not reflect any cash requirements for such replacements; • it is not adjusted for all non-cash income or expense items that are reflected in our statements of cash flows; • it does not reflect the impact of earnings or charges resulting from matters we consider not indicative of our on-going operations; • it does not reflect limitations on or costs related to transferring earnings from our subsidiaries to us; and • other companies in our industry may calculate this measure differently than we do, limiting its usefulness as a comparative measure. Because of these limitations, EBITDA, Adjusted EBITDA including equity affiliates, Adjusted EBITDA, EBITDA cash generation and Total cash generation should not be considered as a measure of discretionary cash available to us to invest in the growth of our business or as a measure of cash that will be available to us to meet our obligations, including those under our outstanding debt obligations. You should compensate for these limitations by relying primarily on our GAAP results and using these measures only as supplemental information. Projected fiscal year 2013 Adjusted EBITDA, EBITDA cash generation and Total cash generation: With respect to the forward-looking non-GAAP financial measures “Adjusted EBITDA,” “EBITDA cash generation,” and “Total cash generation” that the Company referenced for fiscal 2013, the comparable GAAP financial measure “Net Income” is not accessible on a forward-looking basis. The forward-looking adjustment for equity in earnings or losses of unconsolidated affiliates cannot be reasonably estimated. For purposes of reconciling the forward-looking Adjusted EBITDA, we would make adjustments of the type referenced for prior periods, and we would estimate the material adjustments for interest expense, income tax, and depreciation and amortization to be $4.5 million, $14.2 million, and $25.4 million, respectively, for fiscal 2013. For purposes of reconciling the forward-looking EBITDA cash generation, we would estimate the material adjustments for capital expenditures, cash interest payments and cash taxes to be $9.9 million, $4.2 million, and $6.9 million, respectively, for fiscal 2013. For purposes of reconciling the forward-looking Total cash generation, we would estimate the material adjustments for distributions from equity affiliates to be $12.3 million for fiscal 2013.

37