Attached files
| file | filename |
|---|---|
| 8-K - 8-K - JONES LANG LASALLE INC | d502522d8k.htm |
 Investor Presentation
March 2013
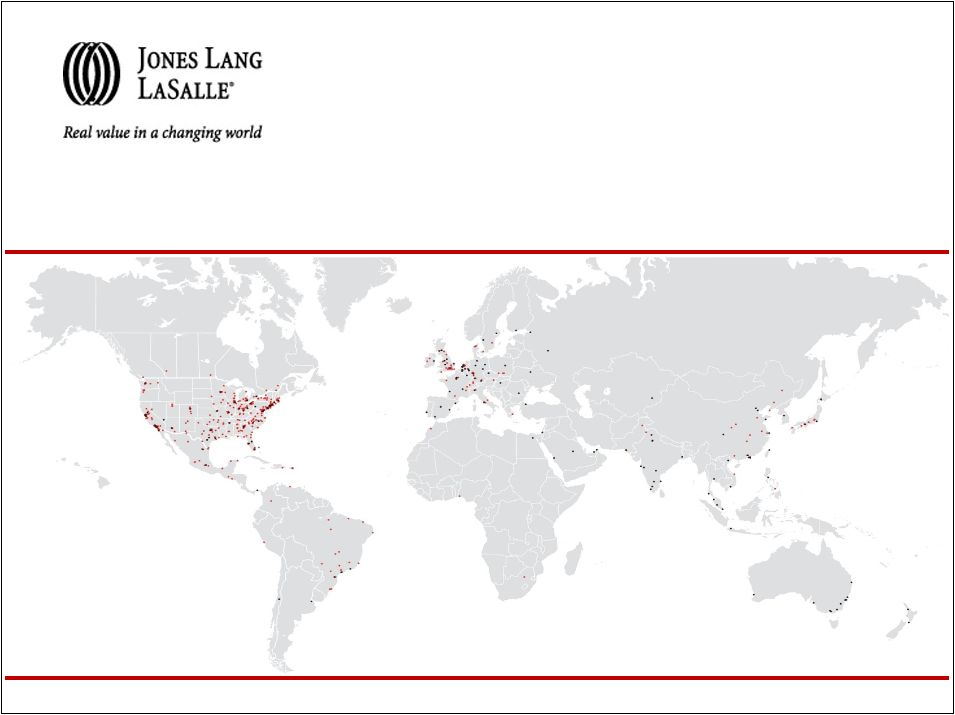
..48,000 employees….200 offices….70 countries….1 global platform..
Exhibit 99.1 |
 Table of Contents
I.
Company Description
II.
Global Growth Strategy
III.
Financial Overview
IV.
Appendix
2 |
 Company
Description |
 Global
real estate services Premier global investment manager
•
LaSalle Investment Management provides outstanding
performance and service for clients with global real estate
investment portfolios
Shareholder opportunity
Jones Lang LaSalle
Shareholder value
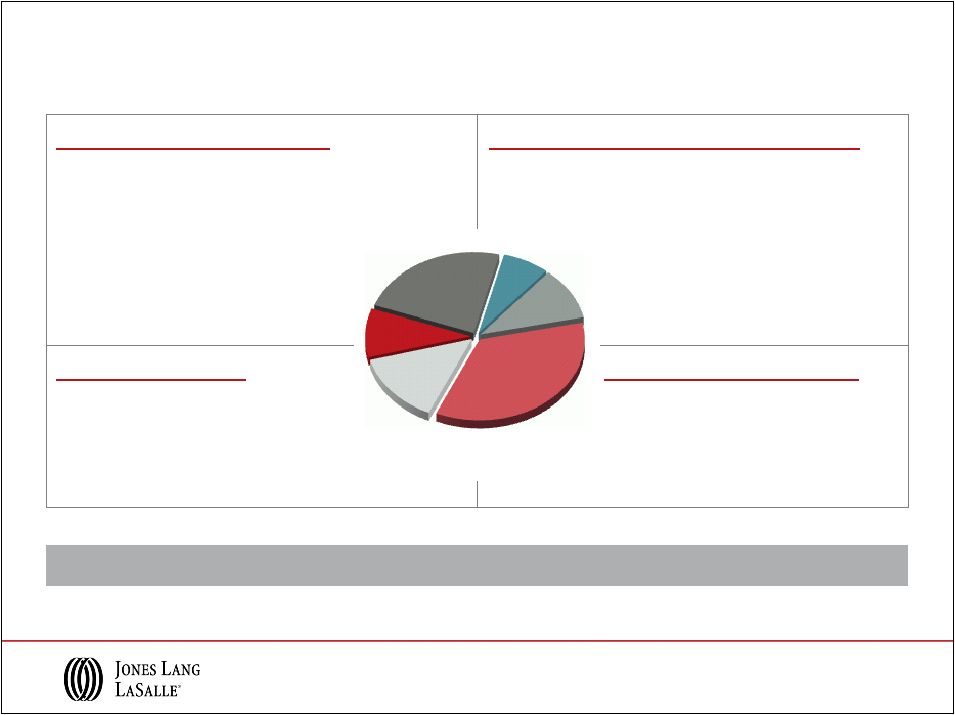
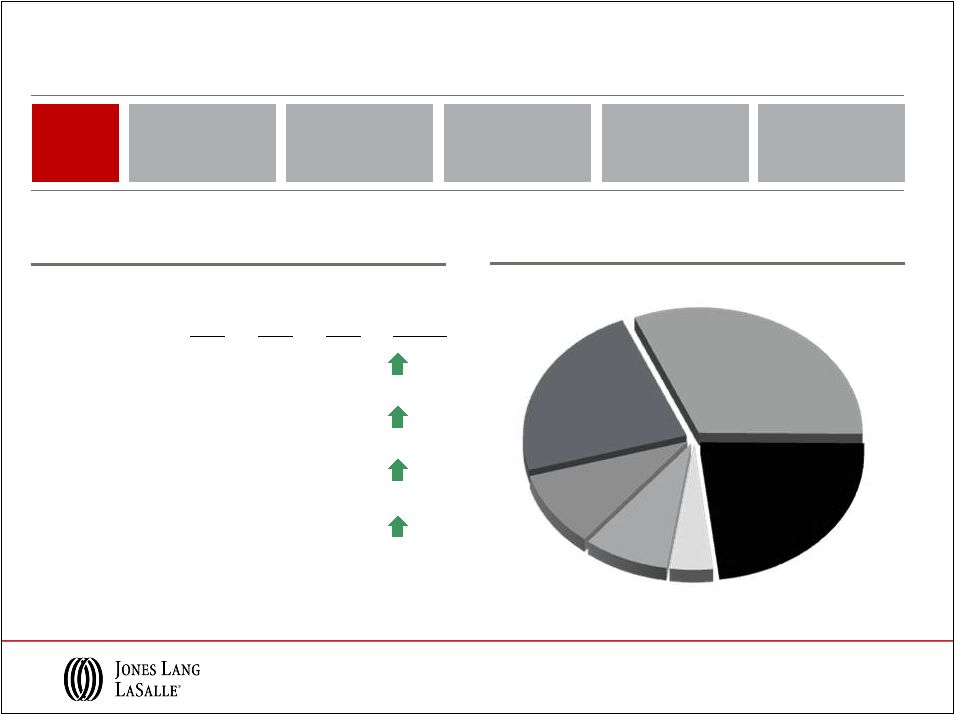
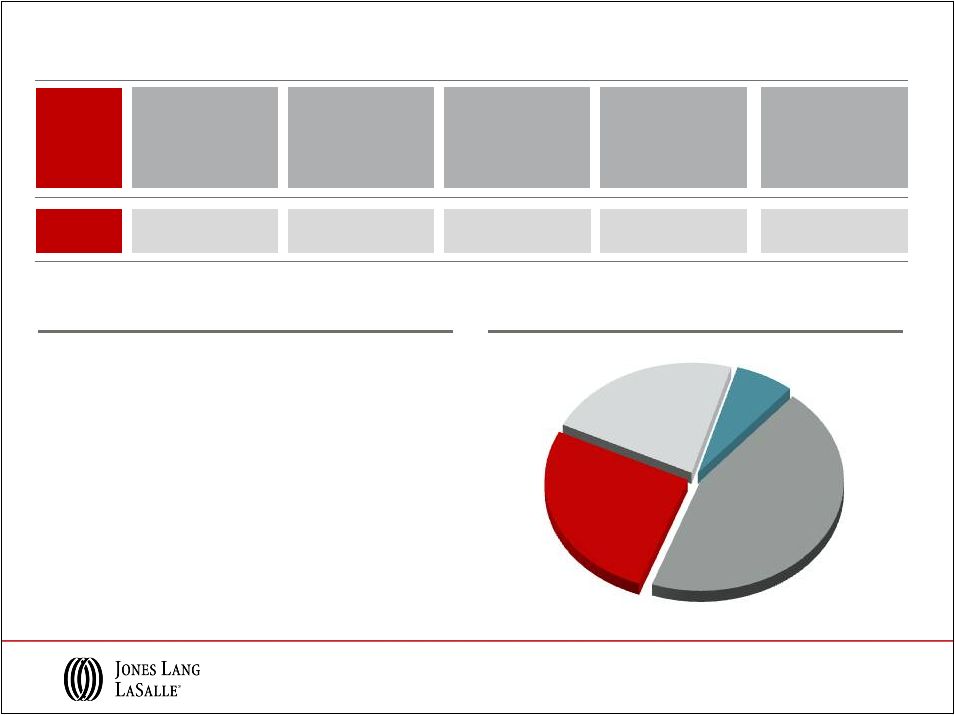
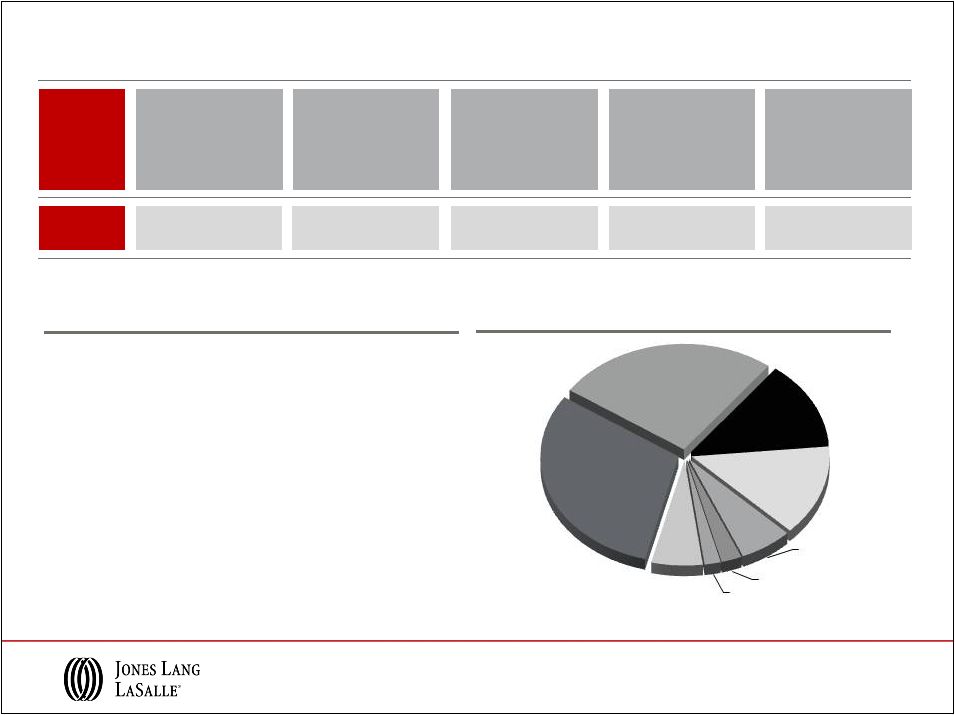
2012 Fee Revenue =
$3.6 billion
Value-creating real estate services and investment management firm
•
Investment expertise including core, value-
add, opportunistic and private investing
across major property types
•
More than 300 institutional clients worldwide
•
Leading global markets positions
•
Consolidator in a consolidating industry
•
Productivity and margin expansion
•
Strategic, fully integrated services for real estate
owners, occupiers and investors
•
Productivity and cost solutions for corporate clients
seeking to optimize space and location
•
Industry leader recognized for deep market
knowledge and execution expertise
•
Strong cash-generating business model
•
Revenue growth
•
Investment-grade balance sheet
•
Effective tax and interest expense management
4
Advisory &
10%
Leasing
35%
Capital
Markets
14%
Project &
Development
Services
10%
Property &
Facility Mgmt.
23%
LaSalle Inv.
Mgmt.
7%
Other |
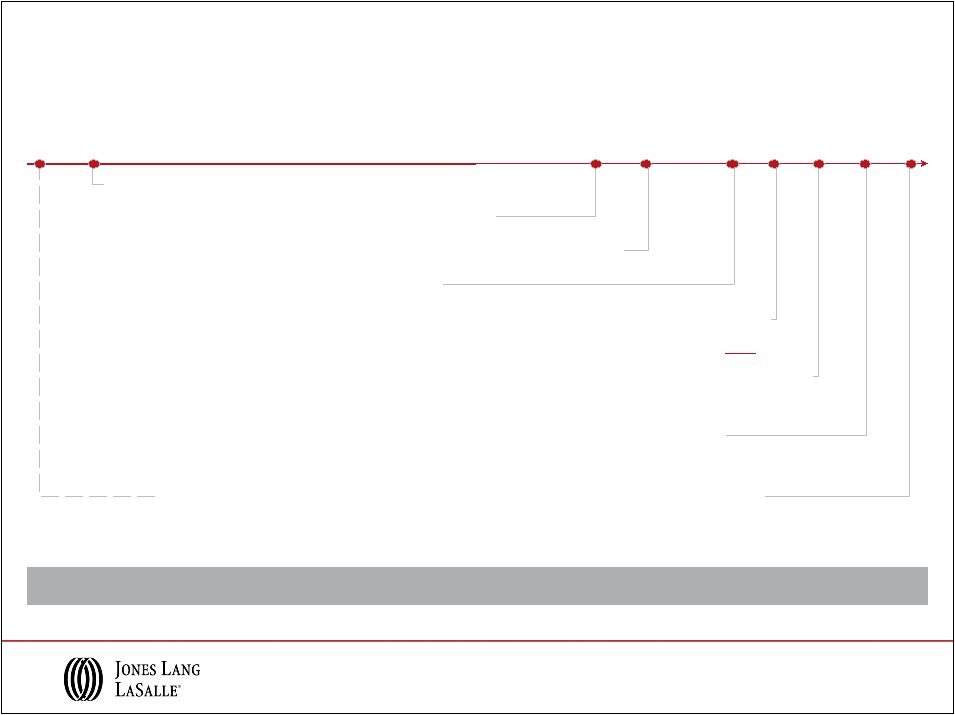 Jones
Lang Wootton founded in London 1783
1968
1997
1999
LaSalle Partners founded, operating primarily in the Americas
LaSalle Partners initial public offering
LaSalle Partners and Jones Lang Wootton merge to create Jones Lang LaSalle
Integrated
global
platform
(NYSE
ticker
“JLL”)
Transformational M&A Extends Market Positions
2011
2008
The Staubach Company and Jones Lang LaSalle combine operations
Largest merger in JLL history transforms U.S. local markets position
King Sturge (est. 1760) and Jones Lang LaSalle merge EMEA operations
Enhances strength and depth of service capabilities in the UK and EMEA
1760
14% compound annual revenue growth rate since 1999 merger between LaSalle Partners and
JLW 1957
Jones Lang Wootton expands into Asia Pacific
2007
Jones Lang LaSalle acquires Meghraj Property Consultants Private
Ltd. (est. 1995)
Establishes dominant market-leading position in India
5 |
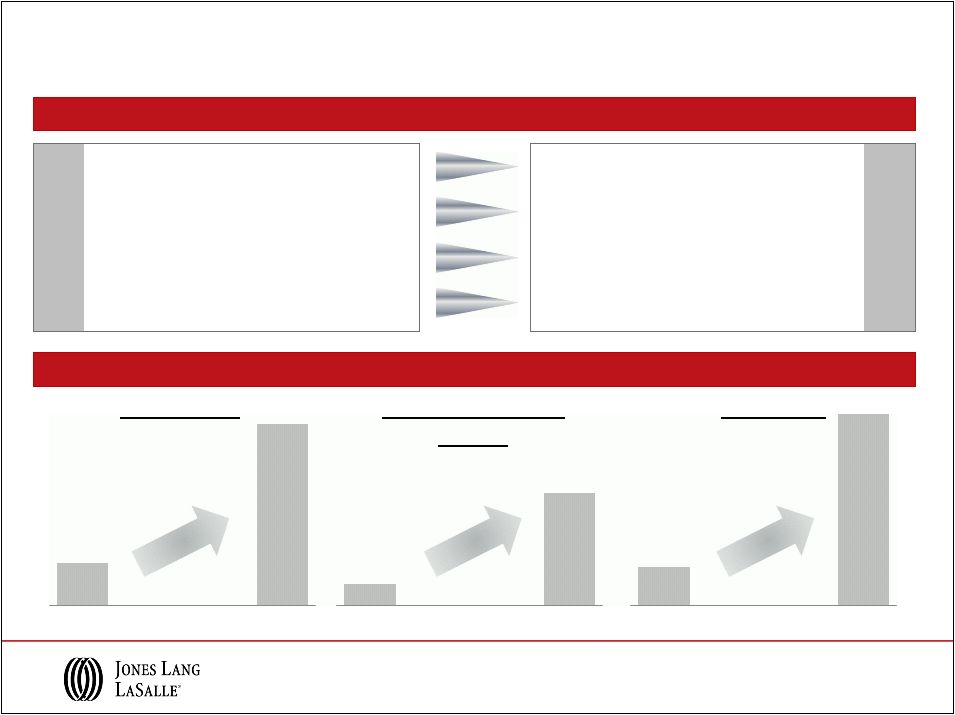 Jones Lang LaSalle Growth in a Consolidating Industry
Commercial Real Estate Services
•
Corporate real estate decisions frequently
de-centralized
•
Fragmented competitive landscape with
several large regional players
•
Investor capital deployed within
countries/regions
•
Market share spread across numerous
niche/middle-market competitors
•
Clients moving towards centralized,
sophisticated global CRE decisions
•
Global service providers positioned for
growth in recovering markets
•
Investor capital flows cross-border to
capture opportunity
•
Market share trending to established
brands; new entrants continue
Jones Lang LaSalle
($ in millions)
6
(1)
Based on peak share price in each year
Americas
6x
EMEA
3x
Asia
Pacific
5x
LIM
2x
(1)
~4x
~5x
~5x
$67
$340
2002
2012
Adjusted Operating
Income
$786
$3,836
2002
2012
Market Cap
$860
$3,640
2002
2012
Fee Revenue
2
0
1
3
2
0
0
2 |
 Market Share Expansion Drives Growth and Cash Flow
(In millions, except EPS)
2010
2011
2012
Growth
Revenue
$2,926
$3,585
$3,933
34%
Adjusted Net
Income
$166
$215
$245
48%
Adjusted
EBITDA
$337
$395
$436
29%
Adjusted
EPS
$3.77
$4.83
$5.48
45%
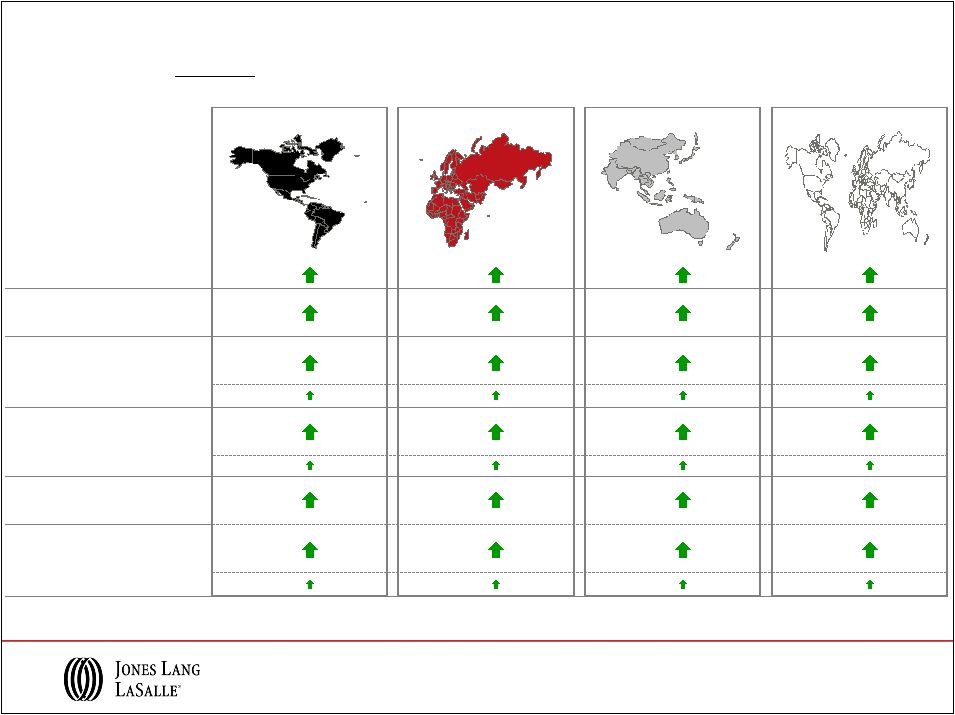
Market
Trends
Emerging markets
to lead global
expansion
Demand for
local and global
services
Outsourcing
growth
continues
Top asset
managers winning
investor mandates
Industry
consolidation
JLL Performance
7
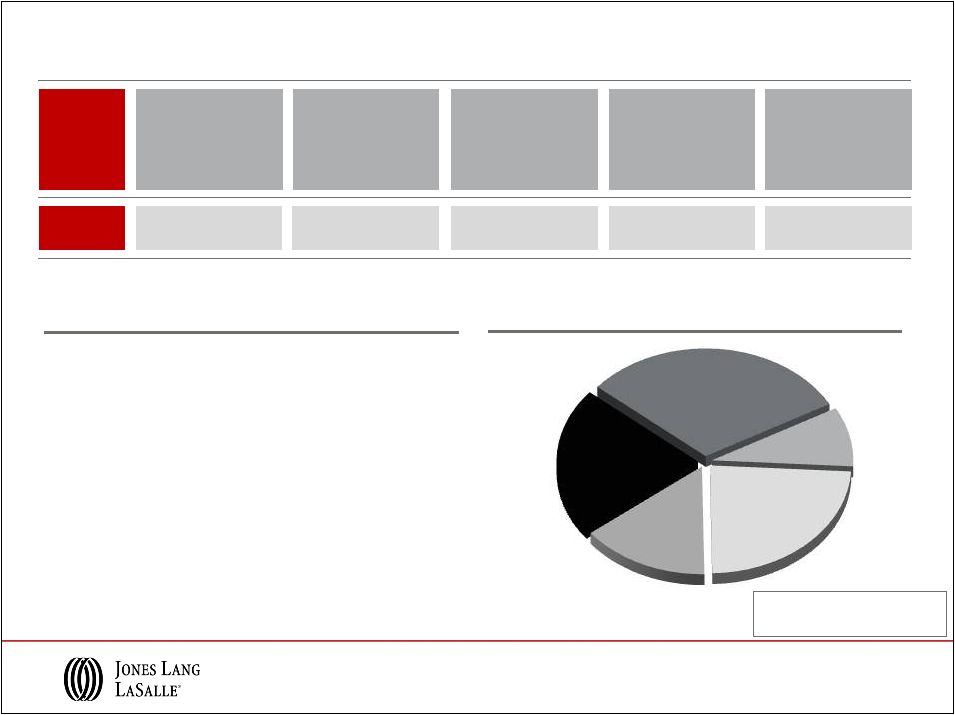
(1)
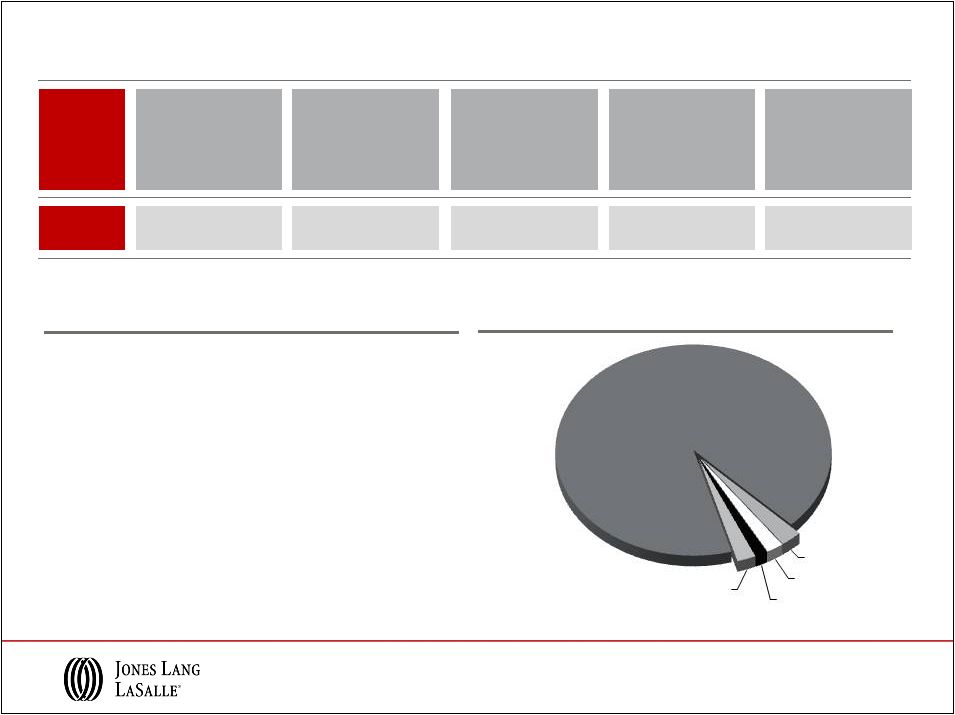
Other Financing Activities include change in working capital, debt issue costs and
share activity related to taxes on stock awards Deferred
Acquisition
Obligations
23%
New
Acquisitions
32%
CapEx
23%
Dividends
4%
Other
Financing
Activities
8%
Co-Investment
10%
3-Year Cash
from Earnings = $962M (1) |
 Leading Brand Well-Positioned for Growth
•
Capitalize on leading global markets positions for
improved transactional and annuity revenue
•
Continue Corporate Solutions leadership; capture
emerging sectors (e.g. Healthcare, Infrastructure)
•
Leverage LaSalle’s investment performance and
client loyalty for continued wins and capital raising
•
Pursue growth within G5 strategy and financial
objectives
8
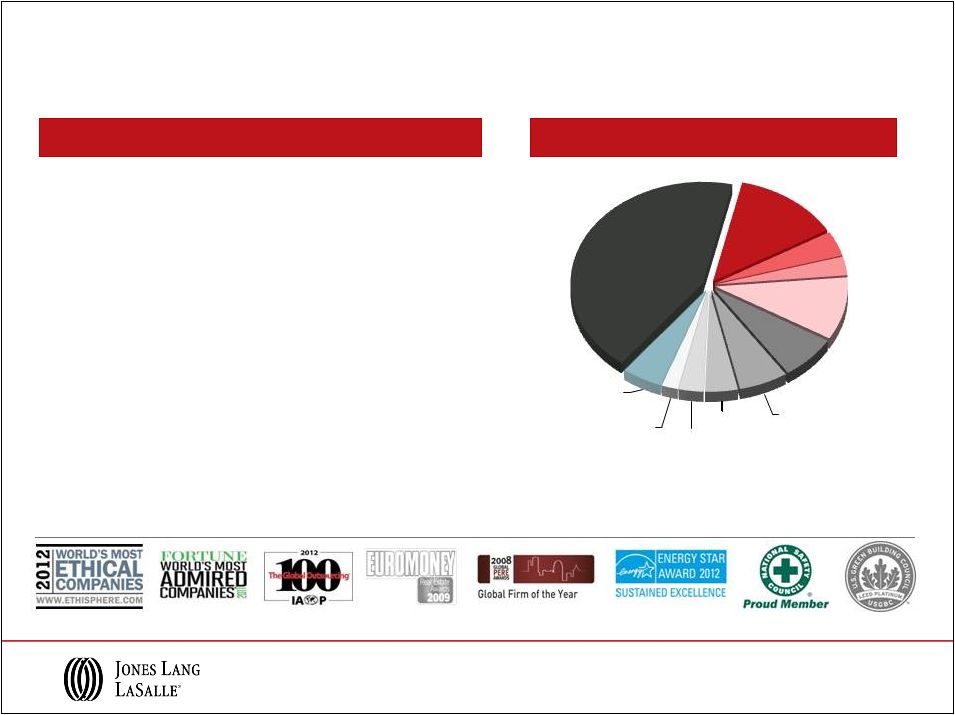
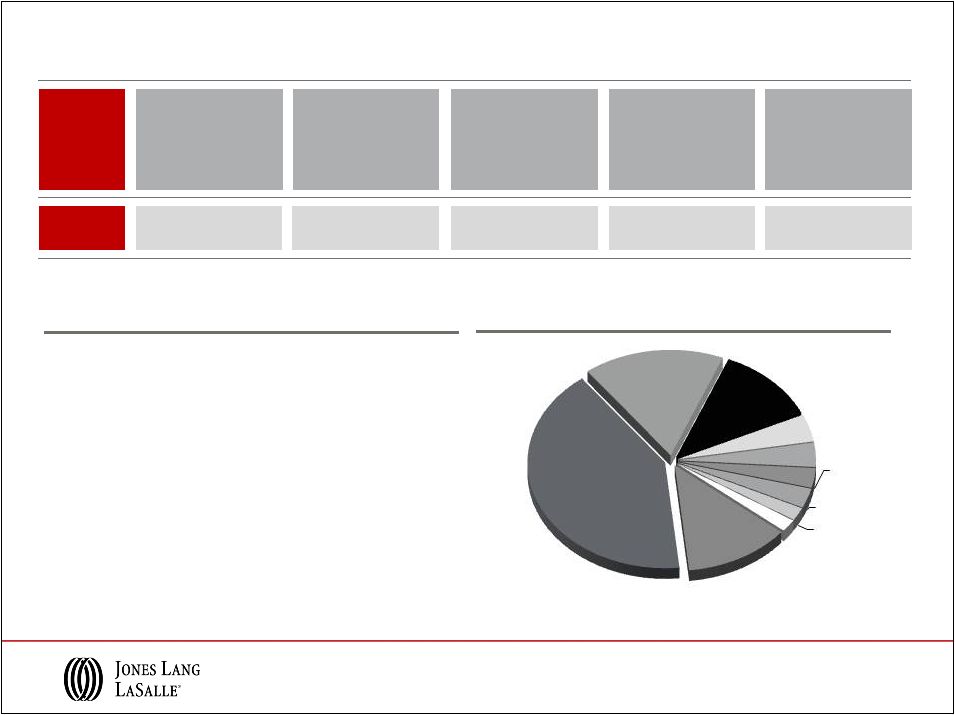
Jones Lang LaSalle Opportunity
2012 Revenue = $3.9B
United
States 43%
United
Kingdom
13%
France 4%
Germany 3%
Other
Europe 10%
Australia 7%
Greater
China (incl.
Hong Kong)
6%
Japan 4%
India 3%
Singapore
2%
Other 5% |
 Global
Growth Strategy |
 Jones Lang LaSalle Global Growth Strategy
G2
G1
G4
G3
G5
Connections
Build our local and regional
leasing and capital markets
businesses
Strengthen our winning
positions in Corporate
Solutions
Capture the leading
share of global capital
Grow LaSalle Investment
Management’s leadership
position
flows for investment sales
10 |
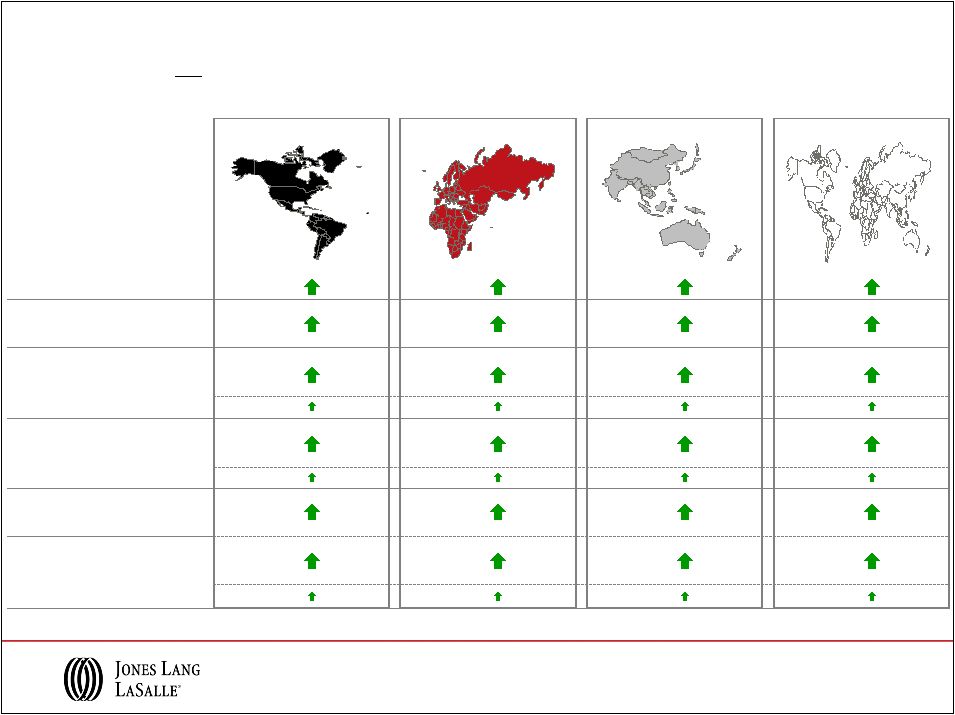
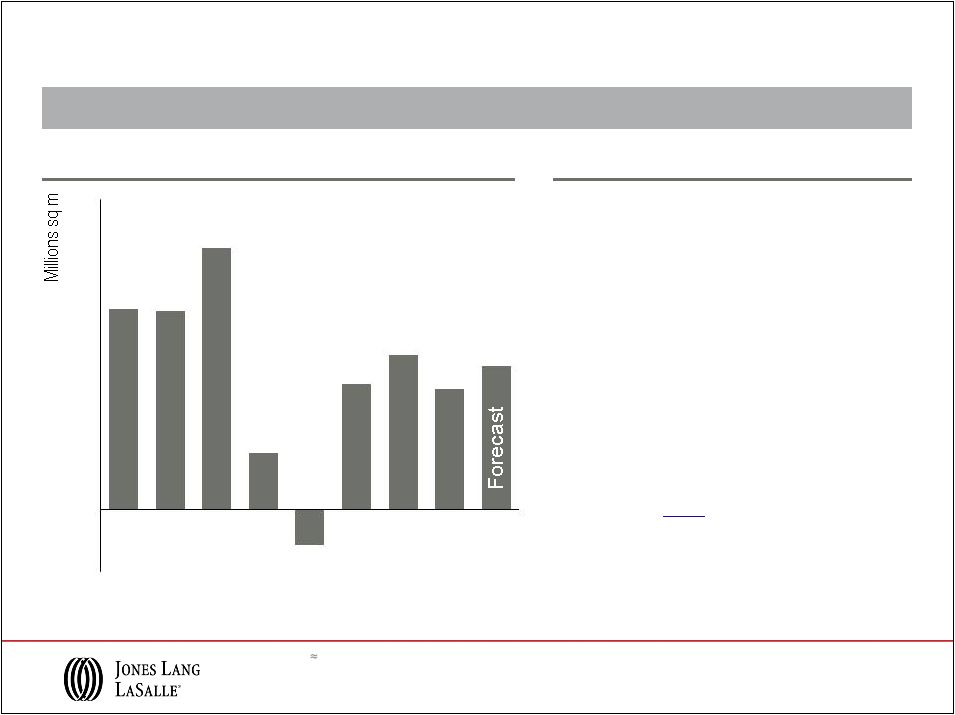 Leasing Trends and Expectations in Global Office Demand
Click here
to see the complete
JLL Global Markets Perspective
Note:
1
square
meter
10.8
square
feet
24 markets in Europe; 25 markets in Asia Pacific; 44 markets in the US. Asia
related to Grade A only. Source: Jones Lang LaSalle, January 2013
Modest leasing activity growth expected in 2013
11
Net Absorption Trends
Leasing Volumes
•
Overall, 0-5% growth over 2012 expected in
2013
with
momentum
building
in
2
nd
half
•
Americas growth estimates 0-5%
•
EMEA market recovery remains
constrained, flat to 2012
•
Asia Pacific demand is mixed, with full-year
expectations to be down 5-10% vs. 2012
16.2
16.0
21.1
4.6
-2.9
10.1
12.5
9.7
11.6
-
5
0
5
10
15
20
25
2005
2006
2007
2008
2009
2010
2011
2012
2013 |
 ($ in
billions) Global Capital Flows for Investment Sales
* EMEA: In US$ terms, unchanged in Euro terms.
Source: Jones Lang LaSalle, January 2013
Direct Commercial Real Estate Investment, 2005-2013
2013 volumes set to approach $500 billion, up
10-15% Exceptional end to 2012
pushes full-year volumes
slightly ahead of 2011
12
+15-20%
-5%
+15%
0
50
100
150
200
250
300
350
Americas
EMEA
Asia Pacific
2005
2006
2007
2008
2009
2010
2011
2012
2013 Projection |
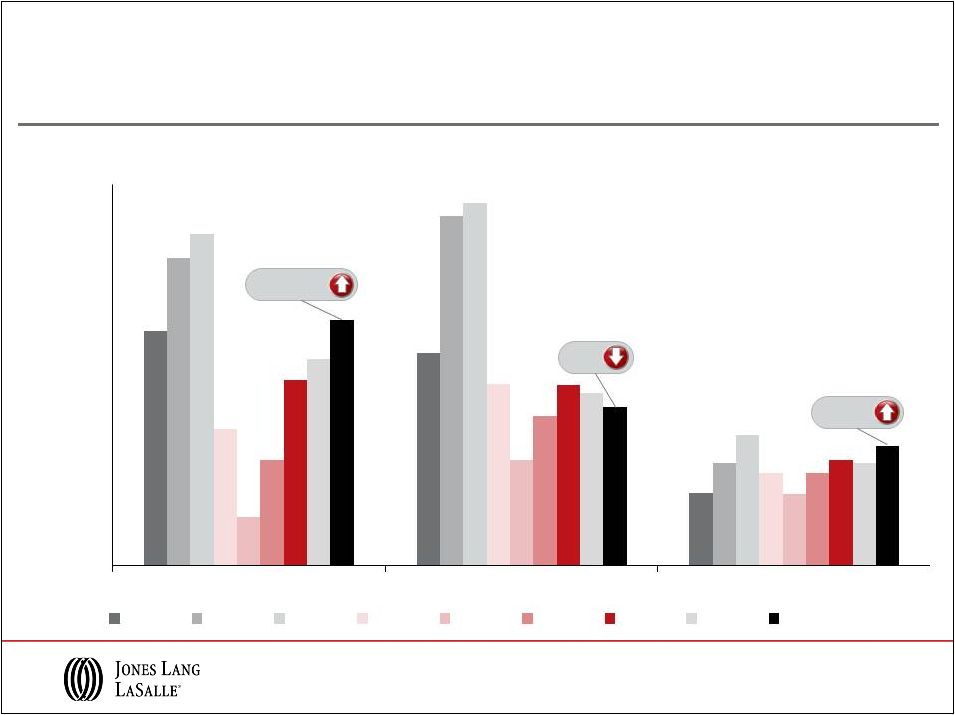
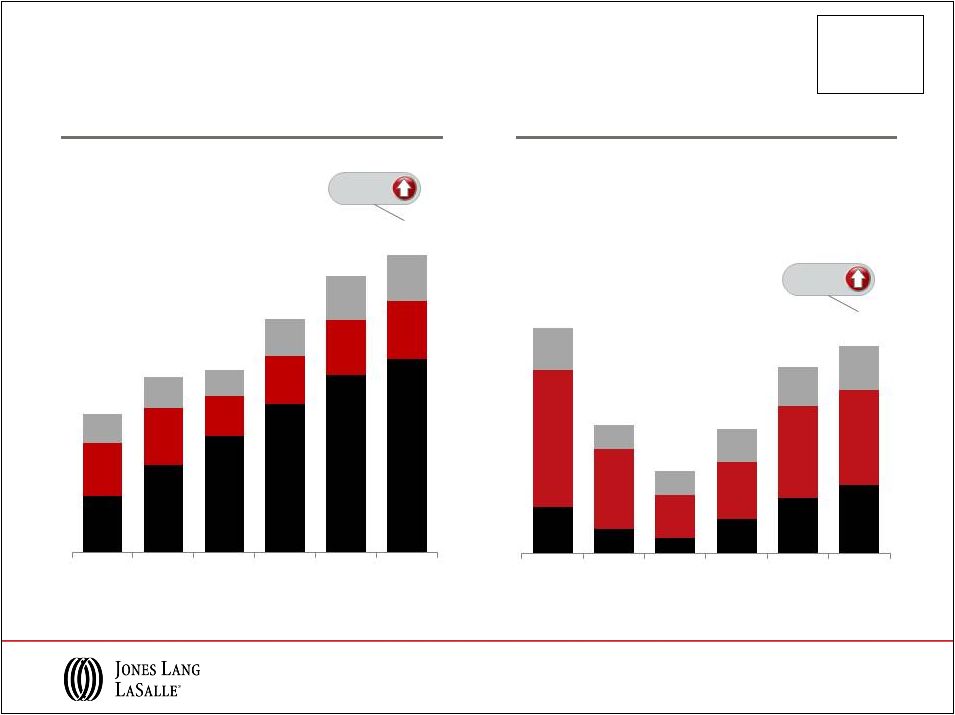 JLL Leasing and Capital Markets Revenue
Leasing
*July 2008: Staubach Company acquired, annual
revenue = $375 million
Asia Pacific
EMEA
Americas
*May 2011: King Sturge acquired, annual revenue =
$260 million
Capital Markets
13
($ in millions)
($ in millions)
$241
$373
$500
$638
$760
$830
$227
$247
$173
$203
$236
$250
$125
$133
$108
$159
$192
$198
2007
2008*
2009
2010
2011
2012
$114
$61
$38
$84
$136
$169
$339
$196
$107
$141
$229
$235
$104
$60
$58
$81
$95
$109
2007
2008
2009
2010
2011*
2012
$593
$781
$753
$1,000
$1,188
$1,278
$557
$317
$203
$306
$460
$513
+13%
+9% |
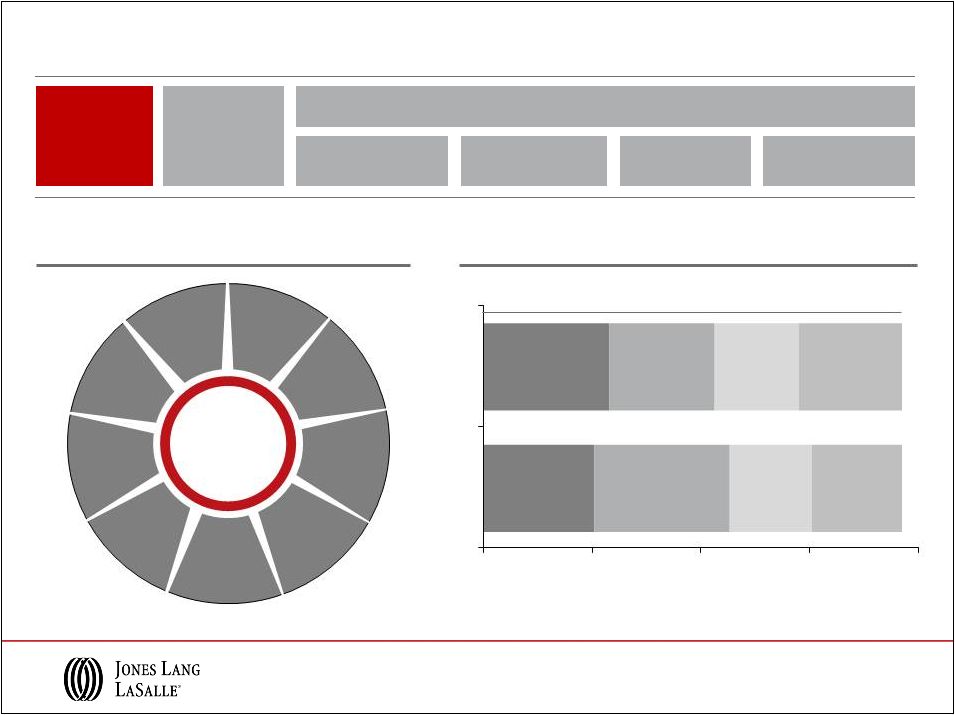 Corporate Solutions
JLL Service Offerings
JLL Client Wins
Competitive
Advantages
Global
Position
Expertise across services & geographies to capitalize on market trends
Space
optimization
Portfolio
transparency
Energy
management
Transformational
outsourcing
14
Middle Market
Large Corporates
Integrated
Facility
Management
Transaction
Advisory
Services
Project
Management
Lease
Administration
Labwell
Lab
Management
Energy &
Sustainability
Services
Strategic
Consulting
Corporate
Finance /
CMG
Client
Relationship
Management
Corporate
Retail
Services
Middle Market
Large Corporates
Wins
48
Expansions
39
Renewals
47
Wins
58
Wins
62
Expansions
38
Renewals
41
Wins
51
0
50
100
150
200
2
0
1
1
2
0
1
2 |
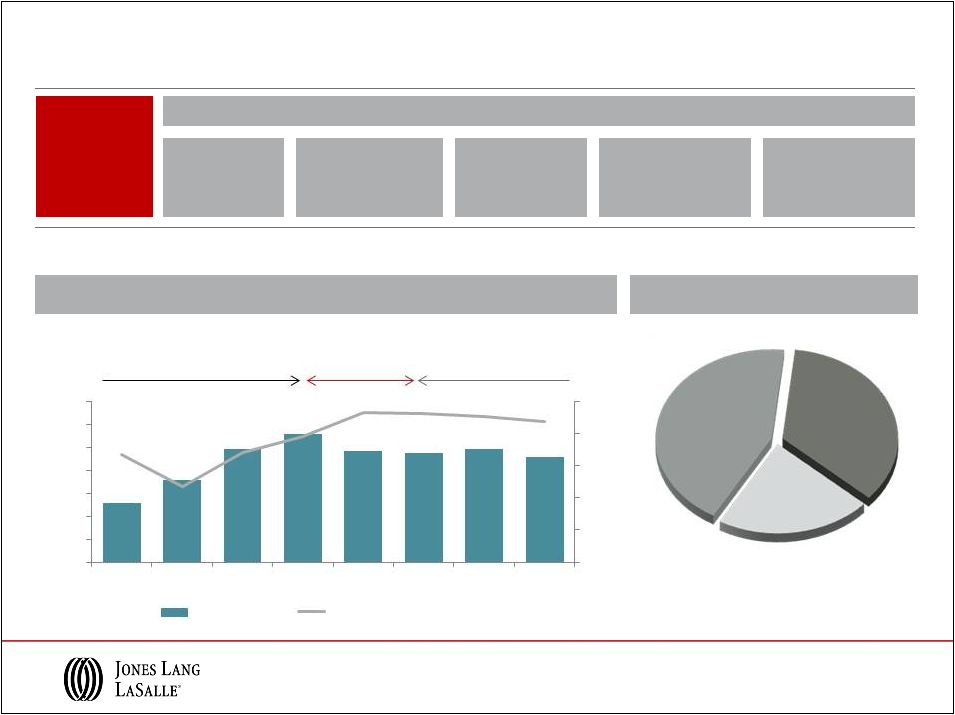 ($
millions) 2005 to 2012 Advisory Fees
LaSalle Investment Management
Global Financial
Crisis
Stabilized
Advisory Fees
Building Advisory Fees in
Healthy Markets
Competitive
Advantages
Diversified
global
platform
Proven performance history with long-standing client relationships
Core, Value Add,
Opportunistic,
Public Equity
300+
institutional
clients
Consistent client
services delivery
model
Financial backing
of well-capitalized
parent company
Current AUM by Fund Type
Q4 2012 AUM =
$47 B
($ in billions)
15
Separate
Accounts
$20.4
Fund
Management
$16.4
Public
Securities
$10.2
$128
$178
$245
$278
$242
$238
$245
$228
67%
47%
68%
78%
93%
92%
90%
88%
0%
20%
40%
60%
80%
100%
$0
$50
$100
$150
$200
$250
$300
$350
2005
2006
2007
2008
2009
2010
2011
2012
Advisory Fees
Advisory Fees as % of Revenue |
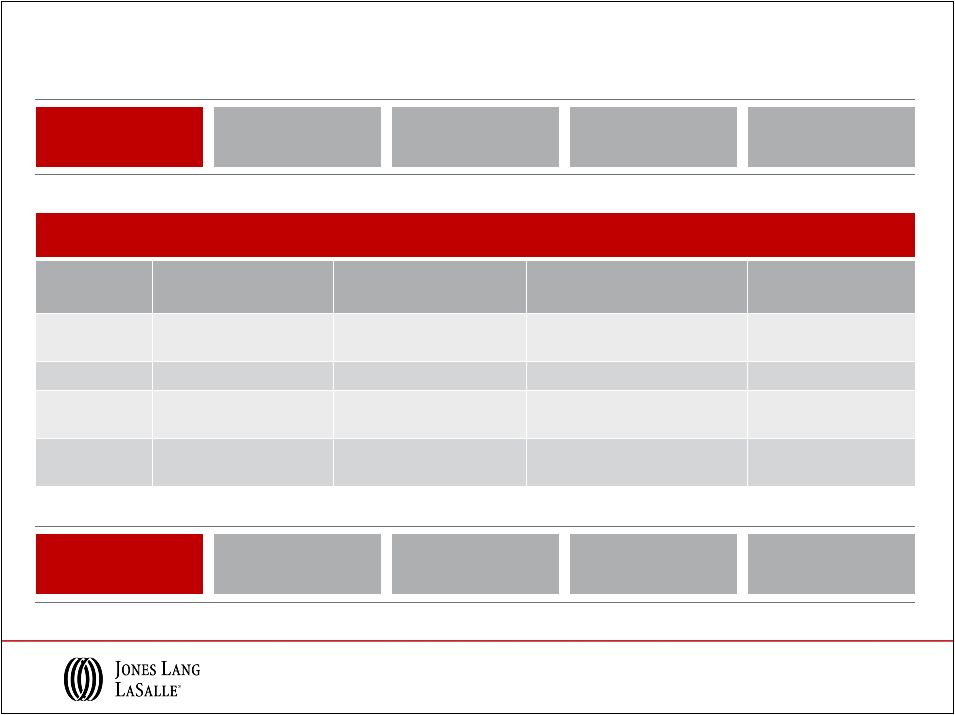 Consolidating Industry Leads to JLL Opportunity
Transformative Results
The Staubach
Company
King Sturge
Meghraj
Trinity Funds
Management
Strategy
Establish leading U.S. local
market tenant rep position
Strengthen local market
scale, particularly in the UK
Augment India corporate business
with leading local presence
Gain scale and credibility
in Australia for LaSalle
Purchase Price
$613 million
£197 million
$60 million
A$9 million
Payment
Structure
36% upfront;
64% deferred over 5 years
50% upfront;
50% deferred over 5 years
50% upfront:
50% deferred over 5 years
100% upfront
EBITDA
multiple
8.0x notional,
7.0x on PV basis
7.5x notional,
7.0x on PV basis
7.5x
4.0x
Strategic
Align with
G5 strategy
Enhance service
delivery for clients
Cultural
alignment
Meet
financial goals
Financial
Profit growth to
shareholders
Neutral to accretive
EBITDA multiples
EPS accretive within
12-18 months
Maintain investment
grade strength
16 |
 Financial Overview |
 Consolidated 2012 Earnings Scorecard
Note: 2012 and 2011 adjusted for restructuring and intangible amortization. See
Appendix for U.S. GAAP results. 2012
Fee
Revenue
Adjusted
Net Income
$245M
Adjusted
EPS
$5.48
Adjusted
EBITDA
$436M
Adjusted EBITDA
Margin
12.0%
Gross revenue : $3.9B
18
2011
$215M
$4.83
$395M
11.7%
$3.4B
US GAAP: $164M
US GAAP: $3.70
EBITDA: $339M
EBITDA margin: 9.5%
Gross Revenue: $3.6B
US GAAP: $208M
US GAAP: $4.63
EBITDA: $391M
EBITDA margin: 9.9%
•
Broad-based fee revenue increase of 10% in
local currency versus 2011
•
Solid Leasing performance and continued
growth in Property & Facility Management
•
2012 Adjusted EPS up 13% to $5.48
•
Market share growth and cost discipline
contributing to performance across the firm
2012 Highlights
Revenue Contribution
$3.6B
Margin is calculated on a fee revenue basis. See Appendix for calculation of fee
revenue. Americas
44%
EMEA
27%
Asia
Pacific
22%
LIM
7% |
 2012 Real Estate Services Revenue
($ in millions; % change in local currency
over FY 2011)
Note: Segment and Consolidated Real Estate Services (“RES”) operating
revenue exclude Equity earnings (losses). Fee revenue presentation of
Property & Facility Management, Project & Development Services and Total RES Operating Revenue excludes gross
contract costs.
19
Leasing
$829.6
9%
$250.0
11%
$198.2
4%
$1,277.8
9%
Capital Markets & Hotels
$168.5
25%
$235.1
5%
$109.3
15%
$512.9
13%
Property & Facility
Management
$458.7
32%
$155.2
9%
$398.4
10%
$1,012.3
19%
Fee Revenue
$375.0
15%
$155.2
9%
$319.9
13%
$850.1
13%
Project & Development
Services
$182.9
4%
$219.8
28%
$83.5
6%
$486.2
14%
Fee Revenue
$182.1
4%
$106.5
16%
$67.2
16%
$355.8
9%
Advisory,
Consulting & Other
$107.0
9%
$189.1
10%
$86.1
6%
$382.2
9%
Total RES Operating
Revenue
$1,746.7
15%
$1,049.2
12%
$875.5
9%
$3,671.4
13%
Fee Revenue
$1,662.2
11%
$935.9
9%
$780.7
11%
$3,378.8
10%
Americas
EMEA
Asia Pacific
Total RES |
 2012
Highlights •
Full-year fee revenue up 11% from 2011
•
Increases in both Capital Markets and
Leasing revenue outpaced the overall market
indicating gains in market share
•
Compensation expense accelerated by
elimination of the Stock Ownership Plan
(“SOP”) and Staubach acquisition payment in
Q4; Full-year 2012 EBITDA margin flat to 2011
after adjusting for these items
Americas Real Estate Services
2012
Segment
Profile
Fee Revenue
$1,662M
Operating Income
$168M
Operating Income
Margin
10.1%
EBITDA
$210M
EBITDA Margin
12.7%
YoY Growth: 11%
Note: Margin
is
calculated
on
a
fee
revenue
basis.
See
Appendix
for
calculation
of
fee
revenue.
EBITDA
margin
for
2012
and
2011
would
have
been
~13.0%
after
adjusting
2012
compensation
expense
for
the
Staubach
acquisition
payment
and
adjusting
2011
compensation expense for the elimination of SOP.
20
2011
Revenue by Geography
$1,504M
$163M
10.8%
$201M
13.4%
Brazil 3%
Canada 2%
Mexico 1%
Other
Americas 2%
United
States
92% |
 EMEA Real Estate Services
2012
Segment
Profile
Fee Revenue
$936M
Adj. Operating
Income
$58M
Adj. Operating
Income Margin
6.2%
EBITDA
$75M
EBITDA Margin
8.0%
YoY Growth: 9%
Note: Operating income has been adjusted to exclude $5 million of King Sturge
intangibles amortization. Margin is calculated on a fee revenue
basis. See Appendix for calculation of fee revenue. 21
2011
2012 Highlights
•
Broad-based fee revenue increase of 9% in
local currency versus 2011 led by 16%
increase in Project & Development Services
revenue
•
Solid performance in large markets and
positive earnings contribution from previous
loss-makers (e.g. Netherlands, MENA)
•
EBITDA margin of 8.0% compared with 6.5%
in 2011 driven by management actions
throughout the year
Revenue by Geography
$888M
$39M
4.4%
$57M
6.5%
U.K. 41%
France 17%
Germany
12%
Russia 4%
Spain 4%
Netherlands
3%
Belgium 3%
Italy 2%
MENA 2%
Other EMEA
12% |
 Asia Pacific Real Estate Services
2012
Segment
Profile
Fee Revenue
$781M
Operating Income
$65M
Operating Income
Margin
8.4%
EBITDA
$78M
EBITDA Margin
10.0%
YoY Growth: 11%
22
2011
2012 Highlights
•
Fee revenue growth of 9% in local currency
vs. prior year despite decrease in overall
market activity
•
Winning Corporate Solutions business
continues to generate profitable, recurring
revenue
•
Strong finish with significant EBITDA margin
improvement in Q4 2012
Revenue by Geography
$713M
$66M
9.3%
$78M
11.0%
Australia
31%
Greater
China (inc.
Hong Kong)
26%
India 13%
Japan 14%
Singapore
6%
Thailand 2%
New Zealand
2%
Other
Asia
6%
Note: Margin is calculated on a fee revenue basis. See Appendix for calculation
of fee revenue. |
 LaSalle Investment Management
2012
Segment
Profile
Revenue
$285M
Operating Income
$72M
Operating Income
Margin
25.2%
EBITDA
$74M
EBITDA Margin
25.9%
Note: AUM data reported on a one-quarter lag.
YoY Growth: 12%
23
2011
$275M
$57M
20.7%
$60M
21.7%
2012 Highlights
•
Large incentive fees and equity earnings
reflect good performance for clients and
contributed to EBITDA margin of 25.9%
•
New mandates and strategic partnerships
gaining traction; AUM in separate accounts
up 14% vs. last year
•
$4.7 billion of capital invested in 2012
stabilizing advisory fees
•
Smaller incentive fees and equity earnings
expected for 2013
Separate Accounts $20.4
Fund Management $16.4
($ in billions)
Q4 2012 AUM = $47 Billion
U.K.
$14.5
Continental
Europe
$4.2
North
America
$11.2
Asia
Pacific
$6.9
Public
Securities
$10.2 |
 Credit
Facility Capacity
$1.1B
Solid Cash Flows and Balance Sheet Position
2012 Key
Statistics
Cash from
Earnings
$335M
Total
Net Debt
$538M
Net Interest
Expense
$35.2M
Investment Grade
Ratings
Baa2
|
BBB-
2012 Highlights
($ in millions)
24
Cash Flows
2012
2011
Primary Uses
Capital Expenses
(1)
(95)
(92)
New Acquisitions
(28)
(252)
Deferred Acquisition Obligations
(144)
(164)
Co-Investment
(29)
(46)
Dividends
(18)
(13)
Net Cash Outflows
$ (314)
$ (567)
Balance Sheet
Cash
$ 152
$ 184
Short Term Borrowings
32
65
Credit Facility
169
463
Net Bank Debt
$ 49
$ 344
LT Senior Notes
275
-
Deferred Acquisition Obligations
214
299
Total Net Debt
$ 538
$ 643
•
Significant cash generation with $105 million of
net debt reduction
•
Issued $275 million, investment-grade 4.4%
Senior Notes
•
Accelerated $115 million of the final $156 million
Staubach deferred payment to December 2012
•
Strong Leasing performance resulted in
Staubach earn out of $36 million
(1)
Includes $12 million in 2012 of investments in a joint-venture entity required to
be consolidated under U.S. GAAP, but are offset in Financing
Activities
on
the
statement
of
cash
flows.
Net
of
this
JV
gross-up
and
cash
received
from
tenant
improvement
allowances, cash spent on capital expenditures was $80 million.
-
Diversified funding sources and extended maturities until 2022
-
$5 million paid in 2012, $31 million to be paid in H1 2013 and
recorded in Deferred Acquisition Obligations as of 12/31/12
-
Remaining $41 million to be paid as previously scheduled
|
 Continuing growth in corporate
outsourcing
On-going industry consolidation
trends continue
Key Takeaways
JLL
Integrated
global
services
Industry leading
research and
market expertise
Superior client
relationship
management
Strong
brand
Investment-grade
balance sheet
JLL actions for continued success
Optimism returning to global markets
Steady institutional capital flows
into global real estate
Leverage global positions to grow market share
and continue client success in local markets
Increase productivity and manage costs to
improve margin
Maintain financial strength and flexibility to
respond to opportunities and challenges
Continue to invest selectively and strategically
to capitalize on market consolidation
25 |
 Appendix |
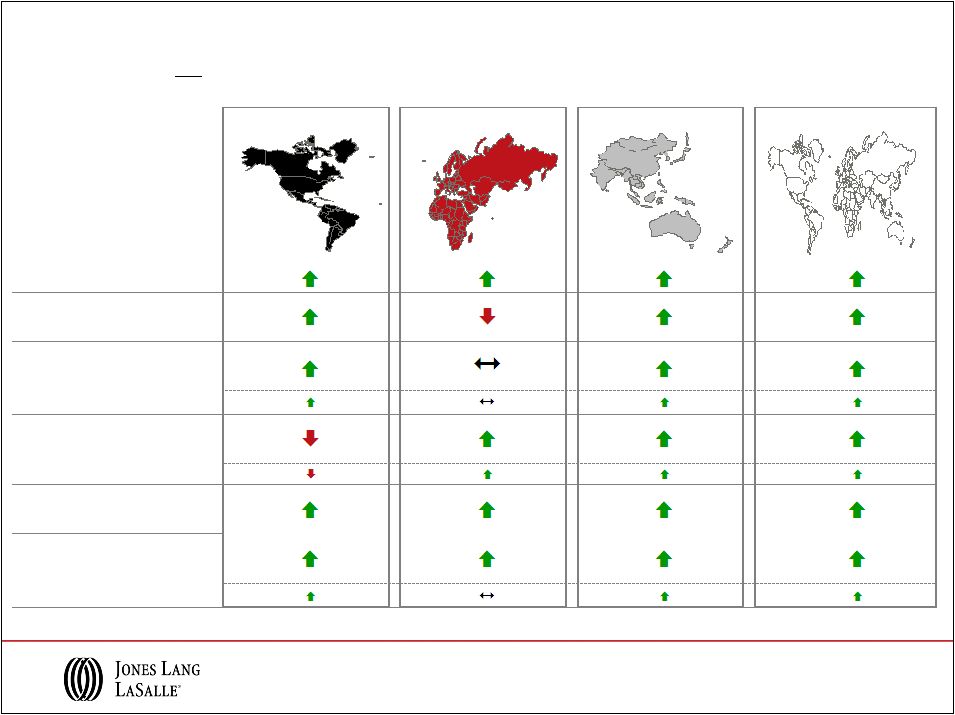
 as of
Q4 2012 Leasing Values
Source: Jones Lang LaSalle
Rental Value
growth slowing
Rental Value
growth
accelerating
Rental Values
bottoming out
Rental Values
falling
Madrid
Istanbul, Johannesburg,
Mumbai, New York,
Chicago,
Brussels,
Dubai, Frankfurt
Amsterdam,
Beijing,
Paris,
Shanghai
Milan
Seoul
Berlin
London,
Houston
Dallas,
London
Washington DC
Boston
Sao Paulo,
Stockholm
Hong Kong,
Singapore
Moscow,
Sydney
Los Angeles, Mexico City, Tokyo
Asia Pacific
EMEA
Americas
as of Q4 2012
Capital Values
Capital Value
growth slowing
Capital Value
growth
accelerating
Capital Values
bottoming out
Capital Values
falling
Milan
Madrid
Brussels,
Seoul
Hong Kong,
Paris,
Shanghai
Amsterdam,
Beijing,
Boston, Chicago, Los
Angeles, New York,
Shanghai
Sao Paulo
Dallas
Toronto
Mexico City,
Sydney
Moscow
Washington DC
Stockholm
Frankfurt
Berlin
London
Tokyo
Mumbai
Houston
JLL Property Clocks
27
San Francisco
Toronto
San Francisco
SM |
 FY 2012 Real Estate Services Revenue
($ in millions; % change in USD
over FY 2011)
Note: Segment and Consolidated Real Estate Services (“RES”) operating
revenue exclude Equity earnings (losses). Fee revenue presentation of
Property & Facility Management, Project & Development Services and Total RES Operating Revenue excludes gross
contract costs.
28
Leasing
$829.6
9%
$250.0
6%
$198.2
3%
$1,277.8
7%
Capital Markets & Hotels
$168.5
24%
$235.1
3%
$109.3
15%
$512.9
12%
Property & Facility
Management
$458.7
31%
$155.2
5%
$398.4
9%
$1,012.3
17%
Fee Revenue
$375.0
14%
$155.2
5%
$319.9
12%
$850.1
12%
Project & Development
Services
$182.9
3%
$219.8
21%
$83.5
3%
$486.2
10%
Fee Revenue
$182.1
2%
$106.5
11%
$67.2
13%
$355.8
7%
Advisory,
Consulting & Other
$107.0
9%
$189.1
6%
$86.1
6%
$382.2
7%
Total RES Operating
Revenue
$1,746.7
15%
$1,049.2
8%
$875.5
7%
$3,671.4
11%
Fee Revenue
$1,662.2
11%
$935.9
5%
$780.7
10%
$3,378.8
8%
Americas
EMEA
Asia Pacific
Total RES |
 Q4 2012 Real Estate Services Revenue
($ in millions; % change in USD
over December QTD 2011)
Note: Segment and Consolidated Real Estate Services (“RES”) operating
revenue exclude Equity earnings (losses). Fee revenue presentation of
Property & Facility Management, Project & Development Services and Total RES Operating Revenue excludes
gross contract costs.
Leasing
$278.9
8%
$83.7
3%
$76.6
11%
$439.2
7%
Capital Markets & Hotels
$59.4
23%
$94.9
8%
$40.1
82%
$194.4
12%
Property & Facility
Management
$133.2
13%
$42.4
0%
$108.3
7%
$283.9
9%
Fee Revenue
$111.1
10%
$42.4
0%
$88.9
13%
$242.4
9%
Project & Development
Services
$51.9
4%
$64.5
25%
$26.8
28%
$143.2
13%
Fee Revenue
$51.7
4%
$30.5
6%
$19.2
21%
$101.4
3%
Advisory,
Consulting & Other
$31.5
3%
$66.8
7%
$26.5
17%
$124.8
8%
Total RES Operating
Revenue
$554.9
9%
$352.3
4%
$278.3
18%
$1,185.5
9%
Fee Revenue
$532.6
8%
$318.3
0%
$251.3
20%
$1,102.2
8%
Americas
EMEA
Asia Pacific
Total RES
29 |
    Fee Revenue / Expense Reconciliation
•
Reimbursable vendor, subcontractor and out-of-pocket costs reported as revenue
and expense in JLL financial statements have been steadily increasing
•
Margins diluted as gross accounting requirements increase revenue and costs without
corresponding profit •
Business managed on a “fee”
basis to focus on margin expansion in the base business
($ in millions)
2012
2011
Consolidated Revenue
3,932.8
$
3,584.5
$
Consolidated Operating Expenses
3,598.0
3,277.2
Adjusted Operating Income Margin
8.6%
8.9%
Gross Contract Costs:
Property & Facility Management
83.7
20.4
Project & Development Services
0.8
0.5
Total Gross Contract Costs
84.5
20.9
Property & Facility Management
-
-
Project & Development Services
113.3
85.7
Total Gross Contract Costs
113.3
85.7
Property & Facility Management
78.5
82.3
Project & Development Services
16.3
21.6
Total Gross Contract Costs
94.8
103.9
Consolidated Fee Revenue
3,640.2
$
3,374.0
$
Consolidated Fee-based Operating Expenses
3,305.4
$
3,066.7
$
Adjusted Operating Income Margin (fee based)
9.3%
9.4%
YTD
Asia Pacific
Americas
EMEA
30
Note: Consolidated revenue and fee revenue exclude equity earnings (losses).
Restructuring and acquisition charges are excluded from operating
expenses. Restructuring and acquisition charges as well as intangible amortization related to the King
Sturge acquisition are excluded from operating expenses when calculating adjusted
operating income margin. |
 Reconciliation of GAAP Net Income to Adjusted Net Income
Twelve Months Ended
December 31,
($ in millions)
2012
2011
2010
GAAP Net income attributable to common shareholders
$ 207.6
$ 164.0
$ 153.5
Shares (in 000s)
44,799
44,367
44,084
GAAP earnings per share
$ 4.63
$ 3.70
$ 3.48
GAAP Net income attributable to common shareholders
$ 207.6
$ 164.0
$ 153.5
Restructuring and acquisition charges, net
34.1
41.9
4.9
Intangible amortization, net
3.7
8.6
-
Non-cash co-investment charges, net
-
-
7.9
Adjusted net income
$ 245.4
$ 214.5
$ 166.3
Shares (in 000s)
44,799
44,367
44,084
Adjusted earnings per share
$ 5.48
$ 4.83
$ 3.77
and Earnings per Share
31 |
 Reconciliation of Operating Income to Adjusted Operating
Income and GAAP Net Income to Adjusted EBITDA
Twelve Months Ended
December 31,
($ in millions)
2012
2011
2010
Operating Income
$289.4
$251.2
$260.7
Restructuring and acquisition charges
45.4
56.1
6.4
Intangible amortization
4.9
11.5
-
Non-cash co-investment charges
-
-
10.4
Adjusted Operating Income
$339.7
$318.8
$277.5
GAAP Net income attributable to common
shareholders
$207.6
$ 164.0
$ 153.5
Interest expense, net of interest income
35.2
35.6
45.8
Provision for income taxes
69.2
56.4
49.0
Depreciation and amortization
78.8
82.8
71.6
EBITDA
$390.8
$338.8
$319.9
Restructuring and acquisition charges
45.4
56.1
6.4
Non-cash co-investment charges
-
-
10.4
Adjusted EBITDA
$436.2
$394.9
$336.8
32 |
 Forward-looking statements
©
Jones Lang LaSalle IP, Inc. 2013. All rights reserved. No part of this publication may be
reproduced by any means, whether graphically, electronically, mechanically or
otherwise howsoever, including without limitation photocopying and recording on
magnetic tape, or included in any information store and/or retrieval system
without prior written permission of Jones Lang LaSalle IP, Inc.
33
Statements in this presentation regarding, among other things, future financial results
and performance, achievements, plans and objectives and dividend payments may be
considered forward-looking statements within the meaning of the Private
Securities Litigation Reform Act of 1995. Such statements involve known and
unknown risks, uncertainties and other factors which may cause actual results,
performance, achievements, plans and objectives of Jones Lang LaSalle to be materially
different from those expressed or implied by such forward-looking statements.
Factors that could cause actual results to differ materially include those
discussed under “ Business, ” “Risk Factors,”
“Management’s Discussion and Analysis of Financial Condition and Results of
Operations,” “Quantitative and Qualitative
Disclosures about Market Risk,”
“Cautionary Note Regarding Forward-Looking Statements” and
elsewhere in Jones Lang LaSalle’s Annual Report on Form 10
-K for the year ended December 31, 2012 and in other reports filed with
the Securities and Exchange Commission. There can be no assurance that future
dividends will be declared since the actual declaration of future dividends, and the establishment
of record and payment dates, remains subject to final determination by the Company’s
Board of Directors. Statements speak only as of the date of this
presentation. Jones Lang LaSalle expressly disclaims any obligation or undertaking
to update or revise any forward-looking statements contained herein to reflect
any change in Jones Lang LaSalle’s expectations or results, or any change in
events. |