Attached files
| file | filename |
|---|---|
| 8-K - FORM 8-K - BROADRIDGE FINANCIAL SOLUTIONS, INC. | d499500d8k.htm |
 March 12, 2013
Continued Market Leadership
through Execution and Innovation
Credit
Suisse
15 Annual
Global
Services
Conference
©
2013 Broadridge Financial Solutions, Inc.
Broadridge and the Broadridge logo are registered trademarks of Broadridge
Financial Solutions, Inc. Exhibit 99.1
th |
 1
Forward-Looking Statements
This
presentation
and
other
written
or
oral
statements
made
from
time
to
time
by
representatives
of
Broadridge
may
contain
“forward-
looking statements”
within the meaning of the Private Securities Litigation Reform Act of 1995.
Statements that are not historical in nature, and
which
may
be
identified
by
the
use
of
words
like
“expects,”
“assumes,”
“projects,”
“anticipates,”
“estimates,”
“we
believe,”
“could
be”
and other words of similar meaning, are forward-looking statements. In
particular, statements regarding our “Fiscal Year 2013 Financial
Guidance”
are forward-looking statements. These statements are based on
management’s expectations and assumptions and are subject to risks and
uncertainties that may cause actual results to differ materially from those expressed. These risks and uncertainties include
those
risk
factors
discussed
in
Part
I,
“Item
1A.
Risk
Factors”
of
our
Annual
Report
on
Form
10-K
for
the
fiscal
year
ended
June
30,
2012
(the “2012 Annual Report”), as they may be updated in any future reports
filed with the Securities and Exchange Commission. All forward-
looking statements speak only as of the date of this presentation and are expressly
qualified in their entirety by reference to the factors discussed in the
2012 Annual Report. These risks include: the success of Broadridge in retaining and selling additional services to its
existing clients and in obtaining new clients; Broadridge’s reliance on a
relatively small number of clients, the continued financial health of those
clients, and the continued use by such clients of Broadridge’s services with favorable pricing terms; changes in laws and regulations
affecting the investor communication services provided by Broadridge; declines in
participation and activity in the securities markets; overall market and
economic conditions and their impact on the securities markets; any material breach of Broadridge security affecting its
clients’
customer information; the failure of Broadridge’s outsourced data center
services provider to provide the anticipated levels of service; any
significant slowdown or failure of Broadridge’s systems or error in the performance of Broadridge’s services; Broadridge’s
failure to keep pace with changes in technology and demands of its clients;
Broadridge’s ability to attract and retain key personnel; the impact of
new acquisitions and divestitures; and competitive conditions. Broadridge disclaims any obligation to update or revise forward-
looking statements that may be made to reflect events or circumstances that arise
after the date made or to reflect the occurrence of unanticipated events,
other than as required by law. Non-GAAP Financial Measures
In certain circumstances, results have been presented that are not generally
accepted accounting principles measures (“Non-GAAP”) and
should be viewed in addition to, and not as a substitute for, the Company’s
reported results. Net earnings, diluted earnings per share and
pre-tax earnings margins excluding Acquisition Amortization and Other Costs and
Restructuring and Impairment Charges are Non-GAAP measures.
These
measures
are
adjusted
to
exclude
costs
incurred
by
the
Company
in
connection
with
amortization
and
other
charges
associated with the Company’s acquisitions, and the termination of the Penson
outsourcing services agreement, as Broadridge believes this information
helps investors understand the effect of these items on reported results and provides a better representation of our actual
performance. Free cash flow is a Non-GAAP measure and is defined as cash
flow from operating activities, less capital expenditures and purchases of
intangibles. Management believes this Non-GAAP measure provides investors with a more complete understanding of
Broadridge’s underlying operational results. These Non-GAAP measures
are indicators that management uses to provide additional meaningful
comparisons between current results and prior reported results, and as a basis for planning and forecasting for future periods.
Accompanying this presentation is a reconciliation of Non-GAAP measures to the
comparable GAAP measures. Use of Material Contained Herein
The
information
contained
in
this
presentation
is
being
provided
for
your
convenience
and
information
only.
This
information
is
accurate
as of the date of its initial presentation. If you plan to use this
information for any purpose, verification of its continued accuracy is your
responsibility. Broadridge assumes no duty to update or revise the
information contained in this presentation. You may reproduce
information contained in this presentation provided you do not alter, edit, or
delete any of the content and provided you identify the source of the
information as Broadridge Financial Solutions, Inc., which owns the copyright.
Broadridge and the Broadridge logo are registered trademarks of Broadridge
Financial Solutions, Inc. |
 2
Broadridge is a strong, resilient business
with significant growth potential
History of market leadership
–
Proven ability to address increasingly complex customer needs
through technology
–
Innovation and thought leader in industry for >50 years
Strong position in large and attractive markets
–
Leader in investor communications and global securities
processing –
Resilient through financial crisis due to mission-critical nature of
services –
Deeply respected by industry and regulators
–
Room for expansion into naturally adjacent markets
–
Leading the digital transformation of financial communications through
Broadridge
Fluent
SM
,
the
next
meaningful
step
forward
in
client
engagement
Excellent team
–
Results-driven and deeply experienced management team aligned
with long-term interests of shareholders
–
Highly engaged associates -
one of the best large companies to work for in
NY
1
for
6
th
consecutive
year
1. As recognized by the NY Society of Human Resources in
2008-2013 |
 3
Our market position is differentiated
and sustainable
Recurring Fee Revenue
Investor Communication Solutions
$B
1.5
0.5
2012
2007
Growth through difficult
market environment
•
Proxy services for ~85%
of outstanding
shares in US
•
Processed >600 billion shares in 2012
•
Used by >5,500 institutional investors
globally
•
Eliminates >50%
of physical mailings
•
~450K
votes through mobile apps during
2012 proxy season
New businesses
Tuck-in acquisitions
Broadridge is well positioned to accelerate growth
and continue driving strong free cash flow
~7% CAGR
Securities Processing Solutions
Enable clients
to process in
>50 countries
Processes >$4.5 trillion
(average) in equity and
fixed income trades per
day
1.0 |
 4
Investor Communication
Solutions
Securities Processing
Solutions
We are the leader in several markets
Market
Rank
Bank/Broker-Dealer
Regulatory
Communications
Broker-Dealer
Transactional
Communications
Corporate Issuer
Regulatory
Communications
Mutual Fund Proxy
Mail and Tabulation
Market
Rank
US Brokerage
Processing
US Fixed Income
Processing
Canadian Brokerage
Processing
#1
#1
#1
#1
#1
#1
#1
1. Marketshare based on Broadridge estimates
1
1 |
 5
Investor Communication Solutions (ICS)
A Leader in Financial Communications |
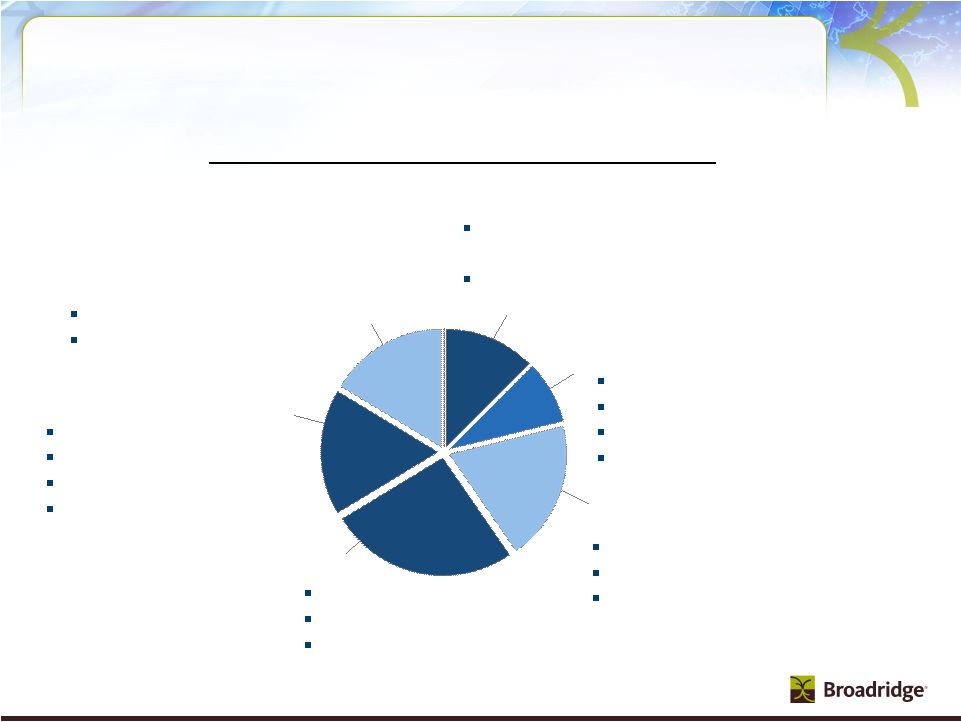 6
Mutual Fund—Natural adjacencies
Transaction reporting
Imaging and workflow, etc.
Mutual Fund—Core
Retirement processing
Data aggregation
Marketing communications
Proxy/solicitation
Large and attractive markets –
Investor
Communications is a $10B+ market
BBD—Emerging products
Global proxy and communications
Tax reporting and outsourcing
Security class actions
Advisor services
Bank/Broker-Dealer (BBD)—Core
Regulatory communications
(proxy, interims, etc.)
Customer communications
(transaction statements, etc.)
Total addressable market $10B+ fee revenue
Issuer
Transfer agency
Shareholder analytics
Investor communications
BBD—Natural adjacencies
Enterprise archiving
On-boarding
International tax reclaim
$1.3B
$0.9B
$2.0B
$3.0B
$1.8B
$1.7B
Sources: BCG, Bain, Patpatia, Broadridge estimates |
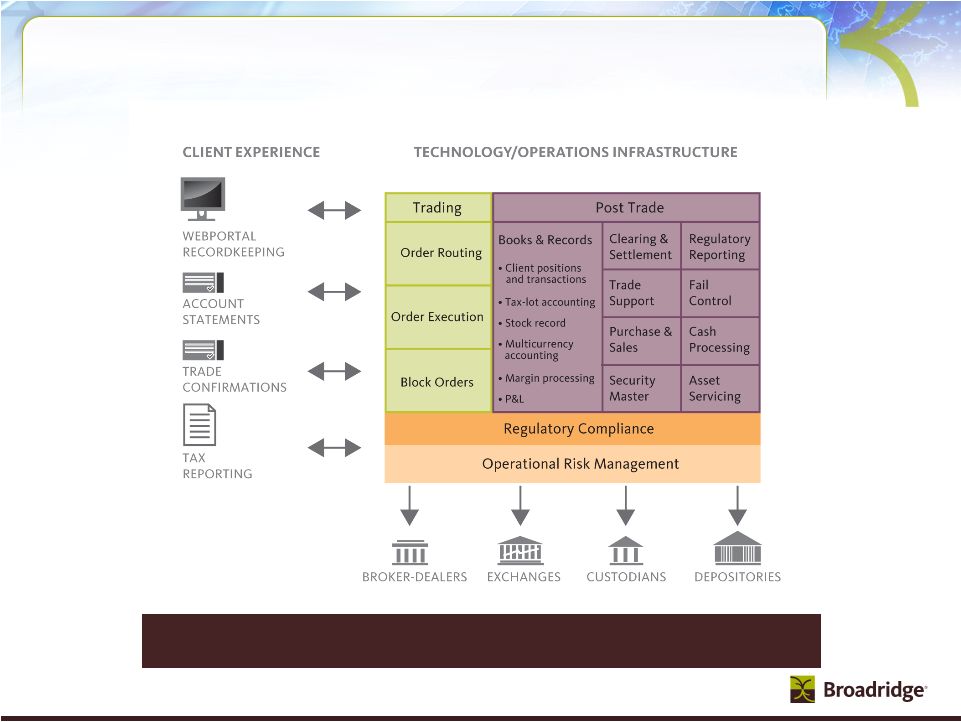
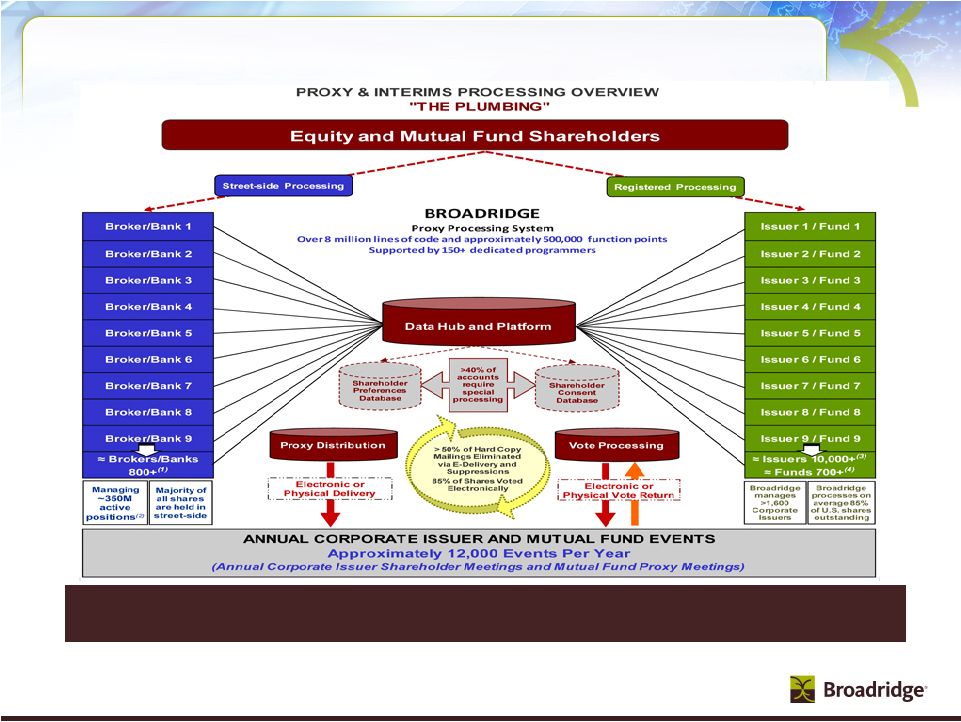 7
ICS Unique Business Systems Processing Model
Proxy and Interim processing system is the “plumbing”
supporting the voting
process for corporate governance
(1)
Represents Broadridge’s estimated total number of brokerage firms
and banks in the U.S. and international markets (2)
Represents Broadridge’s estimated total number of positions
managed by U.S. brokers and banks (3)
Represents Broadridge’s estimated total number of corporate
issuers in the U.S. (4)
Represents
total
number
of
Fund
Sponsors
in
the
U.S.
who
manage
over
16,000
funds
including
Mutual
Funds,
Closed-end
Funds,
ETFs
and
UITs,
according
to
the
Investment Company Institute’s 2009 Investment Company Year Book
|
 8
Securities Processing Solutions (SPS)
A Leader in Financial Processing |
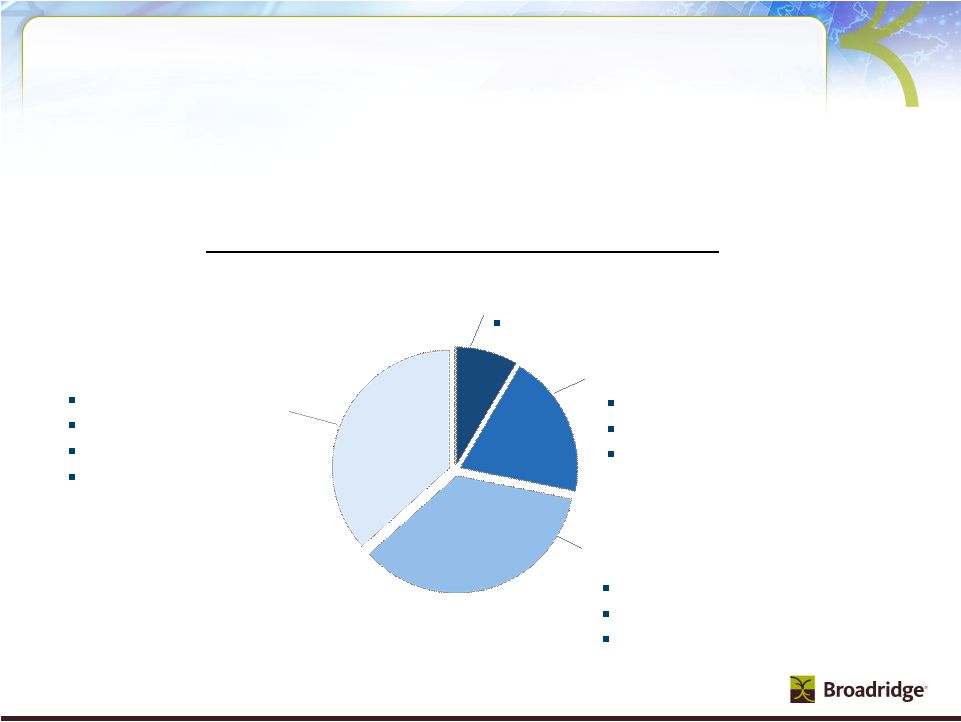 9
Sources: Tower Group, Chartis, Aite, IM2, Broadridge internal estimates
Technology and Operations spend adds
~$14B to our SPS addressable market
Securities and investment firms’
overall technology and operations
spend is over $100 billion and growing at 5%
$1.2B
$2.8B
~$5.0B
Adjacent markets
Middle-office
Buy-side services
Derivatives processing
Fixed Income market
data and analytics
~$5.2B
North American BPO
Middle-
and back-office
Data center services
Select corporate functions
US Brokerage Processing
Core equities and fixed income
Global Processing
Core equities and fixed income
Global BPO
Reconciliations
Total addressable market ~ $14B fee revenue |
 10
Broadridge global processing behind the scenes
Broadridge simplifies complex processes |
 11
Our financial strategy is a key part of our
value creation strategy
~40% dividend payout, but expect no less than 72 cents
per share annually subject to Board approval
Organic growth with limited financial risk
–
Avoid significant balance sheet risk
–
Invest in projects delivering at least 20% IRR
–
Recurring
closed
sales
averaged
~$120M
in
each
of
the
last
3
years.
This
includes
large
transactions
(>$5M)
which
are
lumpy
and
therefore
impact
quarter
over
quarter
comparisons
Tuck-in acquisitions with clear growth profile and returns
–
Accretive to growth, margins, and earnings
–
>20% IRR in conservative business case
–
On track to generate ~$185M fee revenue (~$250M in total revenue) with
~$50M in EBITDA or >25% margins in FY13
Long-term
investment-grade
debt
rating
–
Adjusted
Debt/EBITDAR
ratio¹
target
is
2:1
Excess cash used opportunistically to offset dilution and reduce
share count through buybacks
1. Adjusted Debt/EBITDAR ratio calculated as (Debt + 8x Rent Expense) / (EBITDA +
Rent Expense) |