Attached files
| file | filename |
|---|---|
| 8-K - FORM 8-K DATED MARCH 12, 2013 - AmREIT, Inc. | amreit131157_8k.htm |
AmREIT Corporate Presentation MARCH 2013
Forward - Looking Statements I Cautionary Statement Regarding Forward - Looking Statements These materials contain “forward - looking statements” within the meaning of Section 27A of the Securities Act of 1933, as amended, or the Securities Act, and Section 21E of the Securities Exchange Act of 1934, or the Exchange Act. Forward - looking statements provide the Company ’s current expectations or forecasts of future events and are not statements of historical fact. These forward - looking statements include information about possible or assumed future events, including, among other things, discussion and analysis of the Company’s future financial condition, results of operations, the Company’s strategic plans and objectives, occupancy and leasing rates and trends, amounts of anticipated cash distributions to stockholders in the future and other matters. Words such as “anticipates,” “expects,” “intends,” “plans,” “believes,” “seeks,” “estimates” and variations of these words and other similar expressions are intended to identify forward - looking statements. These statements are not guarantees of future performance and are subject to risks, uncertainties and other factors, some of which are beyond the Company’s control, are difficult to predict and/ or could cause actual results to differ materially from those expressed or forecasted in the forward - looking statements. Forward - looking statements involve inherent uncertainty and may ultimately prove to be incorrect or false. You are cautioned to not place undue reliance on forward - looking statements. Except as otherwise may be required by law, the Company undertakes no obligation to update or revise forward - looking statements to reflect changed assumptions, the occurrence of unanticipated events or actual operating results. The Company’s actual results could differ materially from those anticipated in these forward - looking statements as a result of various factors, including, but not limited to: • Risks and uncertainties related to the recent economic recession, the national and local economies, and the real estate industry in general and in the Company’s specific markets (including the state of Texas, generally, and the Company’s core markets of Houston, Dallas, San Antonio and Austin, specifically); volatility in the capital markets; rising interest and insurance rates; competition from third - party owners and operators of retail real estate and the Company’s inability to obtain new tenants on favorable terms, or at all, upon the expiration of existing leases; availability and terms of capital and financing, both to fund operations and to refinance indebtedness as it matures; legislative or regulatory changes, including changes to real estate, zoning and construction laws; a possible failure to maintain the Company’s status as a REIT and the risk of changes in laws governing REITs; the Company’s dependence upon key personnel whose continued service is not guaranteed; the Company’s ability to identify, hire and retain highly qualified executives in the future; availability of appropriate acquisition, development and redevelopment opportunities; failure to integrate acquisitions successfully; the financial condition and liquidity of, or disputes with, joint venture and development partners; impact of ad valorem, property and income taxes; changes in generally accepted accounting principles; construction delays, increasing construction costs or construction costs that exceed estimates; potential liability for uninsured losses and environmental liabilities; lease - up risks; and the potential need to fund improvements or other capital expenditures out of operating cash flow. This list of risks and uncertainties, however, is only a summary of some of the most important factors and is not intended to be exhaustive. You should carefully read the section entitled “Risk Factors” in our various Company documents filed with the SEC. New risks and uncertainties may also emerge from time to time that could materially and adversely affect the Company. All forward - looking statements are based on information available to the Company on this date and the Company assumes no obligation to update or revise any forward - looking statements, whether as a result of new information, future events or otherwise.
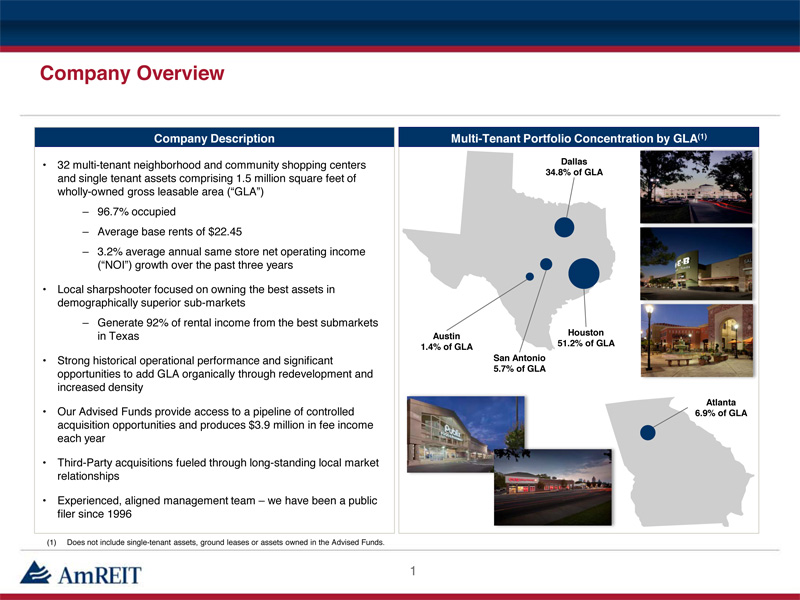
Company Description • 32 multi - tenant neighborhood and community shopping centers and single tenant assets comprising 1.5 million square feet of wholly - owned gross leasable area (“GLA ”) – 96.7% occupied – Average base rents of $22.45 – 3.2% average annual same store net operating income (“NOI”) growth over the past three years • Local sharpshooter focused on owning the best assets in demographically superior sub - markets – Generate 92% of rental income from the best submarkets in Texas • Strong historical operational performance and significant opportunities to add GLA organically through redevelopment and increased density • Our Advised Funds provide access to a pipeline of controlled acquisition opportunities and produces $3.9 million in fee income each year • Third - Party acquisitions fueled through long - standing local market relationships • Experienced, aligned management team – we have been a public filer since 1996 Company Overview 1 Multi - Tenant Portfolio Concentration by GLA (1) Houston 51.2% of GLA Dallas 34.8% of GLA San Antonio 5.7% of GLA Austin 1.4% of GLA Atlanta 6.9% of GLA (1) Does not include single - tenant assets, ground leases or assets owned in the Advised Funds.

2012 Highlights 2012 Financial Highlights 2 • Core FFO available to common stockholders for the year ended December 31, 2012 was $14.6 million, or $1.08 per share, as compared to Core FFO guidance of $1.04 - $1.09 per share • Same - store net operating income (“NOI”) increased 3.0% over the year ended December 31, 2011 – Portfolio occupancy as of December 31, 2012 was 96.7%, an increase of approximately 80 basis points as compared to portfolio occupancy of 95.9% as of December 31, 2011 • AmREIT signed 35 leases for approximately 128,498 square feet of GLA, including both new and renewal leases • Cash leasing spreads (i.e. new leasing rate per square foot compared to the expiring leasing rate per square foot) increased 5.7% for renewals and 28.0% for new comparable leases 2012 Accomplishments and Other Activities • On July 26, 2012, the Company priced its $58.1 million IPO of its Class B common stock, selling 3,650,000 shares of Class B common stock at $14.00 per share and on August 24, 2012 the over - allotment was partially exercised for an additional 503,226 shares • On August 6, 2012, the Company closed on its $75 million unsecured revolving credit facility with a three - year initial term and one - year extension • On December 12, 2012, the Company acquired Preston Royal Village, a 230,000 square foot grocery - anchored shopping center at the northwest and northeast corners of Preston and Royal in Dallas Texas for approximately $66 million • Announced that our Board of Directors has approved a quarterly cash dividend of $0.20 per share for stockholders of record on March 19, 2013 and payable on March 29, 2013 • AmREIT has delivered stock price appreciation of 23.6% since its IPO pricing date (1) Sources: Company filings and SNL as of 2/28/2013. (1) As of closing price on 2/28/13. 2013 Key Initiatives • Organic growth through incremental redevelopment • External growth in our core markets • Internal growth through portfolio operations • Accretive capital recycling
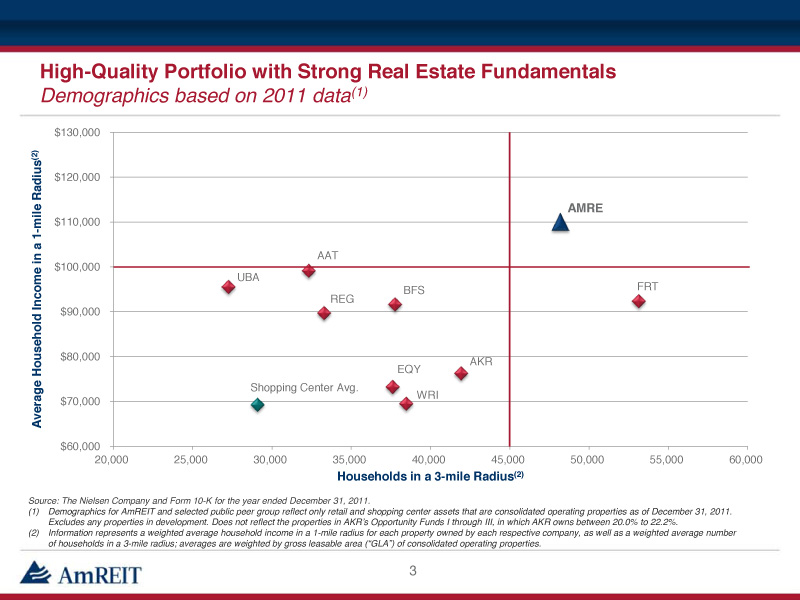
AMRE AAT AKR BFS FRT EQY REG UBA WRI Shopping Center Avg. $60,000 $70,000 $80,000 $90,000 $100,000 $110,000 $120,000 $130,000 20,000 25,000 30,000 35,000 40,000 45,000 50,000 55,000 60,000 Average Household Income in a 1 - mile Radius (2) Households in a 3 - mile Radius (2) High - Quality Portfolio with Strong Real Estate Fundamentals Demographics based on 2011 data (1) 3 Source: The Nielsen Company and Form 10 - K for the year ended December 31, 2011. (1) Demographics for AmREIT and selected public peer group reflect only retail and shopping center assets that are consolidated operating properties as of December 31, 2011 . Excludes any properties in development. Does not reflect the properties in AKR’s Opportunity Funds I through III, in which AK R o wns between 20.0% to 22.2%. (2) Information represents a weighted average household income in a 1 - mile radius for each property owned by each respective company , as well as a weighted average number of households in a 3 - mile radius; averages are weighted by gross leasable area (“GLA”) of consolidated operating properties.
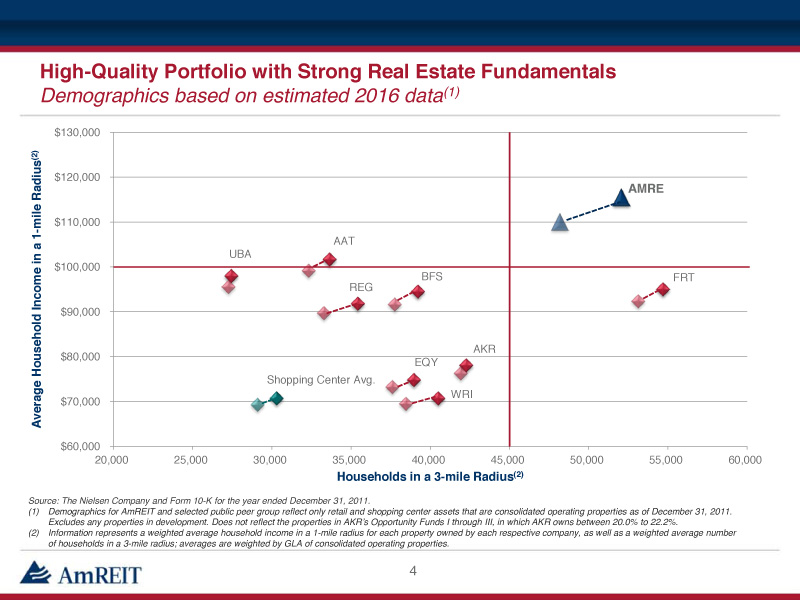
AMRE AAT AKR BFS FRT EQY REG UBA WRI Shopping Center Avg. $60,000 $70,000 $80,000 $90,000 $100,000 $110,000 $120,000 $130,000 20,000 25,000 30,000 35,000 40,000 45,000 50,000 55,000 60,000 Average Household Income in a 1 - mile Radius (2) Households in a 3 - mile Radius (2) High - Quality Portfolio with Strong Real Estate Fundamentals Demographics based on estimated 2016 data (1) 4 Source: The Nielsen Company and Form 10 - K for the year ended December 31, 2011. (1) Demographics for AmREIT and selected public peer group reflect only retail and shopping center assets that are consolidated operating properties as of December 31, 2011 . Excludes any properties in development. Does not reflect the properties in AKR’s Opportunity Funds I through III, in which AK R o wns between 20.0% to 22.2%. (2) Information represents a weighted average household income in a 1 - mile radius for each property owned by each respective company , as well as a weighted average number of households in a 3 - mile radius; averages are weighted by GLA of consolidated operating properties.
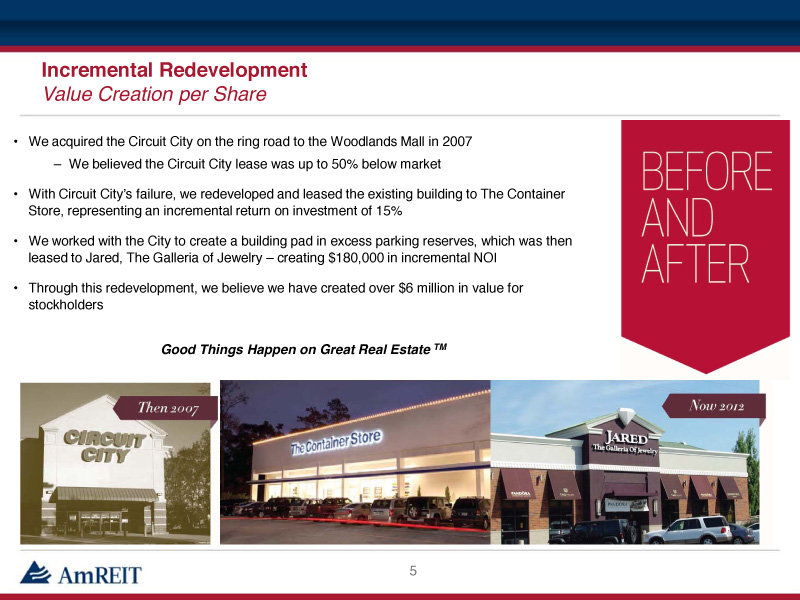
5 Incremental Redevelopment Value Creation per Share • We acquired the Circuit City on the ring road to the Woodlands Mall in 2007 – We believed the Circuit City lease was up to 50% below market • With Circuit City’s failure, we redeveloped and leased the existing building to The Container Store, representing an incremental return on investment of 15% • We worked with the City to create a building pad in excess parking reserves, which was then leased to Jared, The Galleria of Jewelry – creating $180,000 in incremental NOI • Through this redevelopment, we believe we have created over $6 million in value for stockholders Good Things Happen on Great Real Estate TM
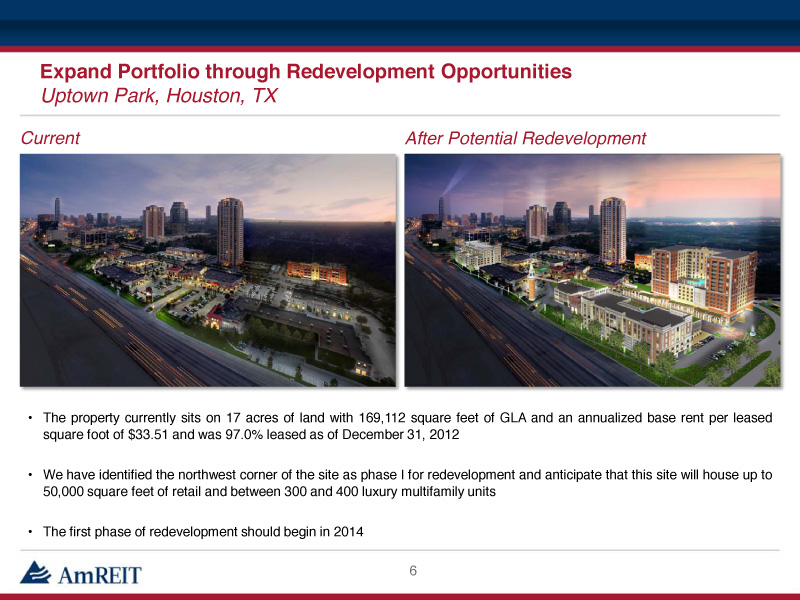
Expand Portfolio through Redevelopment Opportunities Uptown Park, Houston, TX • The property currently sits on 17 acres of land with 169 , 112 square feet of GLA and an annualized base rent per leased square foot of $ 33 . 51 and was 97 . 0 % leased as of December 31 , 2012 • We have identified the northwest corner of the site as phase I for redevelopment and anticipate that this site will house up to 50 , 000 square feet of retail and between 300 and 400 luxury multifamily units • The first phase of redevelopment should begin in 2014 Current After Potential Redevelopment 6

Access to a Pipeline of Acquisition Opportunities (1) Includes real estate fee income, construction management fee income and asset management fee income for 2012. 7 • We manage three institutional joint ventures and four high net worth advised funds comprising over $450 million in aggregate undepreciated book value – Approximately $233 million (undepreciated book value) of these assets in the Advised Funds meet the quality and demographic profile of AmREIT’s wholly - owned portfolio and represent potential attractive acquisition targets over the next 2 - 3 years – Lantern Lane (MIG III) and Woodlake Square (AEW) are near term targets (2013/2014) • Generate ~ $3.9 million (1) of fee income for AmREIT annually, covering more than half of our G&A expense • We are pursuing multiple transactions, however nothing is currently under contract, and cap rates are compressing
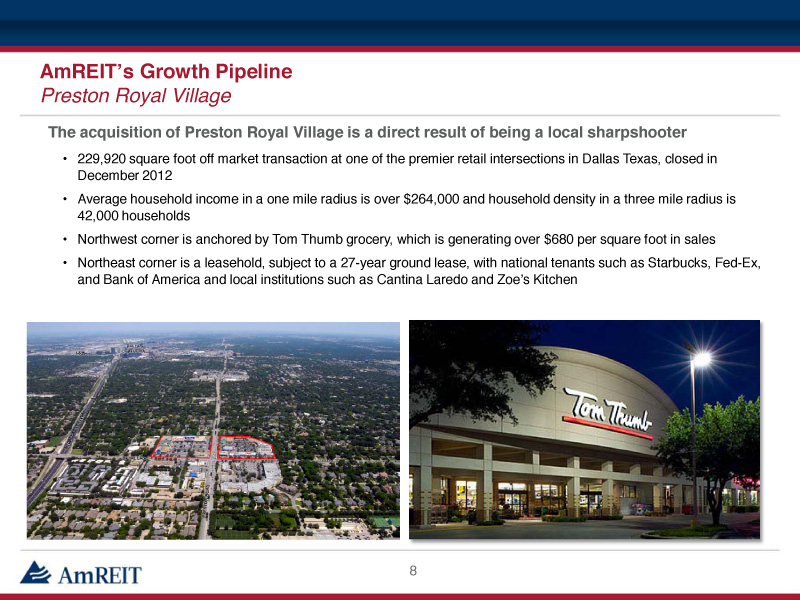
AmREIT’s Growth Pipeline Preston Royal Village 8 The acquisition of Preston Royal Village is a direct result of being a local sharpshooter • 229,920 square foot off market transaction at one of the premier retail intersections in Dallas Texas, closed in December 2012 • Average household income in a one mile radius is over $264,000 and household density in a three mile radius is 42,000 households • Northwest corner is anchored by Tom Thumb grocery, which is generating over $680 per square foot in sales • Northeast corner is a leasehold, subject to a 27 - year ground lease, with national tenants such as Starbucks, Fed - Ex, and Bank of America and local institutions such as Cantina Laredo and Zoe’s Kitchen
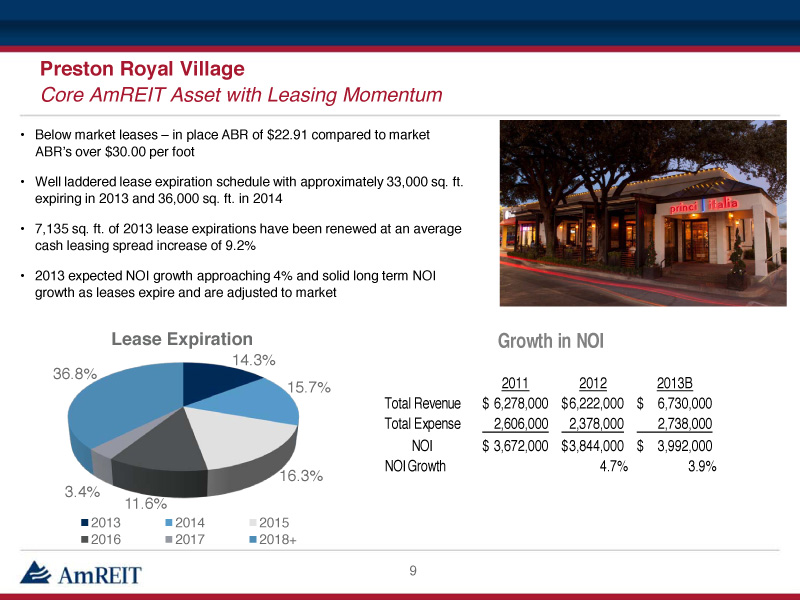
Preston Royal Village Core AmREIT Asset with Leasing Momentum 9 • Below market leases – in place ABR of $22.91 compared to market ABR’s over $30.00 per foot • Well laddered lease expiration schedule with approximately 33,000 sq. ft. expiring in 2013 and 36,000 sq. ft. in 2014 • 7,135 sq. ft. of 2013 lease expirations have been renewed at an average cash leasing spread increase of 9.2% • 2013 expected NOI growth approaching 4% and solid long term NOI growth as leases expire and are adjusted to market 14.3% 15.7% 16.3% 11.6% 3.4% 36.8% Lease Expiration 2013 2014 2015 2016 2017 2018+ 2011 2012 2013B Total Revenue 6,278,000$ 6,222,000$ 6,730,000$ Total Expense 2,606,000 2,378,000 2,738,000 NOI 3,672,000$ 3,844,000$ 3,992,000$ NOI Growth 4.7% 3.9% Growth in NOI
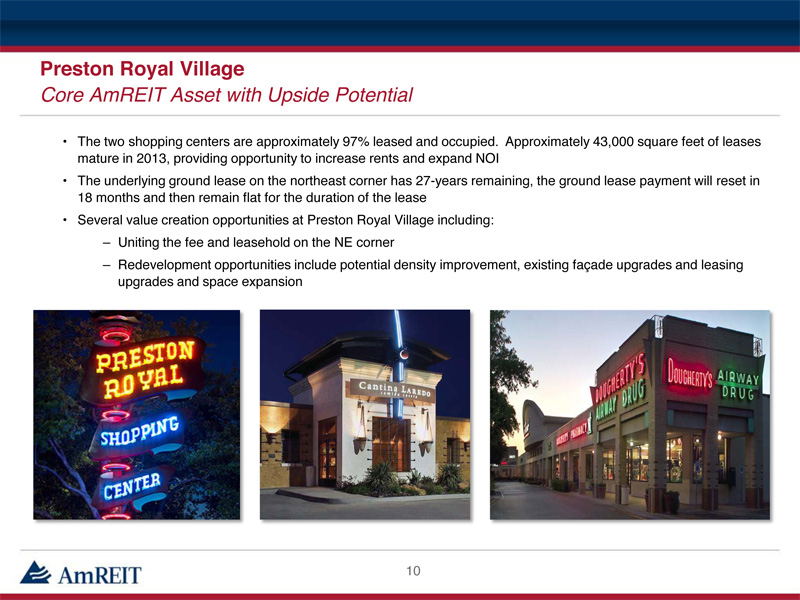
Preston Royal Village Core AmREIT Asset with Upside Potential 10 • The two shopping centers are approximately 97% leased and occupied. Approximately 43,000 square feet of leases mature in 2013, providing opportunity to increase rents and expand NOI • The underlying ground lease on the northeast corner has 27 - years remaining, the ground lease payment will reset in 18 months and then remain flat for the duration of the lease • Several value creation opportunities at Preston Royal Village including: – Uniting the fee and leasehold on the NE corner – Redevelopment opportunities include potential density improvement, existing façade upgrades and leasing upgrades and space expansion
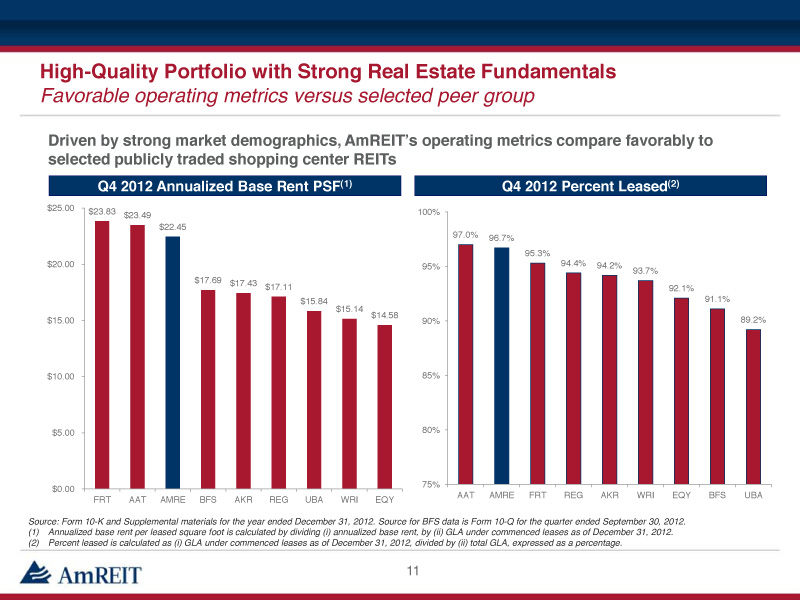
Q4 2012 Percent Leased (2) Q4 2012 Annualized Base Rent PSF (1) Driven by strong market demographics, AmREIT’s operating metrics compare favorably to selected publicly traded shopping center REITs High - Quality Portfolio with Strong Real Estate Fundamentals Favorable operating metrics versus selected peer group 11 Source: Form 10 - K and Supplemental materials for the year ended December 31, 2012. Source for BFS data is Form 10 - Q for the quarter ended September 30, 2012. (1) Annualized base rent per leased square foot is calculated by dividing ( i ) annualized base rent, by (ii) GLA under commenced leases as of December 31, 2012. (2) Percent leased is calculated as ( i ) GLA under commenced leases as of December 31, 2012, divided by (ii) total GLA, expressed as a percentage . $23.83 $23.49 $22.45 $17.69 $17.43 $17.11 $15.84 $15.14 $14.58 $0.00 $5.00 $10.00 $15.00 $20.00 $25.00 FRT AAT AMRE BFS AKR REG UBA WRI EQY 97.0% 96.7% 95.3% 94.4% 94.2% 93.7% 92.1% 91.1% 89.2% 75% 80% 85% 90% 95% 100% AAT AMRE FRT REG AKR WRI EQY BFS UBA
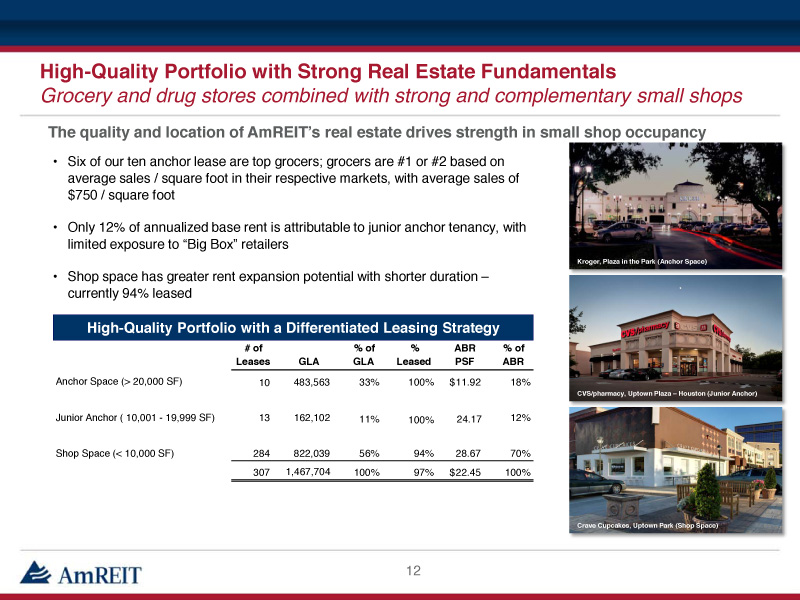
High - Quality Portfolio with Strong Real Estate Fundamentals Grocery and drug stores combined with strong and complementary small shops • Six of our ten anchor lease are top grocers; grocers are #1 or # 2 based on average sales / square foot in their respective markets, with average sales of $750 / square foot • Only 12% of annualized base rent is attributable to junior anchor tenancy, with limited exposure to “Big Box” retailers • Shop space has greater rent expansion potential with shorter duration – currently 94% leased The quality and location of AmREIT’s real estate drives strength in small shop occupancy High - Quality Portfolio with a Differentiated Leasing Strategy 12 Kroger, Cinco Ranch (Anchor Space) Crave Cupcakes, Uptown Park (Shop Space) Hard Rock Café, Southbank (Junior Space) CVS / Pharmacy, Brookwood Village (Junior Anchor) Kroger, Plaza in the Park (Anchor Space) The Grotto, Uptown Plaza - Houston (Junior Anchor) CVS/pharmacy, Uptown Plaza – Houston (Junior Anchor) # of Leases GLA % of GLA % Leased ABR PSF % of ABR Anchor Space (> 20,000 SF) 10 483,563 33% 100% 11.92 $ 18% Junior Anchor ( 10,001 - 19,999 SF) 13 162,102 11% 100% 24.17 12% Shop Space (< 10,000 SF) 284 822,039 56% 94% 28.67 70% 307 1,467,704 100% 97% 22.45 $ 100%
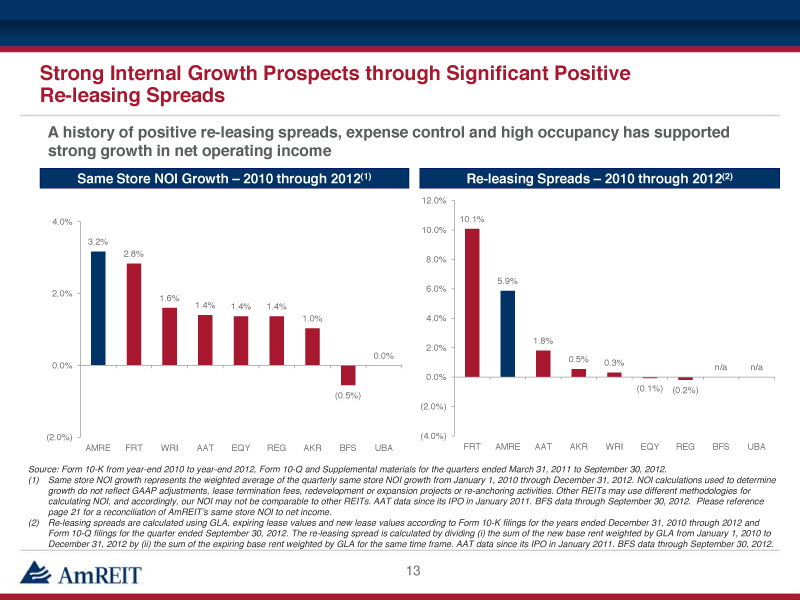
Strong Internal Growth Prospects through Significant Positive Re - leasing Spreads Re - leasing Spreads – 2010 through 2012 (2) Same Store NOI Growth – 2010 through 2012 (1) A history of positive re - leasing spreads, expense control and high occupancy has supported strong growth in net operating income 13 Source: Form 10 - K from year - end 2010 to year - end 2012, Form 10 - Q and Supplemental materials for the quarters ended March 31, 2011 to September 30, 2012. (1) S ame store NOI growth represents the weighted average of the quarterly same store NOI growth from January 1, 2010 through Dece mbe r 31, 2012. NOI calculations used to determine growth do not reflect GAAP adjustments, lease termination fees, redevelopment or expansion projects or re - anchoring activities. Other REITs may use different methodologies for calculating NOI, and accordingly, our NOI may not be comparable to other REITs. AAT data since its IPO in January 2011 . BFS data through September 30, 2012. Please reference page 21 for a reconciliation of AmREIT’s same store NOI to net income. (2) Re - leasing spreads are calculated using GLA, expiring lease values and new lease values according to Form 10 - K filings for the y ears ended December 31, 2010 through 2012 and Form 10 - Q filings for the quarter ended September 30, 2012. The re - leasing spread is calculated by dividing ( i ) the sum of the new base rent weighted by GLA from January 1, 2010 to December 31, 2012 by (ii) the sum of the expiring base rent weighted by GLA for the same time frame . AAT data since its IPO in January 2011 . BFS data through September 30, 2012. 3.2% 2.8% 1.6% 1.4% 1.4% 1.4% 1.0% (0.5%) 0.0% (2.0%) 0.0% 2.0% 4.0% AMRE FRT WRI AAT EQY REG AKR BFS UBA 10.1% 5.9% 1.8% 0.5% 0.3% (0.1%) (0.2%) n/a n/a (4.0%) (2.0%) 0.0% 2.0% 4.0% 6.0% 8.0% 10.0% 12.0% FRT AMRE AAT AKR WRI EQY REG BFS UBA
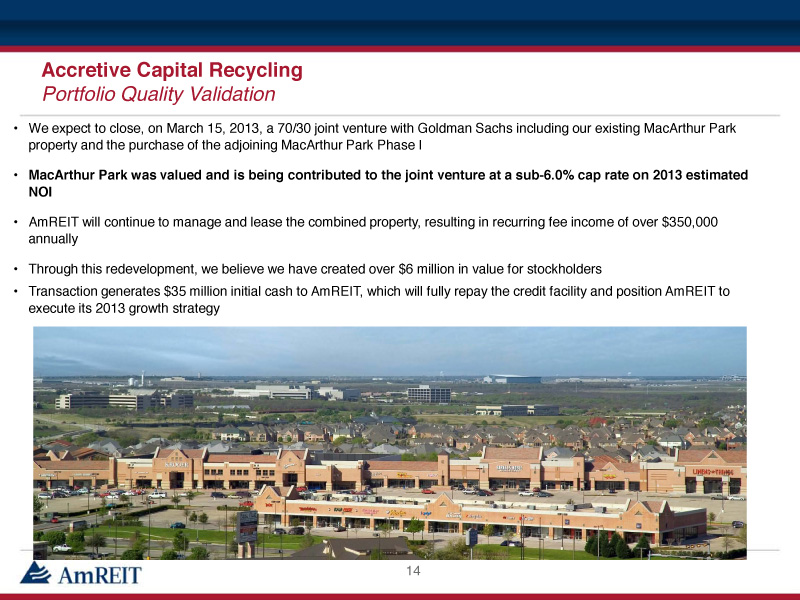
14 Accretive Capital Recycling Portfolio Quality Validation • We expect to close, on March 15, 2013, a 70/30 joint venture with Goldman Sachs including our existing MacArthur Park property and the purchase of the adjoining MacArthur Park Phase I • MacArthur Park was valued and is being contributed to the joint venture at a sub - 6.0% cap rate on 2013 estimated NOI • AmREIT will continue to manage and lease the combined property, resulting in recurring fee income of over $350,000 annually • Through this redevelopment, we believe we have created over $6 million in value for stockholders • Transaction generates $35 million initial cash to AmREIT, which will fully repay the credit facility and position AmREIT to execute its 2013 growth strategy

15 Conservative Capital Structure Poised for Growth Capitalization and debt maturity Debt Maturity Schedule ($MM) Capitalization (1) Shares consist of 11.7 million Class A shares and 4.4 million newly issued Class B shares that are publicly traded on the NYS E:A MRE. (2) Includes $0.3 million of an above - market debt premium associated with debt assumed in conjunction with certain of our property a cquisitions. (3) Total Enterprise Value equals Equity Market Capitalization plus Total Debt, less Cash and Cash Equivalents. $0.0 $0.0 $0.0 $50.7 $68.7 $42.7 $0.0 $10.0 $20.0 $30.0 $40.0 $50.0 $60.0 $70.0 $80.0 2012 2013 2014 2015 2016 2017+ ($ and shares in millions, except per share amounts) December 31, 2012 Cash and Equivalents 3.0$ Equity Total Common Shares Outstanding (1) 16.1 Stock Price as of 2/28/13 17.30$ Total Equity Market Capitalization 278.5$ Consolidated Debt Secured Mortgage Debt (2) 185.1 Unsecured Credit Facility (Due 2015) 33.5 Total Debt 218.6$ Total Capitalization 497.1$ Less: Cash and Equivalents (3.0) Minority Interest - Total Enterprise Value (3) 494.1$ Net Debt / Total Capitalization 43.4% Total Debt / Total Enterprise Value 44.2% Net Debt / Total Enterprise Value 43.6% Net Debt / Total Gross Assets 58.9%
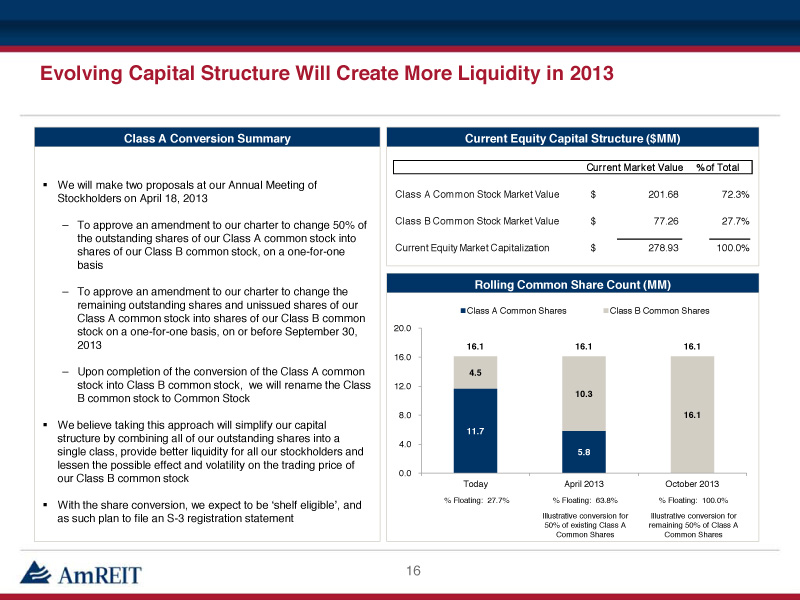
▪ We will make two proposals at our Annual Meeting of Stockholders on April 18, 2013 – To approve an amendment to our charter to change 50% of the outstanding shares of our Class A common stock into shares of our Class B common stock, on a one - for - one basis – To approve an amendment to our charter to change the remaining outstanding shares and unissued shares of our Class A common stock into shares of our Class B common stock on a one - for - one basis, on or before September 30, 2013 – Upon completion of the conversion of the Class A common stock into Class B common stock, we will rename the Class B common stock to Common Stock ▪ We believe taking this approach will simplify our capital structure by combining all of our outstanding shares into a single class, provide better liquidity for all our stockholders and lessen the possible effect and volatility on the trading price of our Class B common stock ▪ With the share conversion, we expect to be ‘shelf eligible’, and as such plan to file an S - 3 registration statement Evolving Capital Structure Will Create More Liquidity in 2013 16 Class A Conversion Summary Current Equity Capital Structure ($MM) Rolling Common Share Count (MM) 11.7 5.8 4.5 10.3 16.1 16.1 16.1 16.1 0.0 4.0 8.0 12.0 16.0 20.0 Today April 2013 October 2013 Class A Common Shares Class B Common Shares Illustrative conversion for 50% of existing Class A Common Shares Illustrative conversion for remaining 50% of Class A Common Shares % Floating: 27.7% % Floating: 63.8% % Floating: 100.0% Current Market Value % of Total Class A Common Stock Market Value 201.68$ 72.3% Class B Common Stock Market Value 77.26$ 27.7% Current Equity Market Capitalization 278.93$ 100.0%
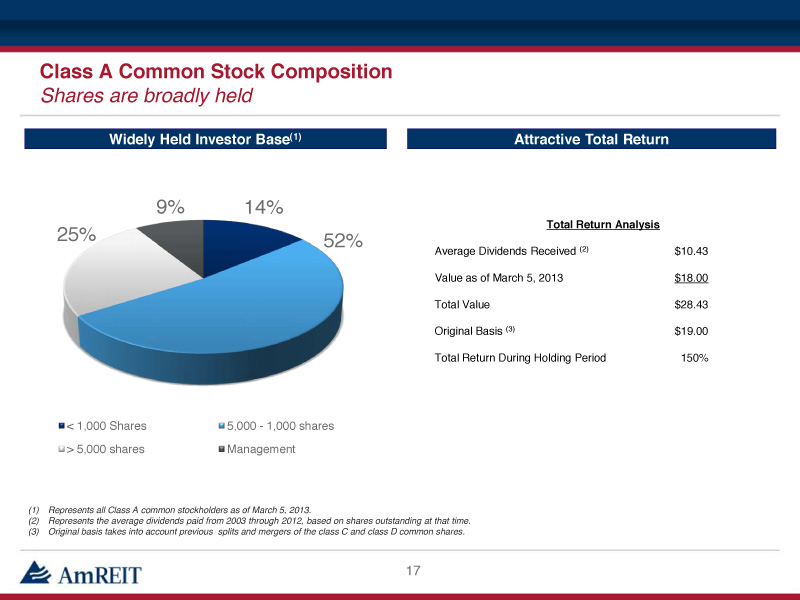
17 Class A Common Stock Composition Shares are broadly held Attractive Total Return Widely Held Investor Base (1) (1) Represents all Class A common stockholders as of March 5, 2013. (2) Represents the average dividends paid from 2003 through 2012, based on shares outstanding at that time. (3) Original basis takes into account previous splits and mergers of the class C and class D common shares. 14% 52% 25% 9% < 1,000 Shares 5,000 - 1,000 shares > 5,000 shares Management Total Return Analysis Average Dividends Received (2) $10.43 Value as of March 5, 2013 $18.00 Total Value $28.43 Original Basis (3) $19.00 Total Return During Holding Period 150%
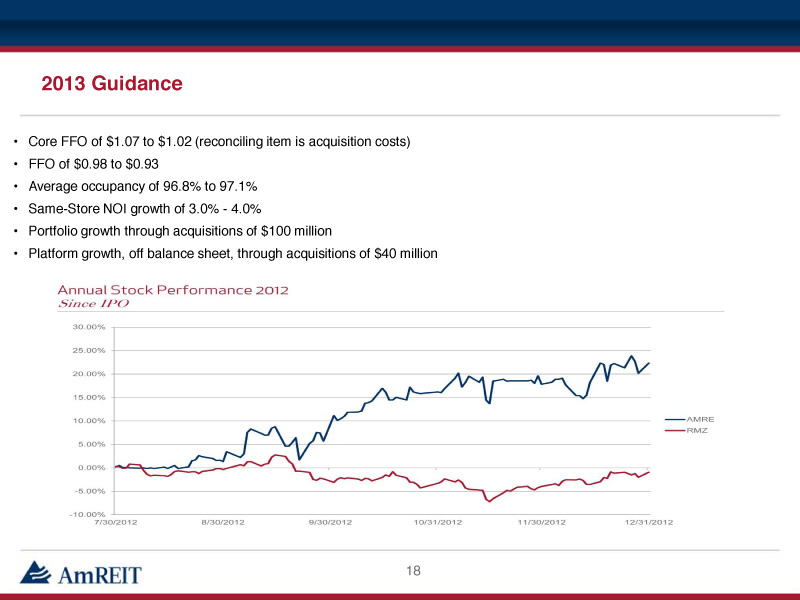
18 2013 Guidance • Core FFO of $1.07 to $ 1.02 (reconciling item is acquisition costs) • FFO of $0.98 to $ 0.93 • Average occupancy of 96.8% to 97.1% • Same - Store NOI growth of 3.0% - 4.0% • Portfolio growth through acquisitions of $100 million • Platform growth, off balance sheet, through acquisitions of $40 million
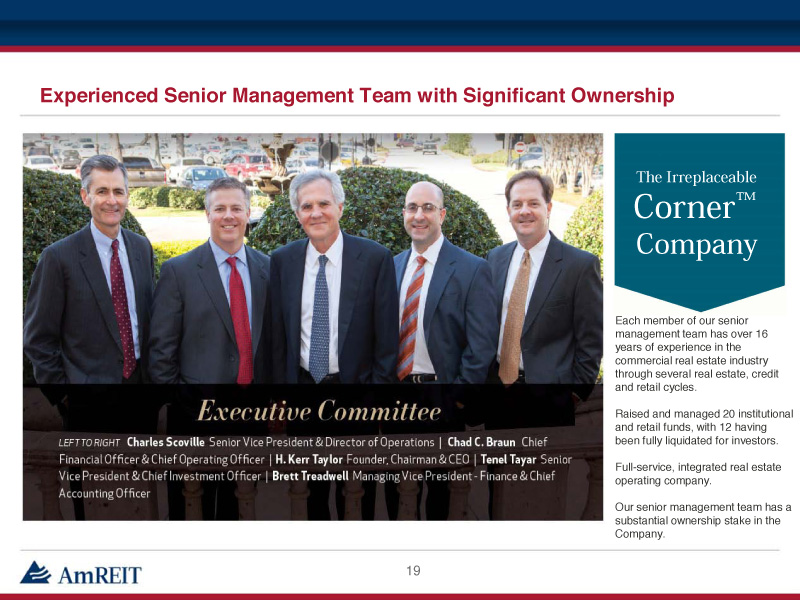
Experienced Senior Management Team with Significant Ownership 19 The Irreplaceable Corner ™ Company Each member of our senior management team has over 16 years of experience in the commercial real estate industry through several real estate, credit and retail cycles. Raised and managed 20 institutional and retail funds, with 12 having been fully liquidated for investors. Full - service, integrated real estate operating company. Our senior management team has a substantial ownership stake in the Company.
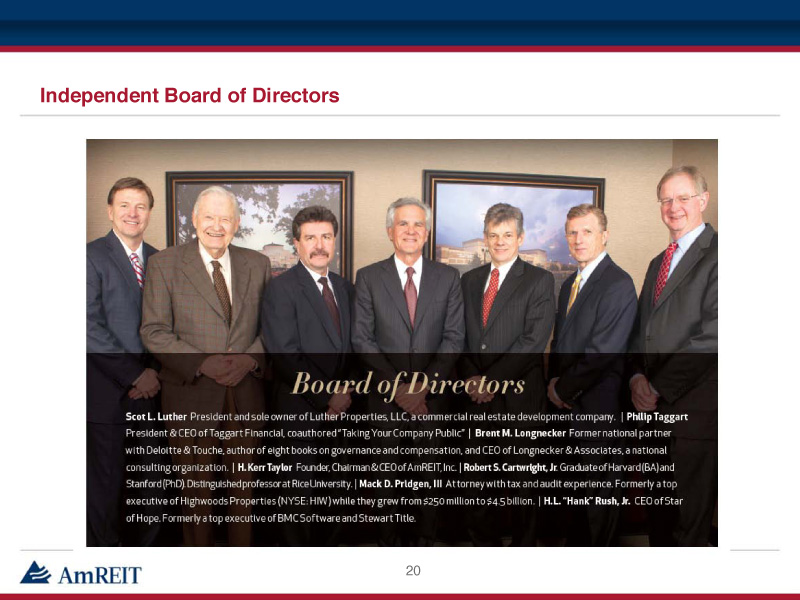
Independent Board of Directors 20