Attached files
| file | filename |
|---|---|
| 8-K - 8-K - AMICUS THERAPEUTICS, INC. | a13-7317_18k.htm |
| EX-99.1 - EX-99.1 - AMICUS THERAPEUTICS, INC. | a13-7317_1ex99d1.htm |
Exhibit 99.2
|
|
At the Forefront of Therapies for Rare and Orphan Diseases™ March 12, 2013 |

|
|
Safe Harbor This presentation contains “forward-looking statements” within the meaning of the Private Securities Litigation Reform Act of 1995 relating to business, operations and financial conditions of Amicus including but not limited to preclinical and clinical development of Amicus’ candidate drug products, the timing and reporting of results from clinical trials evaluating Amicus’ candidate drug products. Words such as, but not limited to, “look forward to,” “believe,” “expect,” “anticipate,” “estimate,” “intend,” “plan,” “would,” “should” and “could,” and similar expressions or words, identify forward-looking statements. Although Amicus believes the expectations reflected in such forward-looking statements are based upon reasonable assumptions, there can be no assurance that its expectations will be realized. Actual results could differ materially from those projected in Amicus’ forward-looking statements due to numerous known and unknown risks and uncertainties, including the “Risk Factors” described in our Annual Report on Form 10-K for the year ended December 31, 2012. All forward-looking statements are qualified in their entirety by this cautionary statement, and Amicus undertakes no obligation to revise or update this presentation to reflect events or circumstances after the date hereof. Slide 2 |

|
|
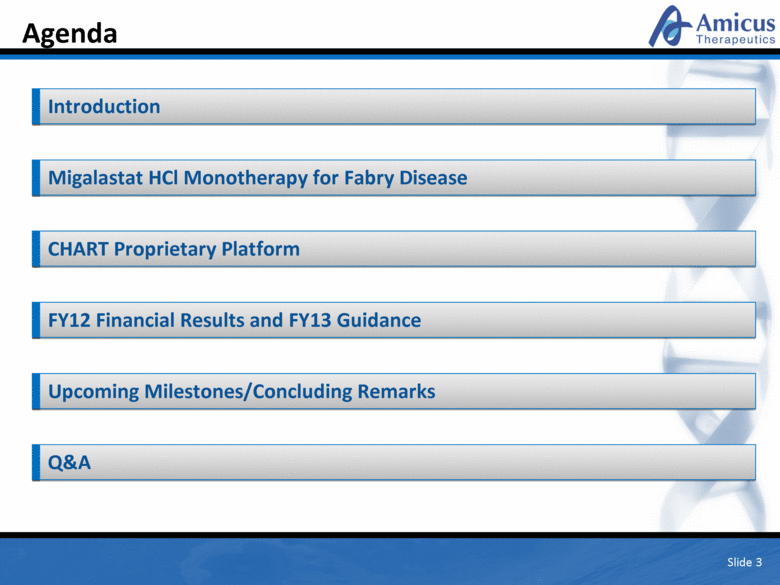
Slide 3 Agenda CHART Proprietary Platform Upcoming Milestones/Concluding Remarks Introduction Migalastat HCl Monotherapy for Fabry Disease FY12 Financial Results and FY13 Guidance Q&A |
|
|
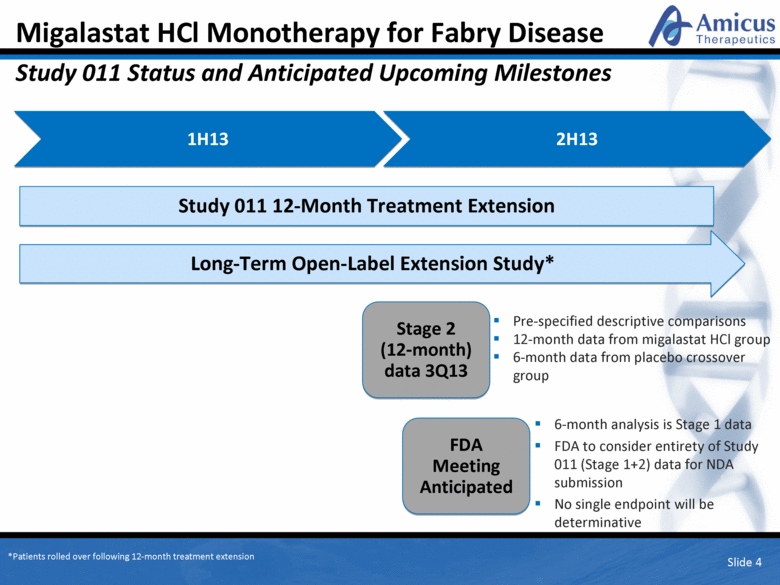
Migalastat HCl Monotherapy for Fabry Disease Study 011 Status and Anticipated Upcoming Milestones Slide 4 1H13 Pre-specified descriptive comparisons 12-month data from migalastat HCl group 6-month data from placebo crossover group 6-month analysis is Stage 1 data FDA to consider entirety of Study 011 (Stage 1+2) data for NDA submission No single endpoint will be determinative 2H13 Stage 2 (12-month) data 3Q13 FDA Meeting Anticipated Study 011 12-Month Treatment Extension Long-Term Open-Label Extension Study* *Patients rolled over following 12-month treatment extension |
|
|
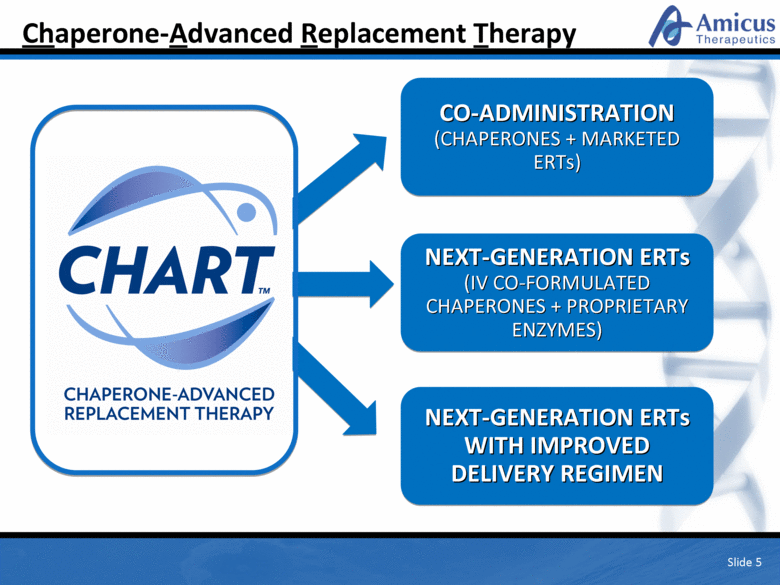
Chaperone-Advanced Replacement Therapy Slide 5 CO-ADMINISTRATION (CHAPERONES + MARKETED ERTs) NEXT-GENERATION ERTs (IV CO-FORMULATED CHAPERONES + PROPRIETARY ENZYMES) NEXT-GENERATION ERTs WITH IMPROVED DELIVERY REGIMEN |
|
|
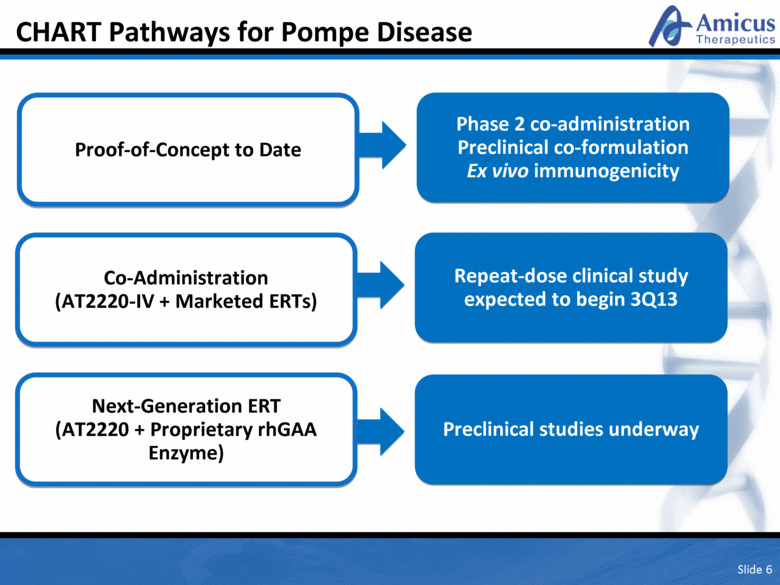
Slide 6 CHART Pathways for Pompe Disease Co-Administration (AT2220-IV + Marketed ERTs) Next-Generation ERT (AT2220 + Proprietary rhGAA Enzyme) Repeat-dose clinical study expected to begin 3Q13 Preclinical studies underway Proof-of-Concept to Date Phase 2 co-administration Preclinical co-formulation Ex vivo immunogenicity |
|
|
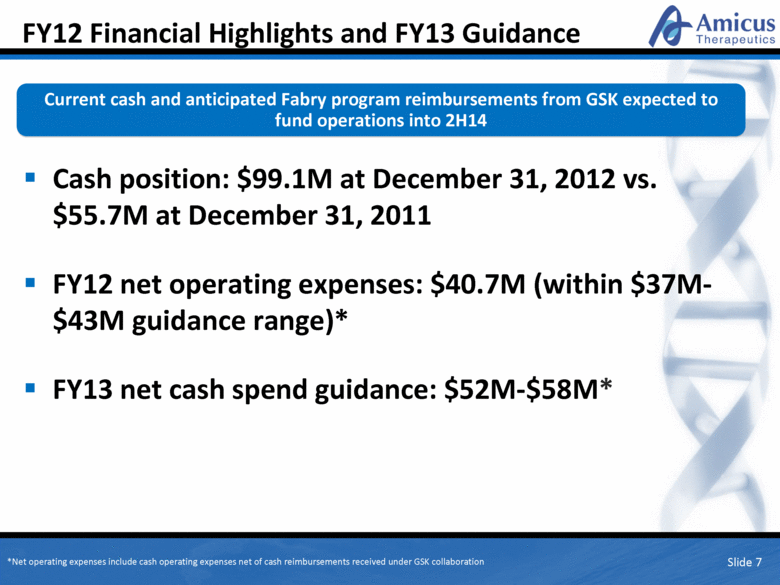
FY12 Financial Highlights and FY13 Guidance Cash position: $99.1M at December 31, 2012 vs. $55.7M at December 31, 2011 FY12 net operating expenses: $40.7M (within $37M-$43M guidance range)* FY13 net cash spend guidance: $52M-$58M* Slide 7 *Net operating expenses include cash operating expenses net of cash reimbursements received under GSK collaboration Current cash and anticipated Fabry program reimbursements from GSK expected to fund operations into 2H14 |
|
|
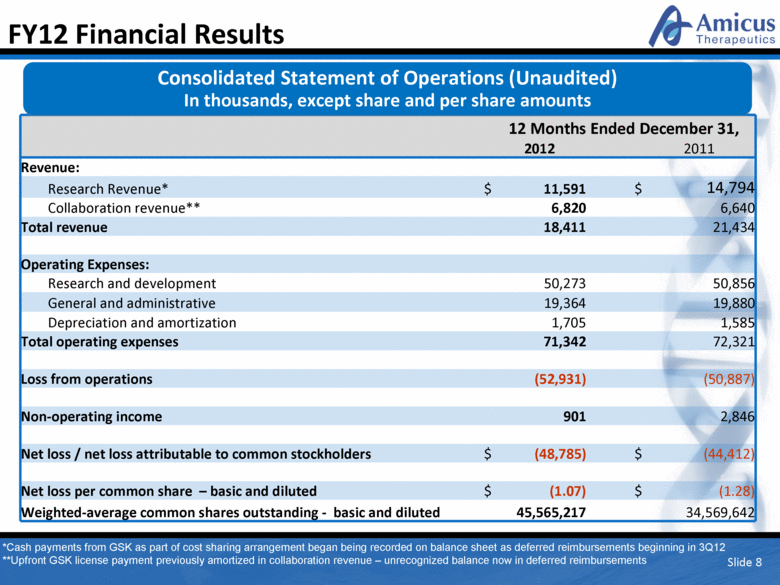
Slide 8 FY12 Financial Results 12 Months Ended December 31, 2012 2011 Revenue: Research Revenue* $ 11,591 $ 14,794 Collaboration revenue** 6,820 6,640 Total revenue 18,411 21,434 Operating Expenses: Research and development 50,273 50,856 General and administrative 19,364 19,880 Depreciation and amortization 1,705 1,585 Total operating expenses 71,342 72,321 Loss from operations (52,931) (50,887) Non-operating income 901 2,846 Net loss / net loss attributable to common stockholders $ (48,785) $ (44,412) Net loss per common share – basic and diluted $ (1.07) $ (1.28) Weighted-average common shares outstanding - basic and diluted 45,565,217 34,569,642 Consolidated Statement of Operations (Unaudited) In thousands, except share and per share amounts *Cash payments from GSK as part of cost sharing arrangement began being recorded on balance sheet as deferred reimbursements beginning in 3Q12 **Upfront GSK license payment previously amortized in collaboration revenue – unrecognized balance now in deferred reimbursements |
|
|
Slide 9 Dec. 31, 2011 Dec. 31, 2012 Assets: Total Current Assets 66,648 104,617 Total Non-Current Assets 3,147 5,471 Total Assets 69,795 118,211 Liabilities & Stockholders’ Equity Total current liabilities: 19,256 9,243 Deferred reimbursements less current portion 18,999 30,418 Warrant Liability 1,948 908 Secured loan, less current portion - 299 Total liabilities 40,203 40,868 Commitments and contingencies Total stockholders' equity 29,592 69,220 Total Liabilities & Stockholder’s Equity $ 69,795 $ 110,088 Cash payments from GSK to Amicus as part of cost sharing arrangement (~$4.5M in 3Q12 and ~$3.2M in 4Q12) Balance of unrecognized upfront license payment (~$22.7M on 12/31/12) Impacts Research and Collaboration Revenue Recognition, Effective 3Q12 No Impact on Cash or Deal Economics Revenue Recognition Under Expanded GSK Deal Impact from Contingent Future Milestones Consolidated Balance Sheets (Unaudited)* *In thousands |

|
|
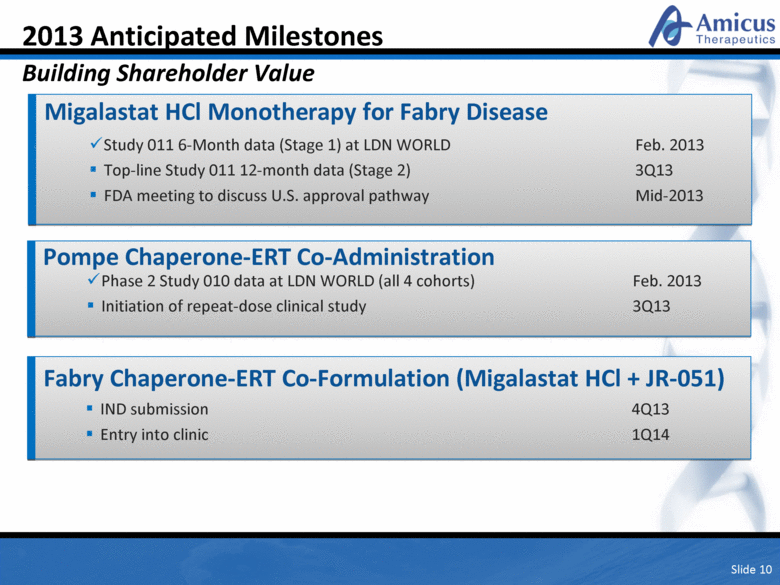
Slide 10 2013 Anticipated Milestones Building Shareholder Value Migalastat HCl Monotherapy for Fabry Disease Study 011 6-Month data (Stage 1) at LDN WORLD Feb. 2013 Top-line Study 011 12-month data (Stage 2) 3Q13 FDA meeting to discuss U.S. approval pathway Mid-2013 Pompe Chaperone-ERT Co-Administration IND submission 4Q13 Entry into clinic 1Q14 Phase 2 Study 010 data at LDN WORLD (all 4 cohorts) Feb. 2013 Initiation of repeat-dose clinical study 3Q13 Fabry Chaperone-ERT Co-Formulation (Migalastat HCl + JR-051) |
|
|
Q&A Slide 11 John F. Crowley, Chairman & CEO Chip D. Baird, Chief Financial Officer Bradley L. Campbell, Chief Business Officer David J. Lockhart, PhD, Chief Scientific Officer |