Attached files
| file | filename |
|---|---|
| 8-K - FORM 8-K - NAVISTAR INTERNATIONAL CORP | d497295d8k.htm |
| EX-99.1 - PRESS RELEASE - NAVISTAR INTERNATIONAL CORP | d497295dex991.htm |
 NYSE:
NAV 1
ST
QUARTER 2013 EARNINGS
PRESENTATION
March 7
th
, 2013
Exhibit 99.2 |
 2
NYSE: NAV
1Q 2013 Earnings –
3/7/2013
Safe Harbor
Statement
Information provided and statements contained in this report that are not purely
historical are forward-looking
statements
within
the
meaning
of
Section
27A
of
the
Securities
Act
of
1933,
as
amended, Section
21E of the Securities Exchange Act of 1934, as amended, and the Private
Securities Litigation Reform Act of 1995. Such forward-looking statements only
speak as of the date of this report and the Company assumes no obligation to
update the information included in this report. Such forward-looking
statements include information concerning our possible or assumed future
results of operations, including descriptions of our business strategy. These
statements often include words such as “believe,”
“expect,”
“anticipate,”
“intend,”
“plan,”
“estimate,”
or similar expressions. These statements are not guarantees of performance or
results and they involve risks, uncertainties, and assumptions. For a
further description of these factors, see the risk factors set forth in our
filings with the Securities and Exchange Commission, including our annual
report on Form 10-K for the fiscal year ended October 31, 2012. Although
we believe that these forward-looking statements are based on reasonable
assumptions, there are many factors that could affect our actual financial
results or results of operations and could cause actual results to differ
materially from those in the forward-looking statements. All future
written and oral forward-looking statements by us or persons acting on our
behalf are expressly qualified in their entirety by the cautionary
statements contained or referred to above. Except for our ongoing
obligations to disclose material information as required by the federal securities
laws, we do not have any obligations or intention to release publicly any revisions
to any forward- looking statements to reflect events or circumstances in
the future or to reflect the occurrence of unanticipated events.
|
 3
NYSE: NAV
1Q 2013 Earnings –
3/7/2013
Other Cautionary Notes
The financial information herein contains audited and unaudited information and
has been prepared by management in good faith and based on data currently
available to the Company.
Certain non-GAAP measures are used in this presentation to assist the
reader in
understanding
our
core
manufacturing
business.
We
believe
this
information
is
useful
and
relevant
to
assess
and
measure
the
performance
of
our
core
manufacturing business as it illustrates manufacturing performance without regard
to selected historical legacy costs (i.e. pension and other postretirement
costs). It also excludes financial services and other items that may not
be related to the
core manufacturing business or underlying results. Management often uses this
information to assess and measure the underlying performance of our
operating segments.
We have chosen to provide this supplemental information to investors,
analysts,
and
other
interested
parties
to
enable
them
to
perform
additional
analyses of operating results. The non-GAAP numbers are reconciled to the most
appropriate GAAP number in the appendix of this presentation.
|
 4
NYSE: NAV
1Q 2013 Earnings –
3/7/2013
•
Cash
•
Structural Cost Reductions
•
ROIC actions
1st Quarter Actions |
  5
NYSE: NAV
1Q 2013 Earnings –
3/7/2013
9/6
–
Announced
ROIC
focused
strategy
11/15 –
First
saleable
ProStar
with ISX
to roll off
line
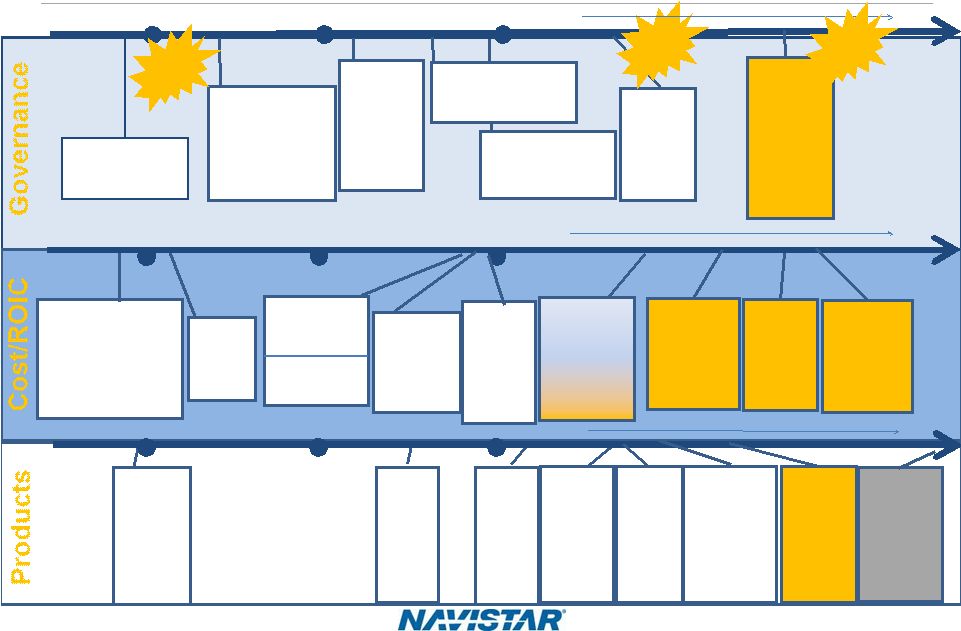
Drive to Deliver Progress
8/27 –
Announced U.S.
Voluntary Separation
Package results and need
for Reduction In Force as
part of goal to reduce costs
by $150M-$175M. 10/31
completion date
Launch
ProStar with
13-L SCR in
April
12/11 –
Regular
production
of ProStar
with ISX
engines
10/23 –
Cummins
contract
finalized
9/6 –
Realigned Senior
Leadership –
weekly
meetings. Established
daily cash management
report and
manufacturing
excellence system
August
September
October
November
April
8/30 –
EPA
issued final
ruling
10/8 –
Company
adds two new
board
members:
Vincent J.
Intrieri and
Mark H.
Rachesky
August
September
October
August
September
October
10/24 –
ROIC
update -
elimination of
MxF15
Equity offering;
confirmed cash
guidance
10/16 –
Board approves
2013 operating plan and
addition of John C. Pope to
BOD
10/30 –
Announced
closure of
Garland
facility
10/26 –
Brazil
restructuring
complete;
approx. 700
jobs eliminated
8/27 –
Lewis
Campbell named
Executive Chairman
and CEO
12/10 –
Company
adds new
board
member:
Samuel J.
Merksamer
12/18 –
Announced
intent to sell
India equity to
Mahindra
2/12–
Sale of
equity interests
completed
9/6 –
3Q
Earnings
call
12/19 –
4Q
Earnings
call
12/14 –
“OK to
ship”-
five
days
ahead of
schedule
2/19 –
Annual
shareholder
meeting
1/7 –
Submitted
for EPA
certification
on 13Liter
12/19 –
End of
Year
manufacturing
cash balance of
$1.5B
1/6 –
Best In
Class
Benchmarking
Initiative
2/19 –
Announced
sublease of
Alabama
Facility
3/04 –
announced the
sale of
Workhorse
Custom
Chassis
November
April
November
April
3/7 –
1Q
Earnings
call
10/27
–
Board
approves
annual
incentive
plans
that
tie
to
increasing
shareholder
value |
 6
NYSE: NAV
1Q 2013 Earnings –
3/7/2013
•
•
Quality
Quality
•
•
Cost
Cost
•
•
Sense of Urgency
Sense of Urgency
•
•
Great Products
Great Products
•
•
Customer Satisfaction
Customer Satisfaction
•
•
People
People
Guiding
Principles Near-Term Priorities
2013
2013
Drive to Deliver
Drive to Deliver
Deliver Our
2013 Plans
Hit Our
Launches
Improve
Quality |
 NYSE:
NAV A. J. Cederoth, Executive Vice President & CFO
1
ST
QUARTER 2013 RESULTS |
 8
NYSE: NAV
1Q 2013 Earnings –
3/7/2013
1Q 2013 Results
* Attributable to Navistar International Corporation
1Q 2013
GAAP
1Q 2012
GAAP
Change
Revenue (Millions)
$2,637
3,009
$(372)
Manufacturing Segment Profit
(Loss) (Millions)
$1
$(97)
$98
EBITDA (Millions)
$57
$(106)
$163
Profit (Loss) from Continuing
Operations * (Millions)
$(114)
$(144)
$30
Diluted Profit (Loss) Per Share*
from Continuing Operations
$(1.42)
$(2.06)
$0.64
Notes: (1) Shares outstanding were 80.2 million in 1Q 2013 compared to 69.9
million in 1Q 2012. (2) Diluted (Loss) Per Share from discontinued
operations were $(0.11) in 1Q 2013 and $(0.13) in 1Q 2012. Note:
This slide contains non-GAAP information; please see the REG G in
appendix for a detailed reconciliation. |
 9
NYSE: NAV
1Q 2013 Earnings –
3/7/2013
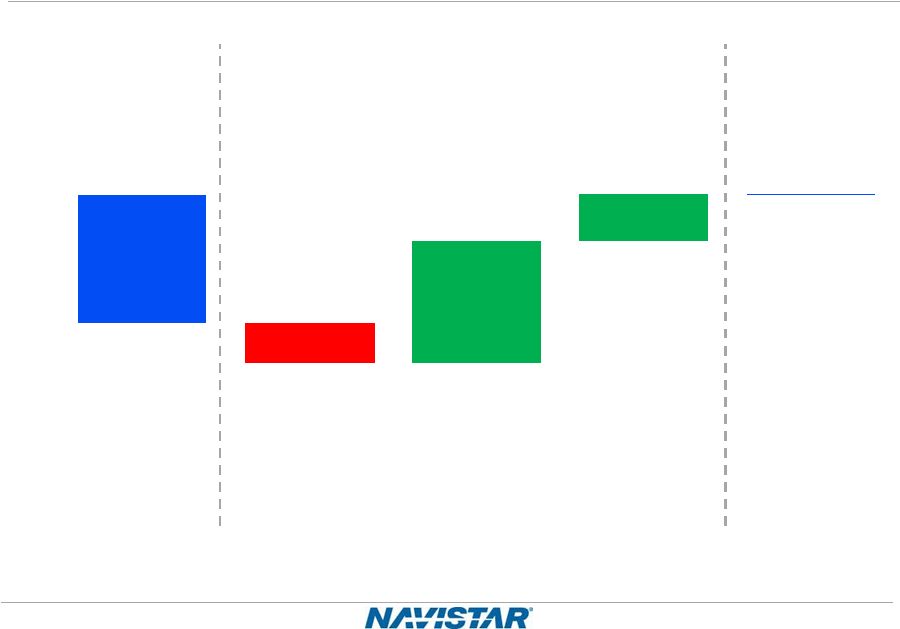
1Q 2012 vs. 1Q 2013
Manufacturing Segment Profit Walk
($97)
$1
($31)
$93
$36
($200)
($100)
$0
$100
1Q2012 Actual
Truck
Engine
Parts
1Q2013 Actual
Note:
This slide contains non-GAAP information; please see the REG G in
appendix for a detailed reconciliation. |
 10
NYSE: NAV
1Q 2013 Earnings –
3/7/2013
1Q 2013 Manufacturing Cash Update
Guidance**
Actual
2012 Year End Manufacturing Cash Balance*
$1,505
$1,505
EBITDA
$(50) -
$50
$57
CapEx/Cash Interest/Pension/OPEB Funding
$(215)
$(153)
Change in Net Working Capital
$(200)
$(190)
Debt Payments/Restructuring Cash/Other
$(90)
$(30)
1Q 2013 Manufacturing Cash Balance*
$950 -$1,050
$1,189
$ in millions
*Cash balance includes marketable securities.
**As shown on 12/19/2012
Note:
This slide contains non-GAAP information; please see the REG G in
appendix for a detailed reconciliation. |
 11
NYSE: NAV
1Q 2013 Earnings –
3/7/2013
Guidance: 2Q 2013 Manufacturing Cash
Guidance**
1Q 2013 Manufacturing Cash Balance* Actual
$1,189
EBITDA
$(25) -
$25
CapEx/Cash Interest/Pension/OPEB Funding
$(189)
Change in Net Working Capital
$100 -
$150
Restructuring Cash/Other
$(75)
2Q 2013 Manufacturing Cash Balance* Guidance
$1,000 -
$1,100
$ in millions
* Cash balance includes marketable securities.
Note:
This slide contains non-GAAP information; please see the REG G in
appendix for a detailed reconciliation. |
 12
NYSE: NAV
1Q 2013 Earnings –
3/7/2013
•
Cash balance
•
Market share
•
EBITDA
2013 Key Indicators |
 NYSE:
NAV Troy Clarke, President & COO
DRIVE TO DELIVER |
 14
NYSE: NAV
1Q 2013 Earnings –
3/7/2013
Drive to Deliver Progress
Plan on Track
•
Product Launches on Schedule
•
Quality Continues to Improve
•
Exceeding Structural Cost Reductions |
 15
NYSE: NAV
1Q 2013 Earnings –
3/7/2013
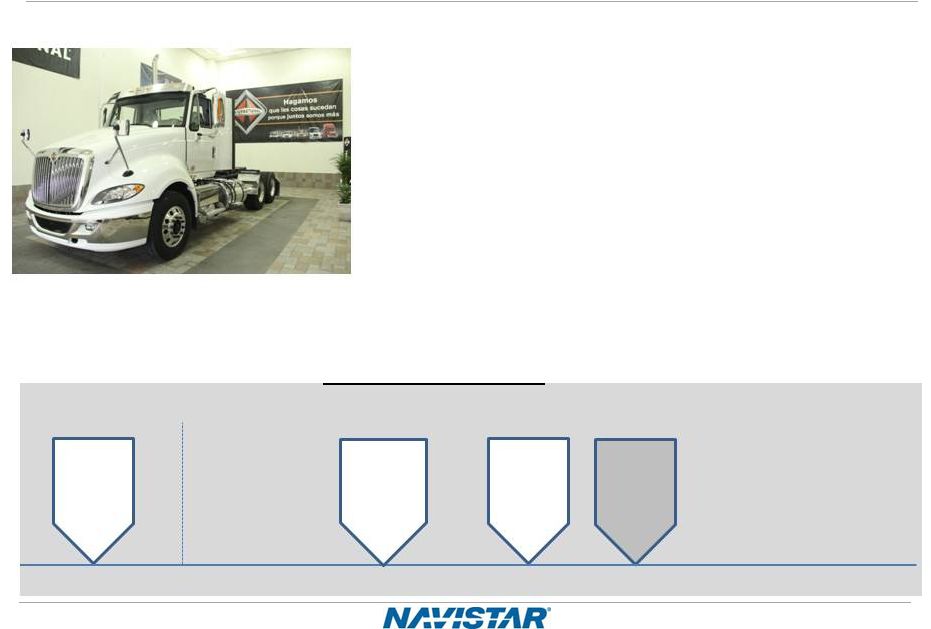
Hit Our Launches: ProStar Plus ISX 15 Liter |
 16
NYSE: NAV
1Q 2013 Earnings –
3/7/2013
Hit Our Launches –
MxF13 On Track
Launch Schedule
•
Submitted test data to EPA
•
OBD compliance on track
•
Anticipate EPA/CARB certificates by end of March
to support end of April shipments
•
Small fleet of validation vehicles accumulating
miles
Build began ahead of schedule for 18
full production vehicles
FY2012
FY2013
Sep
Oct
Nov
Dec
Jan
Feb
Mar
Apr
May
Jun
Jul
Aug
Test Units
1/7
Submit for
EPA
certification
3/05
Start Lead
Unit
Production
4/30
OK
To Ship |
 17
NYSE: NAV
1Q 2013 Earnings –
3/7/2013
Quality
•
Navistar repair incidence is in line with industry
performance, and continues to improve toward best in
class
•
Repair cost per engine continues to improve
•
Once fixes have been identified and solutions validated,
field campaigns may be required
Bottom Line –
Quality continues to improve for Trucks and Engines
Actions demonstrate our commitment to our customers |
 18
NYSE: NAV
1Q 2013 Earnings –
3/7/2013
•
Supplements structural cost improvements already underway
•
Outgrowth of more functionally aligned organization
•
Function-by-function review compared to 15 heavy
manufacturing peers
•
Identifies more opportunities to improve cost structure, offset
potential risks
Driving Financial Improvement
Benchmarking Initiative
Already on track to exceed $175 million
structural cost improvement target |
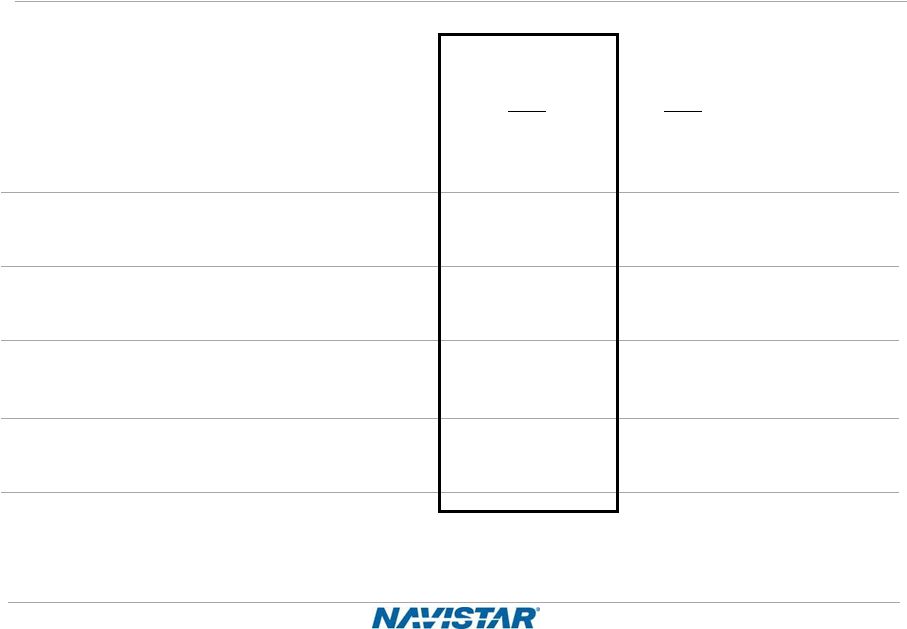
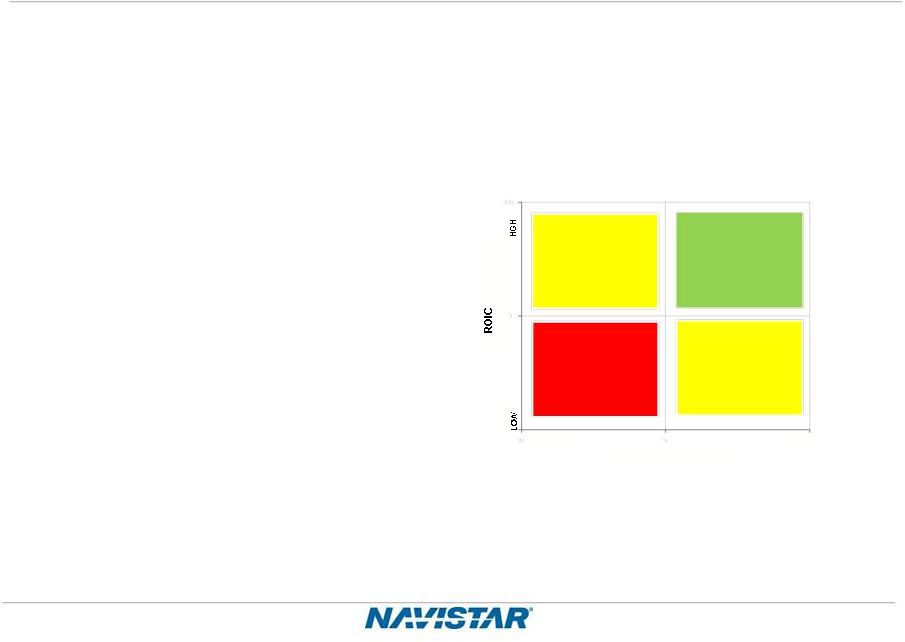 Significant Progress on Business Portfolio
Actions taken to improve Return on Invested Capital (ROIC)
•
Discontinue non-core
engineering programs
•
Discontinue MaxxForce
15 Liter
•
Sale of equity interest in
Mahindra JV
•
Sublease portion of
Alabama facility to
FreightCar America
0
5
10
STRATEGIC FIT
LOW
HIGH
Grow/Sell
Grow
Close/Sell
Improve
19
NYSE: NAV
1Q 2013 Earnings –
3/7/2013 |
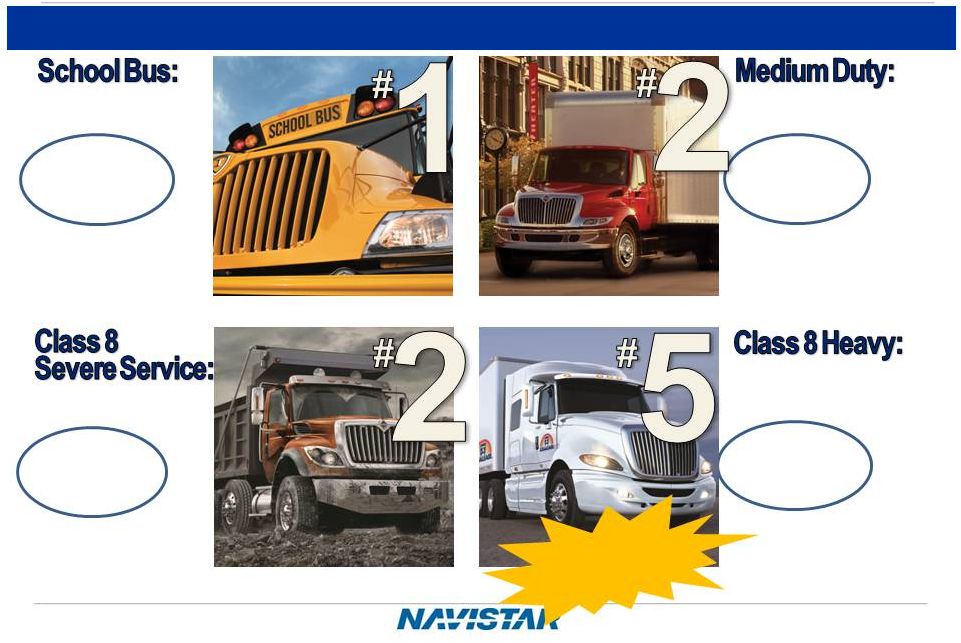 A
Leader in Several Commercial Vehicle Segments Market Share
1Q FY2013: ~38%
Note: Based on market share position determined by brand
Market Share
1Q FY2013: ~25%
Market Share
1Q FY2013: ~26%
Market Share
1Q FY2013: ~11%
Market Share
Trailing Six
Months: ~40%
Market Share
Trailing Six
Months: ~28%
Market Share
Trailing Six
Months: ~27%
Market Share
Trailing Six
Months: ~12%
Note:
See slide 24 for additional comments to this slides
EGR to SCR
Transition
U.S. and Canada School Bus & Class 6-8:
NYSE: NAV
1Q 2013 Earnings –
3/7/2013
20 |
 21
NYSE: NAV
1Q 2013 Earnings –
3/7/2013
•
•
Quality
Quality
•
•
Cost
Cost
•
•
Sense of Urgency
Sense of Urgency
•
•
Great Products
Great Products
•
•
Customer Satisfaction
Customer Satisfaction
•
•
People
People
Guiding
Principles Near-Term Priorities
2013
2013
Drive to Deliver
Drive to Deliver
Deliver Our
2013 Plans
Hit Our
Launches
Improve
Quality |
 NYSE:
NAV APPENDIX |
 23
NYSE: NAV
1Q 2013 Earnings –
3/7/2013
Navistar Financial Corporation
Highlights
•
1Q 2013: $22 million Financial Services Segment Profit
•
Total U.S. financing availability of $1.0B as of January 31, 2013 (includes
bank facility availability of $500M)
•
Debt/Equity Leverage: 2½:1
Subsequent Events
•
Wholesale securitization completed in February for $200M
•
Better pricing and advance rate
•
Wholesale variable funding facility reduced from $750M to $500M in February
Retail Notes
Bank Facility
•
$840M facility refinanced in
December 2011, maturity
extended from 2012 to 2016
–
Funding for retail notes,
wholesale notes, retail
accounts, and dealer open
accounts
•
On balance sheet
•
NFSC wholesale trust as of
January 2013
–
$974M funding facility
–
Variable portion matures
August 2013
–
Term portion matures October
2013
•
On balance sheet
•
Broader product offering
•
Enhanced ability to support
large fleets
•
Better access to less
expensive capital
Dealer Floor Plan |
 24
NYSE: NAV
1Q 2013 Earnings –
3/7/2013
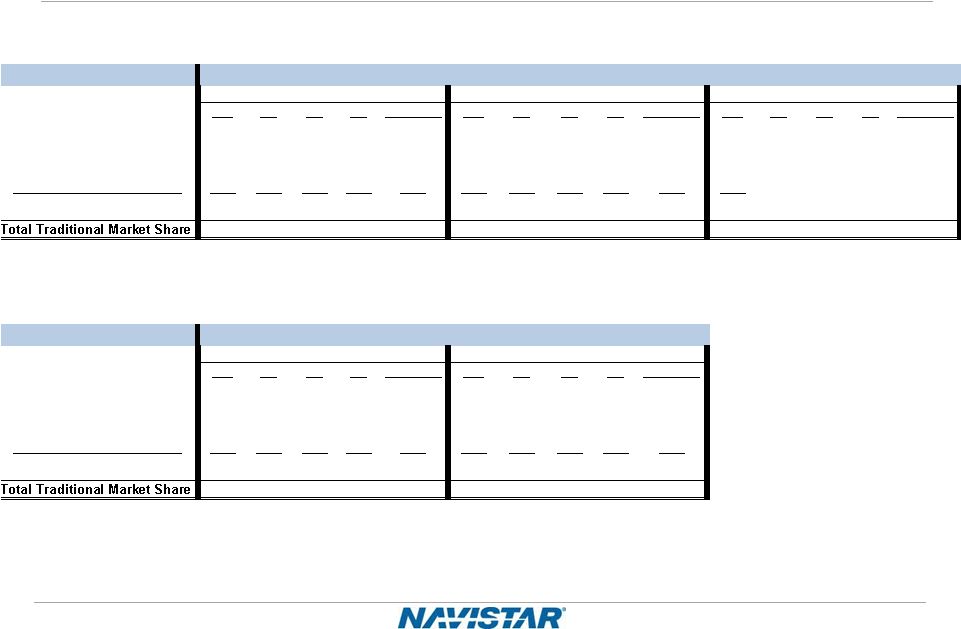
Market Share
NEW VIEW
Traditional Market Share
Q1
Q2
Q3
Q4
Full Year
Q1
Q2
Q3
Q4
Full Year
Q1
Q2
Q3
Q4
Full Year
School buses*
55%
45%
45%
40%
45%
41%
39%
38%
43%
41%
38%
Class 6 and 7 medium trucks
36%
36%
46%
44%
41%
27%
36%
36%
34%
33%
25%
Class 8 heavy trucks
17%
16%
17%
18%
17%
17%
15%
15%
13%
15%
11%
Class 8 severe service trucks
33%
32%
36%
37%
35%
31%
30%
30%
30%
30%
26%
Combined Class 8
21%
19%
21%
22%
21%
19%
18%
18%
17%
18%
14%
25%
24%
28%
28%
26%
22%
23%
23%
24%
23%
18%
OLD VIEW
Traditional Market Share
Q1
Q2
Q3
Q4
Full Year
Q1
Q2
Q3
Q4
Full Year
School buses
49%
45%
47%
53%
49%
48%
48%
47%
49%
48%
Class 6 and 7 medium trucks
36%
36%
46%
44%
41%
27%
36%
36%
34%
33%
Class 8 heavy trucks
17%
16%
17%
18%
17%
17%
15%
15%
13%
15%
Class 8 severe service trucks
33%
32%
36%
37%
35%
31%
30%
30%
30%
30%
Combined Class 8
21%
19%
21%
22%
21%
19%
18%
18%
17%
18%
27%
26%
29%
29%
28%
22%
24%
24%
23%
23%
2011
2012
2012
2013
*Beginning in FY2013, Navistar has adjusted the way bus market share is
calculated. Navistar previously self reported retail deliveries and beginning FY2013 is using Polk
registrations as the data source to improve accuracy. Additionally, school
bus market share values now consist of class B/C/D buses. Historical data, which previously
contained only class C/D buses, has been adjusted to reflect this change in
methodology. All quarter data for bus is reported on a one month lag.
2011
Market Share –
U.S. & Canada School Bus and Class 6-8
Market Share –
U.S. & Canada School Bus and Class 6-8
We define our “traditional” markets to include U.S. and Canada School bus and Class 6
through 8 medium and heavy truck. We classify militarized commercial vehicles sold to the U.S.
and Canadian militaries as Class 8 severe service within our “traditional” markets. Beginning in 2011, our competitors are reporting certain RV and
commercial bus chassis units consistently with how we report these units. Our “traditional”
markets include CAT-branded units sold to Caterpillar under our North America supply
agreement. |
 25
NYSE: NAV
1Q 2013 Earnings –
3/7/2013
Worldwide Truck Chargeouts
We define our “traditional”
markets
to include U.S. and Canada School
bus and Class 6 through 8 medium
and heavy truck. We classify
militarized commercial vehicles
sold to the U.S. and Canadian
militaries as Class 8 severe service
within our “traditional”
markets. Our
“traditional”
markets include CAT-
branded units sold to Caterpillar
under our North America supply
agreement.
FISCAL YEAR 2011
Q1
Q2
Q3
Q4
FULL YEAR
BUS
2,100
2,000
2,200
2,900
9,200
MEDIUM
4,600
7,200
7,400
7,900
27,100
HEAVY
4,700
5,200
6,800
9,000
25,700
SEVERE
2,700
3,200
3,700
3,700
13,300
TOTAL
14,100
17,600
20,100
23,500
75,300
NON-TRADITIONAL MILITARY
100
400
200
700
1,400
EXPANSIONARY
4,900
6,900
8,000
9,500
29,300
WORLDWIDE TRUCK-Continued Ops
19,100
24,900
28,300
33,700
106,000
DISCONTINUED OPERATIONS
400
700
600
700
2,400
WORLDWIDE TRUCK-Total
19,500
25,600
28,900
34,400
108,400
FISCAL YEAR 2012
Q1
Q2
Q3
Q4
FULL YEAR
BUS
1,700
2,600
2,900
2,500
9,700
MEDIUM
4,300
7,100
5,800
4,700
21,900
HEAVY
8,000
7,200
6,300
5,600
27,100
SEVERE
3,300
3,600
3,600
3,100
13,600
TOTAL
17,300
20,500
18,600
15,900
72,300
NON-TRADITIONAL MILITARY
200
400
500
500
1,600
EXPANSIONARY
7,200
7,300
7,600
7,400
29,500
WORLDWIDE TRUCK-Continued Ops
24,700
28,200
26,700
23,800
103,400
DISCONTINUED OPERATIONS
200
200
400
900
1,700
WORLDWIDE TRUCK-Total
24,900
28,400
27,100
24,700
105,100
FISCAL YEAR 2013
Q1
Q2
Q3
Q4
FULL YEAR
BUS
2,100
-
-
-
2,100
MEDIUM
4,100
-
-
-
4,100
HEAVY
4,500
-
-
-
4,500
SEVERE
2,400
-
-
-
2,400
TOTAL
13,100
-
-
-
13,100
NON-TRADITIONAL MILITARY
300
-
-
-
300
EXPANSIONARY
6,600
-
-
-
6,600
WORLDWIDE TRUCK-Continued Ops
20,000
-
-
-
20,000
DISCONTINUED OPERATIONS
200
-
-
-
200
WORLDWIDE TRUCK-Total
20,200
0
0
0
20,200 |
 26
NYSE: NAV
1Q 2013 Earnings –
3/7/2013
Navistar
Q1
Q2
Q3
Q4
Full Year
OEM sales - South America
27,200
37,100
38,200
36,100
138,600
Other OEM sales
4,500
4,400
3,700
3,600
16,200
Intercompany sales
17,300
23,500
22,300
25,700
88,800
Total Shipments
49,000
65,000
64,200
65,400
243,600
Navistar
Q1
Q2
Q3
Q4
Full Year
OEM sales - South America
24,100
25,300
28,600
28,700
106,700
Other OEM sales
2,200
2,000
3,000
2,900
10,100
Intercompany sales
21,600
23,400
20,600
17,500
83,100
Total Shipments
47,900
50,700
52,200
49,100
199,900
Navistar
Q1
Q2
Q3
Q4
Full Year
OEM sales - South America
25,700
-
-
-
25,700
Other OEM sales
1,900
-
-
-
1,900
Intercompany sales
16,400
-
-
-
16,400
Total Shipments
44,000
-
-
-
44,000
2013
2011
2012
Worldwide Engine Shipments |
 27
NYSE: NAV
1Q 2013 Earnings –
3/7/2013
Order Receipts –
U.S. & Canada
(in units)
2012
2013
Change
Percentage
Change
"Traditional" Markets (U.S. and Canada)
School buses
2,100
1,500
(600)
-29%
Class 6 and 7 medium trucks
5,400
3,300
(2,100)
-39%
Class 8 heavy trucks
8,100
5,800
(2,300)
-28%
Class
8
severe
service
trucks
(A)
4,000
1,900
(2,100)
-53%
Total "traditional" markets
19,600
12,500
(7,100)
-36%
Combined class 8 trucks
12,100
7,700
(4,400)
-36%
Three Months Ended
January 31,
Order Receipts: U.S. & Canada (Units)
We define our “traditional” markets to include U.S. and Canada School bus and Class 6
through 8 medium and heavy truck. We classify militarized commercial vehicles sold to the U.S.
and Canadian militaries as Class 8 severe service within our “traditional” markets. Our
“traditional” markets include CAT-branded units sold to Caterpillar under our North
America supply agreement. |
 28
NYSE: NAV
1Q 2013 Earnings –
3/7/2013
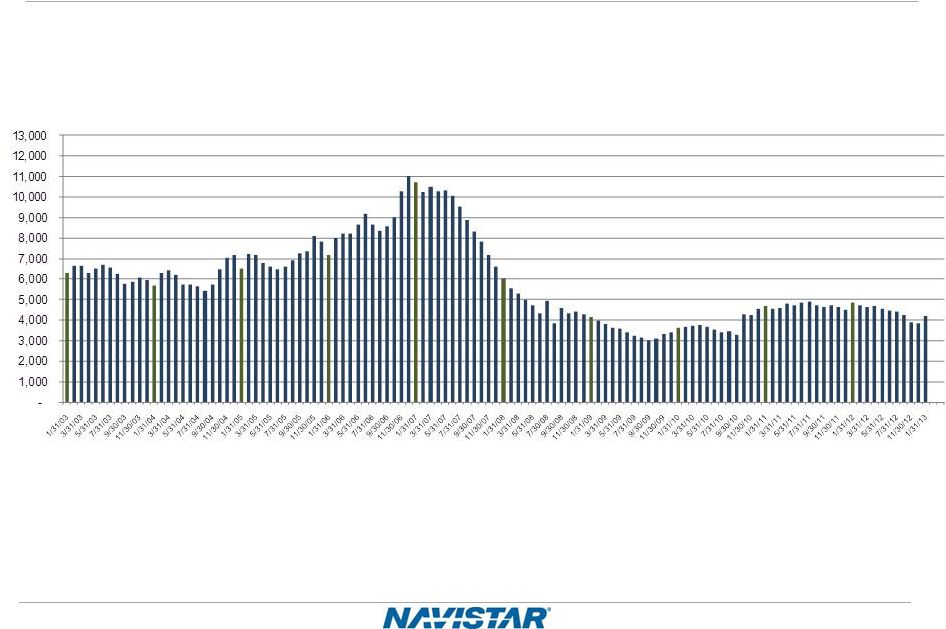
U.S. and Canada Dealer Stock Inventory*
*Includes U.S. and Canada Class 4-8 and school bus inventory, but does not
include U.S. IC Bus or Workhorse Custom Chassis inventory. Excludes the US
portion of IC Bus |
 29
NYSE: NAV
1Q 2013 Earnings –
3/7/2013
Frequently Asked Questions
Q1:
What is included in Corporate and Eliminations?
A:
The primary drivers of Corporate and Eliminations are Corporate SG&A, pension
and OPEB expense (excluding amounts allocated to the segments), annual
incentive, manufacturing interest expense, and the elimination of intercompany sales and profit between
segments.
Q2:
What is included in your equity in loss of non-consolidated affiliates?
A:
Equity in loss of non-consolidated affiliates is derived from our ownership
interests in partially-owned affiliates that are not consolidated.
Q3:
What is your net income attributable to non-controlling interests?
A:
Net income attributable to non-controlling interests is the result of the
consolidation of subsidiaries in which we do not own 100%, and is primarily
comprised of Ford's non-controlling interest in our Blue Diamond Parts joint venture.
Q4:
How will the changing Department of Defense (DoD) budget affect Navistar in FY
2013? A:
We ended FY 2012 with approximately $1.1 billion in military revenues and based on
the current environment we expect military revenues for FY 2013 to be
approximately $750 million. The coming year will present challenges, but
Navistar’s commercial expertise
may
be
an
advantage
when
the
DoD
is
asked
to
“do
more
with
less.”
In
addition,
the
Company
continues
to
pursue
a
number of foreign military opportunities. Finally, the Company has a fleet of more
than 34,000 vehicles in operation in approximately 26 countries, including
more than 9,000 vehicles operating with Afghan Security Forces. These vehicles will require parts and
sustainment support throughout their lifecycles.
Q5:
How would Sequestration impact Navistar?
A:
The full impact of Sequestration is still not known. While we will likely see some
impact to the number of defense orders our business structure and product
portfolio lessen the risk. Q6:
What are your expected 2013 and beyond pension funding requirements?
A:
Future contributions are dependent upon a number of factors, principally the
changes in values of plan assets, changes in interest rates
and
the
impact
of
any
funding
relief
currently
under
consideration.
In
2013,
we
expect
to
contribute
$166
million
to
meet
the
minimum required contributions for all plans. We currently expect that from 2014
through 2016, the Company will be required to contribute
at
least
$200
million
per
year
in
to
the
Plans,
depending
on
asset
performance
and
discount
rates.
This
is
lower
than
our
previously
reported
expectations
due
to
the
impact
of
the
Moving
Ahead
for
Progress
in
the
21st
Century
Act
which
was
enacted
in
July 2012. |
 30
NYSE: NAV
1Q 2013 Earnings –
3/7/2013
Frequently Asked Questions
Q7:
Why did the Company establish an additional valuation allowance on its domestic
deferred tax assets in the fourth quarter of 2012?
A:
On a quarterly basis, we are required to evaluate the need to establish a valuation
allowance for our deferred tax assets based on our assessment of whether it
is more likely than not that current or deferred tax benefits will be realized through the generation of
future taxable income. We give appropriate consideration to all available evidence,
both positive and negative, in assessing the need
for
a
valuation
allowance.
In
the
fourth
quarter
of
2012
we
concluded
that
with
the
continued
deterioration
of
our
domestic
performance and additional significant warranty charges, there was not sufficient
objective evidence of our ability to realize the benefits of domestic
deferred tax assets on a more likely than not basis and accordingly established a full domestic valuation
allowance.
Q8:
How will the establishment of the valuation allowance affect future tax expense?
A:
In the foreseeable future, our tax expense will be limited to our significant
foreign locations. Therefore, our effective tax rate could be impacted and
distortive in comparison to our peers without a valuation allowance. Q9:
What is your expectation for future cash tax payments?
A:
Our
cash
tax
payments
will
remain
low
in
2013
and
will
gradually
increase
as
we
utilize
available
net
operating
losses
(NOLs)
and
tax credits in the future years.
Q10:
What is the current balance of net operating losses as compared to other deferred tax
assets? A:
As of October 31, 2012 the Company has deferred tax assets for U.S. federal NOLs
valued at $319 million, state NOLs valued at $95
million,
and
foreign
NOLs
valued
at
$169
million,
for
a
total
undiscounted
cash
value
of
$583
million.
In
addition
to
NOLs,
the
Company has deferred tax assets for accumulated tax credits of $218 million and
other deferred tax assets of $2.1 billion resulting in net deferred tax
assets before valuation allowances of approximately $2.9 billion. Of this amount, $2.7 billion is subject to a valuation
allowance at the end of FY2012. |
 31
NYSE: NAV
1Q 2013 Earnings –
3/7/2013
Frequently Asked Questions
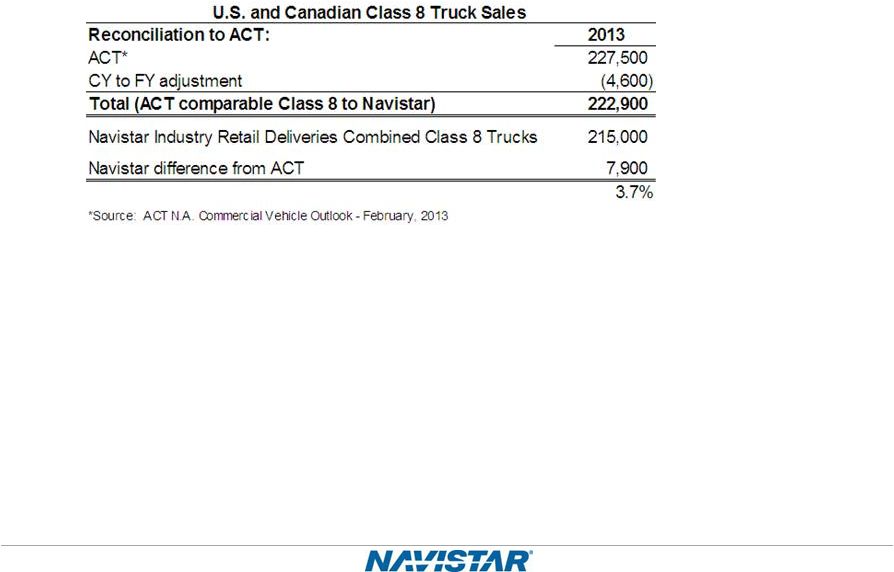
Q11:
How does your FY 2013 Class 8 industry compare to ACT Research?
A:
Q12:
What is your manufacturing interest expense for Fiscal Year 2013?
A:
Interest expense is forecasted at $242 million.
Q13:
What should we assume for capital expenditures in Fiscal Year 2013?
A:
We plan to continue capital spending within the traditionally guided range of $200
million to $300 million for products and development
although
we
expect
to
be
at
the
lower
end
of
the
range.
Capital
spending
related
to
Engineering
Integration
is
funded
through the RZFBs and is not included in that range. |
 32
NYSE: NAV
1Q 2013 Earnings –
3/7/2013
Frequently Asked Questions
Q14:
For the manufacturing debt currently outstanding in your most recent financial
statement filings, what are the respective maturity dates and principal amounts
outstanding? A:
The amounts and maturity dates are as follows (the values shown below are the
amounts due and exclude the accounting impact of any OID or
bifurcation): Senior Secured Term Loan Credit Facility, due July 16,
2014 $998 million
8.25% Senior Notes due November 1, 2021
$900 million
3.0% Senior Subordinated Convertible Notes due October 15, 2014
$570 million
Debt of majority owned dealerships (various maturity dates)
$51 million
Financing arrangements and capital lease obligations (various maturity
dates) $93 million
Loan Agreement related to the 6.5% Tax Exempt Bonds due October 1, 2040
$225 million
Promissory Note due September 30, 2015
$28 million
Other (various maturity dates)
$68 million
Total
$2,933 million |
 33
NYSE: NAV
1Q 2013 Earnings –
3/7/2013
The
debt
balances
listed
above
include
accounting
impacts
of
any
OID
and
bifurcation.
Outstanding Debt Balances
Manufacturing operations:
Senior Secured Term Loan Credit Facility, due 2014, net of unamortized
discount of $9 and $8, respectively
………………………………………………………………………………………………..
$ 991
$
990 872
873
3.0% Senior Subordinated Convertible Notes, due 2014, net of
unamortized discount of $50 and $44, respectively
………………………………………………………………………………………………..
520
526
Debt of majority-owned dealerships
………………………………………………………………………
60
51
Financing arrangements and capital lease obligations
………………………………………………….…
140
93
Loan Agreement related to 6.5% Tax Exempt Bonds, due 2040
…………………………………….….…
225
225
Promissory Note
……………………………………………………………………………………..……
30
28
Other
…………………………………………………………………………………………………….…
67
68
Total manufacturing operations debt
………………………………………………………………..…
2,905
2,854
Less: Current portion
……………………………………………………………………………………...
172
125
Net long-term manufacturing operations debt
……………………………………………………..….
$ 2,733
$ 2,729
Financial Services operations:
Asset-backed debt issued by consolidated SPEs, at fixed and
variable rates, due serially through 2019
$ 994
$
811 763
726
Commercial paper, at variable rates, matured in 2013
………………………………………………...…
31
—
Borrowings secured by operating and finance leases, at various rates,
due serially through 2017 ……… 78
71
Total financial services operations debt
………………………………………………………………
1,866
1,608
Less: Current portion
…………………………………………………………………………..…………
1,033
811
Net long-term financial services operations debt
………………………………………..……………
$ 833
$
797 October
31,
2012
January 31,
2013
(in millions)
Bank revolvers, at fixed and variable rates, due dates from 2013
through 2019 …………………………
8.25% Senior Notes, due 2021, net of unamortized discount of $28 and
$27, respectively ……………… |
 34
NYSE: NAV
1Q 2013 Earnings –
3/7/2013
Manufacturing Cash Flow
Beginning Mfg. Cash
1
Balance
Fiscal 2010
Fiscal 2011
Fiscal 2012
Q1 2013
October 31, 2009
1,152
$
October 31, 2010
1,100
$
October 31, 2011
1,186
$
October 31, 2012
1,505
$
Approximate Cash Flows:
From Operations
409
680
(298)
(203)
From Investing / (Cap Ex)
(350)
(485)
(362)
(71)
From Financing / (Debt Pay Down)
(110)
(106)
977
(37)
Exchange Rate Effect
(1)
(3)
2
(5)
Net Cash Flow
(52)
$
86
$
319
$
(316)
$
Ending Mfg. Cash
1
Balance:
October 31, 2010
1,100
$
October 31, 2011
1,186
$
October 31, 2012
1,505
$
January 31, 2013
1,189
$
1
Cash = Cash, Cash Equivalents & Marketable Securities
|
 35
NYSE: NAV
1Q 2013 Earnings –
3/7/2013
SEC Regulation G Non-GAAP Reconciliation
The financial measures presented below are unaudited and not in accordance with, or an alternative for,
financial measures presented in accordance with U.S. generally accepted accounting principles
(GAAP). The non-GAAP financial information presented herein should be considered
supplemental to, and not as a substitute for, or superior to, financial measures calculated in accordance with
GAAP.
Manufacturing Segment Results: We believe
manufacturing segment results, which includes the segment results of our Truck, Engine, and Parts reporting segments,
provide meaningful information of our core manufacturing business and therefore we use it to
supplement our GAAP reporting by identifying items that may not be related to the core
manufacturing business. Management often uses this information to assess and measure the
performance of our operating segments. We have chosen to provide this supplemental information to investors, analysts
and other interested parties to enable them to perform additional analyses of operating results, to
illustrate the results of operations giving effect to the non-GAAP adjustments shown in the
below reconciliation, and to provide an additional measure of performance.
Earnings (loss) Before Interest, Income Taxes, Depreciation, and Amortization (“EBITDA”):
We define EBITDA as our consolidated net income (loss) from continuing operations attributable to
Navistar International Corporation, net of tax, plus manufacturing interest expense, income
taxes, and depreciation and amortization. We believe EBITDA provides meaningful information to
the performance of our business and therefore we use it to supplement our GAAP reporting. We have
chosen to provide this supplemental information to investors, analysts and other interested parties to
enable them to perform additional analyses of operating results.
Manufacturing Cash Flow and Manufacturing Cash, Cash Equivalents, and Marketable Securities: Manufacturing cash flow
is used and is presented to aid in developing an understanding of the ability of our operations to generate
cash for debt service and taxes, as well as cash for investments in working capital, capital
expenditures and other liquidity needs. This information is presented as a supplement to the
other data provided because it provides information which we believe is useful to investors for
additional analysis. Our manufacturing cash flow is prepared with marketable securities being treated as a cash
equivalent. Manufacturing cash, cash equivalents, and marketable securities represents the
Company’s consolidated cash, cash equivalents, and marketable securities excluding cash,
cash equivalents, and marketable securities of our financial services operations. We include
marketable securities with our cash and cash equivalents when assessing our liquidity position as our
investments are highly liquid in nature. We have chosen to provide this supplemental information to
investors, analysts and other interested parties to enable them to perform additional analyses
of operating results, to illustrate the results of operations giving effect to the non-GAAP
adjustments shown in the below reconciliation, and to provide an additional measure of performance. |
 36
NYSE: NAV
1Q 2013 Earnings –
3/7/2013
SEC Regulation G –
Manufacturing Cash Fiscal Year Comparison
Manufacturing cash, cash equivalents, and marketable securities reconciliation:
(Dollars in Millions)
October 31,
2010
October 31,
2011
October 31,
2012
January 31,
2013
Manufacturing segment cash and cash equivalents
534
$
488
$
1,059
$
438
$
Financial services segment cash and cash equivalents
51
51
28
59
Consolidated cash and cash equivalents
585
$
539
$
1,087
$
497
$
Manufacturing marketable securities
566
$
698
$
446
$
751
$
Financial services segment marketable securities
20
20
20
20
Consolidated marketable securities
586
$
718
$
466
$
771
$
Manufacturing segment cash and cash equivalents
534
$
488
$
1,059
$
438
$
Manufacturing marketable securities
566
698
446
751
Manufacturing segment cash, cash equivalents and marketable securities
1,100
$
1,186
$
1,505
$
1,189
$ |
 37
NYSE: NAV
1Q 2013 Earnings –
3/7/2013
SEC Regulation G –
Manufacturing Cash
(Dollars in Millions)
Manufacturing
Operations
Financial
Services
Operations
Adjustments
Condensed
Consolidated
Cash Flows
For the year ended October 31, 2010
Cash flows from operations
$ 409
$ 698
$
- $
1,107
Cash flows from investing / capital expenditures:
(350)
492
(576)
(434)
Cash flows from financing / debt pay down
(110)
(1,180)
(10)
(1,300)
Effect of exchange rate changes
(1)
1
-
-
Net cash flows
(52)
11
(586)
(627)
Beginning cash, cash equivalents and marketable securities
balance
1,152
60
-
1,212
Ending cash, cash equivalents and marketable securities balance
$ 1,100
$
71 $
(586) $
585 For the year ended October 31, 2011
Cash flows from operations
$ 680
$ 200
$
-
$ 880
Cash flows from investing / capital expenditures:
(485)
(206)
(132)
(823)
Cash flows from financing / debt pay down
(106)
6
-
(100)
Effect of exchange rate changes
(3)
-
-
(3)
Net cash flows
86
-
(132)
(46)
Beginning cash, cash equivalents and marketable securities
balance
1,100
71
(586)
585
Ending cash, cash equivalents and marketable securities balance
$
1,186
$
71
$
(718)
$
539
Manufacturing segment cash flow reconciliation: |
 38
NYSE: NAV
1Q 2013 Earnings –
3/7/2013
SEC Regulation G –
Manufacturing Cash
(Dollars in Millions)
Manufacturing
Operations
Financial
Services
Operations
Adjustments
Condensed
Consolidated
Cash Flows
For the year ended October 31, 2012
Cash flows from operations
$ (298)
$ 908
$
- $
610 Cash flows from investing / capital expenditures:
(362)
108
252
(2)
Cash flows from financing / debt pay down
977
(1,040)
-
(63)
Effect of exchange rate changes
2
1
-
3
Net cash flows
319
(23)
252
548
Beginning cash, cash equivalents and marketable securities
balance
1,186
71
(718)
539
Ending cash, cash equivalents and marketable securities balance
$ 1,505
$
48 $
(466) $ 1,087
For the three months ended January 31, 2013
Cash flows from operations
$ (203)
$ 269
$
-
$
66 Cash flows from investing / capital expenditures:
(71)
29
(305)
(347)
Cash flows from financing / debt pay down
(37)
(266)
-
(303)
Effect of exchange rate changes
(5)
(1)
-
(6)
Net cash flows
(316)
31
(305)
(590)
Beginning cash, cash equivalents and marketable securities
balance
1,505
48
(466)
1,087
Ending cash, cash equivalents and marketable securities balance
$ 1,189
$
79 $
(771) $
497 Manufacturing segment cash flow reconciliation: |
 39
NYSE: NAV
1Q 2013 Earnings –
3/7/2013
SEC Regulation G –
EBITDA reconciliation:
Three Months Ended
January 31,
(in millions)
2013
2012
Loss from continuing operations attributable to NIC, net of tax
$
)
$
(144
)
Plus:
Depreciation and amortization expense
……………...................................
78
Manufacturing interest expense
(A)
…........................................................
56
36
Less:
Income tax benefit (expense)
.................................................................
(15)
76
EBITDA
$
57
$
(106
)
(A)
Manufacturing interest expense is the net interest expense primarily generated
from borrowings that support our manufacturing and corporate operations,
adjusted to eliminate intercompany interest expense with our Financial Services segment. The
following table reconciles Manufacturing interest expense to the consolidated
interest expense. Three Months Ended
January 31,
(in millions)
2013
2012
Interest expense
...........................................................................................................................
$
74
$
61
Less:
Financial services interest
expense.....................................................................................
(18)
(25
)
Manufacturing
interest expense
…...............................................................................................
$
56
$
36
(114
100
Manufacturing segment profit (loss) reconciliation:
Three Months Ended
January 31,
(in millions)
2013
2012
Loss from continuing operations attributable to NIC, net of tax
.............................................................
$
(114)
$
(144)
Less:
Financial services segment profit
..................................................................................................
22
27
Corporate and eliminations
...........................................................................................................
(122
)
(150)
Income tax benefit (expense)
......................................................................................................
(15)
76
Manufacturing segment profit (loss)
.................................................................................................
$
1
$
(97)
.........................
................................
.................................................................................................
|
 40
NYSE: NAV
1Q 2013 Earnings –
3/7/2013
SEC Regulation G –
Significant Items included within our results:
Three Months Ended
January 31,
(in millions)
2013*
2012
Accelerated depreciation
(A)
..............................................................................................................
$
25
$
Charges for non-conformance penalties
(B)
......................................................................................
10
Legal settlement
(C)
...........................................................................................................................
(35)
Adjustments to pre-existing warranties
(D)
........................................................................................
—
8
Engineering integration costs
(E)
.......................................................................................................
—
______________
(A)
The charges for accelerated depreciation, of which $15 million was recognized in the Truck segment and
$10 million in the Engine segment, included $13 million for certain assets related to the
discontinuation of our MaxxForce15L engine and $12 million for certain assets related to the
planned closure of our Garland Facility. (B)
In the first quarter of 2013, our Engine segment recorded a charge of $10 million for NCPs, primarily
for certain 13L engine sales.
(C)
As a result of the legal settlement with Deloitte and Touch LLP in December 2012, we received cash
proceeds of $35 million, which was recorded as a gain to Other expense (income) in the first
quarter of 2013. (D)
The warranty adjustment represents an unanticipated increase in warranty spend for certain 2007 and
2010 emission standard engines, with the majority relating to the initial build of 2010
emission standard engines. Component complexity associated with meeting new emission standards
have contributed to higher repair costs, which have exceeded those that we have historically
experienced. In the first quarter of 2012, we recorded a charge for adjustments to
pre-existing warranties of $123 million, offset by a tax benefit of $42 million. Our Engine
segment recognized pre-tax charges of $112 million for adjustments to pre-existing
warranties.
(E)
Engineering integration costs relate to the consolidation of our truck and engine engineering
operations, as well as the relocation of our world headquarters. In the first quarter of 2012,
the charge included related costs of $12 million, offset by a tax benefit of $4 million. Our
Truck segment recognized pre-tax costs of $9 million relating to these actions in the first
quarter of 2012. *
There was no tax effect on the significant items included with our results in the first quarter of
2013, due to valuation allowance on our U.S. deferred tax assets.
|
 41
NYSE: NAV
1Q 2013 Earnings –
3/7/2013
ROIC Definition
(PBT
1
+ Mfg Interest + Implied Interest on Operating Leases) X (1-Cash Tax
Rate) Paid-in-Capital –
Treasury Stock + Retained Earnings
2
+ Book Value of
Operating Leases + Book Value of Mfg Debt
3
–
Mfg Cash
4
1
–
Excludes significant items items such as restructuring, impairments, and
engineering integration expenses
2
–
If an Accumulated Deficit exists, then it will not be included in the
calculation 3
–
Excludes Financial Services Operation debt
4
–
Manufacturing Cash includes Cash and cash equivalents + Marketable
securities |