Attached files
| file | filename |
|---|---|
| 8-K - FORM 8-K - REGIONS FINANCIAL CORP | d493509d8k.htm |
 Citi
US Financial Services Conference
March 6, 2013
David Turner
Chief Financial Officer
1
Exhibit 99.1 |
 Why
Regions? Competitive Position
•
Strong market presence
•
Competitive product set
•
Stronger company today than three years ago
•
Revenue growth on par with peers
•
Disciplined expense management
Opportunity for
Outperformance
•
Improving efficiency ratio
•
Stable net interest margin
•
Significant credit leverage remains
•
Low loan to deposit ratio
Moving Forward
•
Creating shared value for our customers, communities,
associates and shareholders
•
Business plan to support growth
2
Proven Track Record |
 A
leading southeastern banking franchise Company Snapshot
December 2012
Associates
23,427
Assets
$121B
Loans
$74B
Deposits
$95B
Branches
1,711
ATMs
2,054
Market Cap*
$10.8B
* As of February 27, 2013
Regions Branches
Deposit Market Share
Regions Insurance Group
3
#1
#2
#1
#1
#6
#4
#4
#
•
14 largest full-service bank
•
Operating in sixteen states; however,
seven states represent 85% of total
deposits
•
Primary business lines: Consumer
Services, Business Services and
Wealth Management
•
Full line insurance brokerage firm
offering all lines of personal and
commercial insurance
th |
 4
Top 10 MSAs
Deposits
Market
Rank
’10-’15
Population
Growth
Birmingham, AL
$10.1
1
Nashville, TN
$7.0
1
Tampa, FL
$5.0
4
Miami, FL
$4.0
11
Memphis, TN
$3.9
2
Atlanta, GA
$3.3
6
St. Louis, MO
$3.0
4
Jackson, MS
$2.9
2
New Orleans, LA
$2.4
4
Mobile, AL
$2.3
1
($ in billions)
National Average: 3.9%
Source: SNL Financial
Note: Core Markets include AL, FL, LA, MS, AR, TN
Rank
Name
Market
Share
1
Bank of America
11.1%
2
Wells Fargo
9.9%
3
Regions
9.4%
4
SunTrust
6.7%
5
JPMorgan Chase
3.8%
6
BB&T
3.0%
7
Capital One
2.2%
8
First Horizon
2.0%
9
Hancock
1.7%
10
Citi
1.6%
Weighted Average Deposit
Market Share in Regions’
Core Markets
Characterized by high market share, high growth markets
3.4%
9.6%
3.7%
1.4%
4.3%
10.1%
2.0%
4.4%
8.8%
1.0%
Footprint positioning |
 5
Balance Sheet
4Q12
4Q09
Improvement
Deposit Costs
0.22%
1.15%
93 bps
Total Funding Costs
0.50%
1.45%
95 bps
Time Deposits as % of Total Deposits
14%
32%
Reduced by half
Low-Cost Deposits
$82.0B
$67.1B
22%
Profitability
Mortgage Revenue
$90MM
$46MM
96%
Net Interest Margin
(1)
3.10%
2.72%
38 bps
Efficiency Ratio
(2)
64.42%
67.88%
346 bps
Credit Risk Profile
Non-Performing Assets
$1.9B
$4.4B
57%
Net Charge-Offs
$180MM
$692MM
74%
Allowance for Loan Losses / Loans
2.59%
3.43%
84 bps
Capital and Liquidity
Tier 1 Common Ratio
(3)
10.8%
7.1%
370 bps
Loan to Deposit Ratio
78%
92%
More liquid
Stronger company today
(1)
4Q12 from continuing operations; 4Q09 as reported
(2)
Annual Ratio
(3)
Non-GAAP -
see appendix for reconciliation |
 6
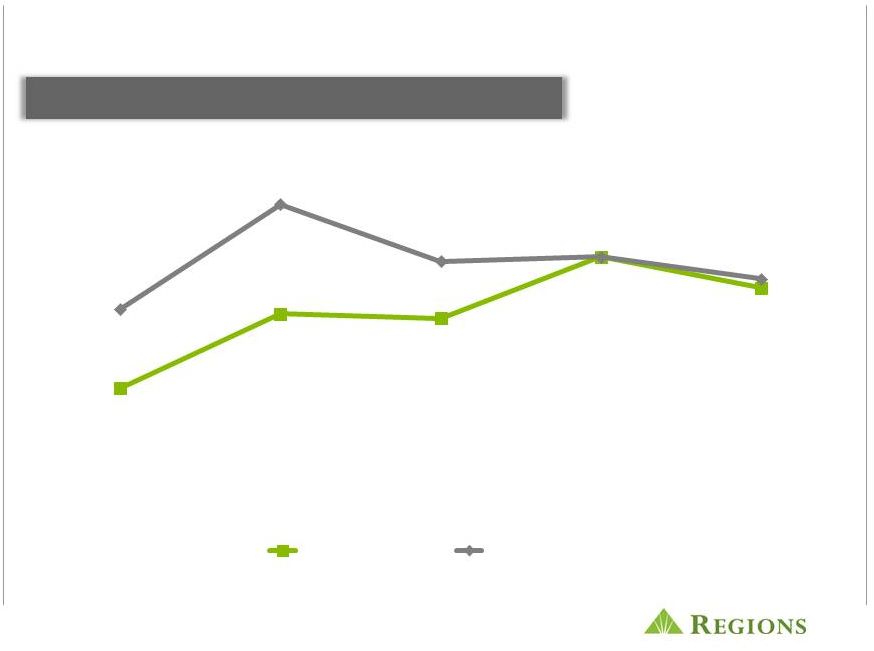
Revenue growth –
continuing to make progress
Peer banks include BBT, CMA, FHN, FITB, HBAN, KEY, MTB, PNC, STI, USB, WFC,
ZION Note: Net interest income on FTE basis and non-interest revenue
adjusted to exclude non-recurring items Source: SNL Financial
Growth in Total Revenue Linked Quarter vs Peers
-2.0%
-0.3%
-0.4%
1.0%
0.3%
-0.2%
2.2%
0.9%
1.0%
0.5%
4Q11
1Q12
2Q12
3Q12
4Q12
Regions
Peer Median |
 Regions has the second lowest expense to assets
ratio vs peers and reduced expenses faster than
almost all our peers
Non-Interest Expense
(1)
/ Average Assets
Full Year 2012 vs. Full Year 2011 % Change
2.6%
2.8%
3.0%
3.0%
3.1%
3.2%
3.3%
3.4%
3.5%
3.5%
3.5%
3.9%
4.3%
Bank
#1
RF
Bank
#3
Bank
#4
Bank
#5
Bank
#6
Bank
#7
Bank
#8
Bank
#9
Bank
#10
Bank
#11
Bank
#12
Bank
#13
-4%
-2%
-1%
0%
2%
4%
4%
4%
5%
5%
9%
11%
12%
Bank
#1
RF
Bank
#3
Bank
#4
Bank
#5
Bank
#6
Bank
#7
Bank
#8
Bank
#9
Bank
#10
Bank
#11
Bank
#12
Bank
#13
7
(1) 4Q12 Adjusted to exclude non-core items, ratios are annualized –
Peer banks include: BBT, CMA, FHN, FITB, HBAN, KEY, MTB, PNC, STI, USB, WFC, ZION
Source: SNL Financial
See
appendix
for
reconciliation |
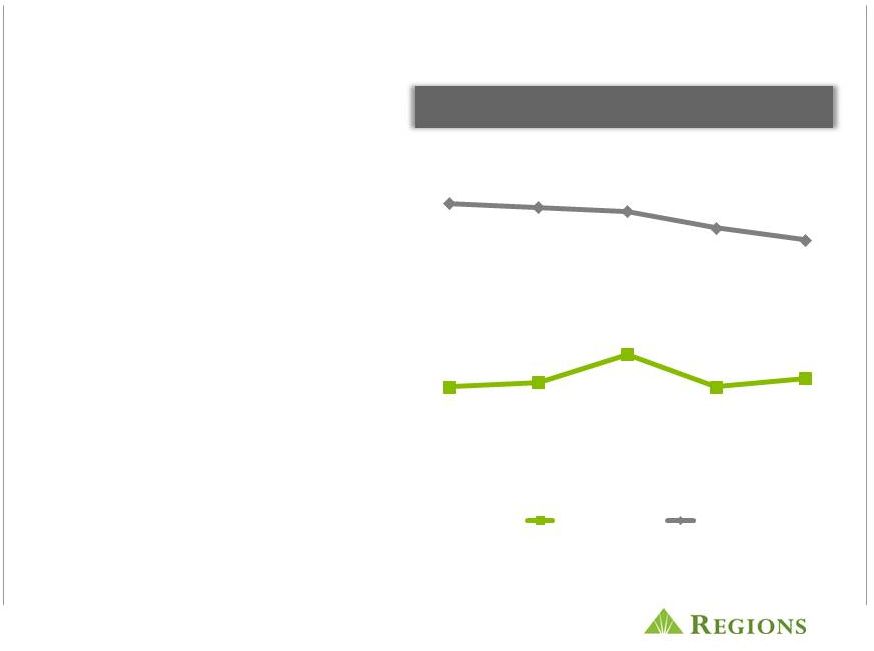
 8
Focused on improved efficiency
(1) Non-GAAP –
See appendix for reconciliation
Note: Results from Continuing Operations
Peer banks include: BBT, CMA, FHN, FITB, HBAN, KEY, MTB, PNC, STI, USB, WFC, ZION
Source: SNL Financial
Target:
Mid to High
50s
Efficiency Ratio
(1)
70.1%
67.9%
64.6%
65.0%
64.2%
65.3%
62.8%
64.3%
62.7%
4Q11
1Q12
2Q12
3Q12
4Q12
Regions
Peer Median
64.3% |
 •
Net interest margin was up 2
bps linked quarter, primarily
due to lower deposit costs
and interest recoveries
•
Opportunities to protect the
margin through:
•
Continued reduction of
deposit costs
•
Retention of 15-year
fixed rate mortgages
•
Liability management
opportunities
•
Outlook is for a relatively
stable margin in 2013
Net interest margin improves
Note: Peer banks include BBT, CMA, FHN, FITB, HBAN, KEY, MTB, PNC, STI, USB, WFC,
ZION Source: SNL Financial
Net Interest Margin vs. Peers
4Q11
1Q12
2Q12
3Q12
4Q12
3.53%
3.51%
3.52%
3.44%
3.47%
3.08%
3.16%
3.09%
3.10%
3.08%
Regions
Peer Average
9 |
 Continued asset quality improvement
Significant credit leverage remains
Note: Peer banks include BBT, CMA, FHN, FITB, HBAN, KEY, MTB, PNC, STI, USB, WFC,
ZION Source: SNL Financial
58% decrease Y-O-Y
Allowance for Loan Losses / Total Loans
Net Charge-Offs and Ratio
($ in millions)
10
$430
$332
$265
$262
$180
2.16%
1.73%
1.39%
1.38%
0.96%
4Q11
1Q12
2Q12
3Q12
4Q12
Net Charge-Offs
Net Charge-Offs as % of Average Loans
3.54%
2.59%
2.34%
1.89%
4Q11
1Q12
2Q12
3Q12
4Q12
Regions
Peer Group Median |
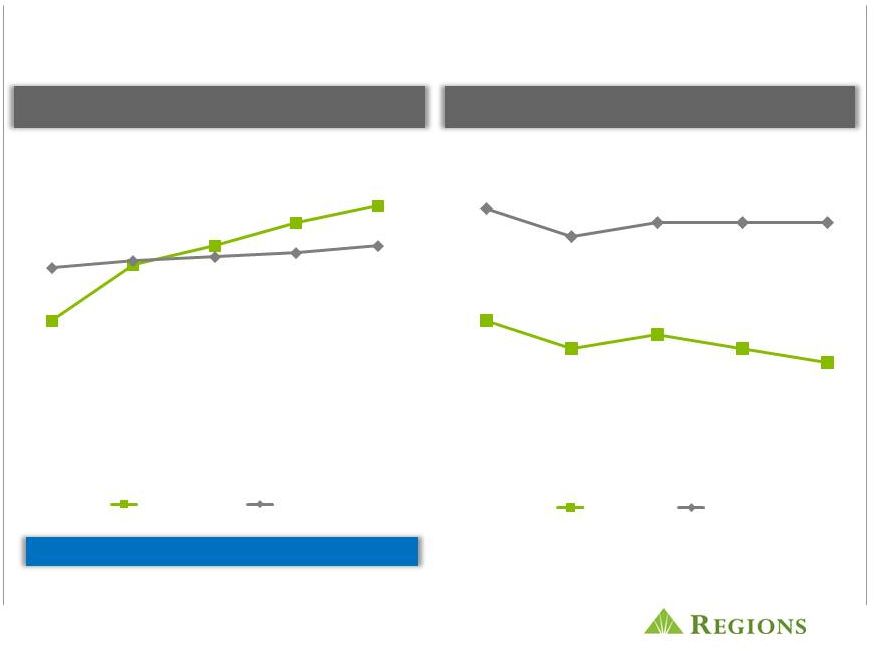 11
(1)
Non-GAAP
–
See
appendix
for
reconciliation
Note: Peer banks include BBT, CMA, FHN, FITB, HBAN, KEY, MTB, PNC, STI, USB, WFC,
ZION Source: SNL Financial
Estimated Basel III
(1)
at the end of 4Q12 was 8.9%
Loan to Deposit Ratio
Tier 1 Common Ratio
(1)
8.5%
9.6%
10.0%
10.5%
10.8%
9.6%
9.7%
9.8%
9.9%
10.0%
4Q11
1Q12
2Q12
3Q12
4Q12
Regions
Peer Median
81%
79%
80%
79%
78%
89%
87%
88%
88%
88%
4Q11
1Q12
2Q12
3Q12
4Q12
Regions
Peer Median
Solid capital and liquidity |
 12
•
Getting
a
full
and
detailed
view
of
customer
financial
needs
–
360°
View
•
Deepening customer relationships through cross-sell
•
Going
to
market
as
One
bank,
One
team,
One
Regions
–
making referrals
and meeting needs
•
Providing service quality that creates exceptional loyalty and retention
communities, our associates and our
shareholders through…
Creating
for our customers, our
shared value |
 13
Transportation/
Restaurant
Technology &
Defense
Energy
Healthcare
(Houston)
(Atlanta)
(Charlotte)
(Nashville)
Business Services –
key focus areas for 2013
•
Acquire, retain and deepen
relationships through
•
Maintain disciplined focus on
specialized industries to drive
growth:
•
Healthcare
•
Restaurant
•
Transportation
•
Technology & Defense
•
Energy
•
We are still in the Investor Real
Estate business, where appropriate
•
Get paid for the risks we take
•
Stay focused on prudent Risk
Management disciplines
Transition to growth through shared value |
 14
Wealth Management -
key focus areas for 2013
•
Broaden and deepen relationships
•
Grow trust assets under management
•
Roll out branch-based Financial Consultants in
partnership with Cetera
•
Enhance performance management and
coaching culture
•
Stay focused on prudent risk management
disciplines
•
Listen
to
customers’
goals
and
deliver
products
and services they need
•
Expand service and product offerings
Transition to growth through shared value |
 •
Deepen relationships
•
Attract, retain and expand quality consumer
households
•
Stabilize
and
grow
quality
earning
assets
–
get
paid for the risks we take
•
Leverage NOW Banking products to bank the
under-banked markets
•
Continue to prudently grow credit cards,
mortgage and indirect lending
•
Remain focused on disciplined risk management,
compliance and regulatory issues
•
Provide trustworthy advice, guidance and
education to help our customers succeed
financially
•
Leverage technology to improve channel
capabilities, sales and efficiency
Consumer Services –
key focus areas for 2013
Transition to growth through shared value
15 |
 Moving
forward in 2013 •
Through
, maximize opportunities to deepen quality customer relationships •
Grow households
•
Positioned for continued increases in loan production
•
Indirect auto portfolio
•
Commercial and Industrial
•
Credit card
•
Retention of 15-year fixed rate mortgages
•
Continue to leverage Now Banking suite of products
•
Improve efficiency through investments in technology
•
Further enhancements to lower-cost delivery channels
•
Enhanced services and technology platforms within Wealth Management
•
Continue to seek opportunities to reduce expenses
•
Commitment to positive operating leverage
16 |
 Why
Regions? Competitive Position
•
Strong market presence
•
Competitive product set
•
Stronger company today than three years ago
•
Revenue growth on par with peers
•
Disciplined expense management
Opportunity for
Outperformance
•
Improving efficiency ratio
•
Stable net interest margin
•
Significant credit leverage remains
•
Low loan to deposit ratio
Moving Forward
•
Creating shared value for our customers, communities,
associates and shareholders
•
Business plan to support growth
17
Proven Track Record |
 Appendix
18 |
 The
foregoing list of factors is not exhaustive. For discussion of these and other factors that may cause actual results to differ from expectations, look under
the captions “
Forward-Looking Statements”
and “
Risk Factors" of Regions' Annual Report on Form 10-K for the year ended December 31,
2012. This
presentation
may
include
forward-looking
statements
which
reflect
Regions’
current
views
with
respect
to
future
events
and
financial
performance.
The
Private
Securities
Litigation
Reform
Act
of
1995
(“the
Act”)
provides
a
“safe
harbor”
for
forward-looking
statements
which
are
identified
as
such
and
are
accompanied
by
the
identification
of
important
factors
that
could
cause
actual
results
to
differ
materially
from
the
forward-looking
statements.
For
these
statements,
we,
together
with
our
subsidiaries,
claim
the
protection
afforded
by
the
safe
harbor
in
the
Act.
Forward-looking
statements
are
not
based
on
historical
information,
but
rather
are
related
to
future
operations,
strategies,
financial
results
or
other
developments.
Forward-looking
statements
are
based
on
management’s
expectations
as
well
as
certain
assumptions
and
estimates
made
by,
and
information
available
to,
management
at
the
time
the
statements
are
made.
Those
statements
are
based
on
general
assumptions
and
are
subject
to
various
risks,
uncertainties
and
other
factors
that
may
cause
actual
results
to
differ
materially
from
the
views,
beliefs
and
projections
expressed
in
such
statements.
These
risks,
uncertainties
and
other
factors
include,
but
are
not
limited
to,
those
described
below:
Forward-looking statements
›
Possible acceleration of prepayments on mortgage-backed securities due to low interest
rates and the related acceleration of premium amortization on those securities.
›
The Dodd-Frank Wall Street Reform and Consumer Protection Act (the “Dodd-Frank
Act”) became law in July 2010, and a number of legislative, regulatory and
tax proposals remain pending. Future and proposed rules, including those that may be part of the Basel III process, are expected to require banking
institutions to increase levels of capital and to meet more stringent liquidity requirements.
All of the foregoing may have significant effects on Regions and the financial
services industry, the exact nature and extent of which cannot be determined at this time.
›
Regions' ability to develop competitive new products and services in a timely manner and the
acceptance of such products and services by Regions' customers and potential
customers. ›
Regions' ability to keep pace with technological changes.
›
Possible additional loan losses, impairment of goodwill and other intangibles, and adjustment
of valuation allowances on deferred tax assets and the impact on earnings and
capital. ›
Possible
changes
in
interest
rates
may
increase
funding
costs
and
reduce
earning
asset
yields,
thus
reducing
margins.
Increases
in
benchmark
interest
rates
would also increase debt service requirements for customers whose terms include a variable
interest rate, which may negatively impact the ability of borrowers to pay as
contractually obligated. ›
Possible
changes
in
general
economic
and
business
conditions
in
the
United
States
in
general
and
in
the
communities
Regions
serves
in
particular,
including
any prolonging or worsening of the current challenging economic conditions including
unemployment levels. ›
Possible changes in consumer and business spending and saving habits could affect Regions'
ability to increase assets and to attract deposits. ›
Possible changes in the creditworthiness of customers and the possible impairment of the
collectability of loans. ›
Possible changes in trade, monetary and fiscal policies, laws and regulations and other
activities of governments, agencies, and similar organizations, may have an adverse
effect on business. ›
Possible stresses in the financial and real estate markets, including possible deterioration
in property values. ›
Regions' ability to manage fluctuations in the value of assets and liabilities and
off-balance sheet exposure so as to maintain sufficient capital and liquidity to
support Regions' business.
›
Regions' ability to expand into new markets and to maintain profit margins in the face of
competitive pressures. ›
The effects of any damage to Regions reputation resulting from developments related to any of
the items identified above. ›
Possible regulations issued by the Consumer Financial Protection Bureau or other regulators
which might adversely impact Regions' business model or
products and services.
›
Regions' ability to effectively manage credit risk, interest rate risk, market risk,
operational risk, legal risk, liquidity risk, reputational risk, counterparty risk,
international risk and regulatory and compliance risk.
›
Regions’
ability to ensure adequate capitalization which is impacted by inherent uncertainties in
forecasting credit losses. ›
The
cost
and
other
effects
of
material
contingencies,
including
litigation
contingencies,
and
any
adverse
judicial,
administrative
or
arbitral
rulings
or
proceedings.
›
The effects of increased competition from both banks and non-banks.
›
The effects of geopolitical instability and risks such as terrorist attacks.
›
Changes
in
accounting
policies
or
procedures
as
may
be
required
by
the
Financial
Accounting
Standards
Board
or
other
regulatory
agencies.
›
Regions’
ability to receive dividends from its subsidiaries.
›
The
effects
of
the
failure
of
any
component
of
Regions’
business
infrastructure
which
is
provided
by
a
third
party.
›
The effects of weather and natural disasters such as floods, droughts, wind, tornados and
hurricanes, and the effects of man-made disasters. ›
Possible downgrades in ratings issued by rating agencies.
›
The effects of problems encountered by larger or similar financial institutions that
adversely affect Regions or the banking industry generally. ›
Possible
changes
in
the
speed
of
loan
prepayments
by
Regions’
customers
and
loan
origination
or
sales
volumes.
19
The words "believe," "expect," "anticipate," "project," and
similar expressions often signify forward-looking statements. You should not place
undue reliance on any forward-looking statements, which speak only as of the date made.
We assume no obligation to update or revise any forward-looking statements that
are made from time to time. |
 Non-GAAP reconciliation: non-interest income /
expense, fee income ratios and efficiency ratios
($ amounts in millions)
12/31/12
9/30/12
6/30/12
3/31/12
12/31/11
Continuing Operations
Non-interest expense (GAAP)
902
$
869
$
842
$
913
$
1,124
$
33
$
3.8%
(222)
$
-19.8%
Adjustments:
REIT investment early termination costs
(42)
-
-
-
-
(42)
NM
(42)
NM
Loss on early extinguishment of debt
(11)
-
-
-
-
(11)
NM
(11)
NM
Securities impairment, net
-
-
(2)
-
(2)
-
-
2
-100.0%
Branch consolidation and property and equipment charges
-
-
-
-
2
-
-
(2)
-100.0%
Goodwill impairment
-
-
-
-
(253)
-
-
253
-100.0%
Adjusted non-interest expense (non-GAAP)
F
849
$
869
$
840
$
913
$
871
$
(20)
$
-2.3%
(22)
$
-2.5%
Net interest income (GAAP)
818
$
817
$
838
$
827
$
849
$
1
$
0.1%
(31)
$
-3.7%
Taxable equivalent adjustment
13
13
12
12
9
-
-
4
44.4%
Net interest income, taxable-equivalent basis
831
830
850
839
858
1
0.1%
(27)
-3.1%
Non-interest income (GAAP)
536
$
533
$
507
$
524
$
507
$
3
$
0.6%
29
$
5.7%
Adjustments:
Securities gains, net
(12)
(12)
(12)
(12)
(7)
-
-
(5)
71.4%
Leveraged lease termination gains, net
-
-
(7)
(7)
(10)
-
-
10
-100.0%
Adjusted non-interest income (non-GAAP)
G
524
521
488
505
490
3
0.6%
34
6.9%
Adjusted total revenue (non-GAAP)
H
1,355
$
1,351
$
1,338
$
1,344
$
1,348
$
4
$
0.3%
7
$
0.5%
Adjusted fee income ratio (non-GAAP)
G/H
38.7%
38.6%
36.5%
37.6%
36.4%
Adjusted efficiency ratio (non-GAAP)
F/H
62.7%
64.3%
62.8%
67.9%
64.6%
Quarter Ended
vs. 3Q12
vs. 4Q11
4Q12
4Q12
20
The table below presents computations of the efficiency ratio(non-GAAP), which is a
measure of productivity, generally calculated as non-interest expense divided by total revenue. The table also shows the fee income
ratio ratio (non-GAAP), generally calculated as non-interest income divided by total
revenue. Management uses these ratios to monitor performance and believes these measures provide meaningful information to
investors. Non-interest-expense (GAAP) is presented excluding certain
adjustments to arrive at adjusted non-interest expense (non-GAAP), which is the numerator for the efficiency ratio. Non-interest income (GAAP) is
presented excluding certain adjustments to arrive at adjusted non-interest income
(non-GAAP), which is the numerator for the fee income ratio. Net interest income on a taxable-equivalent basis and non-interest income
are added together to arrive at total revenue. Adjustments are made to arrive at
adjusted total revenue (non-GAAP), which is the denominator for the fee income and efficiency ratios. Regions believes that the exclusion
of these adjustments provides a meaningful base for period-to-period comparisons,
which management believes will assist investors in analyzing the operating results of the Company and predicting future performance.
These non-GAAP financial measures are also used by management to assess the performance
of Regions' business. It is possible that the activities related to the adjustments may recur; however, management does not
consider the activities related to the adjustments to be indications of ongoing
operations. Regions believes that presentation of these non-GAAP financial measures will permit investors to assess the performance of the
Company on the same basis as that applied by management. |
 21
Non-GAAP reconciliation: tier 1 common
($ amounts in millions)
12/31/12
9/30/12
6/30/12
3/31/12
12/31/11
As of and for Quarter Ended
TIER 1 COMMON RISK-BASED RATIO - CONSOLIDATED
Stockholders' equity (GAAP)
15,499
$
14,901
$
14,455
$
17,534
$
16,499
$
Accumulated other comprehensive (income) loss
(65)
(202)
(54)
60
69
Non-qualifying goodwill and intangibles
(4,826)
(4,836)
(4,852)
(4,881)
(4,900)
Disallowed deferred tax assets
(35)
(238)
(336)
(345)
(432)
Disallowed servicing assets
(33)
(33)
(33)
(36)
(35)
Qualifying non-controlling interests
93
93
92
92
92
Qualifying trust preferred securities
501
846
846
846
846
Tier 1 capital (regulatory)
11,134
$
10,531
$
10,118
$
13,270
$
12,139
$
Qualifying non-controlling interests
(93)
(93)
(92)
(92)
(92)
Qualifying trust preferred securities
(501)
(846)
(846)
(846)
(846)
Preferred stock
(482)
-
-
(3,429)
(3,419)
Tier 1 common equity (non-GAAP)
N
10,058
$
9,592
$
9,180
$
8,903
$
7,782
$
Risk-weighted assets (regulatory)
O
92,811
91,723
91,779
92,546
91,449
Tier 1 common risk-based ratio (non-GAAP)
N/O
10.8%
10.5%
10.0%
9.6%
8.5%
The following table provides calculations of Tier 1 capital (regulatory) and "Tier 1 common
equity" (non-GAAP). Traditionally, the Federal Reserve and other banking
regulatory bodies have assessed a bank's capital adequacy based on Tier 1 capital, the calculation of
which is prescribed in amount by federal banking regulations. In connection with the
Company's Comprehensive Capital Analysis and Review ("CCAR"), these regulators are supplementing their assessment of the capital
adequacy of a bank based on a variation of Tier 1 capital, known as Tier 1 common equity. While
not prescribed in amount by federal banking regulations, analysts and banking regulators have
assessed Regions' capital adequacy using the Tier 1 common equity measure. Because Tier 1 common equity is not formally defined
by GAAP or prescribed in any amount by federal banking regulations, this measure is considered to be a
non-GAAP financial measure and other entities may calculate it differently than Regions'
disclosed calculations. Since analysts and banking regulators may assess Regions' capital adequacy using Tier 1 common
equity, management believes that it is useful to provide investors the ability to assess Regions'
capital adequacy on this same basis. Tier 1 common equity is often expressed as a percentage of risk-weighted assets. Under the
risk-based capital framework, a company's balance sheet assets and credit equivalent
amounts of off-balance sheet items are assigned to one of four broad risk categories. The aggregated dollar amount in each category is then
multiplied by the risk-weighted category. The resulting weighted values from each of the
four categories are added together and this sum is the risk-weighted assets total that, as
adjusted, comprises the denominator of certain risk-based capital ratios. Tier 1 capital is then divided by this denominator (risk-weighted assets) to
determine the Tier 1 capital ratio. Adjustments are made to Tier 1 capital to arrive at Tier 1
common equity (non-GAAP). Tier 1 common equity (non-GAAP) is also divided by the
risk-weighted assets to determine the Tier 1 common equity ratio (non-GAAP). The amounts disclosed as risk-weighted assets are calculated
consistent with banking regulatory requirements.
|
 Non-GAAP reconciliation: basel III
Estimate based on June
2012 U.S. Notices of
Proposed Rulemaking
($ amounts in millions)
12/31/2012
Stockholders' equity (GAAP)
$15,499
(4,968)
Adjustments, including other comprehensive income related to cash flow hedges,
disallowed deferred tax assets, threshold deductions and other
adjustments (780)
Basel III tier 1 common equity (non-GAAP)
9,751
Basel I risk-weighted assets (regulatory)
92,811
109,941
Basel III tier 1 common ratio (non-GAAP)
8.87%
The following table provides calculations of Tier 1 common, based on Regions’ current
understanding of Basel III requirements, as proposed by the U.S. Notices of Proposed Rulemaking
released in June 2012. Regions currently calculates its risk-based capital ratios under guidelines adopted by the Federal Reserve
based on the 1988 Capital Accord (“Basel I”) of the Basel Committee on Banking Supervision
(the “Basel Committee”). In December 2010, the Basel Committe released its final
framework for Basel III, which will strengthen international capital and liquidity regulation. In June 2012, U.S. Regulators released three
separate Notices of Proposed Rulemaking covering U.S. implementation of the Basel III
framework. When implemented by U.S. bank regulatory agencies and fully
phased-in, Basel III will change capital requirements and place greater emphasis on common equity. The Federal Reserve has announced a delay in the
implementation date of the final rules. However, when implemented there will be a phase in
period of up to 6 years. The calculations provided below are estimates, based on
Regions’ current understanding of the framework, including the Company’s reading of the requirements, and informal feedback received
through the regulatory process. Regions’ understanding of the framework is evolving and
will likely change as the regulations are finalized. Because the Basel III implementation
regulations are not formally defined by GAAP and have not yet been finalized and codified, these measures are considered to be non-GAAP
financial measures, and other entities may calculate them differently from Regions’ disclosed
calculations. Since analysts and banking regulators may assess Regions’ capital
adequacy using the Basel III framework, we believe that it is useful to provide investors the ability to assess Regions’ capital adequacy on the
same basis.
22
(1)
Under Basel III, regulatory capital must be reduced by purchased credit card relationship intangible
assets. These assets are partially allowed in Basel I capital.
(2)
Regions continues to develop systems and internal controls to precisely calculate risk-weighted
assets as required by Basel III. The amount included above is a reasonable approximation,
based on our understanding of the requirements. Non-qualifying
goodwill
and
intangibles
(1)
Basel
III risk-weighted assets (non-GAAP)
(2) |
 |