Attached files
| file | filename |
|---|---|
| 8-K - FORM 8-K - ENDEAVOUR INTERNATIONAL CORP | d496871d8k.htm |
| EX-99.1 - EX-99.1 - ENDEAVOUR INTERNATIONAL CORP | d496871dex991.htm |
 Fourth Quarter 2012
Earnings Review
March 6, 2013
Exhibit 99.2 |
 2
2012
Fourth
Quarter
and
Year
End
–
Financial/Operational
Sales Volumes and Physical Production
•
Q4 sales volumes averaged over 11,500 barrels of oil equivalent per day
(“boepd”) up 171% from the comparable quarter in 2011
•
Year-over-year average sales volumes increased 133%
•
Year-over-year average daily physical production increased 131%
•
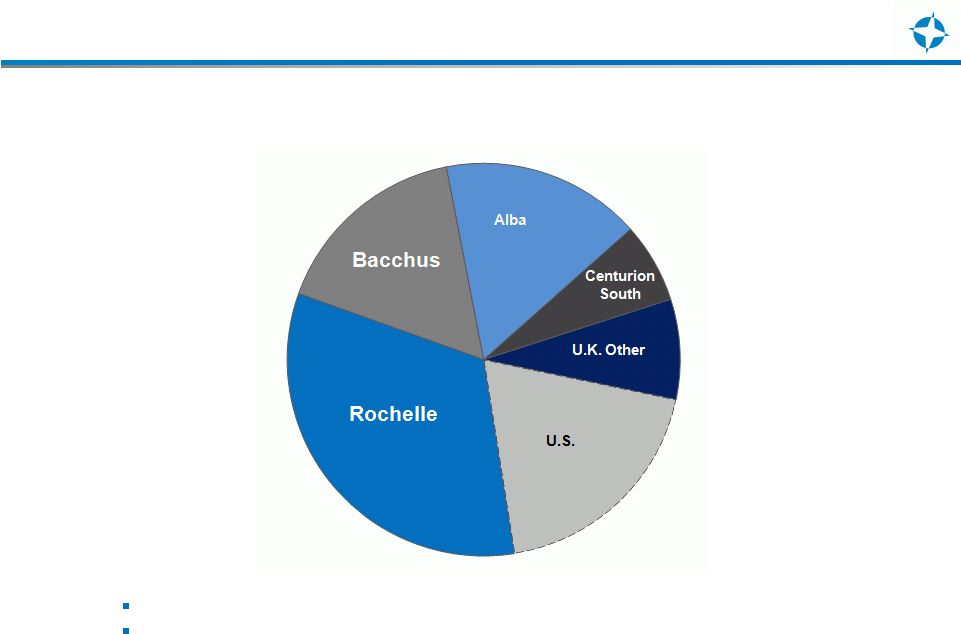
2012 production was 70% from the U.K. and 30% from the U.S.
•
Year-end production exit rate was approximately 10,400 boepd
Two wells at Bacchus brought on production
Completed the acquisition of an additional 23.43% working interest in Alba
Revenues up $159 million year-over-year
Commenced drilling at the Rochelle development
U.K. proved reserves increased 186% year-over-year
Completed an exchange of assets in the Pennsylvania Marcellus
|
 3
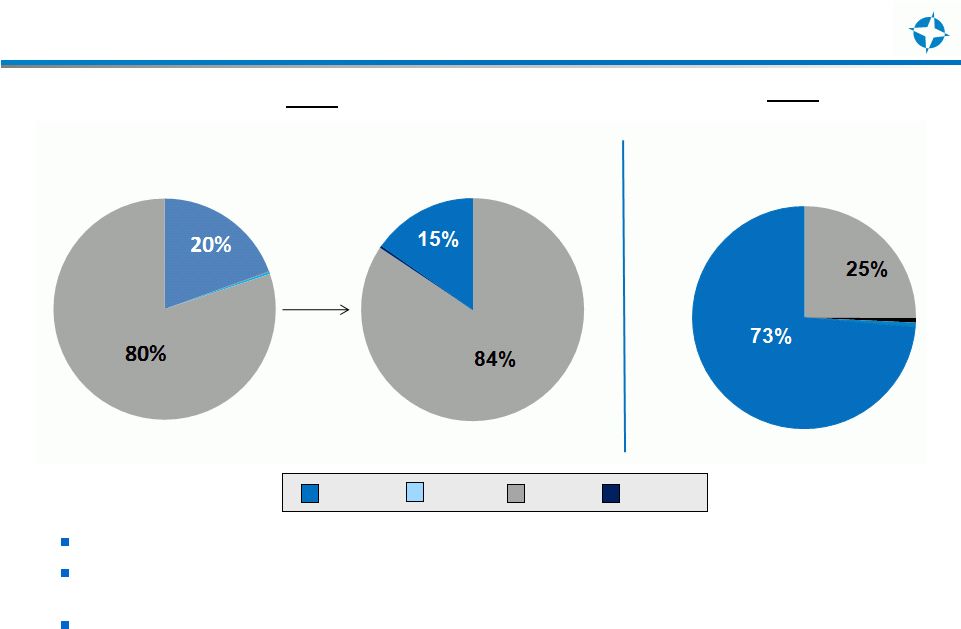
Production Volumes (BOE per day)
2012
2011
Q3 Sales = 11,006
Q4 Sales = 11,541
Q4 Sales = 4,253
US Gas US Oil UK Oil
UK Gas
Year-over-year sales volumes up 133%
Physical production volume for the fourth quarter averaged 10,300 boepd and 7,873
boepd for the full year of 2012
Fourth Quarter realized prices
•
Oil and condensate price = $105.76 per barrel
•
Gas price = $2.86 per Mcf |
  4
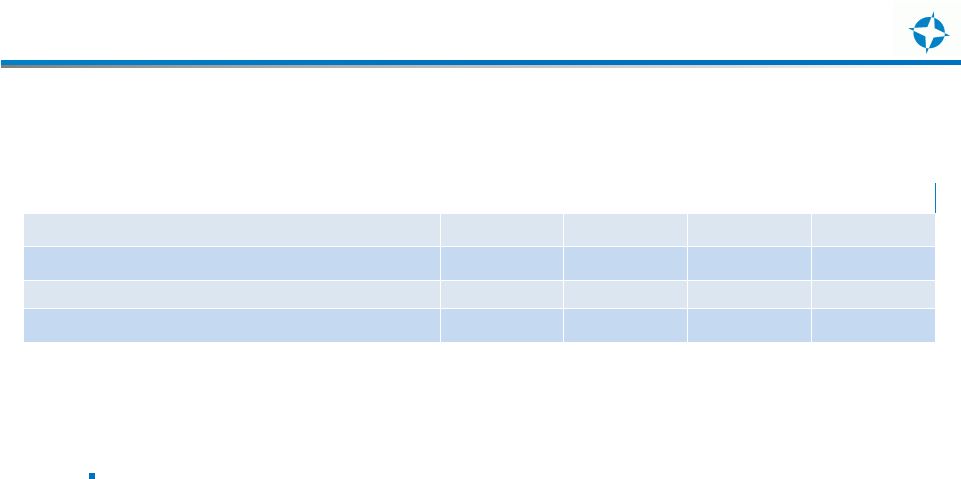
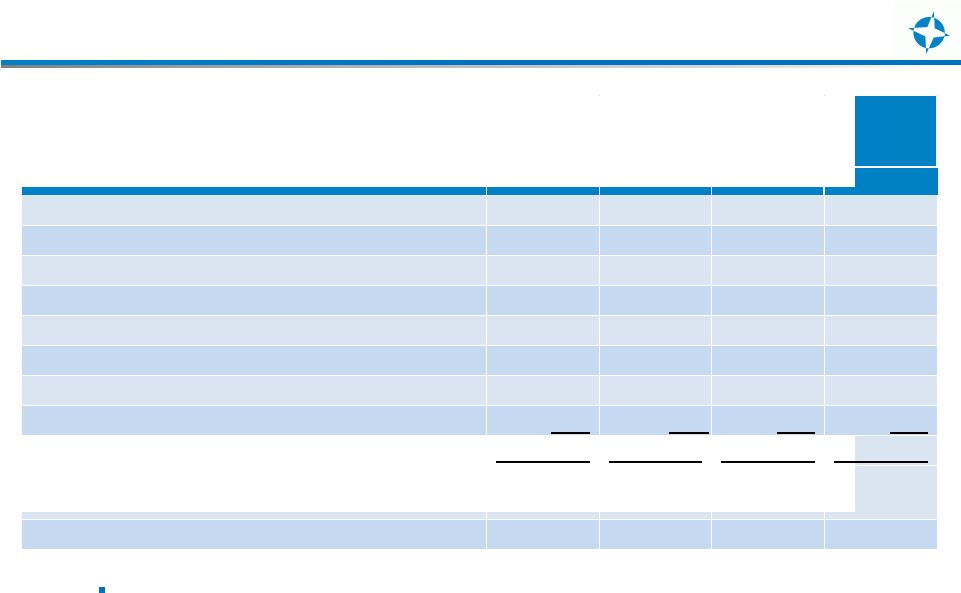
Summary Financial Results
Revenues
increase
265%
from
2011
to
2012
driven
by
increase
U.K.
crude
oil
production
at Alba and Bacchus, as well as improving Brent crude oil prices.
Measure ($in millions, except per share data)
2012
2011
2012
2011
Oil and Gas Revenues
97.6
$
16.6
$
219.1
$
60.1
$
Operating Expenses
23.9
$
2.8
$
58.5
$
17.7
$
Adjusted cash flow from Operations
73.7
$
13.8
$
160.6
$
42.4
$
Three Months
Ended Dec. 31,
Full Year |
     5
Key Business Metrics
Yearly OpEx costs were up due to increased production and a one time inventory
cost of $9.7 million ($7/barrel) related to the Alba purchase in the third
quarter of 2012. DD&A increased year-over-year due to a larger
working interest and increased production at Alba, along with first
production at Bacchus and higher decommissioning costs estimates.
Interest expense increased due to the High Yield offering and Revolving Credit
facility, partially offset by repayment of the Senior Term Loan and
Subordinated Notes. Capitalized interest increased year-over-year due
to work in progress associated with Rochelle and Bacchus.
Measure
($ expense per BOE)
2012
2011
2012
2011
Operating Expenses (OpEx)
Consolidated
$22.53
$7.10
$20.33
$14.31
U.K.
$23.83
$15.84
$25.67
$22.21
U.S.
$15.33
$4.08
$8.00
$10.69
Depreciation, depletion and amortization (DD&A)
Consolidated
$22.86
$19.89
$23.11
$21.45
U.K.
$25.67
$39.08
$28.85
$38.61
U.S.
$7.31
$13.23
$9.88
$13.58
General and Administrative Expense (G&A)
$5.37
$8.51
$7.32
$14.46
Interest Expenses
Cash
$14.93
$15.59
$21.27
$16.40
Non-cash
$4.95
$16.84
$7.94
$20.29
Three Months
Ended Dec. 31,
Full Year |
   6
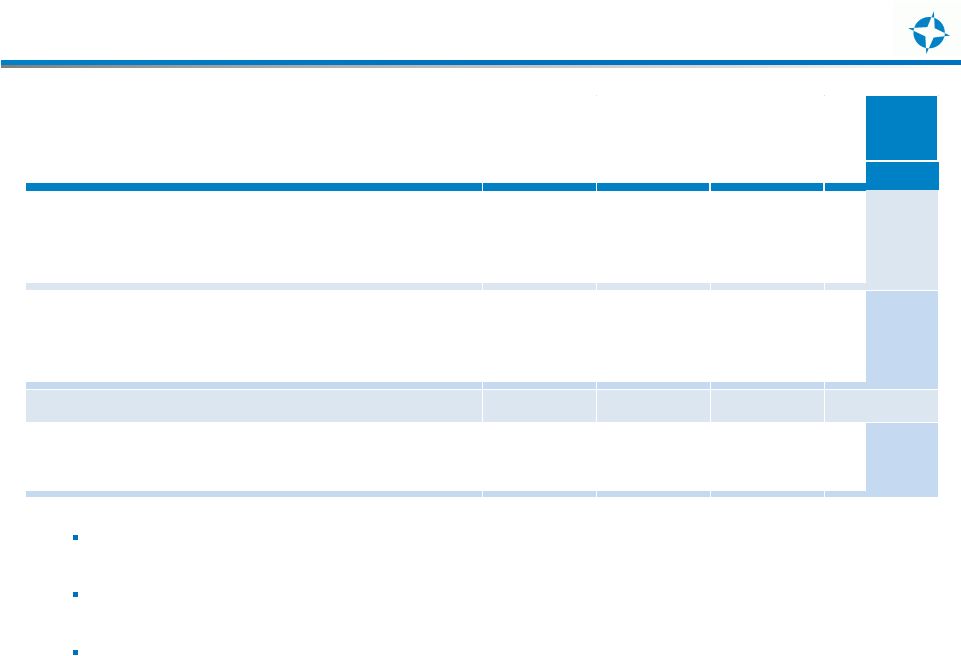
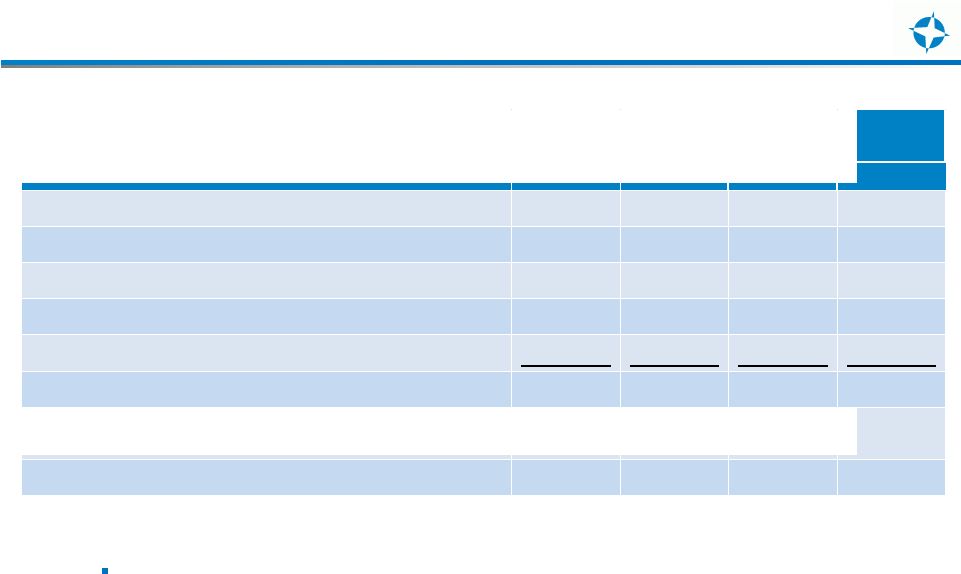
Adjusted EBITDA
Adjusted EBITDA increased 426% year-over-year as a result of
increased U.K. oil production and improving commodity prices.
Measure
($ in millions, except per share data)
2012
2011
2012
2011
Net Income (loss)
(6.5)
$
(44.6)
$
(126.2)
$
(131.0)
$
Unrealized (gain) loss on derivatives
(7.3)
2.7
(5.1)
(8.4)
Net Interest Expense
21.1
12.6
83.9
44.4
Letter of Credit Fees
9.5
-
21.9
-
Loss on early extinguishment of debt
-
-
21.7
0.4
Depreciation, depletion and amortization
24.3
7.8
66.5
26.5
Impairment of U.S. oil and gas properties
6.0
36.9
53.0
65.7
Income tax expense (benefit)
17.6
(4.8)
14.2
27.1
Adjusted EBITDA
64.7
$
10.6
$
129.9
$
24.7
$
Weighted-average basic
shares
outstanding
(in millions)
46.6
39.2
42.5
36.0
Adjusted EBITDA per basic share
$1.39
$0.27
$3.06
$0.69
Three Months
Ended Dec. 31,
Full Year |
   7
Adjusted Net Income (Loss)
Revenues from increased production in the U.K. North Sea were offset by increased
interest expense and Letter of Credit fees.
Measure
($ in millions, except per share data)
2012
2011
2012
2011
Net Income (loss)
(6.5)
$
(44.6)
$
(126.2)
$
(131.0)
$
Impairment of U.S. oil and gas properties
6.0
36.9
53.1
65.7
Unrealized (gain) loss (net of tax)
(7.4)
1.9
(7.3)
(10.3)
Loss on early extinguishment of debt
-
-
17.8
0.4
Deferred Tax Expense releated to U.K. tax rate change
0.2
-
8.5
25.5
Net Income (loss) as Adjusted
(7.7)
$
(5.8)
$
(54.1)
$
(49.7)
$
Weighted-average basic
shares
outstanding (in millions)
46.6
39.2
42.5
36.0
Adjusted earning (loss) per basic share
(0.17)
$
(0.15)
$
(1.27)
$
(1.38)
$
Three Months
Ended Dec. 31,
Full Year |
    8
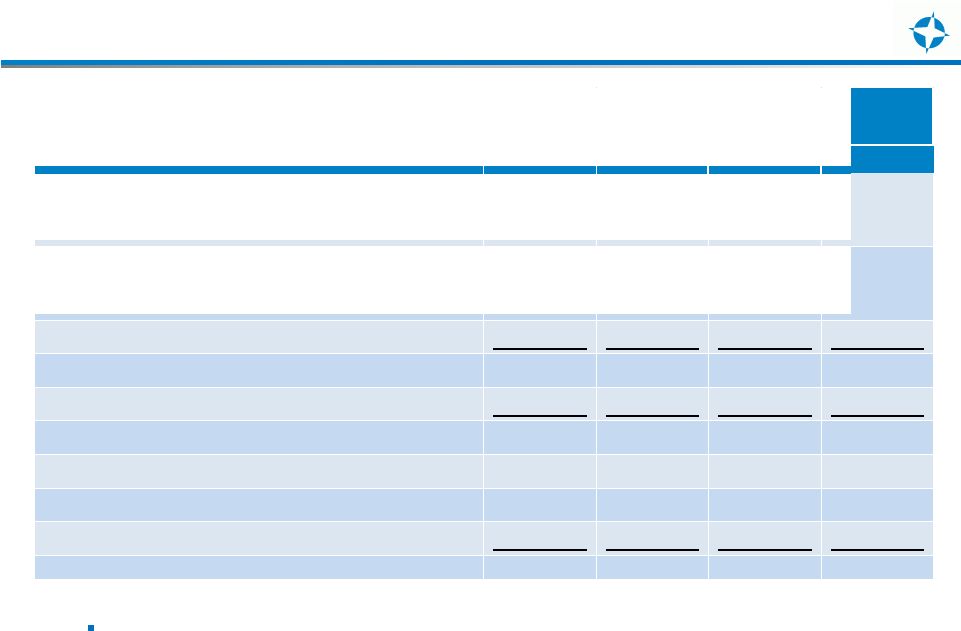
Capex Update
The increase in AROs during 2012 reflects the higher amount of abandonment
retirement obligations due to the increased working interest at Alba and
timing of payment obligations at other fields.
Measure ($ in millions)
2012
2011
2012
2011
Development Capital
U.K.
41.7
$
21.0
$
157.7
$
62.0
$
U.S.
-
3.8
4.9
8.6
Exploration Capital
U.K.
5.4
3.3
14.6
34.5
U.S.
0.6
7.1
9.1
65.0
Other
0.2
1.7
3.5
5.3
Total Direct Oil & Gas Capex
47.9
36.9
189.8
175.4
Acquisitions
-
5.0
190.8
50.0
47.9
41.9
380.6
225.4
Capitalized Interest
6.8
4.8
26.9
14.7
Capitalized G&A
4.6
2.9
19.3
15.0
Asset Retirement Obligations (AROs)
137.2
16.2
140.7
16.8
Total Capital Expenditures
196.5
$
65.8
$
567.5
$
271.9
$
Three Months
Ended Dec. 31,
Full Year |
 9
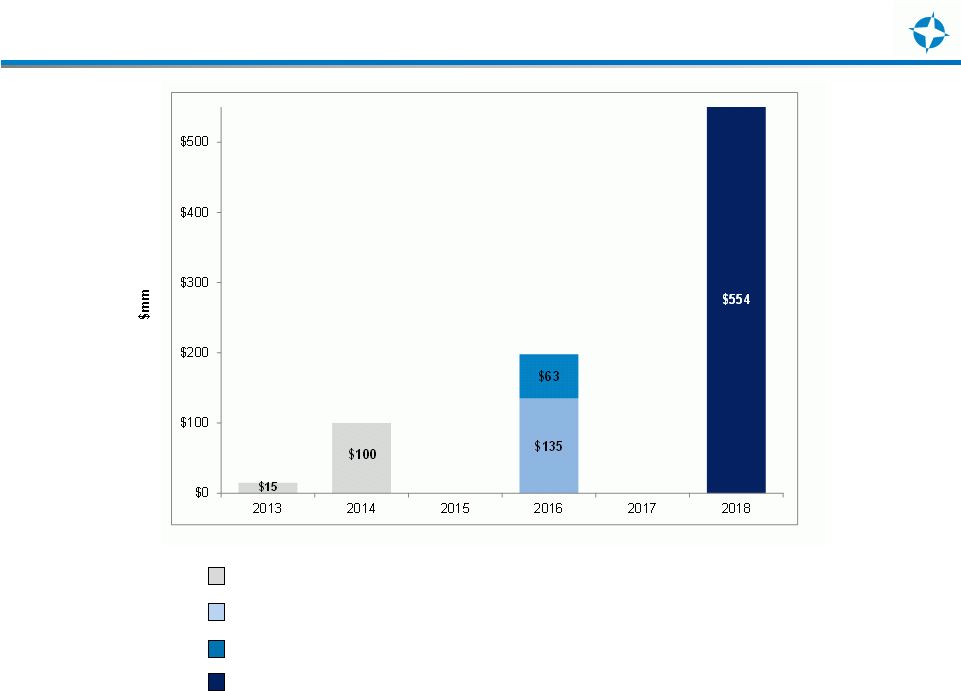
Debt Maturity Schedule
Convertible Notes due 2016 ($18.51 per share conversion price)
Convertible Bonds due 2016 ($16.52 per share conversion price)
Senior Notes due 2018
Revolving Credit Facility due 2013/2014 |
 2013
Direct Capital Expenditures 10
Rochelle and Bacchus represent 60% of the planned spend in the U.K.
U.S. budget is second half of the year weighted and is largely discretionary.
U.K. = $140 million -
$150 million
U.S. = $30 million -
$ 40 million |