Attached files
| file | filename |
|---|---|
| 8-K - FORM 8-K - Cole Real Estate Investments, Inc. | d497156d8k.htm |
| EX-99.2 - EX-99.2 - Cole Real Estate Investments, Inc. | d497156dex992.htm |
| EX-99.1 - EX-99.1 - Cole Real Estate Investments, Inc. | d497156dex991.htm |
| EX-99.4 - EX-99.4 - Cole Real Estate Investments, Inc. | d497156dex994.htm |
 A
Transformational Transaction: A Highly Attractive Real Estate Portfolio and A Leading
Real Estate Investment Manager Exhibit 99.3 |
 2
Disclaimer
This presentation may be deemed to be solicitation material in respect of the charter
amendments to be presented to Cole Credit Property
Trust
III,
Inc.’s
(“CCPT
III”)
stockholders
for
consideration
at
the
2013
annual
stockholders’
meeting
of
CCPT
III.
CCPT
III
expects to file a proxy statement with the Securities and Exchange Commission
(“SEC”) in connection with the 2013 annual stockholders’
meeting. STOCKHOLDERS ARE URGED TO READ THE PROXY STATEMENT AND ANY OTHER RELEVANT
DOCUMENTS FILED
WITH
THE
SEC
WHEN
THEY
BECOME
AVAILABLE,
BECAUSE
THEY
WILL
CONTAIN
IMPORTANT
INFORMATION.
You may obtain a
free
copy
of
the
proxy
statement
and
other
relevant
documents
filed
with
the
SEC
at
the
SEC’s
website
at
www.sec.gov.
Copies
of
the documents filed by CCPT III with the SEC will be available free of charge by directing a
written request to Cole Credit Property Trust III, Inc., 2325 East Camelback Road,
Suite 1100, Phoenix, Arizona, 85016, Attention: Investor Relations. CCPT III and its
directors and executive officers and other members of management may be deemed to be participants in the
solicitation
of
proxies
in
respect
of
the
charter
amendments
to
be
considered
at
the
2013
annual
stockholders’
meeting
of
CCPT III.
Information regarding the interests of CCPT III’s directors and executive officers in the
proxy solicitation will be included in CCPT III’s definitive proxy
statement. This presentation contains a description of the merger agreement
pursuant to which CCPT III will acquire Cole Holdings Corporation
(“Cole Holdings”). A copy of the merger agreement will be filed as an exhibit
to a Form 8-K CCPT III will file with the SEC. The description of the merger
agreement contained in this presentation does not purport to be complete and is qualified in its entirety
by reference to the full text of the merger agreement. |
 3
Forward-Looking Statements
In addition to historical information, this presentation contains forward-looking
statements within the meaning of Section 27A of the Securities Act of 1933, as amended,
and Section 21E of the Securities Exchange Act of 1934, as amended. These forward-looking
statements, which are based on current expectations, estimates and projections about the
industry and markets in which CCPT III operates, include beliefs of and assumptions
made by CCPT III’s management, and involve risks and uncertainties that could
significantly
affect
the
financial
results
of
CCPT
III.
Words
such
as
“may,”
“expects,”
“anticipates,”
“intends,”
“plans,”
“believes,”
“projects,”
“seeks,”
“estimates,”
“would,”
“could”
and “should”
and variations of such words and similar expressions are intended to
identify such forward-looking statements, which generally are not historical in nature.
Such forward-looking statements include, but are not limited to, statements about
the benefits of the business combination transaction involving CCPT III and Cole Holdings,
future financial and operating results, and the combined company’s plans, objectives,
expectations and intentions. All statements that
address
operating
performance,
events
or
developments
that
we
expect
or
anticipate
will
occur
in
the
future
—
including
statements
relating
to
earnings
accretion,
cash
flow
growth,
AUM
growth,
rent and occupancy growth, changes in sales or
contribution volume of developed properties, future dividend levels, an anticipated NYSE
listing, increased liquidity, capital raising capabilities,
availability
of
capital
and
general
conditions
in
the
geographic
areas
where
we
operate
—
are
forward-looking
statements. These statements are not guarantees of future performance and involve certain
risks, uncertainties and assumptions that are difficult to predict. Although we believe
the expectations reflected in any forward-looking statements are based on
reasonable assumptions, we can give no assurance that our expectations will be attained and
therefore, actual outcomes and results may differ materially from what is expressed or
forecasted in such forward-looking statements. Some of the factors that may affect
outcomes and results include, but are not limited to: (i) national, international, regional
and local economic climates, (ii) changes in financial markets, interest rates, credit
spreads, and foreign currency exchange rates, (iii) changes in the real estate markets, (iv)
continued ability to source new investments, (v) increased or unanticipated competition for
our properties, (vi) risks associated with acquisitions, (vii) maintenance of real
estate investment trust status, (viii) availability of financing and capital, (ix) changes in demand
for developed properties, (x) risks associated with the ability to consummate the merger and
the timing of the closing of the merger, and
(xi)
those
additional
risks
and
factors
discussed
in
reports
filed
with
the
SEC
by
CCPT
III
from
time
to
time.
CCPT
III
does
not
make any undertaking with respect to updating any forward-looking statements appearing in
this presentation. |
 4
A Highly Attractive Portfolio and A Leading Investment Manager
COLE HOLDINGS
PREMIER REAL ESTATE INVESTMENT MANAGER
WITH COMPELLING GROWTH PROFILE
CCPT III
HIGH-QUALITY COMMERCIAL
REAL ESTATE PORTFOLIO
(1)
BILLION
COMMERCIAL
REAL ESTATE AUM
$12.4
99%
OCCUPANCY
BASED ON SQUARE FEET
76
MILLION
SQUARE FEET
(3
)
47
350
PROFESSIONALS
36
INDUSTRY SECTORS
2,000 +
PROPERTIES MANAGED
12.7
YEARS
WEIGHTED AVERAGE
REMAINING LEASE TERM
(2)
34
YEARS
COMMERCIAL REAL ESTATE
EXPERIENCE
•
Proven Real Estate
Investment Manager
•
Management Continuity
•
Accretive Transaction
•
Increased Dividend
•
Liquidity
•
Greater Access to
Capital Markets
•
New Fee Income
•
Elimination of Management
Fee Expense
THE PROPOSED TRANSACTION WILL
PROVIDE IMPORTANT BENEFITS, INCLUDING:
1,014
PROPERTIES
OWNED
Notes: See About the Data on page 22 for footnote information. Data is unaudited as of
12/31/2012.
STATES |
 5
Transformational Transaction |
 6
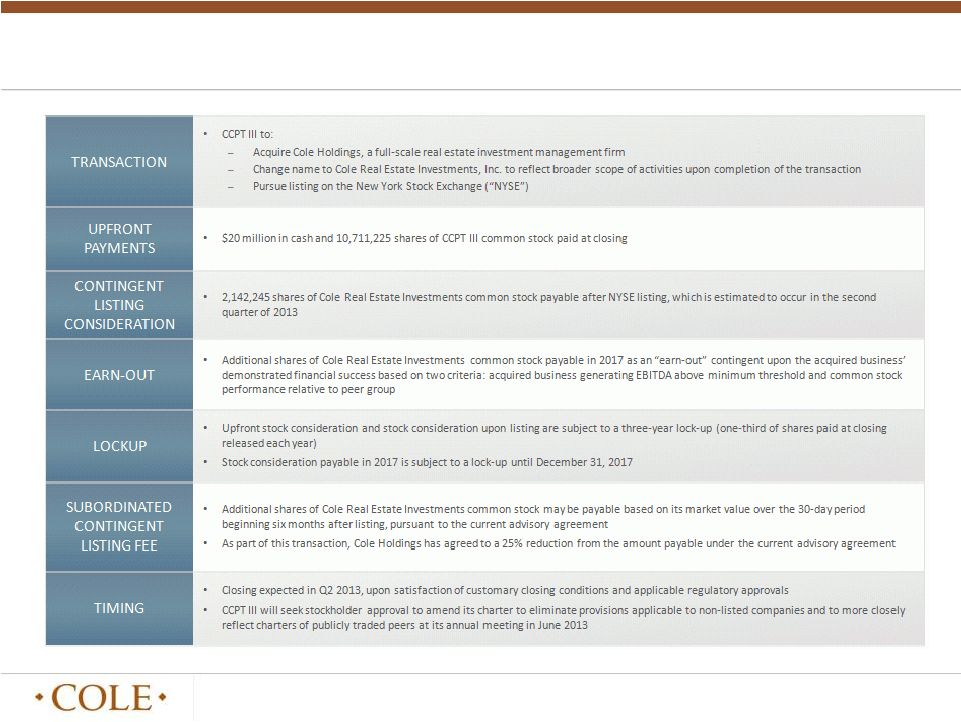
Key Terms of the Transaction |
 7
Second Largest Publicly-Traded REIT in the Net-Lease Sector Upon Listing
Ranked by Gross Book Assets
Source: Latest publicly available financials.
3.
Spirit pro forma for CCPT II acquisition. All data per Spirit January 2013 Investor
presentation. 4.
Gross book assets plus disclosed real estate depreciation. Spirit gross book value represents
the sum of Spirit 3Q12 and CCPT II 3Q12 disclosed numbers.
5.
Gross book assets based on purchase price of total assets
6.
Based on straight-line annualized rental revenue
O
(1)
COLE
REAL ESTATE
INVESTMENTS
(2)
SRC
(3)
WPC
LXP
NNN
EPR
GROSS BOOK ASSETS
(4)
$ 9.6
$7.4
(5)
$ 7.3
$ 4.7
$ 4.6
$ 4.3
$ 3.3
NUMBER OF PROPERTIES
3,528
1,014
2,012
423
220
1,622
182
SQUARE FOOTAGE (MM)
~50.0+
43.1
54.3
38.5
41.2
19.2
13.9
NUMBER OF TENANTS
N/A
562
300+
124
N/A
300+
250+
NUMBER OF STATES
49
+ PR
47
48
41
+ Europe
41
47
36
OCCUPANCY
98%
99%
99%
99%
97%
98%
98%
WEIGHTED AVERAGE LEASE LENGTH (YRS)
11.4
12.7
(6)
10.6
8.9
7.1
12
N/A
% OF RENT FROM TOP 5 TENANTS
~20%
20.7%
(6)
29%
29%
13%
24%
52%
% OF RENT FROM
INVESTMENT
GRADE
TENANTS
34%
42%
(6)
19%
34%
49%
N/A
N/A
CREDIT RATINGS (S&P / MOODY’S)
BBB / Baa1
N/A
TBD
N/A
N/A
BBB / Baa2
BB / Baa3
All metrics, except gross book assets, based on wholly-owned assets and consolidated joint
ventures and excludes unconsolidated joint ventures, mortgage notes receivable and
commercial mortgage-backed securities. Data is unaudited as of 12/31/2012.
1.
2.
Pro forma for January 2013 closing on acquisition of ARCT. Data per Realty Income
September 2012 Investor Presentation and 2012 10K.
|
 8
CCPT III: Property Type and Geographic Diversification
GEOGRAPHIC DIVERSIFICATION
Notes: Property Type Diversification based on purchase price of total assets. Geographic
Diversification based on wholly owned assets and consolidated joint ventures and excludes
unconsolidated joint ventures, mortgage notes receivable and commercial mortgage-backed
securities. Data is unaudited as of 12/31/2012. PROPERTY TYPE DIVERSIFICATION
49.3%
SINGLE-TENANT
RETAIL
18.6%
MULTI-TENANT
RETAIL
17%
SINGLE-TENANT
OFFICE
7.5%
SINGLE-TENANT
INDUSTRIAL
4.8%
DEBT INVEST.
2.8%
JOINT VENTURE &
CONSTRUCTION IN
PROGRESS |
 `
CCPT III: Industry and Tenant Diversification
CCPT III’s high-quality tenants represent industry leaders in the pharmacy, consumer
goods, restaurant, home improvement and technology sectors
9
Notes: Trade names shown are those of tenants of properties owned by CCPT III. CCPT III is not
affiliated or associated with, is not endorsed by, does not endorse, and is not sponsored by
or a sponsor of the tenants or of their products or services pictured or mentioned. The names,
logos and all related product and service names, design marks and slogans are the
trademarks or service marks of their respective companies. Data is unaudited as of 12/31/2012. TOP 10 INDUSTRIES
NUMBER OF
LEASES
% OF
ANNUAL RENT
TOP 10 TOTAL
1,074
60.6%
RESTAURANT
324
10.3%
GROCERY
72
9.0%
DRUGSTORE
134
9.0%
DISCOUNT STORE
220
7.6%
HOME AND GARDEN
66
5.4%
PET SUPPLIES
48
4.4%
WAREHOUSE CLUB
7
4.3%
HEALTHCARE
57
3.9%
FINANCIAL SERVICES
60
3.5%
CONVENIENCE STORE
86
3.2%
TOP 10 TENANTS
NUMBER OF
LEASES
% OF
ANNUAL RENT
WALGREENS
76
5.0%
ALBERTSON'S
34
4.3%
PETSMART
41
4.1%
CVS
58
3.9%
BJ'S WHOLESALE CLUB
3
3.4%
APOLLO GROUP
1
2.6%
WAL-MART
8
2.5%
L.A. FITNESS
17
2.5%
AMAZON.COM
3
2.5%
KOHL'S
20
2.4%
TOP 10 TOTAL
261
33.2% |
 10
CCPT III: Long-Term Leases to High-Quality Tenants
CREDIT RATING OF RATED TENANTS
37.6%
BBB+ / BBB / BBB-
1.6%
B-
and Below
12.2%
BB+ / BB / BB-
15.6%
B+ / B
20.1%
A+ / A / A-
12.9%
AAA / AA+ /
AA / AA-
LEASE EXPIRATIONS
62.3%
10-20 YEARS
12.9%
7-10 YEARS
7.1%
20+ YEARS
9.3%
5-7 YEARS
3.1%
0-3 YEARS
5.3%
3-5 YEARS
Notes: Lease Expirations based on straight-line rental revenue and assume no renewals are
exercised. Based on annualized straight-line rental revenue, approximately 59.4% of CCPT III’s
tenants are rated by S&P; of the 59.4%, approximately 70.6% are rated investment
grade. S&P credit ratings are as of 1/16/2013. Data is unaudited as of 12/31/2012.
|
 Experienced
Management Team and Platform 352 PROFESSIONALS
CAPITAL
MARKETS
140 PROFESSIONALS
REAL ESTATE
TRANSACTIONS
REAL ESTATE
STRATEGY
REAL ESTATE
OPERATIONS
EXECUTIVE AND
OTHER
IT AND
FACILITIES
Sales, Shareholder Services,
Investor & Broker Dealer
Relationships, and Other
Support Functions
Acquisitions,
Dispositions and Legal
& Risk Management
Underwriting and
Investment Strategy
& Research
Real Estate Finance,
Property Management &
Operations, and Leasing
Accounting,
Human Resources,
and Administrative
Information Technology
and Facilities Management
JEFF HOLLAND, CFA
HEAD OF CAPITAL MARKETS
16 YEARS OF EXPERIENCE
BlackRock | Raymond James
McKinsey & Company
MITCHELL SABSHON
CHIEF OPERATING OFFICER
27 YEARS OF EXPERIENCE
Goldman Sachs | Lehman Brothers
Skadden Arps
THOMAS W. ROBERTS
MANAGING DIRECTOR
OF REAL ESTATE
25 YEARS OF EXPERIENCE
Opus West | Koll Company
KIRK McALLASTER, CPA
CHIEF FINANCIAL OFFICER
(REITS AND REAL ESTATE FUNDS)
21 YEARS OF EXPERIENCE
Deloitte | Coopers & Lybrand
DAVID LYNN, Ph.D.
CHIEF INVESTMENT STRATEGIST
25 YEARS OF EXPERIENCE
ING Clarion | AIG Global Real Estate
AvalonBay Communities
AARON HALFACRE, CFA
CHIEF MARKETING OFFICER
15 YEARS OF EXPERIENCE
BlackRock | Green Street Advisors
STEPHAN KELLER
CHIEF FINANCIAL OFFICER
20 YEARS OF EXPERIENCE
UBS
Seamless integration of the same real estate management
platform that has acquired and managed the real estate
assets of CCPT III since its inception
CHONG P. HUAN
HEAD OF TECHNOLOGY &
INFRASTRUCTURE
20 YEARS OF EXPERIENCE
Citi | AIG | New York Life
MARC NEMER
PRESIDENT AND
CHIEF EXECUTIVE OFFICER
15 YEARS OF EXPERIENCE
Latham & Watkins | Skadden Arps
CHRISTOPHER H. COLE
EXECUTIVE CHAIRMAN
34 YEARS OF EXPERIENCE
Founder, Cole
Real Estate Investments
42 PROFESSIONALS
15 PROFESSIONALS
59 PROFESSIONALS
79 PROFESSIONALS
17 PROFESSIONALS
11 |
 12
Robust Real Estate Resources
•
Leasing Team: 10
•
Enhances property values
through high occupancy,
balanced tenant mix, and
attractive economics
•
Employs statistical analysis to
drive economics and
measure leasing performance
•
Utilizes a national geographic
coverage model
•
Real Estate Acquisitions
Team: 20
•
“On the ground”
deal
sourcing team with
–
In-depth knowledge of
primary, secondary and
tertiary property
markets
–
Strong, strategic
relationships with
leading national and
regional brokerage firms
•
Over $3.9 billion of
transactions in 2012:
–
$1.2 billion single-tenant
retail
–
$1 billion multi-tenant
retail
–
$1 billion office and
industrial
–
Over $700 million of
dispositions
A broad range of real estate acquisition, portfolio strategy, financing, management, and
leasing capabilities to optimize individual assets and entire portfolios
•
Underwriting Team: 9
–
Credit/tenant
underwriting
–
Site inspections
•
Investment Strategy
and Research Team: 5
–
1 Post Doctorate, 1
Master of Quantitative
Finance, 1 CFA
–
Market Research
–
Portfolio construction
and optimization
LEASING
REAL ESTATE TRANSACTIONS
REAL ESTATE STRATEGY
•
Property Management
and Operations Team: 43
•
Manages over 76 million
square feet and over 2,000
properties
•
Capability to manage stand-
alone properties as well as
power centers
•
Utilizes regional geographic
coverage model with offices
in Phoenix, Atlanta, Chicago
and Orlando
•
Oversees all major capital
and repair projects, tenant
expansions and build-to-suit
program
PROPERTY MANAGEMENT
•
Real Estate Finance Team: 7
•
Obtains unsecured/secured
lines of credit and first
mortgage financing
•
Secured $1.65 billion worth of
financing in 2012
REAL ESTATE FINANCE
REAL ESTATE LEGAL
•
Finance and Accounting
Team: 55
•
16 CPAs
•
22 Big 4 public
accounting alumni
FINANCE & ACCOUNTING
•
Real Estate Legal Team: 21
•
Provides transaction support
and risk management |
 13
Industry Leading Transactions Platform
1
U.S. SINGLE-TENANT
ACQUISITIONS
PAST TEN YEARS
3
ALL U.S. PROPERTY
TYPES ACQUISITIONS
PAST FIVE YEARS
Real Capital Analytics, North America, US
Transactions closed or under contract. Status dates: Excludes joint venture
investments. Data as of December 31, 2012. 1
U.S. SINGLE-TENANT
RETAIL ACQUISITIONS
PAST TEN YEARS
1
U.S. SINGLE-TENANT
OFFICE ACQUISITIONS
PAST THREE YEARS
#
#
#
# |
 14
Comprehensive Capital Raising Capabilities
•
Client Segmentation and
Targeting Capability
•
Registered Investment Advisor
Channel
Demographics
•
Product Specialists
•
Thought-leadership Research
•
Sales Ideas
•
Partnership Campaigns
•
Industry Trends
•
Digital Marketing
•
Public Relations/
Advertising
•
Broker-Dealer Firms
(1)
: 480
Selling Agreements
•
Relationship Management
Team: 13
•
Campaigns: Customized to
Partner Focus Themes
•
Number of Events
in 2011: 501
•
Co-sponsor Firm
Events: 368
•
“Essential Partner”
Business Model
A broad range of capital raising capabilities to meet the needs of our distribution
partners •
2012 Assets Raised:
$1.28 billion
•
Average Shareholder
Investment : $36,000
•
Number of
Salespeople: 70
•
Dedicated Virtual
Team: 7
•
Channels: Retail, Registered
Investment Advisors,
Institutional
•
Advisors with Sales: 13,375
•
2012 Market Share
(2)
: 12%
•
Consultative/Educational
Approach
•
19 Representatives
•
Investor Services: 160,000
•
Shareholder Accounts
•
Average Daily Call Volume:
625
•
New Business
Transactions: 3,000/mo.
MARKETING
NATIONAL ACCOUNTS
SALES
CLIENT SERVICE
•
Used Across All Channels:
Wirehouse, Independent
Broker-Dealer, and Registered
Investment Advisor
•
Uniform Compliance Process
•
Comprehensive Education and
Training
•
Supervisory Oversight
DISCIPLINED SALES PROCESS
•
Standard Non-listed REITs,
Daily NAV Products, Limited
Partnerships, Share Class
Modeling, and Separate
Accounts
PRODUCT STRUCTURING
MARKET INTELLIGENCE
1.
Reflects participating dealer agreements entered into during offering stages of Cole Credit
Property Trust III, Inc., Cole Credit Property Trust IV, Inc., Cole Corporate Income Trust, Inc.
and Cole Real Estate Income Strategy (Daily NAV), Inc. Data is unaudited as of
12/31/2012. 2.
Source: Robert A. Stanger & Co., Inc.; includes equity and mortgage LPs, LLCs, and
non-listed REITs. |
 Consistent
Market Leadership Source: Robert A. Stanger & Co., Inc., based on annual capital
raise by the sponsor. Notes: Healthcare Trust of America was distributed by American
Realty Capital. The corporate logos used in this chart that are registered trademarks are the property of their respective owners.
Cole is the only non-listed REIT sponsor on the leader board 5 years in a row
TOP 5 REAL ESTATE SPONSORS
15
2008
2009
2010
2011
2012
1
st
2
nd
3
rd
4
th
5
th |
 Immediately
Accretive and Poised for Greater Growth Source: Robert A. Stanger & Co., Inc.;
includes equity and mortgage LPs, LLCs, and non-listed REITs; ranking by sponsor.
INDUSTRY GROSS SALES
EQUITY RAISED
($ in billions)
2008
2009
2010
2011
2012
COLE MARKET SHARE
11%
16%
18%
16%
12%
COLE RANKING
#3
#1
#1
#2
#2
•
Cole Real Estate Investments is continuously developing new products and
seeking to open new channels for distribution
•
With the ability to offer multiple investment vehicles (e.g. listed shares,
non-listed
offerings),
Cole
Real
Estate
Investments
will
appeal
to
a
broader
range of current and potential investors
•
All future growth opportunities will directly benefit the CCPT III
stockholders as income and valuation are realized
•
CCPT
III
is
acquiring
a
large,
profitable
real
estate
investment manager
on an immediately accretive basis
•
Assuming a $1.3 billion capital raise over a 12 month period, the asset
management business would generate approximately $90 million in
incremental revenue for the combined company
•
Over $6 billion has been raised in the past 5 years alone
–
Consistently averaging $100 million of new capital per month
16
$1.1
$1.0
$1.4
$1.3
$1.3
$9.6
$6.1
$8.1
$8.3
$10.3
$0
$2
$4
$6
$8
$10
$12
2008
2009
2010
2011
2012
COLE
INDUSTRY
CURRENT INCREMENTAL VALUE
SIGNIFICANT GROWTH OPPORTUNITY |
 17
Significant Market Share Opportunity Exists
Notes: See About the Data on page 22 for footnote information. Past performance does not
guarantee future results. •
Cole has captured over 3% share of all real estate assets under management in the
insurance and independent channels –
Capturing 14% of new inflows invested into non-listed REITs on average for the past
five years
–
Expectations of an incremental 5% opportunity from new advisors in Current Retail channel and
4% in New Core Retail channel
•
Replicating 3% share of institutional and subadvisory real estate allocations would equate to
a significant opportunity
–
Attaining 1% share of all Institutional real estate allocations and 5% share of all
subadvisory real estate allocations may be conservative
–
3% share of these new distribution channels could be as much as $90 billion
CHANNEL
TOTAL
AUM
(2)
MIN.
REAL ESTATE ALLOCATION
(2)
COLE OPPORTUNITY
(3)
% OF TOTAL AUM
REAL ESTATE (RE) AUM
% OF RE AUM
CAPITAL RAISE
ASSETS
(4)
Current Retail
$3.4T
6.6%
$224B
5%
$11B
$22B
Insurance and Independent Broker -
Dealers
(Fee and Commission)
New Core Retail
$8.6T
5.0%
$430B
4%
$17B
$34B
Wirehouse, Regional, Bank, RIA,
and Bank Broker-Dealers
Institutional
$11.0T
7.0%
$770B
1%
$8B
$16B
Subadvisory
$3.7T
5.0%
$185B
5%
$9B
$18B
TOTAL
$27.0T
6.0%
$1.6T
3%
$45B
$90B
(1) |
 18
Merger Benefits Summary
SCALE
•
CCPT III is one of the largest REITs focused on the net-lease commercial real estate
sector, and following a listing, Cole Real Estate Investments would be the second
largest publicly-traded REIT in the net-lease sector CONSISTENCY
•
CCPT III stockholders will continue to benefit from the knowledge and operational
efficiencies resulting from seamless integration
of
the
same
real
estate
management
platform
that
has
acquired
and
managed
the
real
estate
assets
of
CCPT
III
since its inception
VALUE
•
Transaction is expected to be immediately accretive to CCPT III’s funds from operations
and to support an increase in the Company’s annualized dividend rate to $0.70 per
share upon closing LIQUIDITY
•
Stockholders will have even greater access to liquidity/flexibility to sell or retain shares
based on public market value Represents opportunity to achieve a liquidity event
substantially earlier than was previously anticipated for CCPT III stockholders
ACCESS
•
Cole Real Estate Investments will have the opportunity not only to continue raising capital
from retail distribution channels, but also to increase its access to institutional
investors and related capital sources Better positioned to seek other accretive
opportunities beyond organic capital raising opportunities GROWTH
•
Cole Real Estate Investments will benefit from its new income stream of fees earned from the
management of other real estate vehicles as well as the efficiencies resulting from
the elimination of its external management fees POTENTIAL
•
This
transformational
transaction
creates
a
historic
opportunity
to
participate
in
the
next
evolution
of
real
estate
asset
management
Making even more obtainable the goal of being the premier, trusted brand in real estate, and
the most capable partner in delivering best-in-class long-term results
Creating
a
new
paradigm
in
real
estate
asset
management
that
can
provide
financial
advisors
and
investors
with
sound
investment strategies and innovative investment vehicles |
 19
Roadmap to Completion
•
List Cole Real Estate Investments
on NYSE promptly after charter
is amended
•
Announce transaction
•
Seek stockholder approval to
amend CCPT III’s charter at the
annual meeting
June 2013
April -
May
2013
•
Expected closing in Q2 2013, subject
to satisfaction of customary closing
conditions and applicable regulatory
approvals
June 2013 |
 20
About the Data
Slide Notes: “A Highly Attractive Portfolio and A Leading Investment Manager”
Slide Notes: “Significant Market Share Opportunity Exists”
Based on wholly-owned assets and consolidated joint ventures and excludes unconsolidated
joint ventures, mortgage notes receivable and commercial mortgage-backed
securities. Data is unaudited as of December 31, 2012.
Weighted Average Remaining Lease Term is based on annualized straight-line rental
revenue. Total Square Feet includes building and ground-lease square footage.
1.
2.
3.
1.
2.
3.
4.
As of 12/31/2012, Independent and Insurance AUM is $3.4T, and current allocation to real
estate is 6.6% ($224B); Cole’s market share at $6.6B in capital raise ($12B in
AUM) is 2.9%. New Flows share is a 5 year average (14.2% = $1.21B average Cole flows / $8.5B
average industry flows) (Robert A. Stanger & Co., Inc.).
AUM is as of the end of 2011 (Cerulli Associates). Current Retail allocation to real estate is
6.6% (Cerulli Associates). Other Minimum Real Estate Allocations are an average
assumption based on Cerulli Associates, Investment News, and other publications.
Cole Opportunity is our projection for market share within real estate allocations.
Assets based on 50% loan-to-value ratio.
|