Attached files
| file | filename |
|---|---|
| 8-K - 8-K - BUCKEYE PARTNERS, L.P. | d498320d8k.htm |
 Morgan
Stanley Midstream MLP and Diversified Natural Gas Corporate Access Day
New York, NY
March 6, 2013
©
Copyright 2013 Buckeye Partners, L.P.
Exhibit 99.1 |
 LEGAL
NOTICE/FORWARD-LOOKING STATEMENTS ©
Copyright 2013 Buckeye Partners, L.P.
2
This presentation contains “forward-looking statements” that we believe to be
reasonable as of the date of this presentation. These statements, which include
any statement that does not relate strictly to historical facts, use terms such as “anticipate,” “assume,” “believe,”
“estimate,” “expect,” “forecast,” “intend,”
“plan,” “position,” “predict,” “project,” or “strategy” or the negative connotation or other
variations of such terms or other similar terminology. In particular, statements,
express or implied, regarding future results of operations or ability to generate
sales, income or cash flow, to make acquisitions, or to make distributions to unitholders are forward-looking statements.
These forward-looking statements are based on management’s current plans,
expectations, estimates, assumptions and beliefs concerning future events impacting
Buckeye Partners, L.P. (the “Partnership” or “BPL”) and therefore involve a number of risks and uncertainties, many of
which are beyond management’s control. Although the Partnership believes that its
expectations stated in this presentation are based on reasonable assumptions, actual
results may differ materially from those expressed or implied in the forward-looking statements. The factors
listed in the “Risk Factors” sections of, as well as any other cautionary language
in, the Partnership’s public filings with the Securities and Exchange Commission,
provide examples of risks, uncertainties and events that may cause the Partnership’s actual results to differ materially
from the expectations it describes in its forward-looking statements. Each
forward-looking statement speaks only as of the date of this presentation, and the
Partnership undertakes no obligation to update or revise any forward-looking statement. |
 INVESTMENT
HIGHLIGHTS •
Over 125 years of continuous operations, with a 26-year track record as a publicly traded
MLP on the NYSE
•
Market capitalization over $5.0 billion
•
Lower cost of capital realized from elimination of GP IDRs
•
Investment grade credit rating with a conservative approach toward financing growth
•
Increased
geographic
and
product
diversity
resulting
from
recent
acquisitions
•
Growth opportunities to unlock significant value from acquisition of assets from
major
petroleum
companies
-
“Terminal
Franchise”
•
Opportunities
for
significant
internal
growth
projects
on
legacy
and
recently
acquired
assets
•
Paid cash distributions each quarter since formation in 1986
Petroleum storage tanks at our Macungie terminal in Pennsylvania
Aerial view of BORCO’s six offshore jetties with tank farm in the distance
©
Copyright 2013 Buckeye Partners, L.P.
3 |
 BUCKEYE’S
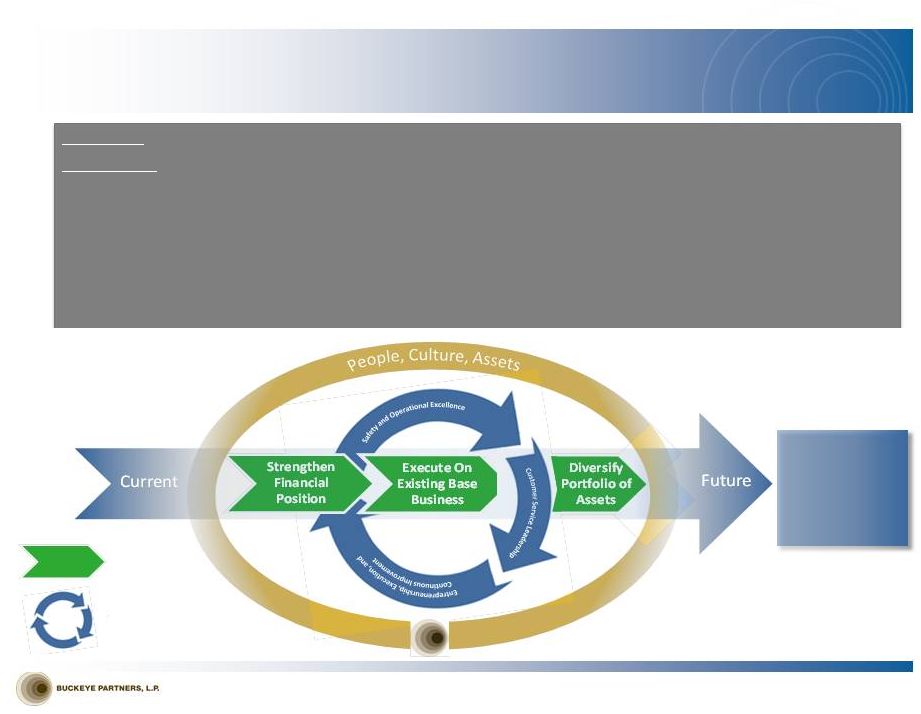
STRATEGY 4
©
Copyright 2013 Buckeye Partners, L.P.
Key Component
Guiding Principle
Generate
Exceptional
Financial
Returns to
Unitholders
An unwavering commitment to safety, environmental responsibility, regulatory compliance, and
personal integrity Best-in-class customer service and sophisticated commercial
operations Operational excellence that provides consistent, reliable performance at the
lowest reasonable cost An entrepreneurial approach toward logistical solutions to
profitably expand and optimize Buckeye’s portfolio of global energy A commitment to
consistent execution and the continuous improvement of our operations, projects and people
•
•
•
•
•
Our
Vision:
Buckeye
-
the
logistical solutions partner of choice for the global energy business
Our Mission: To deliver superior returns to our investors through our talented, valued
employees and our core strengths of
assets |
 ORGANIZATIONAL
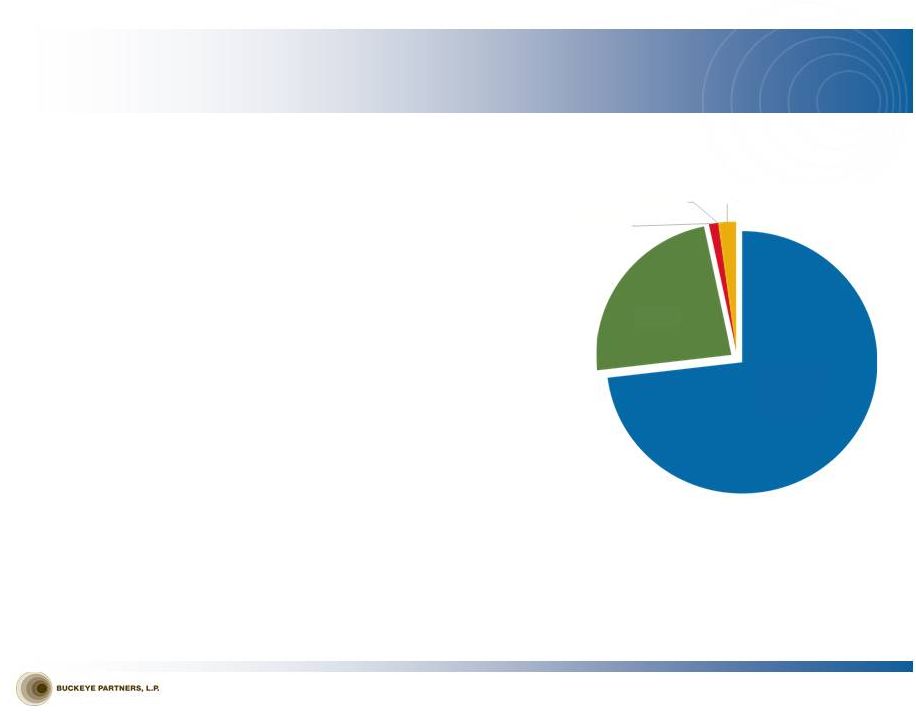
OVERVIEW Three Business Operating Units
(1) See Appendix for Non-GAAP Reconciliations
©
Copyright 2013 Buckeye Partners, L.P.
5
Domestic Pipelines & Terminals
•
~6,000 miles of pipeline with ~100 delivery locations
•
~100 liquid petroleum product terminals
•
~42 million barrels of liquid petroleum product storage capacity
International
Pipelines
&
Terminals
•
~30 million barrels of storage capacity at 2 terminal facilities
in The Bahamas (~25 million) and Puerto Rico (~5 million)
•
Deep water berthing capability to handle ULCCs and VLCCs
in The Bahamas
•
Announced expansion of 4.7 million barrels at Bahamian facility nearing
completion, with 1.9 million barrels placed in service 2
nd
half 2012, 1.6
million placed into service during Q1 2013, and 1.2 million barrels expected
to be placed into service during Q3 2013
Buckeye Services
Natural Gas Storage
•
~30 Bcf of working natural gas storage capacity in Northern California
Energy Services
•
Markets refined petroleum products in areas served by Domestic Pipelines &
Terminals
•
5 terminals with ~1 million barrels of storage capacity
Development & Logistics
•
Operates and/or maintains third-party pipelines under agreements with
major oil and gas and chemical companies
73.1%
23.6%
1.1%
0.1%
2.1%
2012 ADJUSTED EBITDA
(1) |
 BUCKEYE SYSTEM
MAP ©
Copyright 2013 Buckeye Partners, L.P.
6 |
 VALUE
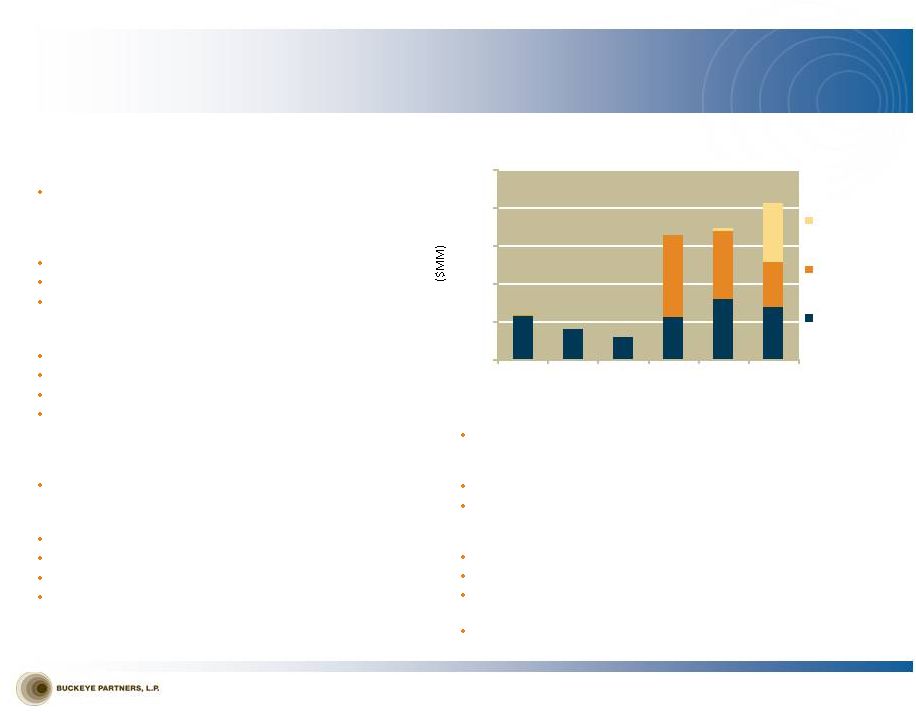
CREATION/GROWTH DRIVERS $4 Billion Invested Since 2008
©
Copyright 2013 Buckeye Partners, L.P.
7
Organic Growth Capital Spending
(4)
$0
$80
$160
$240
$320
$400
2008
2009
2010
2011
2012
2013P
Perth Amboy
BORCO
Domestic Assets
(excl. Perth
Amboy)
$91.5
$261.9
$63.8
$46.5
$276.9
$330.0
Transformation of Perth Amboy terminal into highly efficient, multi-
product storage, blending, and throughput facility with crude unit
train offloading capability
Storage expansion and terminal enhancements at BORCO facility
Construction of crude oil storage tanks, capacity increases in pipeline
interconnectivity, and assessment of potential crude unit train
capabilities within our Chicago complex
Truck loading rack upgrades in the Midwest
Refurbishment of tanks across the domestic system
Butane blending, vapor recovery, and additive system installations
planned for numerous terminal facilities across our system
Completion of modifications at Albany terminal, allowing the handling
of both crude oil and ethanol unit trains
Perth Amboy, New Jersey Marine Terminal,
$260.0
million
BORCO Marine Terminal, $1.7 billion
BP Pipeline & Terminal Assets, $165.0 million
Maine Terminals and Pipeline, $23.5 million
Buy-in of BPL’s general partner, 20 million units issued
Yabucoa, Puerto Rico Terminal, $32.6 million
Opelousas, Louisiana Terminal, $13.0 million
Blue/Gold Pipeline and Terminal Assets, $54.4 million
Lodi Natural Gas Storage, $442.4 million
Farm & Home Oil Company
(2)
, $146.2 million
(3)
Niles and Ferrysburg, Michigan Terminals, $13.9 million
Albany, New York Terminal, $46.9 million
2009
2008
2010
2011
2012
Additional Equity Interest in West Shore Pipe Line Company,
$13.5 million
(1)
Excludes acquisitions with a value of $10 million or lower (2)
Now Buckeye Energy Services (3)
Buckeye sold the retail division of Farm & Home Oil Company in 2008 for
$52.6 million (4)
Estimate provided is mid-point of expected organic growth capital spend range 2013 Capital Projects
Recent Transactions
(1) |
 CRUDE
DIVERSIFICATION ©
Copyright 2013 Buckeye Partners, L.P.
8
•
Albany, NY
•
Multi-year contract signed with Irving Oil in October 2012
to provide crude oil services, including off-loading unit
trains, storage, and throughput
•
Albany terminal has two ship docks on the Hudson River,
allowing transport of crude oil directly to Irving’s facility
•
Perth Amboy, NJ
•
Constructing capability to off-load crude unit trains
•
Transportation options include ship, barge, and
potentially pipeline
•
Woodhaven, MI
•
Offload Bakken crude from railcars and transport via
pipeline to an Ohio refinery
•
BORCO (Freeport, Bahamas)
•
Multi-year agreement signed in April 2012 to support 1.2
million barrel expansion of facility
•
Latin America crude developments forcing producers to
find large storage locations with blending capabilities and
segregation for multiple qualities of crude
•
Advanced marine infrastructure and service capabilities
provide competitive advantage over other marine
terminals in the region
With the emergence of the Bakken and Utica shale plays, as well as new crude developments in
Latin America, Buckeye is looking at ways to leverage its assets to provide crude oil
logistics solutions to producers and refiners wherever possible.
Source: PFC Energy
Crude Blending & Staging
To West
Coast
To Asia
To Gulf
Coast
To Europe
From Latin
America |
 Domestic
Pipelines & Terminals ©
Copyright 2013 Buckeye Partners, L.P.
9 |
 DOMESTIC
PIPELINES & TERMINALS OVERVIEW ©
Copyright 2013 Buckeye Partners, L.P.
10
Petroleum storage tanks at our Macungie terminal in Pennsylvania
Pipelines & Terminals segment represents Buckeye’s
largest segment contribution to Adjusted EBITDA
Over 6,000 miles of pipeline located primarily in the
Northeast and Midwest United States moving nearly
1.4 million barrels of liquid petroleum products per day
with more than 100 delivery points
Approximately 100 liquid petroleum product storage
terminals located throughout the United States
Approximately 42 million barrels of storage capacity
Terminal Throughput Volumes
Pipeline Throughput Volumes
(1)
(1)
Pipeline volumes exclude contribution from the Buckeye NGL Pipeline
sold in January of 2010
1,483.4
1,395.4
1,323.1
1,316.3
1,358.1
1,385.6
0
500
1,000
1,500
2,000
2007
2008
2009
2010
2011
2012
482.3
464.4
471.9
562.5
742.8
897.3
0
250
500
750
1000
2007
2008
2009
2010
2011
2012 |
 PERTH AMBOY
OVERVIEW Facility Overview
•
•
•
Only ~ 6 miles from Buckeye Linden complex
•
Pipeline, water, rail, and truck access
•
Strategically situated on New York Harbor as a NYMEX
delivery point
•
•
2.7 MMBbls of active refined product storage
•
1.3 MMBbls of refurbishable refined product storage
•
0.8 MMBbls of heavy oil refurbishable storage
•
•
•
©
Copyright 2013 Buckeye Partners, L.P.
11
Note: Facility
located in Perth
Amboy, NJ.
Green line
indicates
approximate
property
boundaries
(1)
One of the barge docks is currently out of service.
Growth Opportunities
•
Near-term plans to transform existing terminal into a highly
efficient, multi-product storage, blending, and throughput facility
•
Potential for crude, gasoline, distillate, ethanol, asphalt, or 6 oil
service that can be optimized as market needs evolve
•
Pipeline planned for direct interconnect to Buckeye Linden
complex
•
Project initiated to allow handling of Bakken-sourced crude oil via
rail and ship
Strategic Rationale
•
•
•
BPL purchased facility from Chevron (closed in July 2012)
Approximately 5 MMBbls total storage capacity
4 docks (1 ship, 3 barge
(1)
) with water draft up to 37'
Improves connectivity and service capabilities for
customers to increase Buckeye system utilization
Provides for security and diversity of product supply for
Buckeye’s customers by connecting waterborne product
supply with end destination markets across the Buckeye
system
Provides customers with storage at New York Harbor, a
highly liquid NYMEX settlement point
Located at the southwest end of New York Harbor on
the Arthur Kill
Capital investment period supported by multi-year
storage, blending, and throughput commitments from
Chevron
~250 acre site with significant undeveloped acreage for
expansion potential |
 PERTH AMBOY
COMMERCIAL STRATEGY ©
Copyright 2013 Buckeye Partners, L.P.
12
(1)
Petroleum
Administration
for
Defense
Districts
PADD
(1)
1 Market Opportunity
•
Perth Amboy is in a highly attractive location in the
New York Harbor with access to the large local PADD
1 market
•
The PADD 1 region has ~36% of the U.S.
population and relies on PADD 3 and international
imports and transfers of refined products to meet
market demand
•
All U.S. Northeast product not produced by local
refineries must be supplied either through import
or inter-PADD transfers, increasing storage
capacity demand in the New York Harbor
•
New York Harbor NYMEX delivery point: nexus of
U.S. Northeast petroleum flows
•
Significantly more trading liquidity than
Philadelphia market
Buckeye Business Strategy
•
Multi-mode takeaway capacity (pipe, water, rail, truck)
connected to the Buckeye system and inland
distribution network
•
Balanced focus on imports/exports for clean products
(gasoline, distillates, jet) and dirtier fuels (crude, fuel
oil, asphalt)
•
Pipeline constraints and poor facility configurations
(tank-to-tank communication) at some existing
terminals in New York Harbor result in inefficiencies
•
Ability to complement storage with local product
distribution via truck rack
•
Strong interest expressed for a Bakken/Utica crude
solution, bunker fuel growth, and asphalt
terminalling/supply
•
Facilitates U.S. Northeast product flow and logistics
•
Secures and diversifies access to product supply
•
Extension of the product value chain with BORCO
•
Opportunity to tie-in imports and exports to/from
the U.S.
We believe optimal facility configuration with simultaneous operations and high-speed
takeaway capacity will give Perth Amboy competitive advantages in the marketplace
|
 DOMESTIC
PIPELINES & TERMINALS GROWTH POTENTIAL Crude Diversification:
•
Multi-year agreement to support transformation
of the Albany marine terminal to handle crude
via rail and ship for major oil refiner
•
Contracted to offload approximately 8,600 bpd
of Bakken crude for refinery customer at
Woodhaven, MI facility
•
Perth rail facility being constructed
Butane Blending:
•
Significant growth driven by strong blending
margins
•
Improved blending efficiencies and oversight
•
Opportunities for further locational deployment
of blending capabilities
Propylene Rail Facility (completed in 4Q 2012):
•
Construction of new propylene storage at East
Chicago facility
•
Rail loading capability added
©
Copyright 2013 Buckeye Partners, L.P.
13
Utica Shale
Opportunity:
•
Development is
in early stages,
but industry
consensus is that
crude logistics
solutions will be
needed
•
Buckeye has
presence in area
and has
opportunity to
utilize existing
infrastructure,
including ROW
and underutilized
lines, to be key
logistics provider
Chicago Complex Crude Oil and Other Opportunities:
•
Construction of additional storage capacity to leverage asset footprint in
Chicago to take advantage of changing crude oil slates in the market
•
Exploring crude rail opportunities
•
Project underway to increase capacity in refined products pipeline
interconnectivity within the complex
PROJECTS
Primary
Utica
Shale
Other Projects In Progress:
•
Storage expansions at existing domestic terminals, including Pittsburgh
and Opelousas terminals
Utica Shale
Opportunity: |
 FERC ORDER
DEVELOPMENTS Buckeye Pipe Line’s Market-Rate Program
©
Copyright 2013 Buckeye Partners, L.P.
14
“Show Cause”
Proceeding Pertaining to Buckeye Pipe Line Company, L.P.’s (“BPL Co.”)
Innovative Rate-Setting System Airlines’
Complaint
“Show Cause” order issued by FERC on March 30, 2012, pursuant to protest of a single
airline shipper in the NYC area after BPL Co. had filed for routine, system-wide
tariff increases
BPL Co.’s rate increase filings also rejected at the time of the “show cause”
order
Multiple filings by BPL Co. and protesting party throughout 2012 Resolved
by issuance of FERC order on February 22, 2013, which provided for the following:
BPL Co. permitted to continue charging current rates BPL Co.
granted full market-based-rate authority in markets previously found by FERC to be competitive markets, in which BPL Co.
generated $137 million of revenue from interstate transportation service in 2012 BPL Co.
allowed to file future rates in its remaining markets, in which BPL Co. generated $126 million of revenue from interstate
transportation service in 2012 pursuant to any of the methodologies permitted by FERC
regulations, including in accordance with the generic FERC index
Treatment of NYC market rate still pending outcome of two other filings, as discussed below
(Airlines’ Complaint and Market-Based Rates Application for New York City
Market)
Earlier program utilized by BPL Co. now discontinued On
September 20, 2012, four airlines filed a complaint at FERC challenging BPL Co.’s tariff rates for transporting jet fuel to three NYC airports
–
the same movements that were the subject of the March protest that led to the “show
cause” proceeding.
On October 10, 2012, BPL Co. filed its answer to the complaint, and additional filings were
made by the parties in October and November. No third parties have filed to
intervene in the complaint proceeding.
On February 22, 2013, FERC issued an order setting the matter for hearing, but such hearing is
to be put on hold pending the outcome of FERC-ordered settlement discussions
between the parties, which are to be facilitated by a FERC-appointed settlement judge.
In 2012, deliveries of jet fuel to the NYC airports generated approximately $32 million of BPL
Co.’s revenues. The complaint is not directed at BPL Co.’s rates for service
to other destinations, and it has no impact on the pipeline systems and terminals owned by Buckeye’s other
operating subsidiaries. |
 FERC ORDER
DEVELOPMENTS (Continued) Buckeye Pipe Line’s Market-Rate Program
©
Copyright 2013 Buckeye Partners, L.P.
15
Market-Based Rates Application for New York City Market
On October 15, 2012, BPL Co. filed an application with FERC seeking authority to charge
market-based rates for deliveries of refined petroleum products to the NYC market. If FERC
grants the application, BPL Co. would be permitted prospectively to set its rates in response to competitive forces, and the airlines’
cost-based challenges to BPL Co.’s jet fuel delivery rates to the NYC airports would
be moot with respect to future rates.
Buckeye believes that the New York City-area market is robust and highly
competitive. The New York Harbor is one of the world’s most active refined
petroleum products markets. Within this market, BPL Co.’s customers have access to numerous existing alternatives, via
pipeline, barge, and truck, to transport refined products. The three airports are
located near other active products pipelines or barge docks and, with reasonable
investment, should be able to access alternative jet fuel supplies efficiently and economically.
On December 14, 2012, four airlines filed a joint protest of BPL Co.’s market-based
rates application, specifically pertaining to jet fuel transportation to three NYC
airports - the same movements that were the subject of the March 2012 protest that led to the “show cause”
proceeding. The protest is not directed at BPL Co.’s market-based rates application
pertaining to movements of any other products or to any other destinations in the NYC
market.
On January 14, 2013, BPL Co. filed its answer to the protest. Additional filings were
also made by the parties in January and February 2013. Buckeye cannot predict when FERC
will act on the application or what it will do. |
 International Pipelines & Terminals
©
Copyright 2013 Buckeye Partners, L.P.
16 |
 ©
Copyright 2013 Buckeye Partners, L.P.
17
INTERNATIONAL PIPELINES AND TERMINALS
(1)
Excludes non-cash amortization of unfavorable storage contracts.
81%
12%
7%
BORCO 2012 REVENUE
(1)
Storage (take or pay)
Berthing (variable)
Other Ancillary (variable)
66%
21%
13%
BORCO 2012 LEASED CAPACITY
Fuel Oil
Crude Oil
•
World-class marine storage terminal for crude oil, fuel oil, and refined
petroleum products
•
24.9 MMBbls capacity
•
Located in Freeport, Bahamas, 80 miles from Southern Florida and
920 miles from New York Harbor
•
Deep-water access (up to 91 feet) and the ability to berth VLCCs and
ULCCs
•
Capacity leased under take or pay contracts
•
World-class customer base
•
Variable revenue generation from ancillary services such as berthing,
blending, bunkering, and transshipping
•
Hub for international logistics
•
Announced expansion of 4.7 million barrels nearing completion with
3.5 million barrels delivered to date and 1.2 million barrels expected
to be placed into service in 2013; room to double storage capacity if
market conditions permit
BORCO
•
Well maintained facility with superior blending/manufacturing
facilities
•
4.6 million barrels of refined petroleum product, fuel oil, and crude
oil storage capacity
•
Strategic location supports a strong local market and also provides
regional growth opportunities
•
Long-term fee-based revenues supported by multi-year volume
commitments from Shell
Yabucoa, Puerto Rico
Refined
products |
 BORCO COMMERCIAL
OPERATIONS BORCO’s
location
and
deep
water
access,
make
it
uniquely
positioned
to
capture
the
global
storage, build-bulk, break-bulk, and blending services market
18
©
Copyright 2013 Buckeye Partners, L.P.
Blending and Crude
Staging
Break-bulk
Build-bulk
Select examples of blending services provided at BORCO include: Blending of fuel oil from Caribbean and South American refineries for delivery to Asia Blending of clean products from Asia for delivery throughout the U.S. East Coast, the
Caribbean, and Latin America markets
Blending of heavy / light crude oil from various areas for delivery to U.S. Gulf Coast
refineries
There is growing demand for blending capabilities at BORCO, including the following: Increasing production of heavy, lower-quality crudes from South America, which require
additional infrastructure to blend with lighter, sweeter grades
–
Blending of Brazilian Peregrino and Papa Terra heavy crudes with diluent or lighter crudes As international regulations require more use of cleaner burning transportation fuels, there
is growing demand for BORCO's blending services Potential to add butane and ethanol storage/blending capabilities Build-bulk operations consist of receiving smaller-sized vessels from regional
draft- restricted ports, aggregating product in large tankage, and then exporting
in larger-sized vessels for long-haul transport e.g - Delivering cargoes of heavy fuel oil from Latin America to BORCO in Aframax
vessels, blending with lighter fuel oil from the U.S. Gulf Coast, and building bulk fuel
oil blends that are then exported to Asia Pacific in VLCCs Break-bulk operations consist of receiving large-sized vessels from long-haul
destinations and then breaking those volumes into smaller cargos suitable for export
to regional draft restricted ports e.g. - Receiving large cargo imports of clean products (diesel/gasoline) from India and
Europe and breaking those volumes into smaller cargos situated for export to the
U.S., Mexico, the Caribbean, and Central/South America |
 Capex
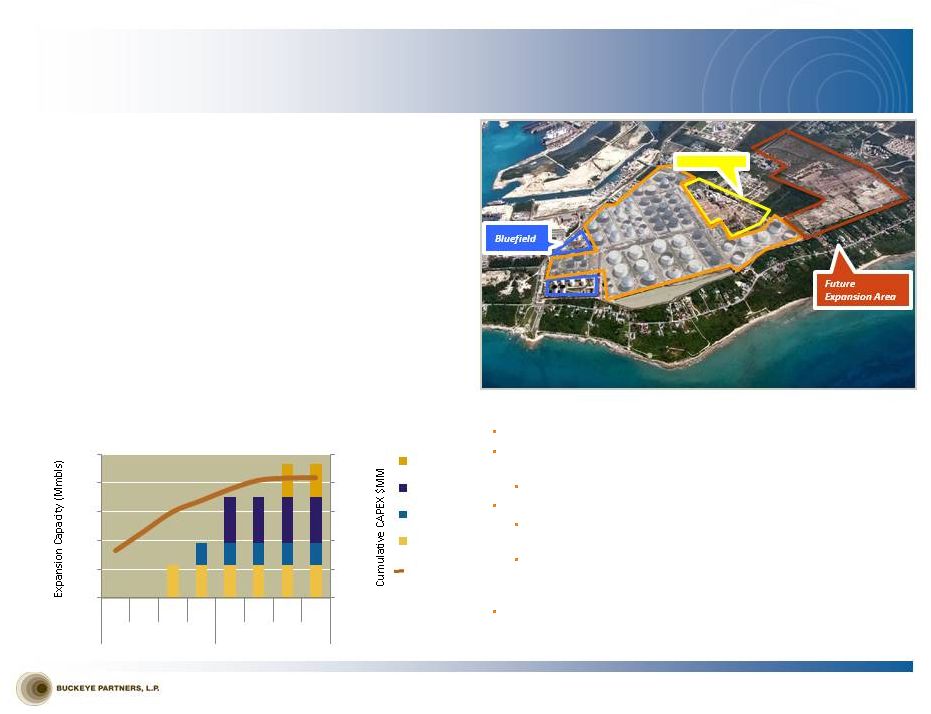
INTERNATIONAL INTERNAL GROWTH PROJECTS
EXPANSION AND OTHER GROWTH OPPORTUNITIES
©
Copyright 2013 Buckeye Partners, L.P.
19
•
Expanded storage capacity by 3.5 million barrels, with an additional 1.2
million barrels of crude oil storage expected to be in service in the third
quarter of 2013; 4.7 million barrel expansion fully leased
•
Constructed ample berthing capacity to allow future expansion without
incremental marine infrastructure spend
•
Designed facility to accommodate multiple product segregations to
enable blending and maximum flexibility for changes in facility
requirements
•
Improved simultaneous operations to move product in and out of the
facility at the same time
•
Provided critical infrastructure redundancy to ensure business
continuity
•
Improved loading and unloading rates to allow for reduced berthing
time
•
Laid ground work for future expansion by optimizing facility
configuration
BORCO
Expansion
Capacity
(1)
–
millions
of
barrels
(1)
Graph reflects expected midpoint of capital spend range. Dates represent expected date that
capacity is placed in service. BORCO
Capital
Investment
Since
Acquisition
(~$320
million):
Yellowfield
$0
$50
$100
$150
$200
$250
0
1
2
3
4
5
Q1
Q2
Q3
Q4
Q1
Q2
Q3
Q4
2012
2013
Bluefield 2
Bluefield 1
Yellowfield 1
Significant
land
available
for
further
expansion
Other Internal Growth Opportunities
Potential
for
staging
of
crude
oil
resulting
from
Latin
American
production
expected to come online over the next decade
Provides optionality to multiple end-market destinations
Bunkering Opportunities –
Blended Fuel Oil
BORCO is the logical, geographical, optimum spot for a new “Bunker
filling station”
2014 Panama Canal expansion to allow passage of Suezmax vessels
expected to lead to 20-30% increase in traffic, BORCO location ideal to
service the incremental vessels
Yabucoa, Puerto Rico facility provides opportunities for jet fuel and crude
storage, as well as fuel oil supply and bunkering
Yellowfield 2 |
 ©
Copyright 2013 Buckeye Partners, L.P.
20
Buckeye Services |
 BUCKEYE SERVICES
OVERVIEW ©
Copyright 2013 Buckeye Partners, L.P.
21
Energy Services
Development & Logistics
Natural Gas Storage
•
Buckeye Energy Services (“BES”) markets a wide range
of refined petroleum products and other ancillary
products in areas served by Buckeye’s pipelines and
terminals
•
Strategy for mitigating basis risk included a reduction
of refined product inventories in the Midwest and
focusing on fewer, more strategic locations for
transacting business
•
Recently reduced costs by right-sizing the
infrastructure for reduced geographic focus
•
Contributed approximately $25 million in revenues to
Domestic Pipelines & Terminals in 2012, while also
providing valuable insight on demand and pricing
support for our terminalling and storage business
•
Buckeye Development & Logistics (“BDL”) operates and/or
maintains third-party pipelines under agreements with
major oil and gas and chemical companies
•
BDL is also responsible for identifying and completing
potential acquisitions and organic growth projects for
Buckeye
•
BDL services offered to customers
•
Contract operations
•
Project origination
•
Asset development
•
Engineering design
•
Project management
•
Buckeye’s
Lodi
Gas
Storage
facility
is
a
high
performance
natural
gas
storage
facility
with
approximately
30
Bcf
of
working gas capacity in Northern California serving the greater San Francisco Bay Area
•
Revenue is generated through firm storage services and hub services
•
The
facilities
collectively
have
a
maximum
injection
and
withdrawal
capability
of
approximately
550
million
cubic
feet
per day (MMcf/day) and
750 MMcf/day, respectively
•
Lodi’s
facilities
are
designed
to
provide
high
deliverability
natural
gas
storage
service
and
have
a
proven
track
record
of safe and reliable operations |
 Financial
Overview ©
Copyright 2013 Buckeye Partners, L.P.
22 |
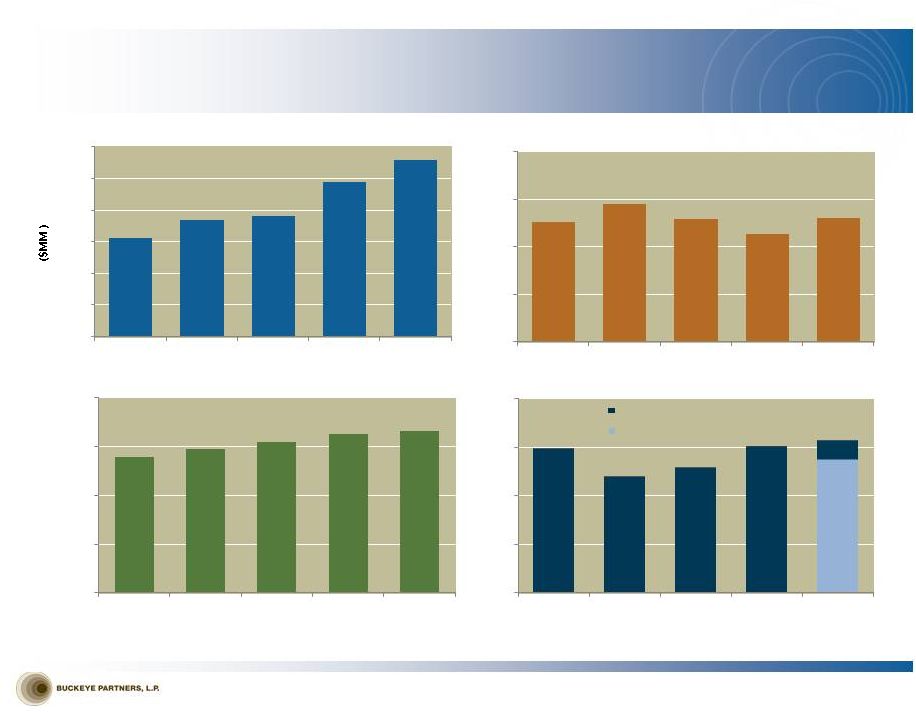 FINANCIAL
PERFORMANCE ©
Copyright 2013 Buckeye Partners, L.P.
23
Adjusted EBITDA ($MM)
(1)
Cash Distribution Coverage
(1)(2)
(1)
See Appendix for Non-GAAP Reconciliations
(2)
Distributable cash flow divided by cash distributions declared for the respective periods
(3)
Long-term debt less cash and cash equivalents divided by Adjusted EBITDA (adjusted for pro
forma impacts of acquisitions); calculation as per BPL Credit Facility (4)
Pro
forma
leverage
as
of
December
31,
2012,
to
reflect
impact
of
$350 million January 2013 equity issuance
Net LT Debt/Adjusted EBITDA
(3)
Leverage, as reported
Pro forma leverage
$313.6
$370.2
$382.6
$487.9
$559.5
$0
$100
$200
$300
$400
$500
$600
2008
2009
2010
2011
2012
$3.475
$3.675
$3.875
$4.075
$4.150
$0.00
$1.25
$2.50
$3.75
$5.00
2008
2009
2010
2011
2012
1.01x
1.16x
1.03x
0.91x
1.04x
0.00x
0.40x
0.80x
1.20x
1.60x
2008
2009
2010
2011
2012
4.47x
3.62x
3.89x
4.55x
4.14x
(4)
0.00x
1.50x
3.00x
4.50x
6.00x
2008
2009
2010
2011
2012
4.74x
Cash Distributions per Unit |
 INVESTMENT
SUMMARY Stability and Growth
©
Copyright 2013 Buckeye Partners, L.P.
24
•
Proven
26-year
track
record
as
a
publicly
traded
partnership
through
varying
economic
and
commodity
price
cycles
•
Management
continues
to
drive
operational
excellence
through
its
best
practices
initiative
•
Recent acquisitions provide Buckeye with increased geographic and product diversity, including
access to international logistics opportunities, and provide significant near-term
growth projects •
July 2012 acquisition of marine terminal facility in Perth Amboy, NJ from Chevron furthers
Buckeye’s strategy to create a fully integrated and flexible system that offers
unparalleled connectivity and service capabilities; provides significant near-term
growth opportunities at attractive multiple •
World-class
BORCO
marine
storage
terminal
with
24.9
million
barrels
of
storage
capacity
for
crude
oil
and
liquid
petroleum products in Freeport, Bahamas, with opportunity for significant additional capacity
expansion; serves as important logistics hub for international petroleum product
flows •
Diversified portfolio of assets provides balanced mix of stability and growth and is well
positioned to take advantage of changing supply and demand fundamentals for crude and
refined petroleum products to drive improved returns to unitholders
|
 Non-GAAP
Reconciliations ©
Copyright 2013 Buckeye Partners, L.P.
25 |
 BASIS OF
REPRESENTATION; EXPLANATION OF NON-GAAP MEASURES ©
Copyright 2013 Buckeye Partners, L.P.
26
Buckeye’s equity-funded merger with Buckeye GP Holdings, L.P. (“BGH”) in
the fourth quarter of 2010 has been treated as a reverse merger for accounting
purposes. As a result, the historical results presented herein for periods prior to the completion of the merger are those of BGH, and
the diluted weighted average number of LP units outstanding increase from 20.0 million in the
fourth quarter of 2009 to 44.3 million in the fourth quarter of 2010. Additionally,
Buckeye incurred a non-cash charge to compensation expense of $21.1 million in the fourth quarter of 2010
as a result of a distribution of LP units owned by BGH GP Holdings, LLC to certain officers of
Buckeye, which triggered a revaluation of an equity incentive plan that had been
instituted in 2007.
Adjusted EBITDA and distributable cash flow are measures not defined by GAAP. Adjusted EBITDA
is the primary measure used by our senior management, including our Chief Executive
Officer, to (i) evaluate our consolidated operating performance and the operating performance of
our business segments, (ii) allocate resources and capital to business segments, (iii)
evaluate the viability of proposed projects, and (iv) determine overall rates of return
on alternative investment opportunities. Distributable cash flow is another measure used by our senior
management to provide a clearer picture of Buckeye’s cash available for distribution to
its unitholders. Adjusted EBITDA and distributable cash flow eliminate (i) non-cash
expenses, including, but not limited to, depreciation and amortization expense resulting from the significant capital
investments we make in our businesses and from intangible assets recognized in business
combinations, (ii) charges for obligations expected to be settled with the issuance of
equity instruments, and (iii) items that are not indicative of our core operating performance results and business
outlook.
Buckeye believes that investors benefit from having access to the same financial measures used
by senior management and that these measures are useful to investors because they aid
in comparing Buckeye’s operating performance with that of other companies with similar operations.
The Adjusted EBITDA and distributable cash flow data presented by Buckeye may not be
comparable to similarly titled measures at other companies because these items may be
defined differently by other companies. Please see the attached reconciliations of each of Adjusted
EBITDA and distributable cash flow to net income. |
 NON-GAAP
RECONCILIATIONS ©
Copyright 2013 Buckeye Partners, L.P.
27
Net Income to Adjusted EBITDA ($000)
2008
2009
2010
2011
2012
Net income attributable to BPL
26,477
49,594
43,080
108,501
226,417
Interest and debt expense
75,410
75,147
89,169
119,561
114,980
Income tax expense (benefit)
801
(343)
(919)
(192)
(675)
Depreciation and amortization
50,834
54,699
59,590
119,534
146,424
EBITDA
153,522
179,097
190,920
347,404
487,146
Net
income
attributable
to
noncontrolling
interests
affected
by
merger
(1)
153,546
90,381
157,467
-
-
Amortization of unfavorable storage contracts
-
-
-
(7,562)
(10,994)
Gain on sale of equity investment
-
-
-
(34,727)
-
Non-cash deferred lease expense
4,598
4,500
4,235
4,122
3,901
Non-cash unit-based compensation expense
1,909
4,408
8,960
9,150
19,520
Equity plan modification expense
-
-
21,058
-
-
Asset impairment expense
-
59,724
-
-
59,950
Goodwill impairment expense
-
-
-
169,560
-
Reorganization expense
-
32,057
-
-
-
Adjusted EBITDA
(2)
313,575
370,167
382,640
487,947
559,523
Adjusted Segment EBITDA
Pipelines & Terminals
253,790
302,164
346,447
361,018
409,055
International Operations
-
-
(4,655)
112,996
132,104
Natural Gas Storage
41,814
41,950
29,794
4,204
6,118
Energy Services
9,443
19,335
5,861
1,797
524
Development & Logistics
8,528
6,718
5,193
7,932
11,722
Total Adjusted EBITDA
(2)
313,575
370,167
382,640
487,947
559,523
(1)
On November 19, 2010, Buckeye merged with Buckeye GP Holdings L.P.
(2)
In 2010, Buckeye revised its definition of Adjusted EBITDA to exclude non-cash
unit-based compensation expense, the 2010 non-cash equity plan modification expense and income attributable to
noncontrolling
interests
affected
by
the
merger
for
periods
prior
to
our
buy-in
of
our
general
partner.
These
amounts
were
excluded
from
Adjusted
EBITDA
presented
for
2008,
2009
and
2010
in
our
Annual
Report
on
Form
10-K
for
the
year
ended
December
31,
2010,
as
amended. |
 NON-GAAP
RECONCILIATIONS ©
Copyright 2013 Buckeye Partners, L.P.
28
Net Income to Distributable Cash Flow ($000)
(1)
On November, 19, 2010, Buckeye merged with Buckeye GP Holdings L.P.
(2)
In 2011, Buckeye revised its definition of Distributable Cash Flow to exclude amortization of
deferred financing costs and debt discounts. Distributable Cash Flow for 2008-2010 have been restated to exclude those amounts for
comparison purposes.
(3) Represents cash distributions declared and paid for limited partner units (LP
units) outstanding as of each respective period. Distributions with respect to the Class B units outstanding on the record date for each quarter ended
during 2011 and 2012 were paid in additional Class B units rather than in cash.
2008
2009
2010
2011
2012
Net income attributable to BPL
26,477
49,594
43,080
108,501
226,417
Depreciation and amortization
50,834
54,699
59,590
119,534
146,424
Net
income
attributable
to
noncontrolling
interests
affected
by
merger
(1)
153,546
90,381
157,467
-
-
Gain on sale of equity investment
-
-
-
(34,727)
-
Non-cash deferred lease expense
4,598
4,500
4,235
4,122
3,901
Non-cash unit-based compensation expense
1,909
4,408
8,960
9,150
19,520
Equity plan modification expense
-
-
21,058
-
-
Asset impairment expense
-
59,724
-
-
59,950
Reorganization expense
-
32,057
-
-
-
Non-cash senior administrative charge
1,900
475
-
-
-
Amortization of unfavorable storage contracts
-
-
-
(7,562)
(10,994)
Write-off of deferred financing costs
-
-
-
3,331
-
Amortization
of
deferred
financing
costs
and
debt
discounts
(2)
1,737
3,134
4,411
4,289
1,699
Goodwill impairment expense
-
-
-
169,560
-
Maintenance capital expenditures
(28,936)
(23,496)
(31,244)
(57,467)
(54,425)
Distributable Cash Flow
212,065
275,476
267,557
318,731
392,492
Distributions
for
Coverage
ratio
(3)
209,412
237,687
259,315
351,245
376,177
Coverage Ratio
1.01x
1.16x
1.03x
0.91x
1.04x |