Attached files
| file | filename |
|---|---|
| 8-K - POLARIS INDUSTRIES INC. 8-K - Polaris Inc. | a50583820.htm |
Exhibit 99.1
Scott Wine, Chairman & CEO Raymond James ConferenceMarch 5, 2013 POLARIS INDUSTRIES INC.
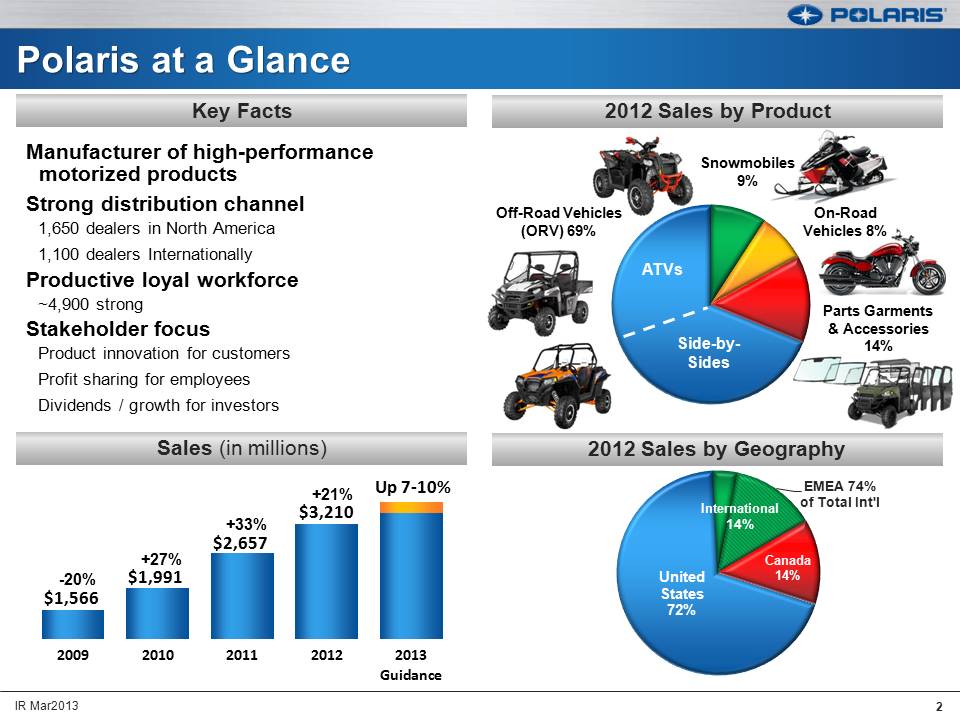
Polaris at a Glance Key Facts Manufacturer of high-performance motorized products Strong distribution channel 1,650 dealers in North America 1,100 dealers Internationally Productive loyal workforce ~4,900 strong Stakeholder focus Product innovation for customers Profit sharing for employees Dividends / growth for investor 2012 Sales by Product Off-Road Vehicles (ORV) 69% Snowmobiles 9% On-Road Vehicles 8% Parts Garments & Accessories 14% ATVs Side-by- Sides Sales (in millions) -20% +27% +33% +21% Up 7‐10% $1,566 $1,991 $2,657 $3,210 2009 2010 2011 2012 2013 Guidance 2012 Sales by Geography EMEA 74% of Total Int'l International 14% United States 72% Canada 14%
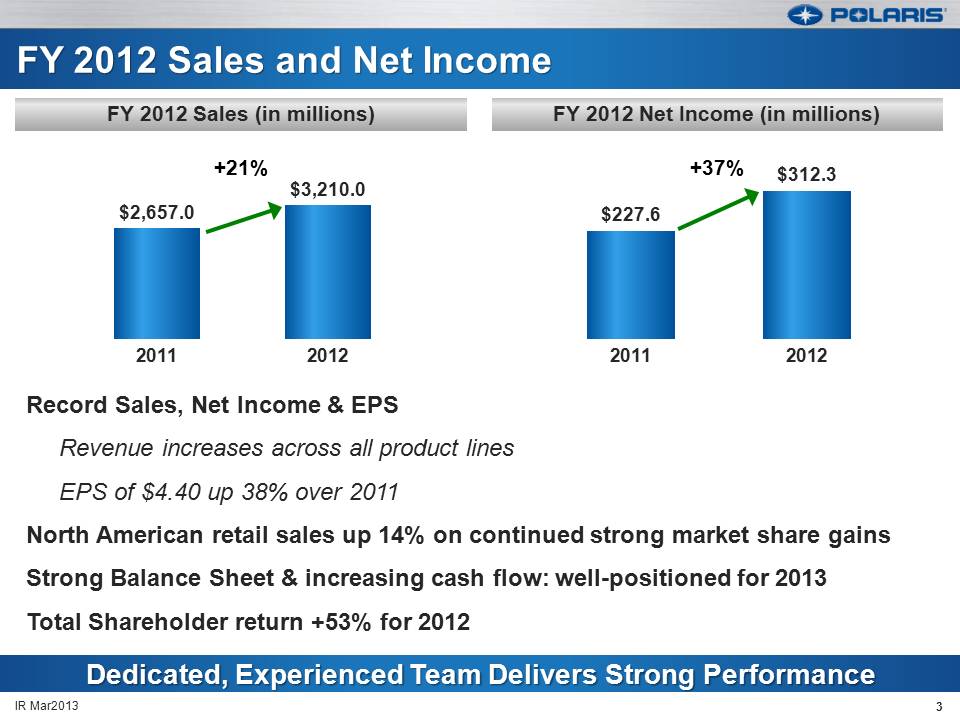
FY 2012 Sales and Net Income Record Sales, Net Income & EPS Revenue increases across all product lines EPS of $4.40 up 38% over 2011North American retail sales up 14% on continued strong market share gainsStrong Balance Sheet & increasing cash flow: well-positioned for 2013Total Shareholder return +53% for 2012 3 IR Mar2013 Dedicated, Experienced Team Delivers Strong Performance FY 2012 Net Income (in millions) FY 2012 Sales (in millions)
FY 2012 Sales and Net Income Record Sales, Net Income & EPS Revenue increases across all product lines EPS of $4.40 up 38% over 2011North American retail sales up 14% on continued strong market share gainsStrong Balance Sheet & increasing cash flow: well-positioned for 2013Total Shareholder return +53% for 2012 3 IR Mar2013 Dedicated, Experienced Team Delivers Strong Performance FY 2012 Net Income (in millions) FY 2012 Sales (in millions)
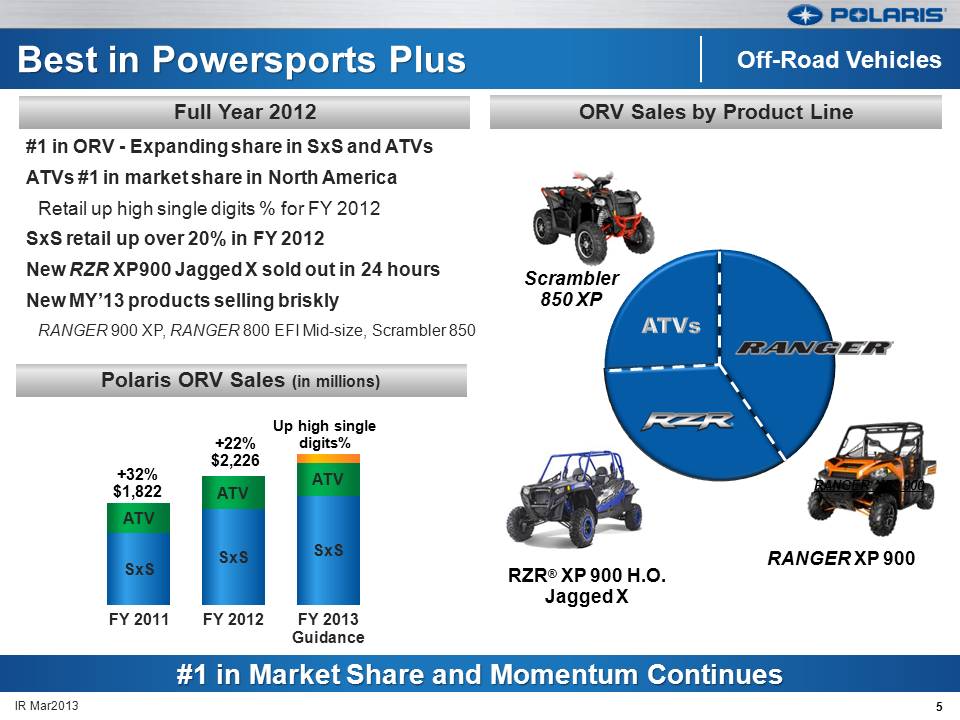
5 IR Mar2013 Best in Powersports Plus #1 in ORV - Expanding share in SxS and ATVs ATVs #1 in market share in North AmericaRetail up high single digits % for FY 2012SxS retail up over 20% in FY 2012New RZR XP900 Jagged X sold out in 24 hours New MY’13 products selling brisklyRANGER 900 XP, RANGER 800 EFI Mid-size, Scrambler 850 #1 and Momentum Continues Off-Road Vehicles Up high single digits% +22%$2,226 Full Year 2012 #1 and Momentum Continues #1 in Market Share and Momentum Continues Polaris ORV Sales (in millions) Scrambler850 XP RANGER XP® 900 +32%$1,822 RZR® XP 900 H.O. Jagged X ORV Sales by Product Line RANGER XP 900 ATVs
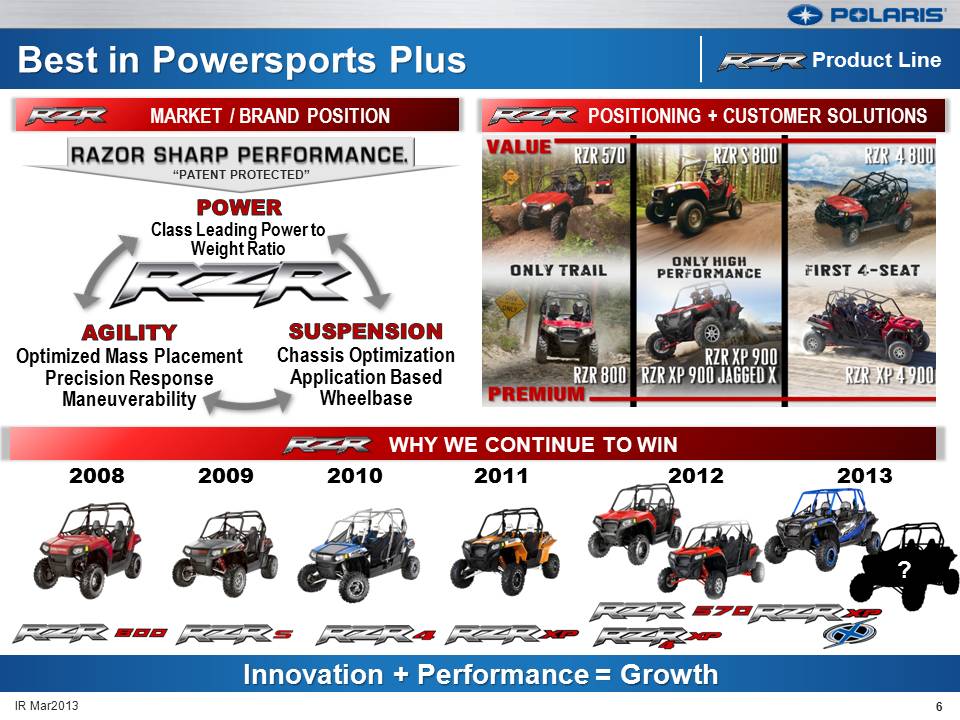
Best in Powersports Plus 6 IR Mar2013 Innovation + Performance = Growth POSITIONING + CUSTOMER SOLUTIONS (Gp:) SUSPENSION Chassis Optimization Application Based Wheelbase (Gp:) AGILITY Optimized Mass PlacementPrecision ResponseManeuverability (Gp:) POWER Class Leading Power to Weight Ratio MARKET / BRAND POSITION WHY WE CONTINUE TO WIN (Gp:) 2008 (Gp:) 2009 (Gp:) 2012 (Gp:) 2010 (Gp:) 2011 (Gp:) 2013 ? “PATENT PROTECTED” Product Line
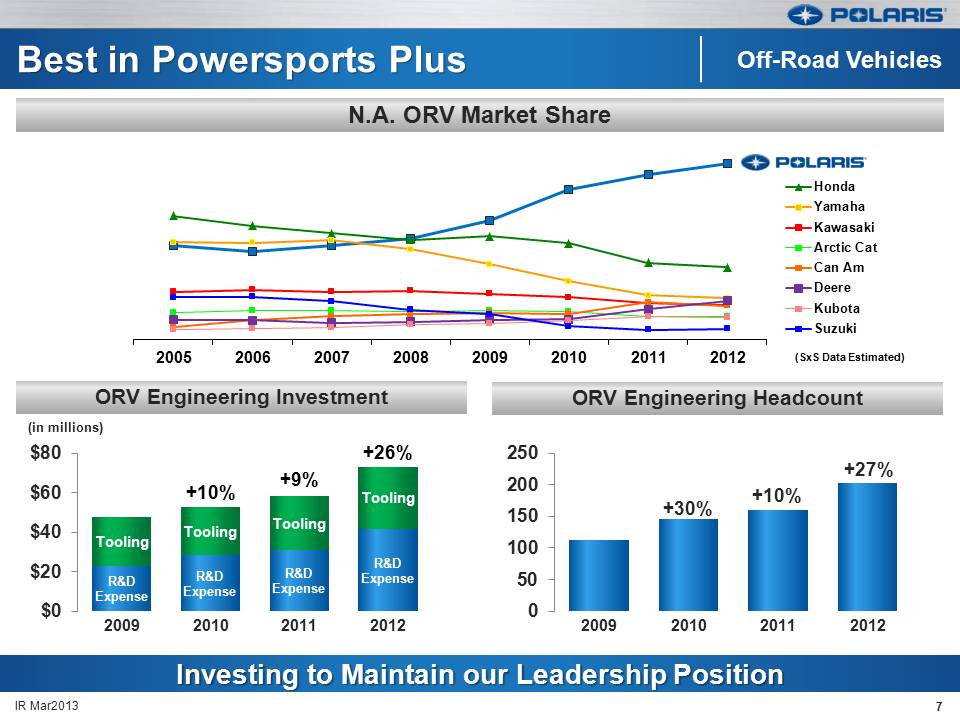
7 IR Mar2013 Best in Powersports Plus N.A. ORV Market Share ORV Engineering Headcount ORV Engineering Investment Investing to Maintain our Leadership Position +26% Off-Road Vehicles +9% +10% (in millions)
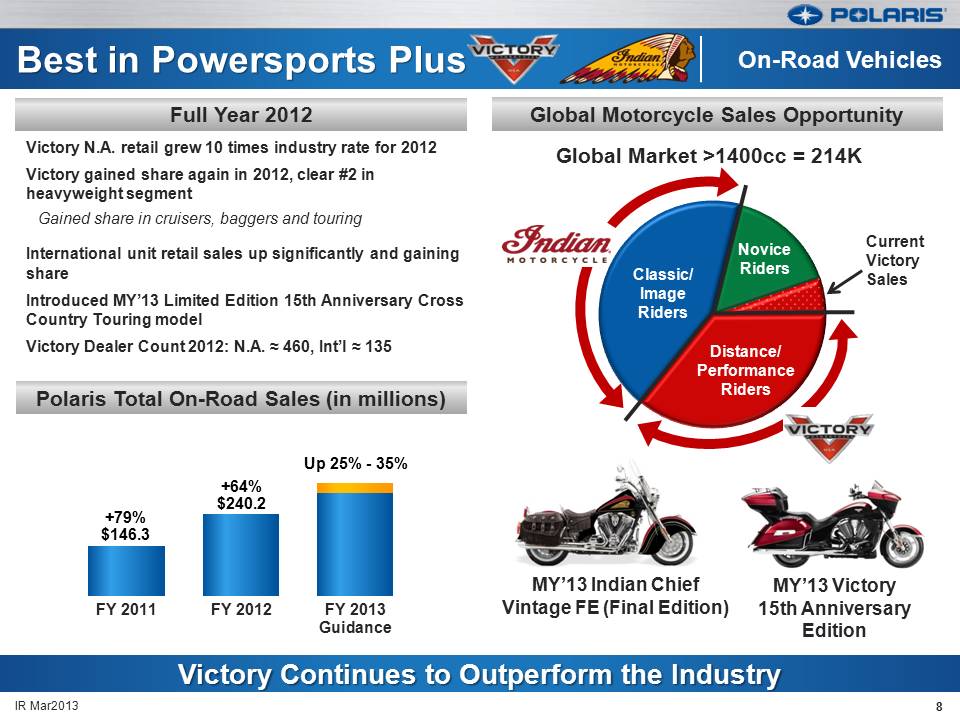
Best in Powersports Plus Polaris Total On-Road Sales (in millions) Global Motorcycle Sales Opportunity Full Year 2012 Victory Continues to Outperform the Industry Victory N.A. retail grew 10 times industry rate for 2012Victory gained share again in 2012, clear #2 in heavyweight segmentGained share in cruisers, baggers and touringInternational unit retail sales up significantly and gaining shareIntroduced MY’13 Limited Edition 15th Anniversary Cross Country Touring modelVictory Dealer Count 2012: N.A. ˜ 460, Int’l ˜ 135 Up 25% - 35% +64%$240.2 (Gp:) On-Road Vehicles MY’13 Victory15th Anniversary Edition Global Market >1400cc = 214K +79%$146.3 MY’13 Indian Chief Vintage FE (Final Edition) Current VictorySales Classic/Image Riders Distance/ Performance Riders NoviceRiders 8 IR Mar2013
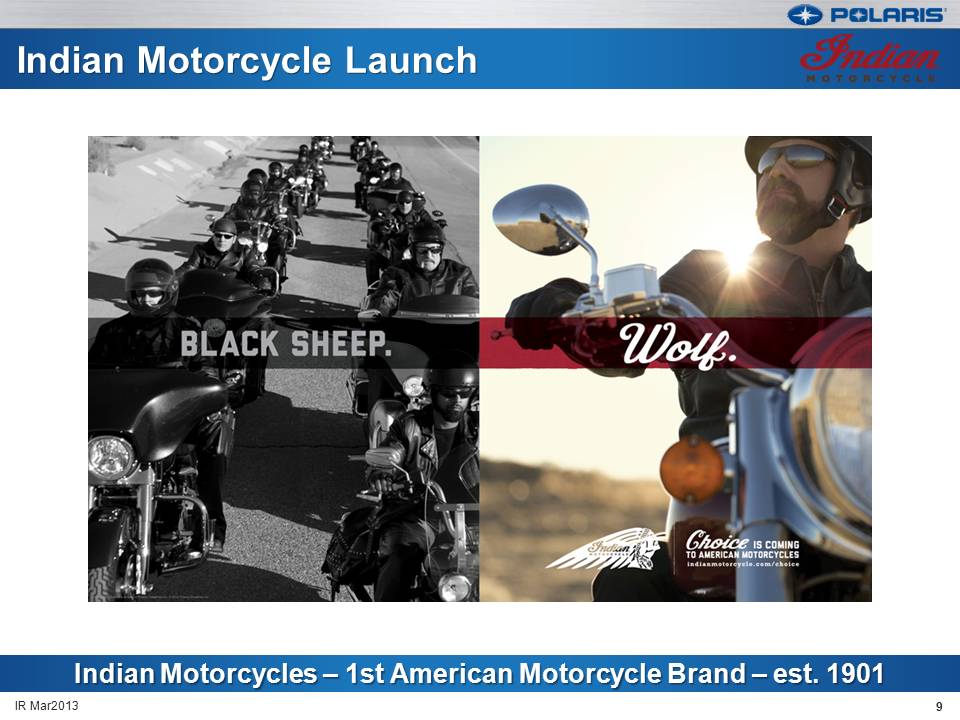
9 Indian Motorcycle Launch 9 IR Mar2013 Indian Motorcycles – 1st American Motorcycle Brand – est. 1901
Indian Motorcycle Commercial 10 IR Mar2013
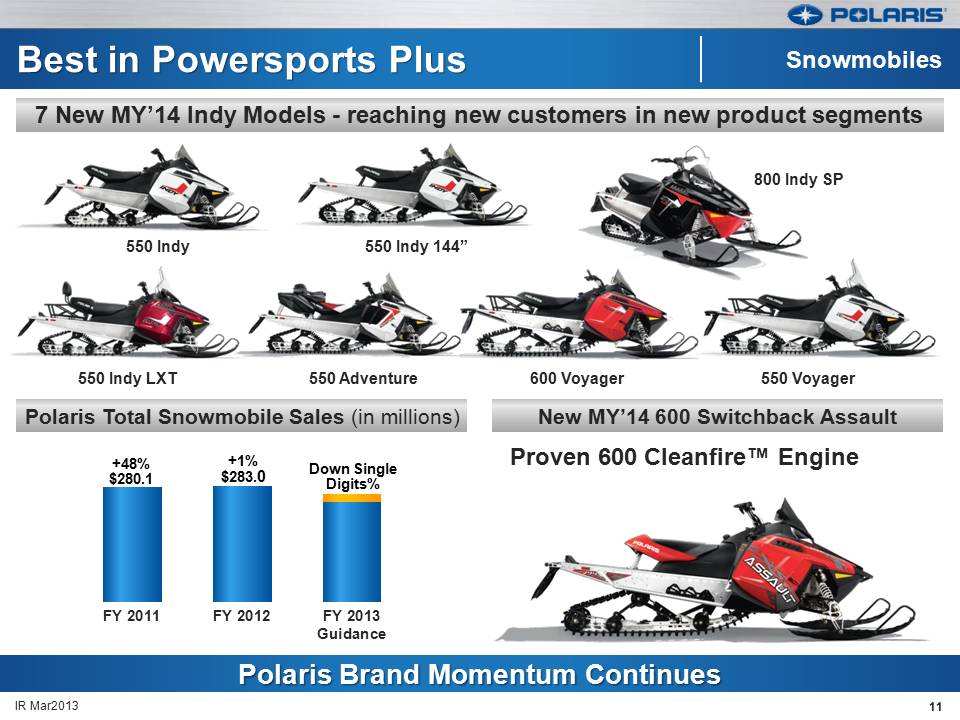
Best in Powersports Plus 7 New MY’14 Indy Models - reaching new customers in new product segments New MY’14 600 Switchback Assault Polaris Total Snowmobile Sales (in millions) Proven 600 Cleanfire™ Engine Polaris Brand Momentum Continues 550 Indy 550 Indy 144” 800 Indy SP 550 Indy LXT 550 Adventure 600 Voyager 550 Voyager Down Single Digits% +1%$283.0 +48%$280.1 11 IR Mar2013 (Gp:) Snowmobiles
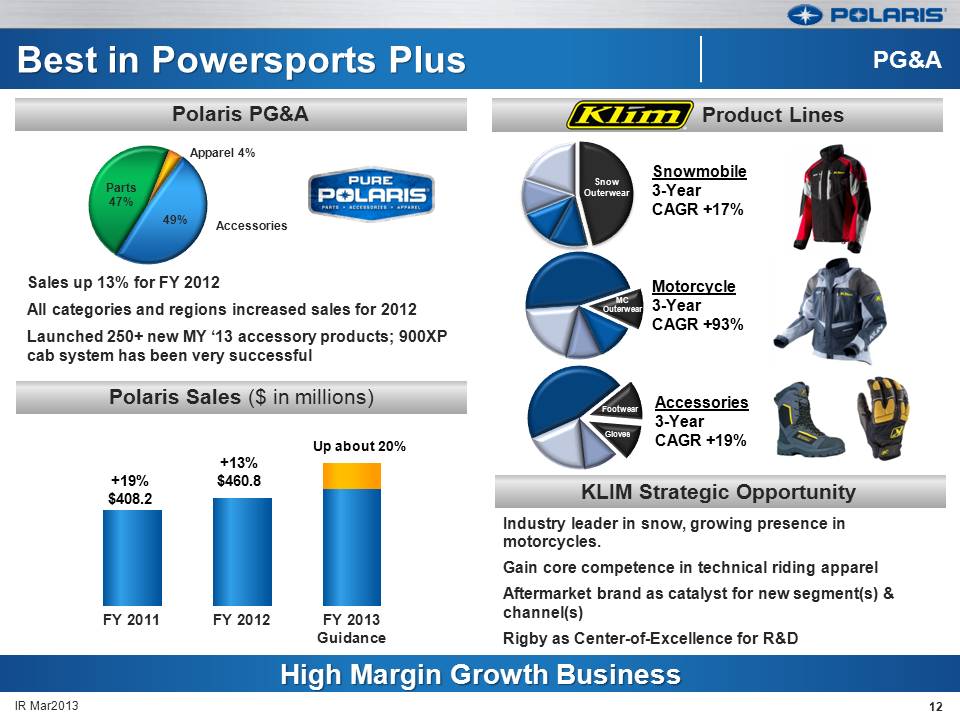
Best in Powersports Plus KLIM Strategic Opportunity Polaris Sales ($ in millions) KLIM Product Lines Polaris PG&A High Margin Growth Business Sales up 13% for FY 2012All categories and regions increased sales for 2012Launched 250+ new MY ‘13 accessory products; 900XP cab system has been very successful +19% $408.2 Up about 20% +13% $460.8 Industry leader in snow, growing presence in motorcycles. Gain core competence in technical riding apparelAftermarket brand as catalyst for new segment(s) & channel(s)Rigby as Center-of-Excellence for R&D Accessories3-YearCAGR +19% Motorcycle3-YearCAGR +93% Snowmobile3-Year CAGR +17% Snow Outerwear MCOuterwear Footwear Gloves (Gp:) PG&A IR Mar2013 12
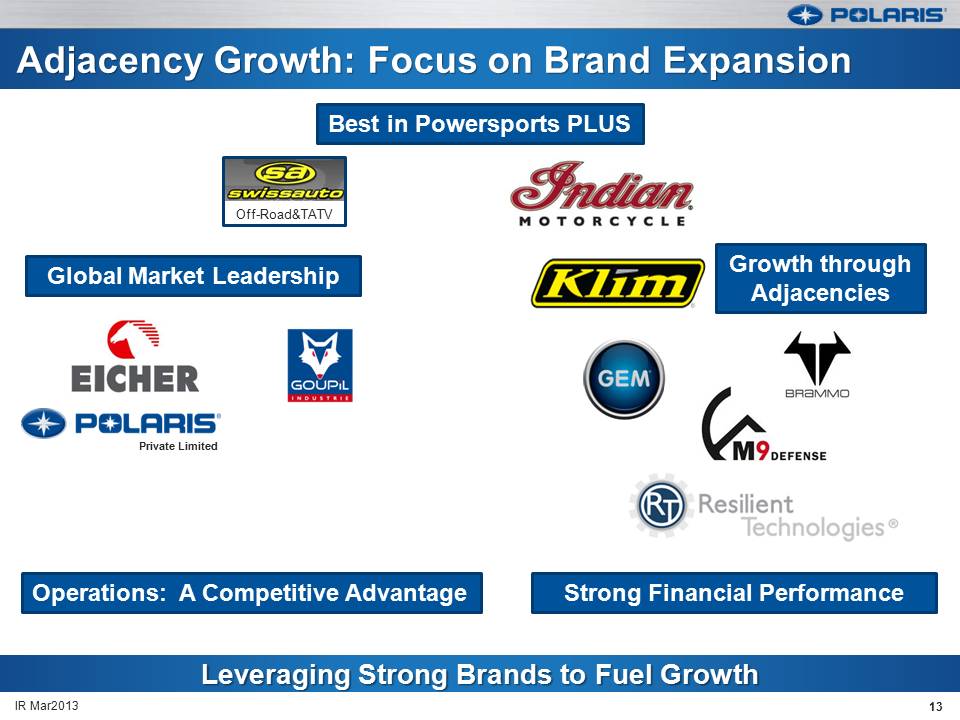
Leveraging Strong Brands to Fuel Growth 13 Adjacency Growth: Focus on Brand Expansion IR Mar2013 (Gp:) Off-Road&TATV Best in Powersports PLUS Global Market Leadership Growth through Adjacencies Strong Financial Performance Operations: A Competitive Advantage (Gp:) Private Limited
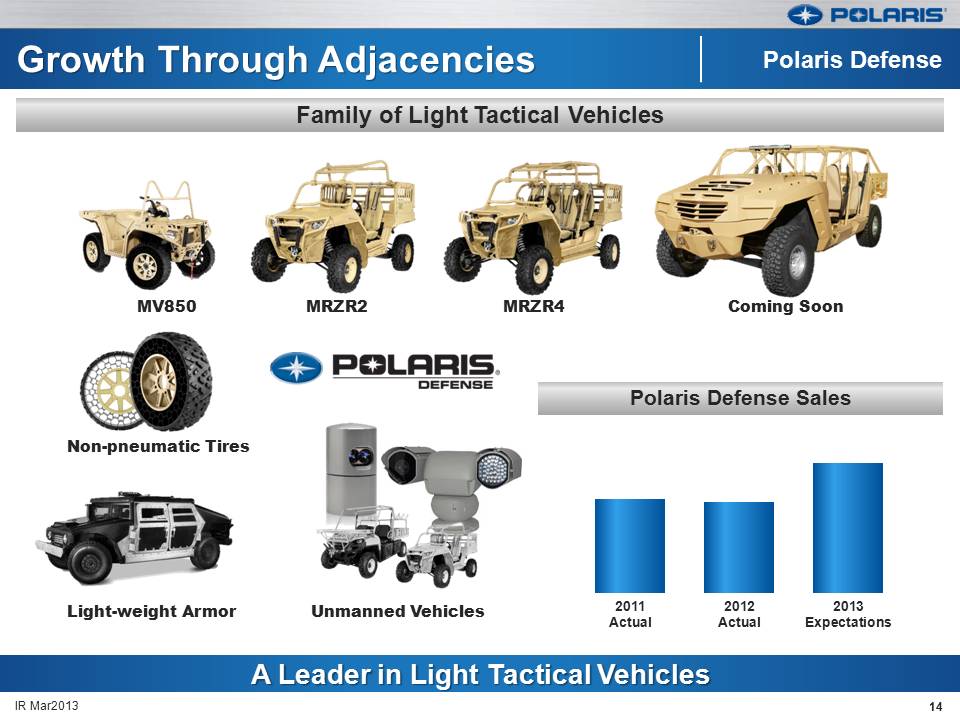
14 IR Mar2013 Growth Through Adjacencies Family of Light Tactical Vehicles Polaris Defense Sales A Leader in Light Tactical Vehicles Unmanned Vehicles Light-weight Armor Non-pneumatic Tires MV850 MRZR2 MRZR4 Coming Soon (Gp:) Polaris Defense
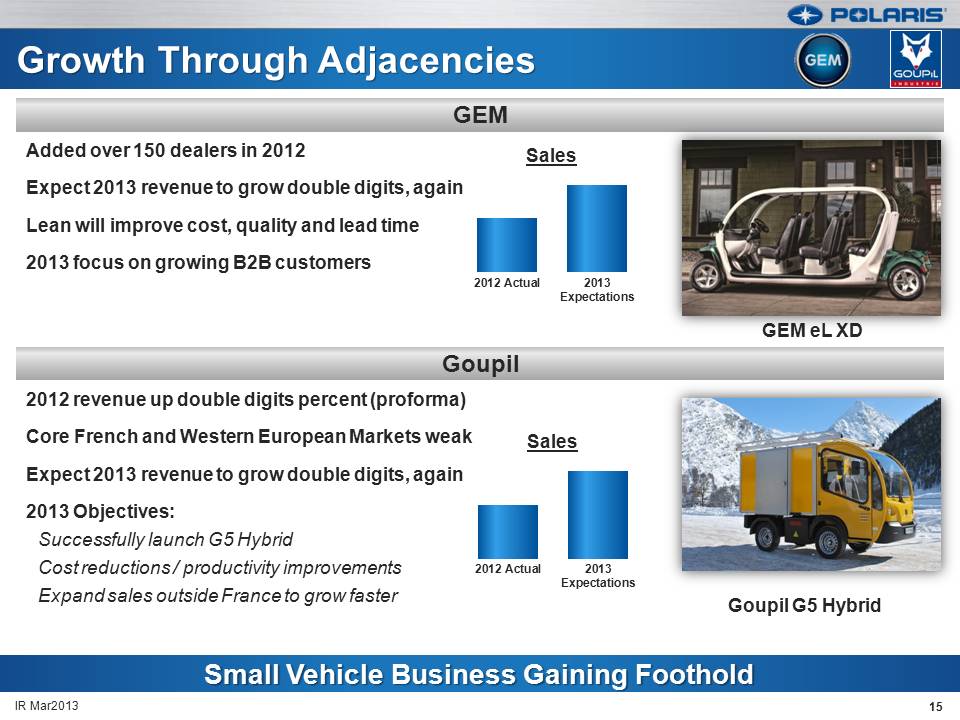
15 IR Mar2013 Growth Through Adjacencies Goupil Small Vehicle Business Gaining Foothold Added over 150 dealers in 2012Expect 2013 revenue to grow double digits, again Lean will improve cost, quality and lead time2013 focus on growing B2B customers 2012 revenue up double digits percent (proforma) Core French and Western European Markets weakExpect 2013 revenue to grow double digits, again2013 Objectives:Successfully launch G5 HybridCost reductions / productivity improvementsExpand sales outside France to grow faster GEM GEM eL XD Goupil G5 Hybrid
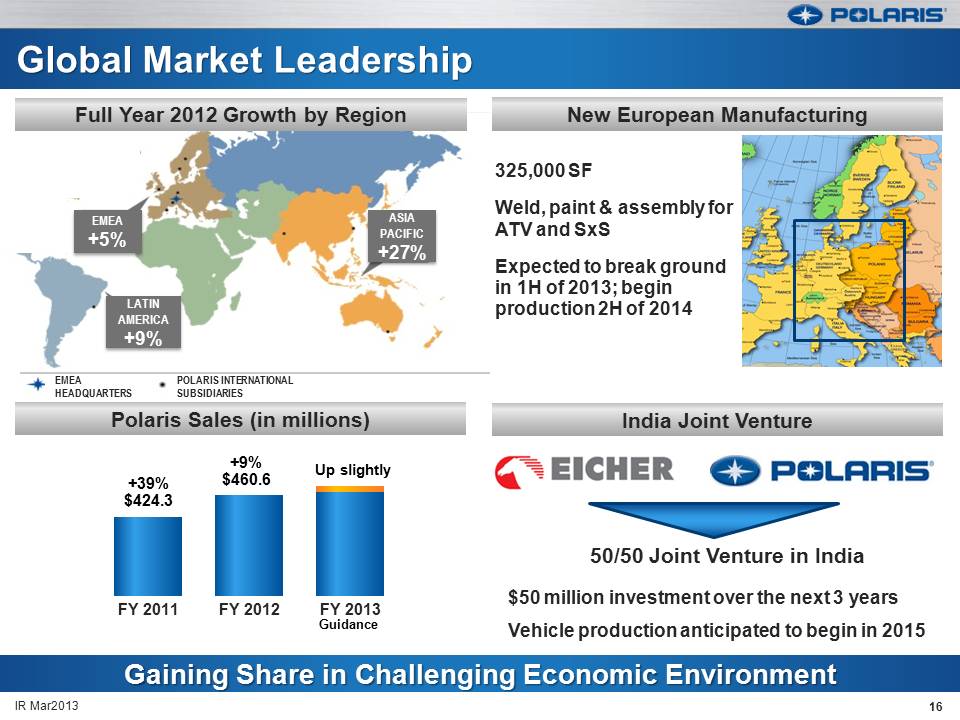
(Gp:) EMEA+5% (Gp:) LATIN AMERICA+9% (Gp:) ASIA PACIFIC+27% (Gp:) EMEAHEADQUARTERS (Gp:) POLARIS INTERNATIONAL SUBSIDIARIES (Gp:) Global Market Leadership Polaris Sales (in millions) New European Manufacturing Gaining Share in Challenging Economic Environment Up slightly +39%$424.3 Guidance India Joint Venture +9%$460.6 50/50 Joint Venture in India $50 million investment over the next 3 years Vehicle production anticipated to begin in 2015 Full Year 2012 Growth by Region 325,000 SFWeld, paint & assembly for ATV and SxSExpected to break ground in 1H of 2013; begin production 2H of 2014 16 IR Mar2013
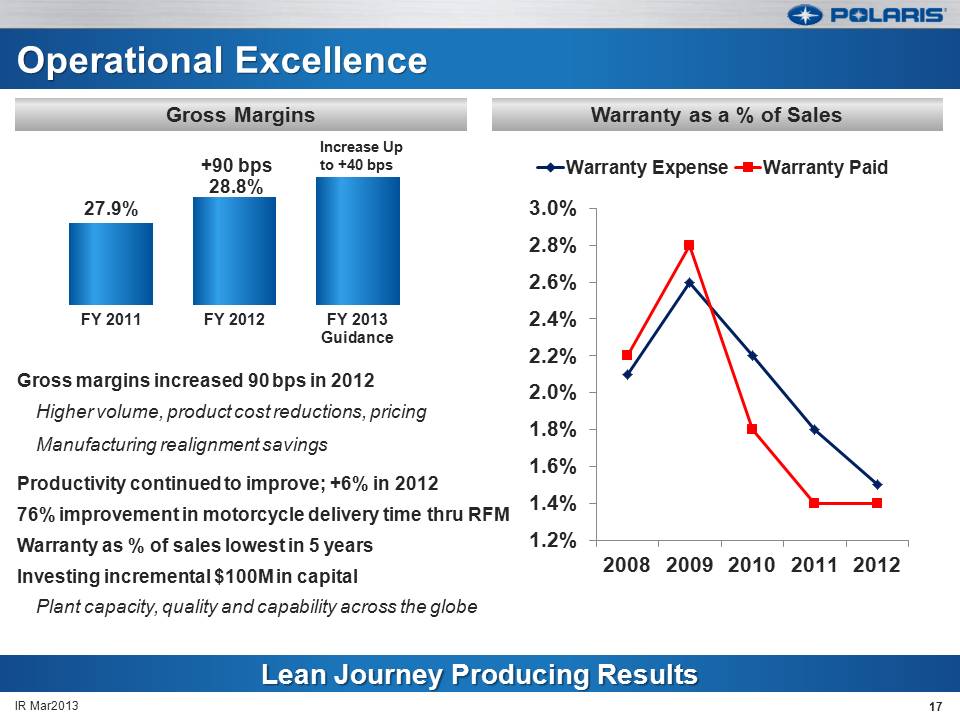
Operational Excellence Gross margins increased 90 bps in 2012Higher volume, product cost reductions, pricingManufacturing realignment savings Productivity continued to improve; +6% in 201276% improvement in motorcycle delivery time thru RFMWarranty as % of sales lowest in 5 yearsInvesting incremental $100M in capitalPlant capacity, quality and capability across the globe 17 IR Mar2013 Lean Journey Producing Results Warranty as a % of Sales Gross Margins Increase Upto +40 bps 3.0 2.8 2.6 2.4 2.2 2.0 1.8 1.6 1.4 1.2 2008 2009 2010 2011 2012
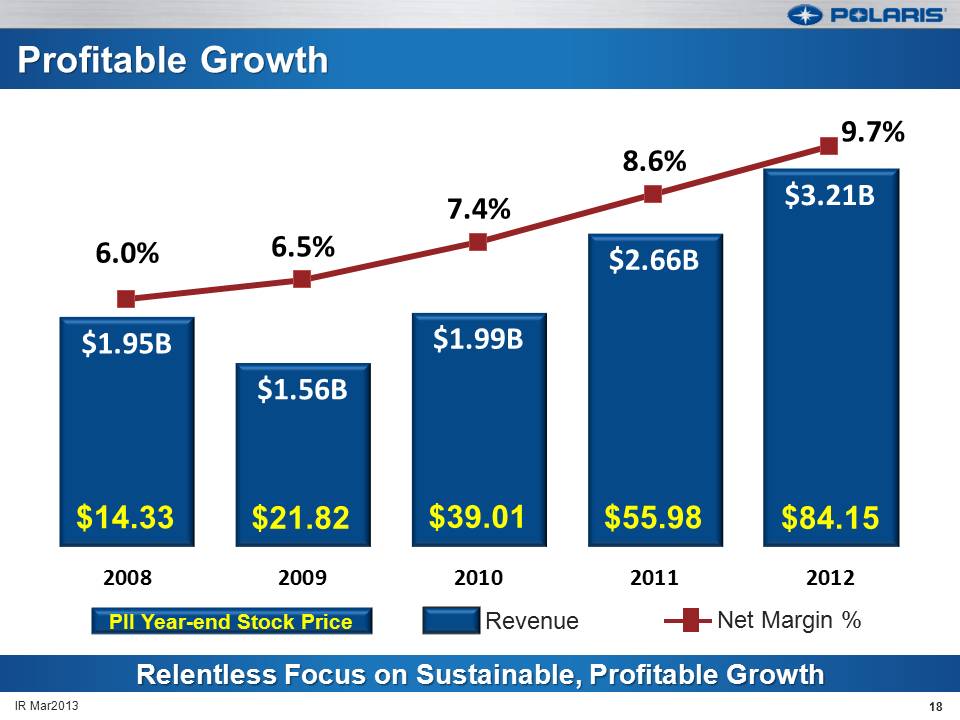
Profitable Growth 18 IR Mar2013 Relentless Focus on Sustainable, Profitable Growth PII Year-end Stock Price Revenue Net Margin % $14.33 $21.82 $39.01 $55.98 $84.15
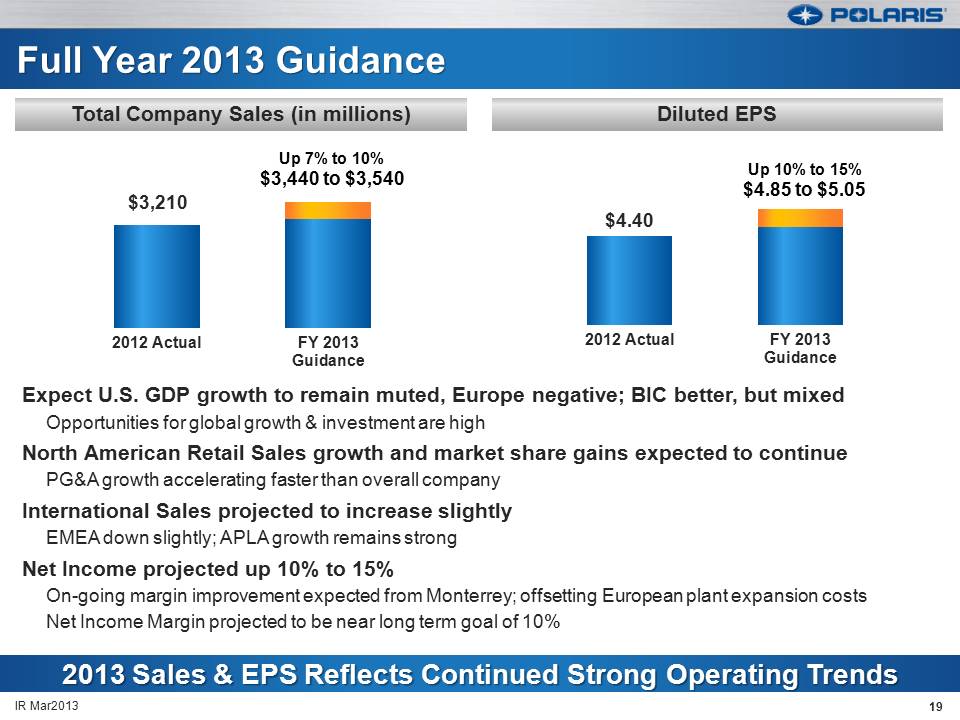
Full Year 2013 Guidance Expect U.S. GDP growth to remain muted, Europe negative; BIC better, but mixedOpportunities for global growth & investment are highNorth American Retail Sales growth and market share gains expected to continuePG&A growth accelerating faster than overall companyInternational Sales projected to increase slightlyEMEA down slightly; APLA growth remains strongNet Income projected up 10% to 15%On-going margin improvement expected from Monterrey; offsetting European plant expansion costsNet Income Margin projected to be near long term goal of 10% 19 IR Mar2013 2013 Sales & EPS Reflects Continued Strong Operating Trends Diluted EPS Total Company Sales (in millions) Up 7% to 10%$3,440 to $3,540 Up 10% to 15%$4.85 to $5.05
20 Thank youQ & A IR Mar2013
Appendices 2012 SummaryN.A. Retail Sales – 2012 N.A. Dealer Inventory Trends – 20122012 Full Year Guidance Detail2012 Full Year Gross Margin GuidanceBalance Sheet and Liquidity Profile Product InnovationPolaris / Eicher Joint VentureR&D Facility ExpansionCredit ArrangementsSafe Harbor Statement 21 IR Mar2013
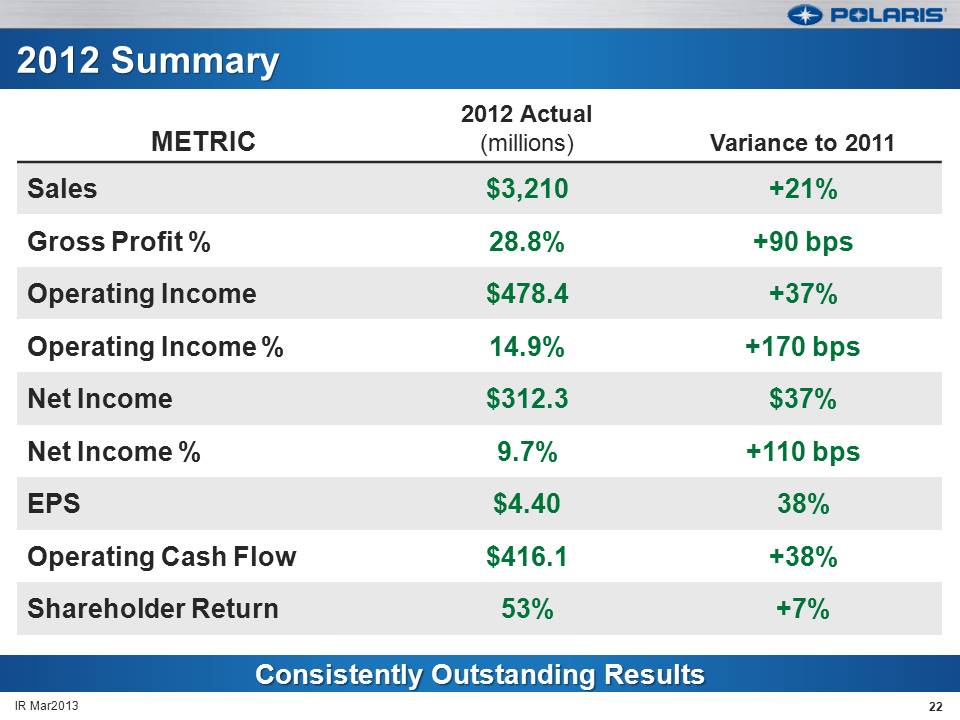
Consistently Outstanding Results 2012 Summary 22 IR Mar2013 Metric Sales Gross Profit Operating Income Net Income EPS Operating Cash Flow Shareholder Return $3,210 28.8 $478.4 $312.3 $4.40 $416.1 9.7 14.9 53 +21 +90 bps +37 +170 +110 +38 +7
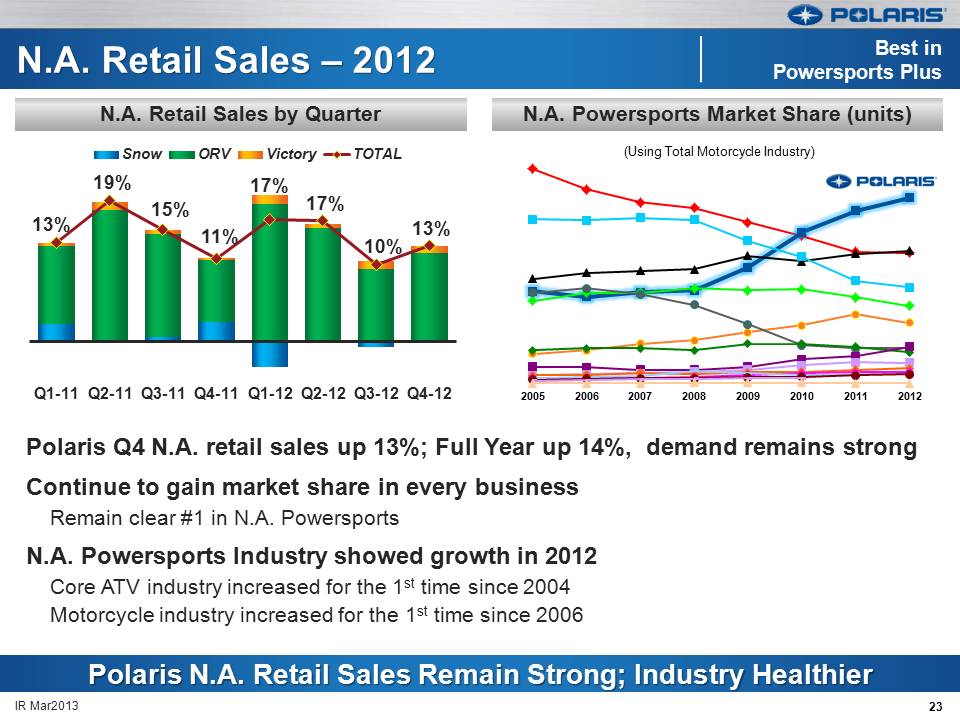
N.A. Retail Sales – 2012 23 IR Mar2013 Polaris N.A. Retail Sales Remain Strong; Industry Healthier N.A. Powersports Market Share (units) N.A. Retail Sales by Quarter (Gp:) Best in Powersports Plus Polaris Q4 N.A. retail sales up 13%; Full Year up 14%, demand remains strongContinue to gain market share in every businessRemain clear #1 in N.A. PowersportsN.A. Powersports Industry showed growth in 2012Core ATV industry increased for the 1st time since 2004Motorcycle industry increased for the 1st time since 2006
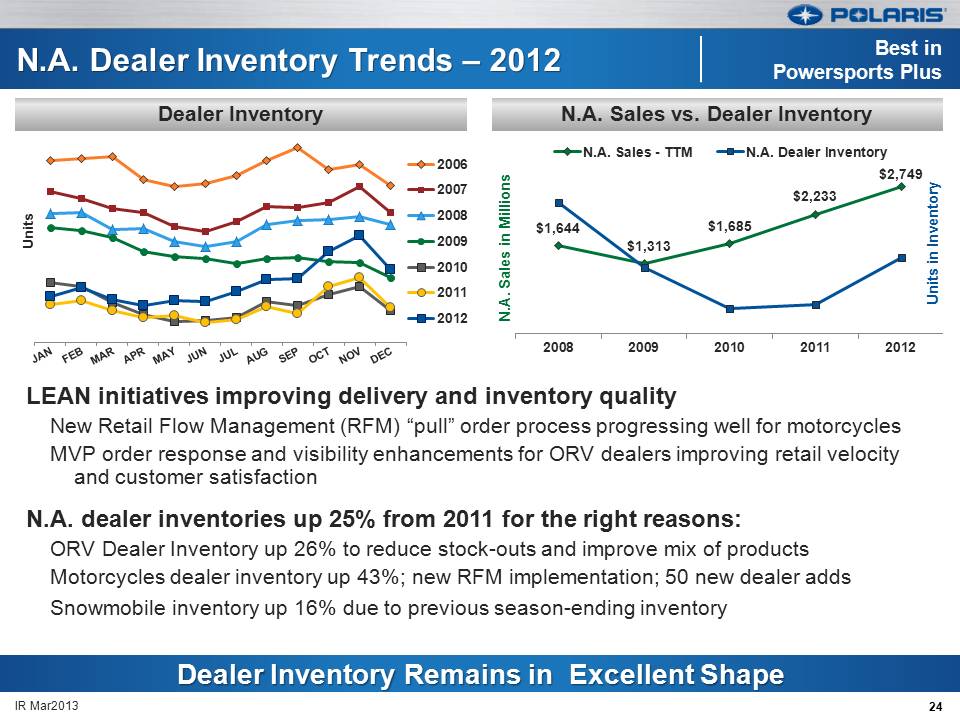
N.A. Dealer Inventory Trends – 2012 24 IR Mar2013 Dealer Inventory Remains in Excellent Shape N.A. Sales vs. Dealer Inventory Dealer Inventory (Gp:) Best in Powersports Plus LEAN initiatives improving delivery and inventory qualityNew Retail Flow Management (RFM) “pull” order process progressing well for motorcyclesMVP order response and visibility enhancements for ORV dealers improving retail velocity and customer satisfactionN.A. dealer inventories up 25% from 2011 for the right reasons:ORV Dealer Inventory up 26% to reduce stock-outs and improve mix of productsMotorcycles dealer inventory up 43%; new RFM implementation; 50 new dealer addsSnowmobile inventory up 16% due to previous season-ending inventory
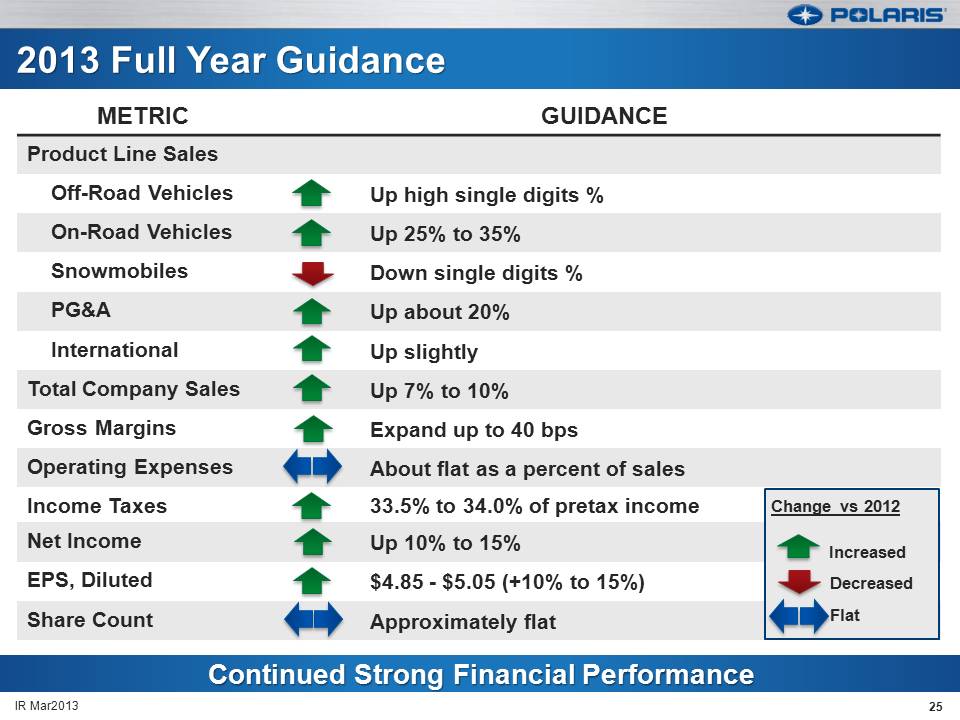
Continued Strong Financial Performance 2013 Full Year Guidance Change vs 2012 Increased Decreased Flat 25 IR Mar2013
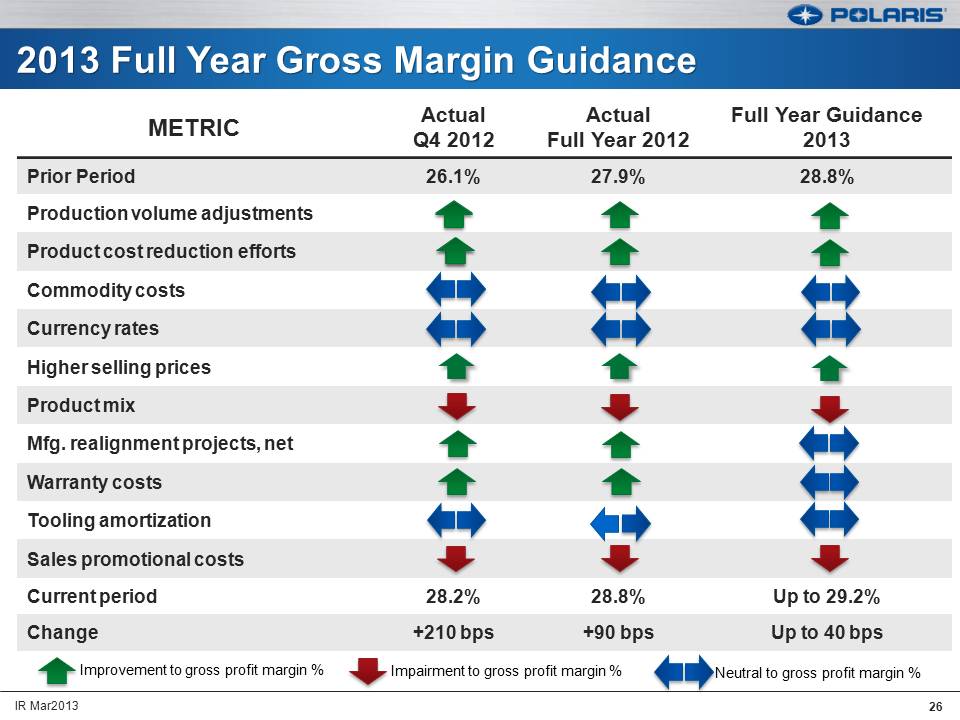
2013 Full Year Gross Margin Guidance (Gp:) Improvement to gross profit margin % (Gp:) Impairment to gross profit margin % (Gp:) Neutral to gross profit margin % 26 IR Mar2013
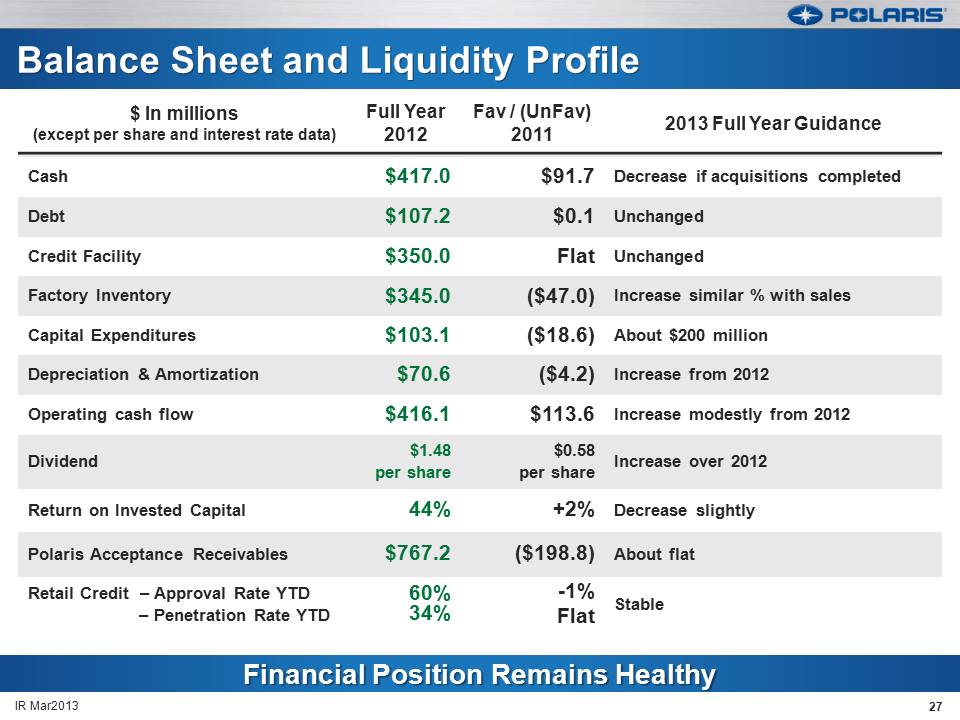
Financial Position Remains Healthy Balance Sheet and Liquidity Profile 27 IR Mar 2013
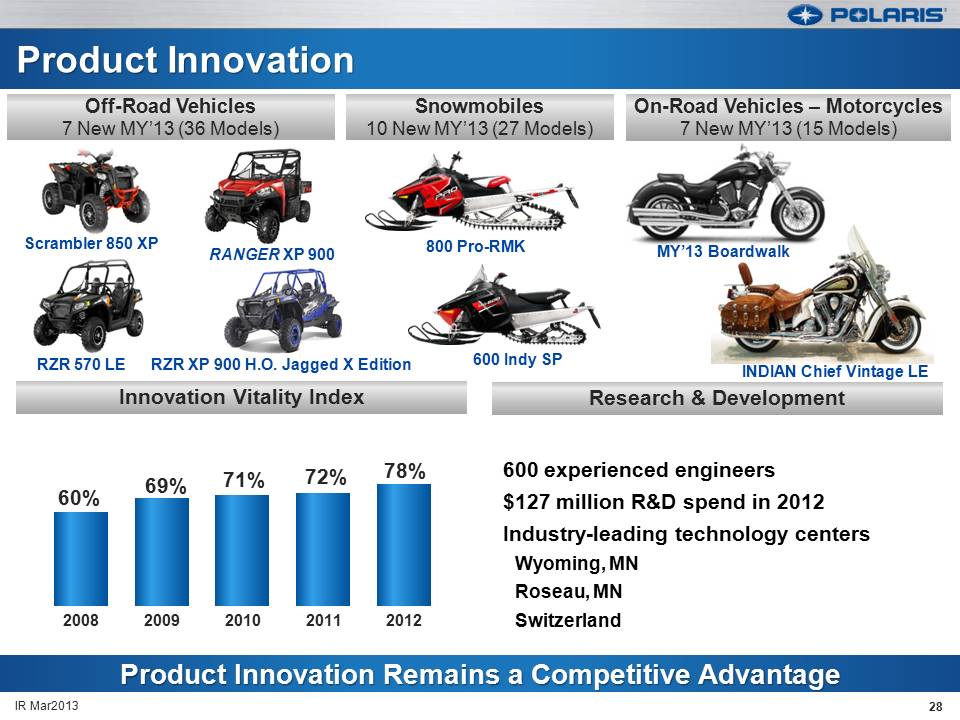
Product Innovation 28 IR Mar2013 Research & Development Innovation Vitality Index Off-Road Vehicles7 New MY’13 (36 Models) Product Innovation Remains a Competitive Advantage Scrambler 850 XP RANGER XP 900 RZR 570 LE Snowmobiles10 New MY’13 (27 Models) 800 Pro-RMK MY’13 Boardwalk INDIAN Chief Vintage LE On-Road Vehicles – Motorcycles7 New MY’13 (15 Models) 600 Indy SP 600 experienced engineers $127 million R&D spend in 2012Industry-leading technology centersWyoming, MNRoseau, MNSwitzerland RZR XP 900 H.O. Jagged X Edition
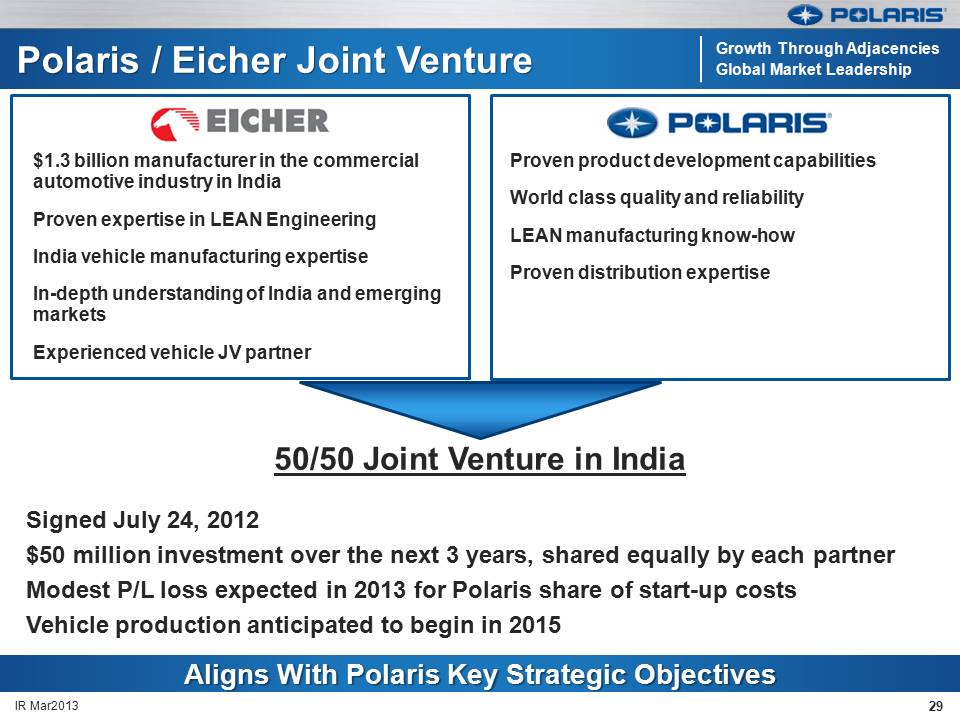
Polaris / Eicher Joint Venture 29 IR Mar2013 Aligns With Polaris Key Strategic Objectives Proven product development capabilitiesWorld class quality and reliability LEAN manufacturing know-howProven distribution expertise (Gp:) Growth Through AdjacenciesGlobal Market Leadership Signed July 24, 2012$50 million investment over the next 3 years, shared equally by each partnerModest P/L loss expected in 2013 for Polaris share of start-up costsVehicle production anticipated to begin in 2015 $1.3 billion manufacturer in the commercial automotive industry in India Proven expertise in LEAN EngineeringIndia vehicle manufacturing expertiseIn-depth understanding of India and emerging marketsExperienced vehicle JV partner 50/50 Joint Venture in India
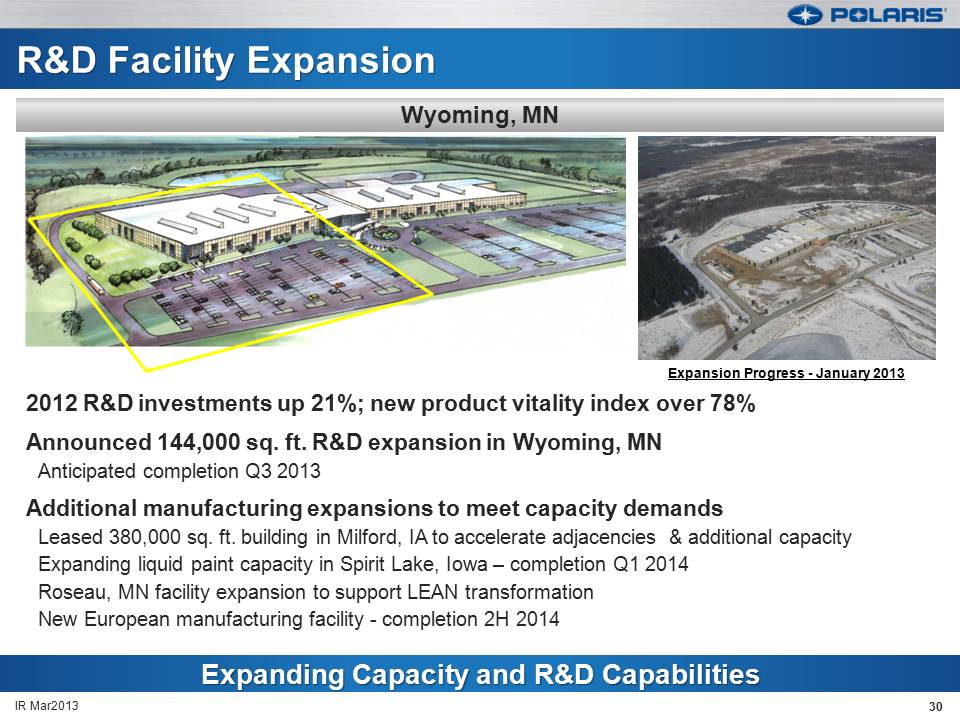
30 IR Mar2013 R&D Facility Expansion Expanding Capacity and R&D Capabilities Wyoming, MN 2012 R&D investments up 21%; new product vitality index over 78%Announced 144,000 sq. ft. R&D expansion in Wyoming, MNAnticipated completion Q3 2013Additional manufacturing expansions to meet capacity demandsLeased 380,000 sq. ft. building in Milford, IA to accelerate adjacencies & additional capacityExpanding liquid paint capacity in Spirit Lake, Iowa – completion Q1 2014Roseau, MN facility expansion to support LEAN transformationNew European manufacturing facility - completion 2H 2014 Expansion Progress - January 2013
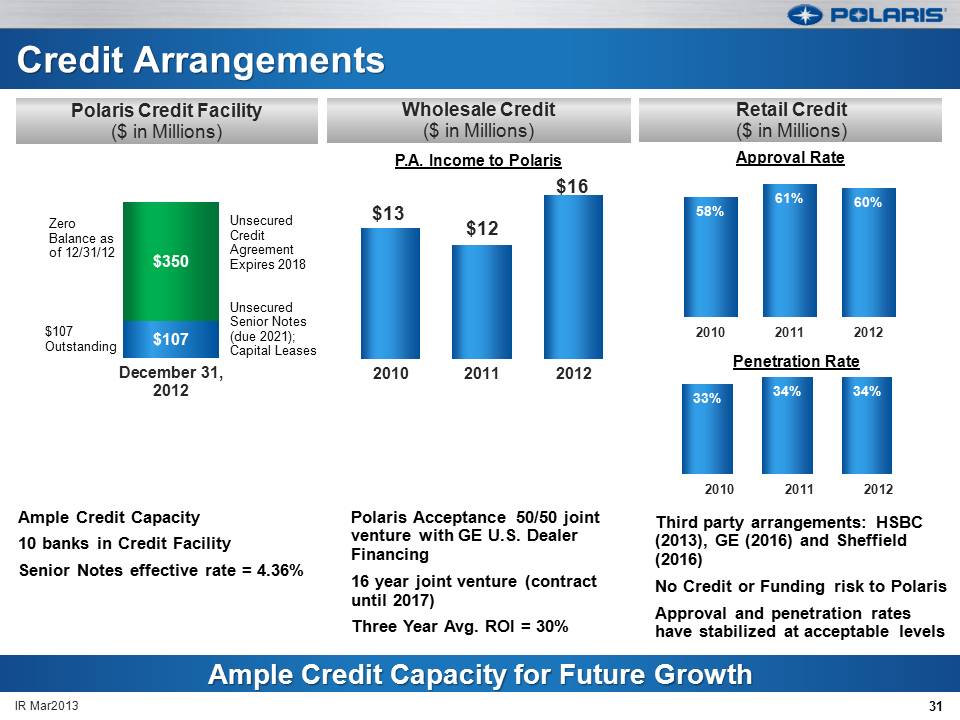
Unsecured Credit Agreement Expires 2018Unsecured Senior Notes(due 2021); Capital Leases Credit Arrangements 31 Polaris Credit Facility ($ in Millions) Ample Credit Capacity for Future Growth Retail Credit($ in Millions) Wholesale Credit($ in Millions) Ample Credit Capacity10 banks in Credit FacilitySenior Notes effective rate = 4.36% $107Outstanding Zero Balance as of 12/31/12 P.A. Income to Polaris Polaris Acceptance 50/50 joint venture with GE U.S. Dealer Financing16 year joint venture (contract until 2017)Three Year Avg. ROI = 30% Third party arrangements: HSBC (2013), GE (2016) and Sheffield (2016)No Credit or Funding risk to PolarisApproval and penetration rates have stabilized at acceptable levels Penetration Rate Approval Rate IR Mar2013
Safe Harbor Except for historical information contained herein, the matters set forth in this document, including but not limited to management’s expectations regarding 2013 sales, shipments, margins, net income, cash flow, and manufacturing realignment project transition costs and savings, are forward-looking statements that involve certain risks and uncertainties that could cause actual results to differ materially from those forward-looking statements. Potential risks and uncertainties include such factors as product offerings, promotional activities and pricing strategies by competitors; manufacturing realignment transition costs; acquisition integration costs; warranty expenses; impact of changes in Polaris stock prices on incentive compensation; foreign currency exchange rate fluctuations; environmental and product safety regulatory activity; effects of weather; commodity costs; uninsured product liability claims; uncertainty in the retail and wholesale credit markets; changes in tax policy and overall economic conditions, including inflation, consumer confidence and spending and relationships with dealers and suppliers. Investors are also directed to consider other risks and uncertainties discussed in our 2011 annual report and Form 10-K filed by the Company with the Securities and Exchange Commission. The Company does not undertake any duty to any person to provide updates to its forward-looking statements.The data source for retail sales figures included in this presentation is registration information provided by Polaris dealers in North America and compiled by the Company or Company estimates. The Company must rely on information that its dealers supply concerning retail sales, and other retail sales data sources and this information is subject to revision. 32 IR Mar2013