Attached files
| file | filename |
|---|---|
| 8-K - FORM 8-K - PEPCO HOLDINGS LLC | t75723_8k.htm |
| EX-99.1 - EXHIBIT 99.1 - PEPCO HOLDINGS LLC | ex99-1.htm |
Exhibit 99.2
 |
Fourth Quarter 2012 Earnings Call
March 1, 2013
|
 |
Safe Harbor Statement/Regulation G Information
Some of the statements contained in today’s presentation with respect to Pepco Holdings, Pepco, Delmarva Power and Atlantic City Electric, including each of their respective subsidiaries, are forward-looking statements within the meaning of the U.S. federal securities laws and are subject to the safe harbor created thereby under the Private Securities Litigation Reform Act of 1995. These statements include declarations regarding the intents, beliefs and current expectations of one or more of PHI, Pepco, DPL or ACE (each a Reporting Company) or their subsidiaries. In some cases you can identify forward-looking statements by terminology such as “may,” “might,” “will,” “should,” “could,” “expects,” “intends,” “assumes,” “seeks to,” “plans,” “anticipates,” “believes,” “projects,” “estimates,” “predicts,” “potential,” “future,” “goal,” “objective,” or “continue”, the negative or other variations of such terms, or comparable terminology, or by discussions of strategy that involve risks and uncertainties. Forward-looking statements involve estimates, assumptions, known and unknown risks, uncertainties and other factors that may cause one or more Reporting Companies’ or their subsidiaries’ actual results, levels of activity, performance or achievements to be materially different from any future results, levels of activity, performance or achievements expressed or implied by such forward-looking statements. Therefore, forward-looking statements are not guarantees or assurances of future performance, and actual results could differ materially from those indicated by the forward-looking statements. These forward-looking statements are qualified in their entirety by, and should be read together with, the risk factors included in the “Risk Factors” section and other statements in each Reporting Company’s annual report on Form 10-K for the year ended December 31, 2012 filed on March 1, 2013 and other Securities and Exchange Commission (SEC) filings, and investors should refer to these risk factor sections and such other statements. All such factors are difficult to predict, contain uncertainties, are beyond each Reporting Company’s or its subsidiaries’ control and may cause actual results to differ materially from those contained in the forward-looking statements. Any forward-looking statements speak only as to the date of this presentation and none of the Reporting Companies undertakes an obligation to update any forward-looking statements to reflect events or circumstances after the date on which such statements are made or to reflect the occurrence of unanticipated events. New factors emerge from time to time, and it is not possible for a Reporting Company to predict all such factors. Furthermore, it may not be possible to assess the impact of any such factor on such Reporting Company’s or its subsidiaries’ business (viewed independently or together with the business or businesses of some or all of the other Reporting Companies or their subsidiaries) or the extent to which any factor, or combination of factors, may cause results to differ materially from those contained in any forward-looking statement. Any specific factors that may be provided should not be construed as exhaustive. PHI routinely makes available important information with respect to each Reporting Company, including copies of each Reporting Company’s annual, periodic and current reports filed or furnished with the SEC under the Securities Exchange Act of 1934, on PHI’s website at http://www.pepcoholdings.com/investors. PHI recognizes its website as a key channel of distribution to reach public investors and as a means of disclosing material non-public information to comply with each Reporting Company’s disclosure obligations under SEC Regulation FD. PHI discloses net income from continuing operations and related per share data (both as historical information and earnings guidance) excluding certain items (non-GAAP financial information) because management believes that these items are not representative of PHI’s ongoing business operations. Management uses this information, and believes that such information is useful to investors, in evaluating PHI’s period-over-period performance. The inclusion of this disclosure is intended to complement, and should not be considered as an alternative to, PHI’s reported net income from continuing operations and related per share data in accordance with accounting principles generally accepted in the United States (GAAP).
2
|
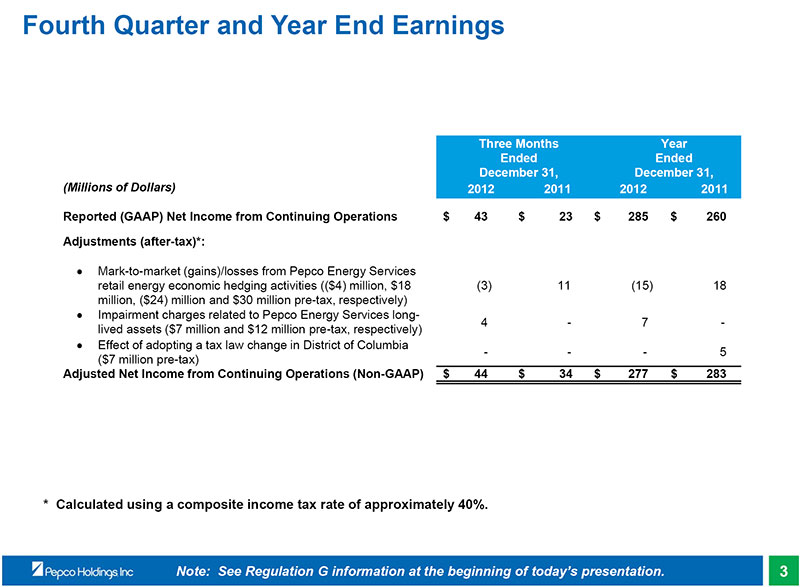 |
Fourth Quarter and Year End Earnings
Three Months Year Ended Ended December 31, December 31,
(Millions of Dollars) 2012 2011 2012 2011 Reported (GAAP) Net Income from Continuing Operations $ 43 $ 23 $ 285 $ 260
Adjustments (after-tax)*:
Mark-to-market (gains)/losses from Pepco Energy Services retail energy economic hedging activities (($4) million, $18 (3) 11 (15) 18 million, ($24) million and $30 million pre-tax, respectively) Impairment charges related to Pepco Energy Services long-
4 - 7 -lived assets ($7 million and $12 million pre-tax, respectively) Effect of adopting a tax law change in District of Columbia
- - - 5 ($7 million pre-tax)
Adjusted Net Income from Continuing Operations (Non-GAAP) $ 44 $ 34 $ 277 $ 283
* Calculated using a composite income tax rate of approximately 40%.
Note: See Regulation G information at the beginning of today’s presentation. 3
|
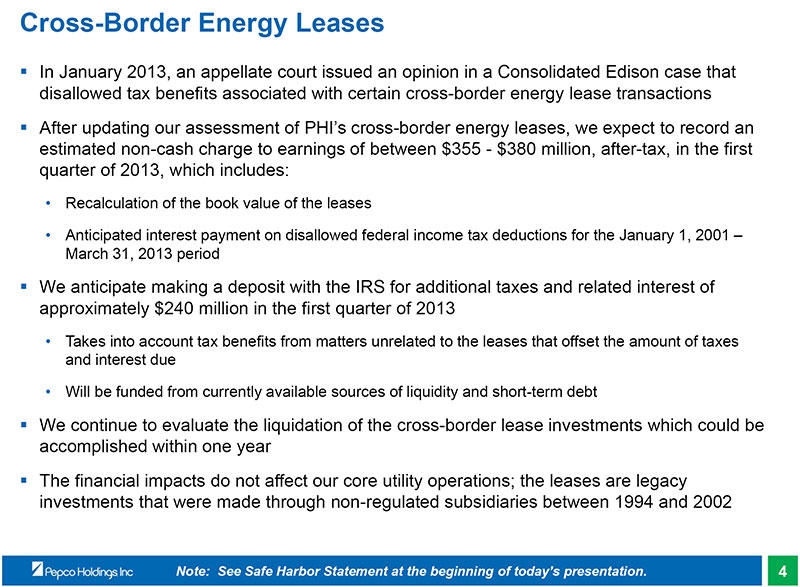 |
Cross-Border Energy Leases
• In January 2013, an appellate court issued an opinion in a Consolidated Edison case that disallowed tax benefits associated with certain cross-border energy lease transactions
• After updating our assessment of PHI’s cross-border energy leases, we expect to record an estimated non-cash charge to earnings of between $355 - $380 million, after-tax, in the first quarter of 2013, which includes:
• Recalculation of the book value of the leases
• Anticipated interest payment on disallowed federal income tax deductions for the January 1, 2001 –March 31, 2013 period
• We anticipate making a deposit with the IRS for additional taxes and related interest of approximately $240 million in the first quarter of 2013
• Takes into account tax benefits from matters unrelated to the leases that offset the amount of taxes and interest due
• Will be funded from currently available sources of liquidity and short-term debt
• We continue to evaluate the liquidation of the cross-border lease investments which could be accomplished within one year
• The financial impacts do not affect our core utility operations; the leases are legacy investments that were made through non-regulated subsidiaries between 1994 and 2002
Note: See Safe Harbor Statement at the beginning of today’s presentation. 4
|
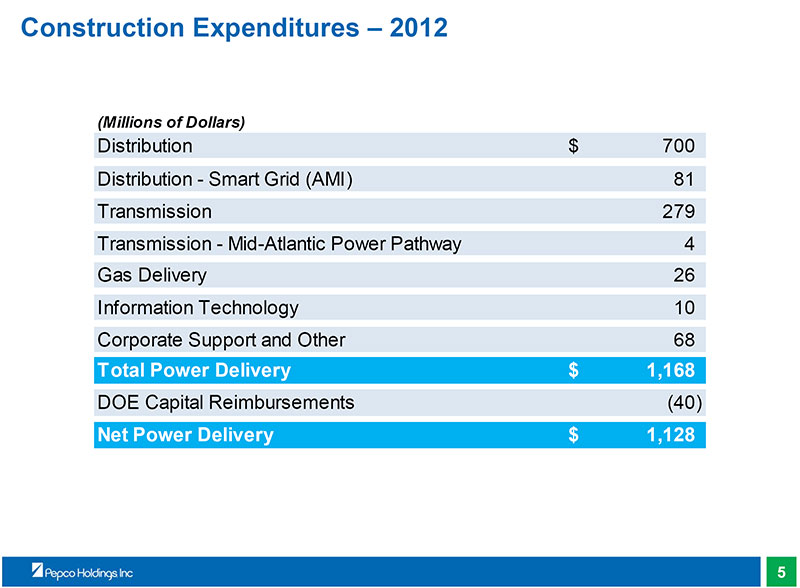 |
Construction Expenditures – 2012
(Millions of Dollars)
Distribution $ 700 Distribution - Smart Grid (AMI) 81 Transmission 279 Transmission - Mid-Atlantic Power Pathway 4 Gas Delivery 26 Information Technology 10 Corporate Support and Other 68
Total Power Delivery $ 1,168
DOE Capital Reimbursements (40)
Net Power Delivery $ 1,128
5
|
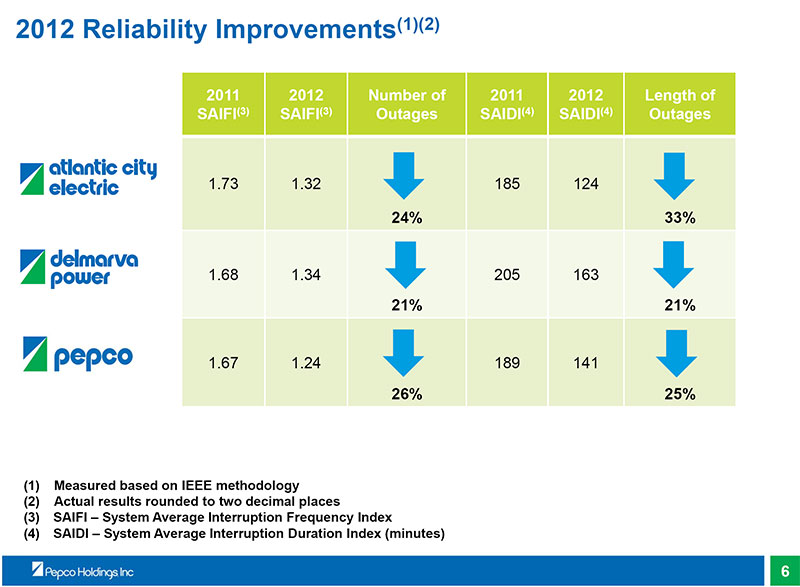 |
2012 Reliability Improvements(1)(2)
2011 2012 Number of 2011 2012 Length of SAIFI(3) SAIFI(3) Outages SAIDI(4) SAIDI(4) Outages
1.73 1.32 185 124
24% 33%
1.68 1.34 205 163
21% 21%
1.67 1.24 189 141
26% 25%
(1) Measured based on IEEE methodology (2) Actual results rounded to two decimal places (3) SAIFI – System Average Interruption Frequency Index (4) SAIDI – System Average Interruption Duration Index (minutes)
6
|
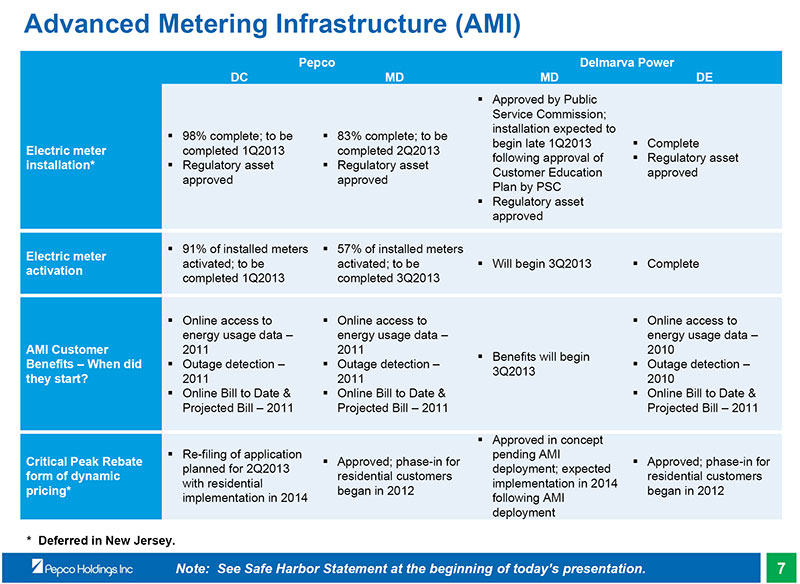 |
Advanced Metering Infrastructure (AMI)
Pepco Delmarva Power DC MD MD DE
Approved by Public Service Commission; installation expected to 98% complete; to be 83% complete; to be begin late 1Q2013 Complete Electric meter completed 1Q2013 completed 2Q2013 following approval of Regulatory asset installation* Regulatory asset Regulatory asset Customer Education approved approved approved Plan by PSC
Regulatory asset approved
91% of installed meters 57% of installed meters
Electric meter activated; to be activated; to be Will begin 3Q2013 Complete activation completed 1Q2013 completed 3Q2013
Online access to Online access to Online access to energy usage data – energy usage data – energy usage data –
AMI Customer 2011 2011 2010
Benefits will begin
Benefits – When did Outage detection – Outage detection – Outage detection –3Q2013 they start? 2011 2011 2010 Online Bill to Date & Online Bill to Date & Online Bill to Date & Projected Bill – 2011 Projected Bill – 2011 Projected Bill – 2011
Approved in concept Re-filing of application pending AMI
Critical Peak Rebate Approved; phase-in for Approved; phase-in for planned for 2Q2013 deployment; expected form of dynamic residential customers residential customers with residential implementation in 2014 pricing* began in 2012 began in 2012 implementation in 2014 following AMI deployment
* Deferred in New Jersey.
Note: See Safe Harbor Statement at the beginning of today’s presentation. 7
|
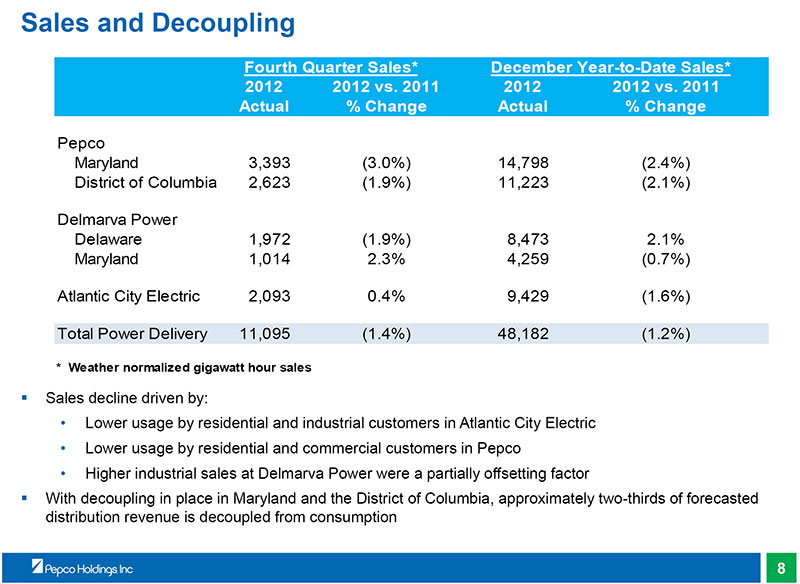 |
Sales and Decoupling
Fourth Quarter Sales* December Year-to-Date Sales* 2012 2012 vs. 2011 2012 2012 vs. 2011 Actual % Change Actual % Change
Pepco
Maryland 3,393 (3.0%) 14,798 (2.4%) District of Columbia 2,623 (1.9%) 11,223 (2.1%)
Delmarva Power
Delaware 1,972 (1.9%) 8,473 2.1% Maryland 1,014 2.3% 4,259 (0.7%)
Atlantic City Electric 2,093 0.4% 9,429 (1.6%)
Total Power Delivery 11,095 (1.4%) 48,182 (1.2%)
* Weather normalized gigawatt hour sales
• Sales decline driven by:
• Lower usage by residential and industrial customers in Atlantic City Electric
• Lower usage by residential and commercial customers in Pepco
• Higher industrial sales at Delmarva Power were a partially offsetting factor
• With decoupling in place in Maryland and the District of Columbia, approximately two-thirds of forecasted distribution revenue is decoupled from consumption
8
|
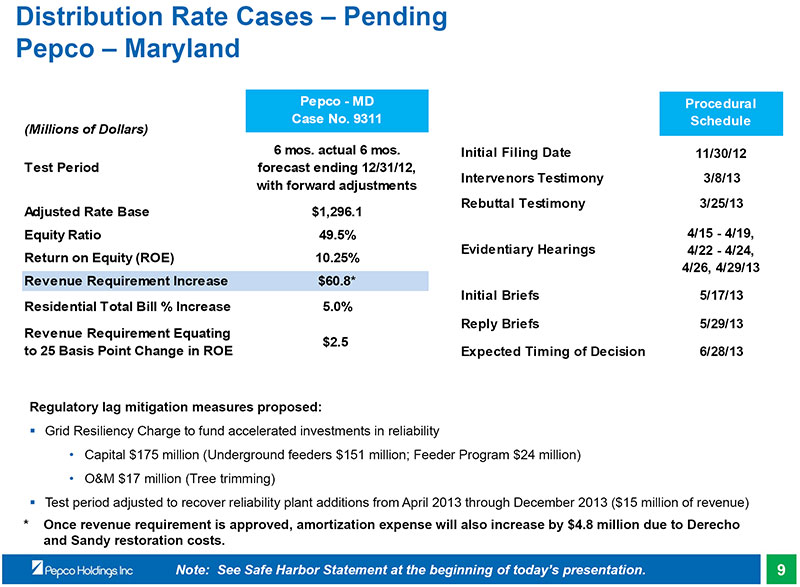 |
Distribution Rate Cases – Pending Pepco – Maryland
Pepco - MD Procedural Case No. 9311 Schedule
(Millions of Dollars)
6 mos. actual 6 mos. Initial Filing Date 11/30/12 Test Period forecast ending 12/31/12, Intervenors Testimony 3/8/13 with forward adjustments Rebuttal Testimony 3/25/13 Adjusted Rate Base $1,296.1 Equity Ratio 49.5% 4/15 - 4/19, Evidentiary Hearings 4/22 - 4/24, Return on Equity (ROE) 10.25% 4/26, 4/29/13 Revenue Requirement Increase $60.8* Initial Briefs 5/17/13 Residential Total Bill % Increase 5.0% Reply Briefs 5/29/13 Revenue Requirement Equating $2.5 to 25 Basis Point Change in ROE Expected Timing of Decision 6/28/13
Regulatory lag mitigation measures proposed:
• Grid Resiliency Charge to fund accelerated investments in reliability
• Capital $175 million (Underground feeders $151 million; Feeder Program $24 million)
• O&M $17 million (Tree trimming)
• Test period adjusted to recover reliability plant additions from April 2013 through December 2013 ($15 million of revenue)
* Once revenue requirement is approved, amortization expense will also increase by $4.8 million due to Derecho and Sandy restoration costs.
Note: See Safe Harbor Statement at the beginning of today’s presentation. 9
|
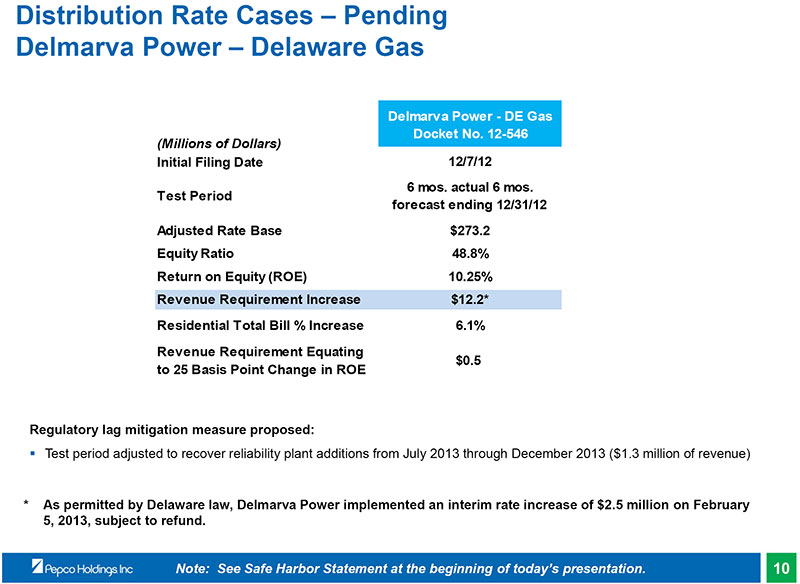 |
Distribution Rate Cases – Pending Delmarva Power – Delaware Gas
Delmarva Power - DE Gas Docket No. 12-546
(Millions of Dollars)
Initial Filing Date 12/7/12 6 mos. actual 6 mos. Test Period forecast ending 12/31/12 Adjusted Rate Base $273.2 Equity Ratio 48.8% Return on Equity (ROE) 10.25% Revenue Requirement Increase $12.2* Residential Total Bill % Increase 6.1% Revenue Requirement Equating $0.5 to 25 Basis Point Change in ROE
Regulatory lag mitigation measure proposed:
• Test period adjusted to recover reliability plant additions from July 2013 through December 2013 ($1.3 million of revenue)
* As permitted by Delaware law, Delmarva Power implemented an interim rate increase of $2.5 million on February 5, 2013, subject to refund.
Note: See Safe Harbor Statement at the beginning of today’s presentation. 10
|
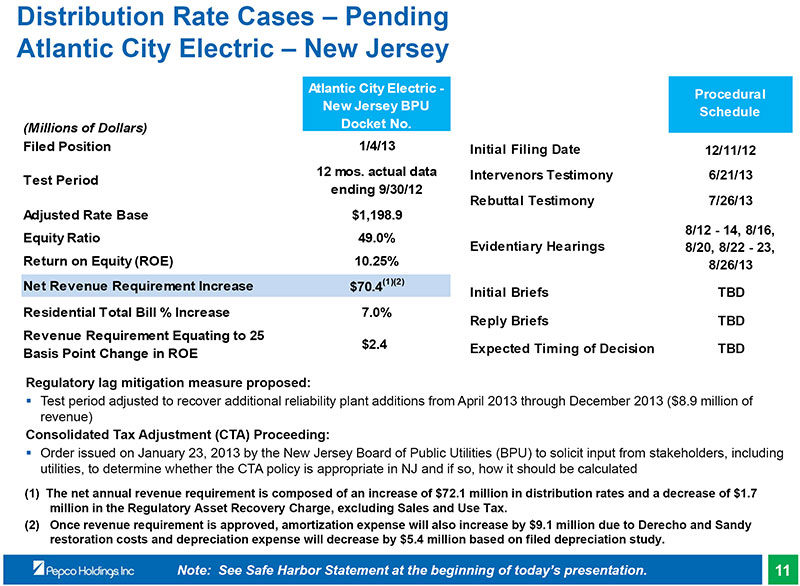 |
Distribution Rate Cases – Pending Atlantic City Electric – New Jersey
Atlantic City Electric -
Procedural New Jersey BPU Schedule
(Millions of Dollars) Docket No.
Filed Position 1/4/13 Initial Filing Date 12/11/12 12 mos. actual data Intervenors Testimony 6/21/13 Test Period ending 9/30/12 Rebuttal Testimony 7/26/13 Adjusted Rate Base $1,198.9 8/12 - 14, 8/16, Equity Ratio 49.0% Evidentiary Hearings 8/20, 8/22 - 23, Return on Equity (ROE) 10.25% 8/26/13 Net Revenue Requirement Increase $70.4(1)(2) Initial Briefs TBD Residential Total Bill % Increase 7.0% Reply Briefs TBD Revenue Requirement Equating to 25 $2.4 Expected Timing of Decision TBD Basis Point Change in ROE
Regulatory lag mitigation measure proposed:
• Test period adjusted to recover additional reliability plant additions from April 2013 through December 2013 ($8.9 million of revenue)
Consolidated Tax Adjustment (CTA) Proceeding:
• Order issued on January 23, 2013 by the New Jersey Board of Public Utilities (BPU) to solicit input from stakeholders, including utilities, to determine whether the CTA policy is appropriate in NJ and if so, how it should be calculated
(1) The net annual revenue requirement is composed of an increase of $72.1 million in distribution rates and a decrease of $1.7 million in the Regulatory Asset Recovery Charge, excluding Sales and Use Tax.
(2) Once revenue requirement is approved, amortization expense will also increase by $9.1 million due to Derecho and Sandy restoration costs and depreciation expense will decrease by $5.4 million based on filed depreciation study.
Note: See Safe Harbor Statement at the beginning of today’s presentation. 11
|
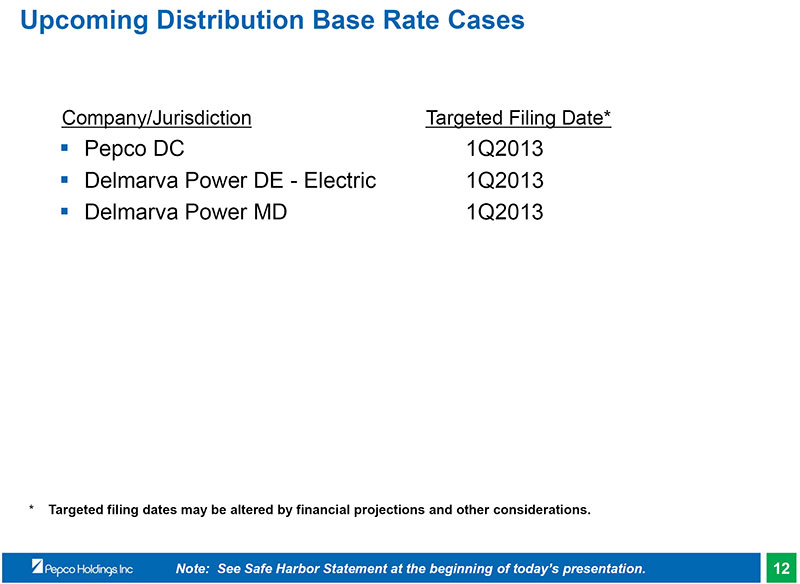 |
Upcoming Distribution Base Rate Cases
Company/Jurisdiction Targeted Filing Date*
Pepco DC 1Q2013 Delmarva Power DE - Electric 1Q2013 Delmarva Power MD 1Q2013
* Targeted filing dates may be altered by financial projections and other considerations.
Note: See Safe Harbor Statement at the beginning of today’s presentation. 12
|
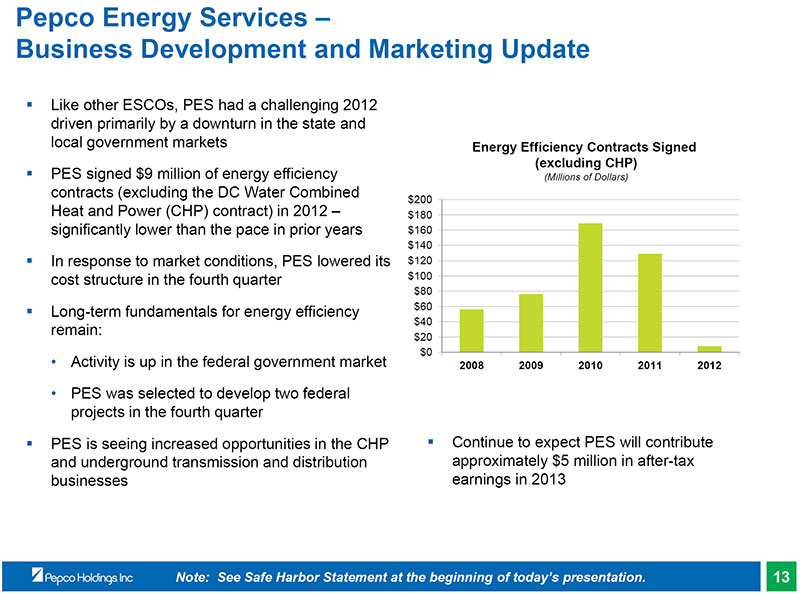 |
Pepco Energy Services –
Business Development and Marketing Update
• Like other ESCOs, PES had a challenging 2012 driven primarily by a downturn in the state and local government markets Energy Efficiency Contracts Signed (excluding CHP)
• PES signed $9 million of energy efficiency (Millions of Dollars) contracts (excluding the DC Water Combined
$200
Heat and Power (CHP) contract) in 2012 – $180 significantly lower than the pace in prior years $160
$140
• In response to market conditions, PES lowered its $120 cost structure in the fourth quarter $100
$80
Long-term fundamentals for energy efficiency $60
$40
remain:
$20 $0
• Activity is up in the federal government market 2008 2009 2010 2011 2012
• PES was selected to develop two federal projects in the fourth quarter
• PES is seeing increased opportunities in the CHP Continue to expect PES will contribute and underground transmission and distribution approximately $5 million in after-tax businesses earnings in 2013
Note: See Safe Harbor Statement at the beginning of today’s presentation. 13
|
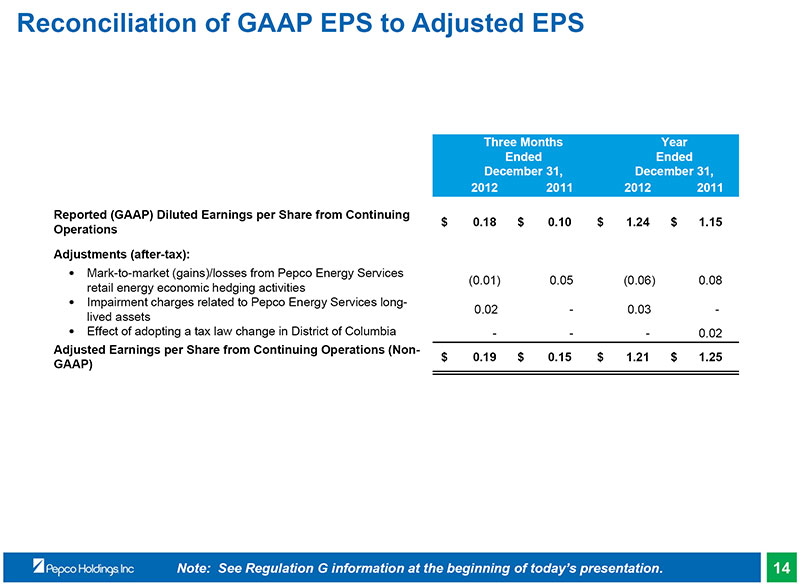 |
Reconciliation of GAAP EPS to Adjusted EPS
Three Months Year Ended Ended December 31, December 31, 2012 2011 2012 2011
Reported (GAAP) Diluted Earnings per Share from Continuing
$ 0.18 $ 0.10 $ 1.24 $ 1.15 Operations
Adjustments (after-tax):
Mark-to-market (gains)/losses from Pepco Energy Services
(0.01) 0.05 (0.06) 0.08 retail energy economic hedging activities Impairment charges related to Pepco Energy Services long-0.02 - 0.03 -lived assets Effect of adopting a tax law change in District of Columbia - - - 0.02
Adjusted Earnings per Share from Continuing Operations (Non-
$ 0.19 $ 0.15 $ 1.21 $ 1.25 GAAP)
Note: See Regulation G information at the beginning of today’s presentation. 14
|
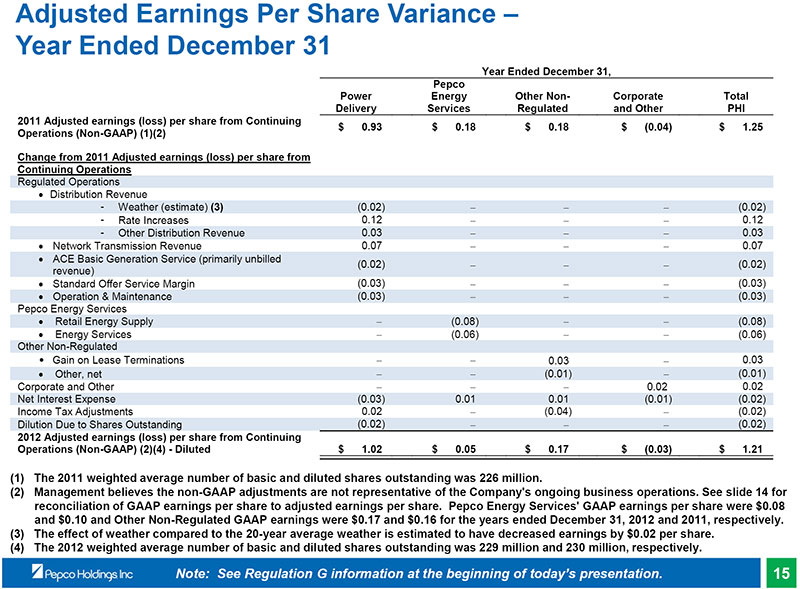 |
Adjusted Earnings Per Share Variance –Year Ended December 31
Year Ended December 31, Pepco
Power Energy Other Non- Corporate Total Delivery Services Regulated and Other PHI 2011 Adjusted earnings (loss) per share from Continuing
$ 0.93 $ 0.18 $ 0.18 $ (0.04) $ 1.25 Operations (Non-GAAP) (1)(2)
Change from 2011 Adjusted earnings (loss) per share from
Continuing Operations
Regulated Operations Distribution Revenue
- Weather (estimate) (3) (0.02) (0.02)
- Rate Increases 0.12 0.12
- Other Distribution Revenue 0.03 0.03 Network Transmission Revenue 0.07 0.07 ACE Basic Generation Service (primarily unbilled (0.02) (0.02) revenue) Standard Offer Service Margin (0.03) (0.03) Operation & Maintenance (0.03) (0.03) Pepco Energy Services Retail Energy Supply (0.08) (0.08) Energy Services (0.06) (0.06) Other Non-Regulated
• Gain on Lease Terminations 0.03 0.03 Other, net (0.01) (0.01) Corporate and Other 0.02 0.02 Net Interest Expense (0.03) 0.01 0.01 (0.01) (0.02) Income Tax Adjustments 0.02 (0.04) (0.02) Dilution Due to Shares Outstanding (0.02) (0.02)
2012 Adjusted earnings (loss) per share from Continuing
Operations (Non-GAAP) (2)(4) - Diluted $ 1.02 $ 0.05 $ 0.17 $ (0.03) $ 1.21
(1) The 2011 weighted average number of basic and diluted shares outstanding was 226 million.
(2) Management believes the non-GAAP adjustments are not representative of the Company’s ongoing business operations. See slide 14 for reconciliation of GAAP earnings per share to adjusted earnings per share. Pepco Energy Services’ GAAP earnings per share were $0.08 and $0.10 and Other Non-Regulated GAAP earnings were $0.17 and $0.16 for the years ended December 31, 2012 and 2011, respectively.
(3) The effect of weather compared to the 20-year average weather is estimated to have decreased earnings by $0.02 per share.
(4) The 2012 weighted average number of basic and diluted shares outstanding was 229 million and 230 million, respectively.
Note: See Regulation G information at the beginning of today’s presentation. 15
|
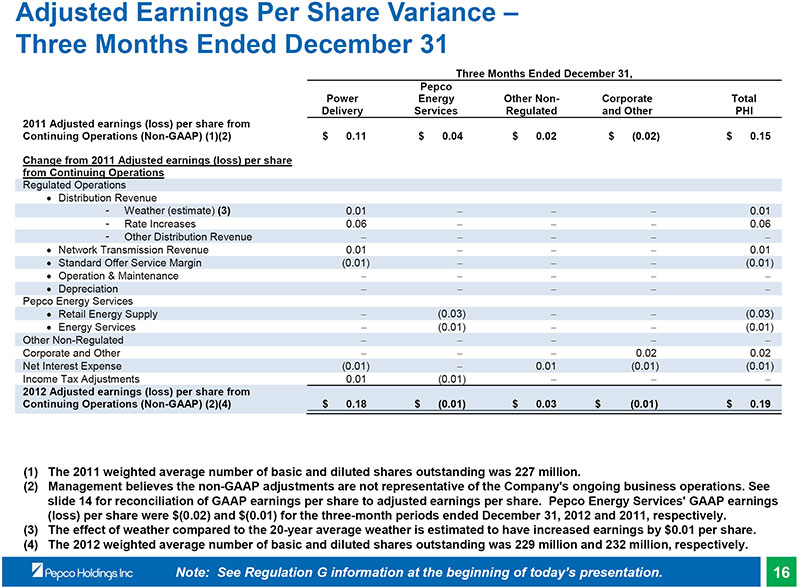 |
Adjusted Earnings Per Share Variance –Three Months Ended December 31
Three Months Ended December 31, Pepco
Power Energy Other Non- Corporate Total Delivery Services Regulated and Other PHI 2011 Adjusted earnings (loss) per share from Continuing Operations (Non-GAAP) (1)(2) $ 0.11 $ 0.04 $ 0.02 $ (0.02) $ 0.15
Change from 2011 Adjusted earnings (loss) per share from Continuing Operations Regulated Operations Distribution Revenue
- Weather (estimate) (3) 0.01 0.01
- Rate Increases 0.06 0.06
- Other Distribution Revenue Network Transmission Revenue 0.01 0.01 Standard Offer Service Margin (0.01) (0.01) Operation & Maintenance Depreciation Pepco Energy Services Retail Energy Supply (0.03) (0.03) Energy Services (0.01) (0.01) Other Non-Regulated Corporate and Other 0.02 0.02 Net Interest Expense (0.01) 0.01 (0.01) (0.01) Income Tax Adjustments 0.01 (0.01)
2012 Adjusted earnings (loss) per share from
Continuing Operations (Non-GAAP) (2)(4) $ 0.18 $ (0.01) $ 0.03 $ (0.01) $ 0.19
(1) The 2011 weighted average number of basic and diluted shares outstanding was 227 million.
(2) Management believes the non-GAAP adjustments are not representative of the Company’s ongoing business operations. See slide 14 for reconciliation of GAAP earnings per share to adjusted earnings per share. Pepco Energy Services’ GAAP earnings (loss) per share were $(0.02) and $(0.01) for the three-month periods ended December 31, 2012 and 2011, respectively. (3) The effect of weather compared to the 20-year average weather is estimated to have increased earnings by $0.01 per share. (4) The 2012 weighted average number of basic and diluted shares outstanding was 229 million and 232 million, respectively.
Note: See Regulation G information at the beginning of today’s presentation. 16
|
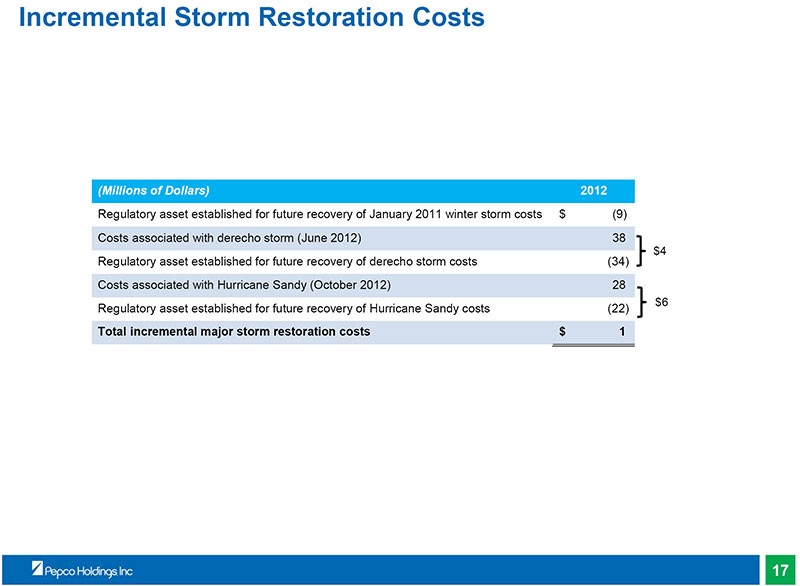 |
Incremental Storm Restoration Costs
(Millions of Dollars) 2012 Regulatory asset established for future recovery of January 2011 winter storm costs $ (9) Costs associated with derecho storm (June 2012) 38 $4
Regulatory asset established for future recovery of derecho storm costs (34) Costs associated with Hurricane Sandy (October 2012) 28 $6
Regulatory asset established for future recovery of Hurricane Sandy costs (22)
Total incremental major storm restoration costs $ 1
17
|
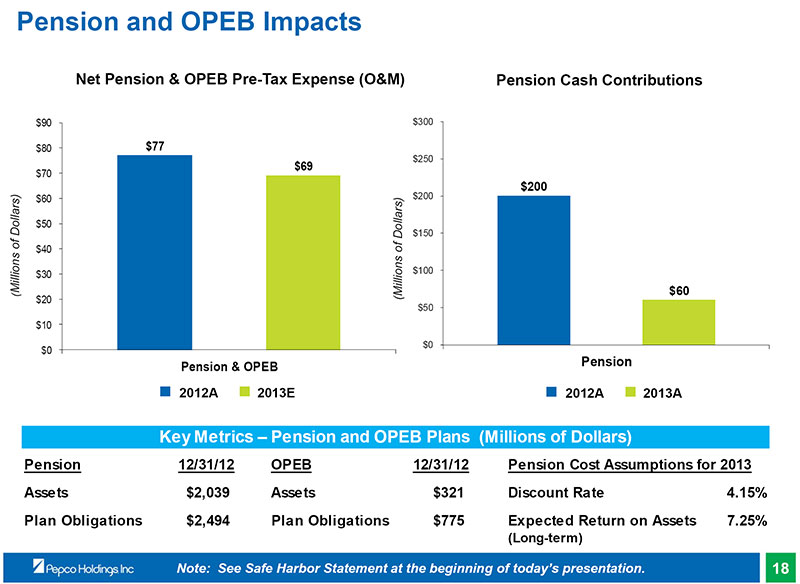 |
Pension and OPEB Impacts
Net Pension & OPEB Pre-Tax Expense (O&M) Pension Cash Contributions
$90 $300
$80 $77
$250
$69 $70
$200
$60 $200
$50 $150 $40
Millions of Dollars) $30 $100
( (Millions of Dollars) $60
$20 $50 $10 $0 $0
Pension & OPEB Pension
■ 2012A ■2013E ■ 2012A ■2013A
Key Metrics – Pension and OPEB Plans (Millions of Dollars)
Pension 12/31/12 OPEB 12/31/12 Pension Cost Assumptions for 2013 Assets $2,039 Assets $321 Discount Rate 4.15% Plan Obligations $2,494 Plan Obligations $775 Expected Return on Assets 7.25%
(Long-term)
Note: See Safe Harbor Statement at the beginning of today’s presentation. 18
|
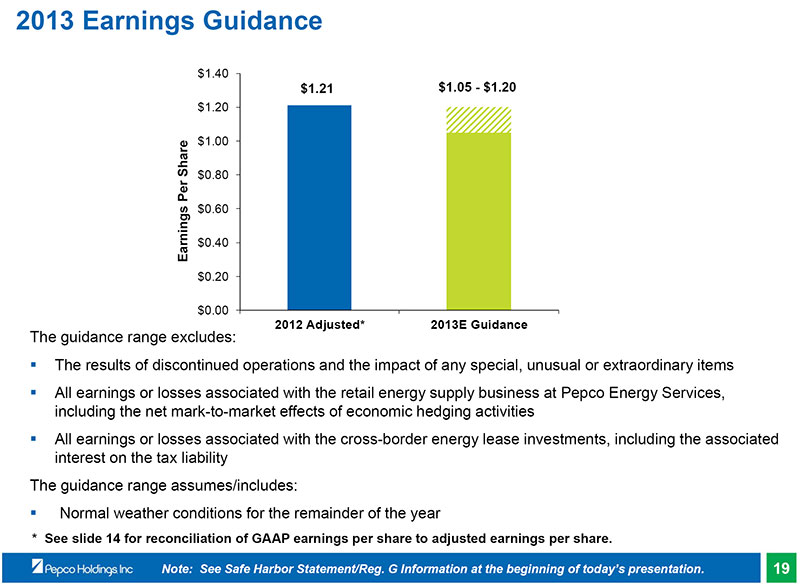 |
2013 Earnings Guidance
$1.40 $1.21 $1.05 - $1.20 $1.20
$1.00
$0.80
$0.60
Earnings Per Share $0.40 $0.20
$0.00
2012 Adjusted* 2013E Guidance
The guidance range excludes:
The results of discontinued operations and the impact of any special, unusual or extraordinary items All earnings or losses associated with the retail energy supply business at Pepco Energy Services, including the net mark-to-market effects of economic hedging activities All earnings or losses associated with the cross-border energy lease investments, including the associated interest on the tax liability The guidance range assumes/includes: Normal weather conditions for the remainder of the year
* See slide 14 for reconciliation of GAAP earnings per share to adjusted earnings per share.
Note: See Safe Harbor Statement/Reg. G Information at the beginning of today’s presentation. 19
|
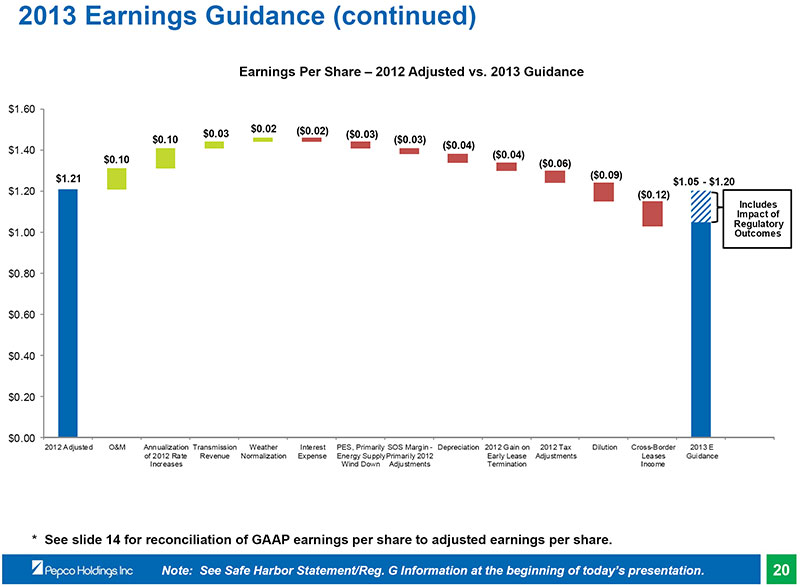 |
2013 Earnings Guidance (continued)
Earnings Per Share – 2012 Adjusted vs. 2013 Guidance
$1.60 $0.02 ($0.02) $0.03 ($0.03) $0.10 ($0.03)
($0.04) $1.40 ($0.04) $0.10 ($0.06) $1.21 ($0.09) $1.05 - $1.20 $1.20 ($0.12)
Includes Impact of Regulatory $1.00 Outcomes
$0.80 $0.60 $0.40 $0.20
$0.00
2012 Adjusted O&M Annualization Transmission Weather Interest PES, Primarily SOS Margin - Depreciation 2012 Gain on 2012 Tax Dilution Cross-Border 2013 E of 2012 Rate Revenue Normalization Expense Energy Supply Primarily 2012 Early Lease Adjustments Leases Guidance Increases Wind Down Adjustments Termination Income
* See slide 14 for reconciliation of GAAP earnings per share to adjusted earnings per share.
Note: See Safe Harbor Statement/Reg. G Information at the beginning of today’s presentation. 20
|