Attached files
| file | filename |
|---|---|
| 8-K - 8-K - Hillenbrand, Inc. | a13-6038_18k.htm |
Exhibit 99.1
|
|
Annual Shareholder Meeting February 27, 2013 |

|
|
2 Disclosure regarding forward-looking statements Throughout this release, we make a number of forward-looking statements within the meaning of the Private Securities Litigation Reform Act of 1995. As the words imply, forward-looking statements are statements about the future, as contrasted with historical information. Our forward-looking statements are based on assumptions and current expectations of future events that we believe are reasonable, but by their very nature they are subject to a wide range of risks. If our assumptions prove inaccurate or unknown risks and uncertainties materialize, actual results could vary materially from Hillenbrand's expectations and projections. Words that could indicate that we are making forward-looking statements include the following: This is not an exhaustive list. Our intent is to provide examples of how readers might identify forward-looking statements. The absence of any of these words, however, does not mean that the statement is not forward-looking. Here is the key point: Forward-looking statements are not guarantees of future performance, and our actual results could differ materially from those set forth in any forward-looking statements. Any number of factors, many of which are beyond our control, could cause our performance to differ significantly from what is described in the forward-looking statements. These factors include, but are not limited to: the outcome of any legal proceedings that may be instituted against Hillenbrand, or any companies we may acquire; risks that an acquisition disrupts current operations or poses potential difficulties in employee retention or otherwise affects financial or operating results; the ability to recognize the benefits of an acquisition, including potential synergies and cost savings or the failure of an acquired company to achieve its plans and objectives generally; global market and economic conditions, including those related to the credit markets; volatility of our investment portfolio; adverse foreign currency fluctuations; ongoing involvement in claims, lawsuits and governmental proceedings related to operations; labor disruptions; the dependence of our business units on relationships with several large providers; increased costs or unavailability of raw materials; continued fluctuations in mortality rates and increased cremations; competition from nontraditional sources in the funeral services business; cyclical demand for industrial capital goods; and certain tax-related matters. For a more in-depth discussion of these and other factors that could cause actual results to differ from those contained in forward-looking statements, see the discussions under the heading "Risk Factors" in item 1A of Hillenbrand's Form 10-Q for the quarter ended December 31, 2012, filed with the Securities and Exchange Commission on February 4, 2013. The company assumes no obligation to update or revise any forward-looking information. intend believe plan expect may goal would become pursue estimate will forecast continue could targeted encourage promise improve progress potential should |
|
|
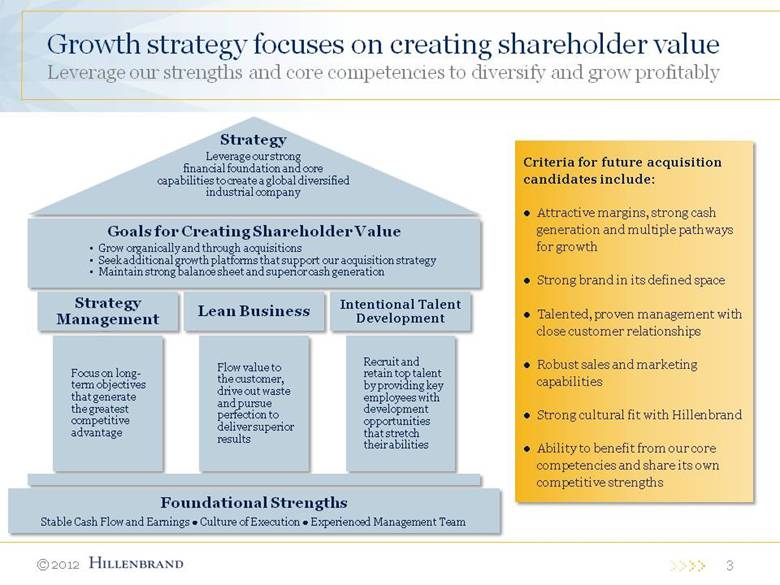
3 Growth strategy focuses on creating shareholder value Leverage our strengths and core competencies to diversify and grow profitably Criteria for future acquisition candidates include: Attractive margins, strong cash generation and multiple pathways for growth Strong brand in its defined space Talented, proven management with close customer relationships Robust sales and marketing capabilities Strong cultural fit with Hillenbrand Ability to benefit from our core competencies and share its own competitive strengths |
|
|
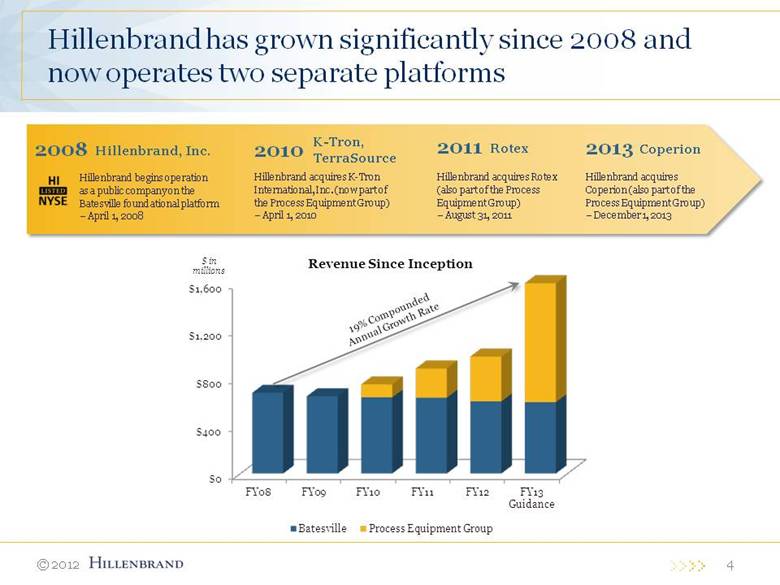
K-Tron, TerraSource Hillenbrand acquires K-Tron International, Inc. (now part of the Process Equipment Group) – April 1, 2010 2010 Hillenbrand has grown significantly since 2008 and now operates two separate platforms 2008 Hillenbrand, Inc. Hillenbrand begins operation as a public company on the Batesville foundational platform – April 1, 2008 2011 Rotex Hillenbrand acquires Rotex (also part of the Process Equipment Group) – August 31, 2011 2013 Coperion Hillenbrand acquires Coperion (also part of the Process Equipment Group) – December 1, 2013 4 $0 $400 $800 $1,200 $1,600 FY08 FY09 FY10 FY11 FY12 FY13 Guidance Revenue Since Inception Batesville Process Equipment Group $ in millions 19% Compounded Annual Growth Rate |
|
|
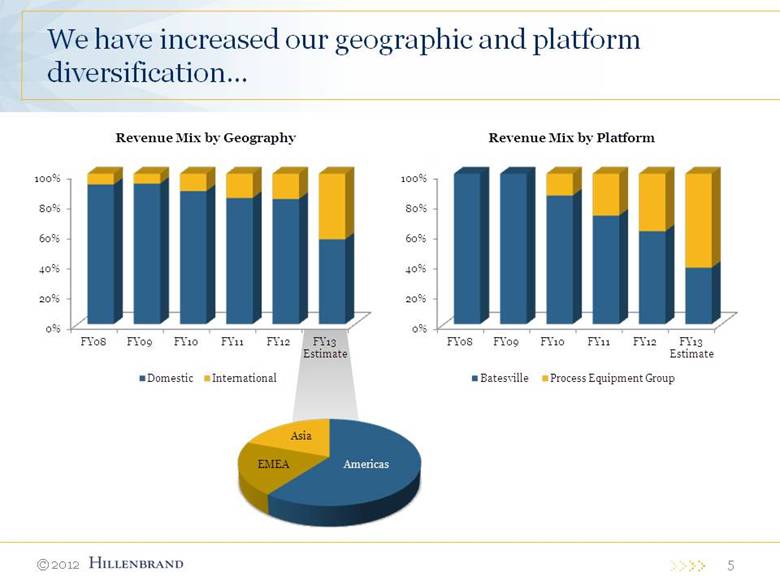
We have increased our geographic and platform diversification... 5 Americas Asia EMEA 0% 20% 40% 60% 80% 100% FY08 FY09 FY10 FY11 FY12 FY13 Estimate Revenue Mix by Platform Batesville Process Equipment Group Revenue Mix by Geography Domestic International 100% 80% 60% 40% 20% 0% |
|
|
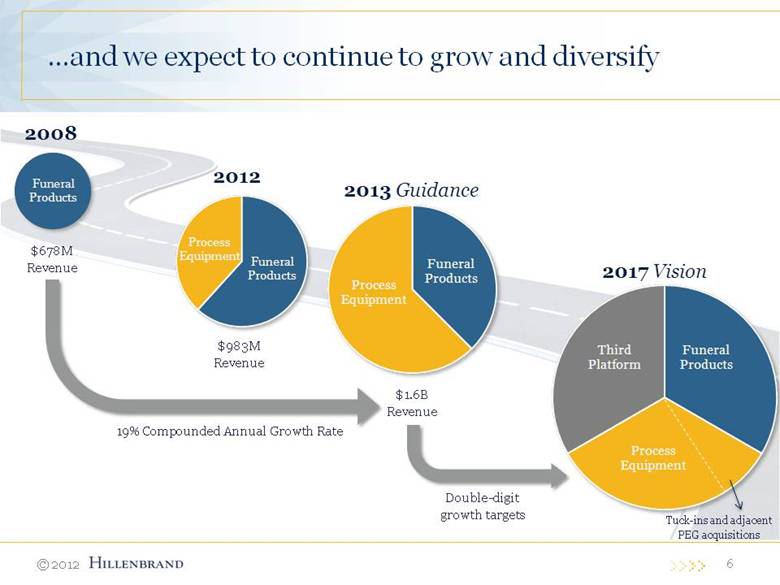
...and we expect to continue to grow and diversify 6 Tuck-ins and adjacent PEG acquisitions $678M Revenue $1.6B Revenue Double-digit growth targets 19% Compounded Annual Growth Rate $983M Revenue 2013 Guidance Funeral Products Process Equipment 2008 Funeral Products 2012 Funeral Products Process Equipment 2017 Vision |
|
|
The Process Equipment Group 7 |
|
|
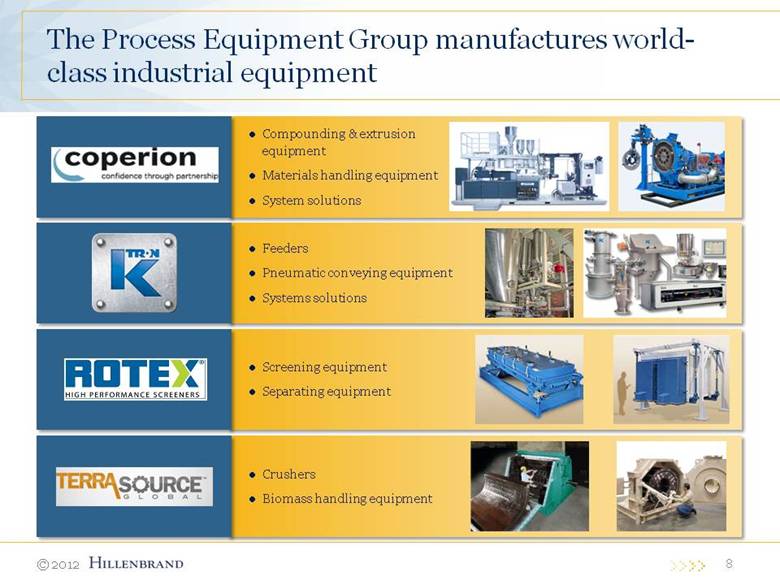
Compounding & extrusion equipment Materials handling equipment System solutions 8 The Process Equipment Group manufactures world-class industrial equipment Feeders Pneumatic conveying equipment Systems solutions Crushers Biomass handling equipment Screening equipment Separating equipment |
|
|
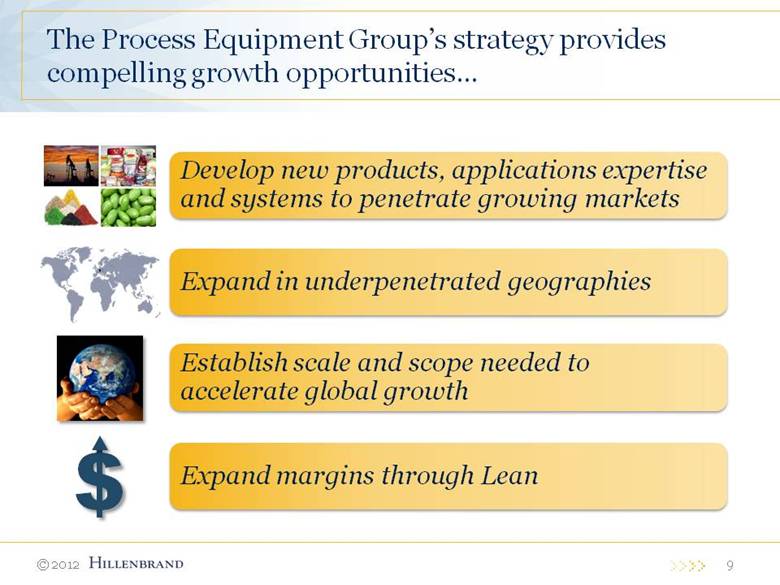
9 The Process Equipment Group’s strategy provides compelling growth opportunities Develop new products, applications expertise and systems to penetrate growing markets $ Expand in underpenetrated geographies Establish scale and scope needed to accelerate global growth Expand margins through Lean |
|
|
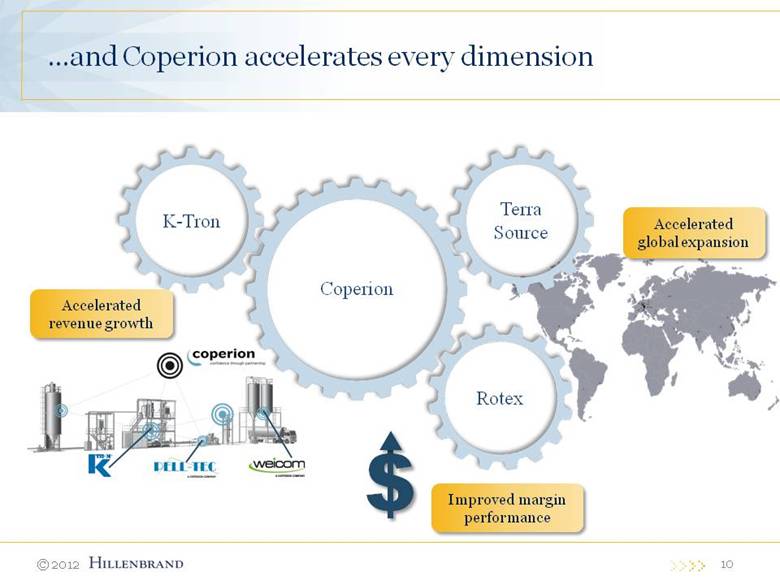
10 and Coperion accelerates every dimension K-Tron Rotex Terra Source Coperion $ Improved margin performance Accelerated global expansion Accelerated revenue growth |
|
|
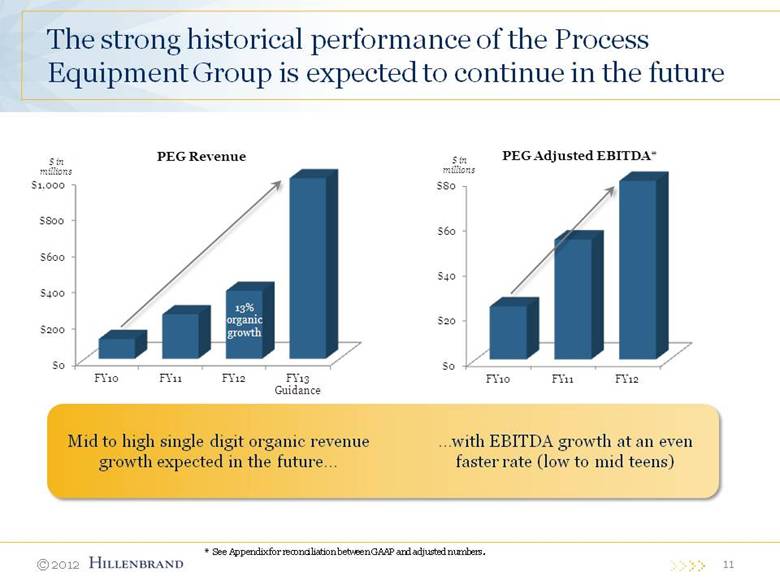
11 The strong historical performance of the Process Equipment Group is expected to continue in the future Mid to high single digit organic revenue growth expected in the future with EBITDA growth at an even faster rate (low to mid teens) * See Appendix for reconciliation between GAAP and adjusted numbers. $0 $200 $400 $600 $800 $1,000 FY10 FY11 FY12 FY13 Guidance PEG Revenue $ in millions 13% organic growth $0 $20 $40 $60 $80 FY10 FY11 FY12 PEG Adjusted EBITDA* $ in millions |
|
|
Batesville 12 |

|
|
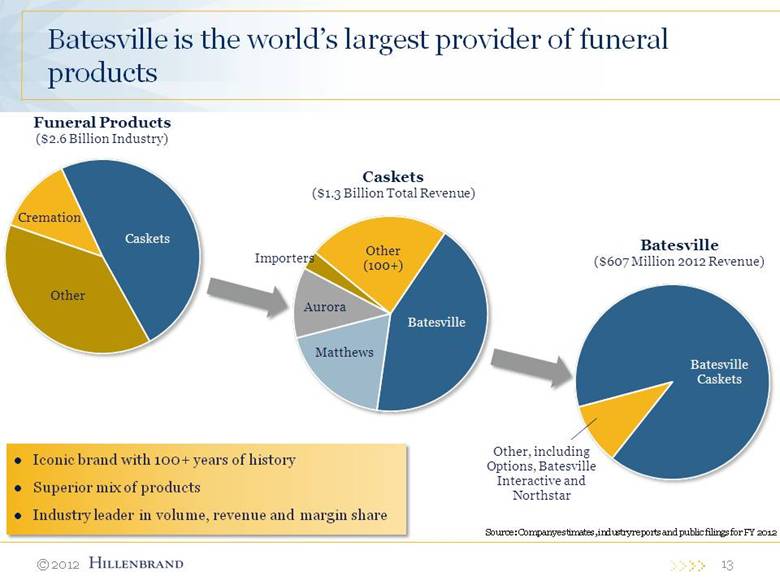
13 Batesville is the world’s largest provider of funeral products Caskets Iconic brand with 100+ years of history Superior mix of products Industry leader in volume, revenue and margin share Source: Company estimates, industry reports and public filings for FY 2012 Batesville Caskets Batesville ($607 Million 2012 Revenue) Other, including Options, Batesville Interactive and Northstar Funeral Products ($2.6 Billion Industry) Cremation Other Caskets |
|
|
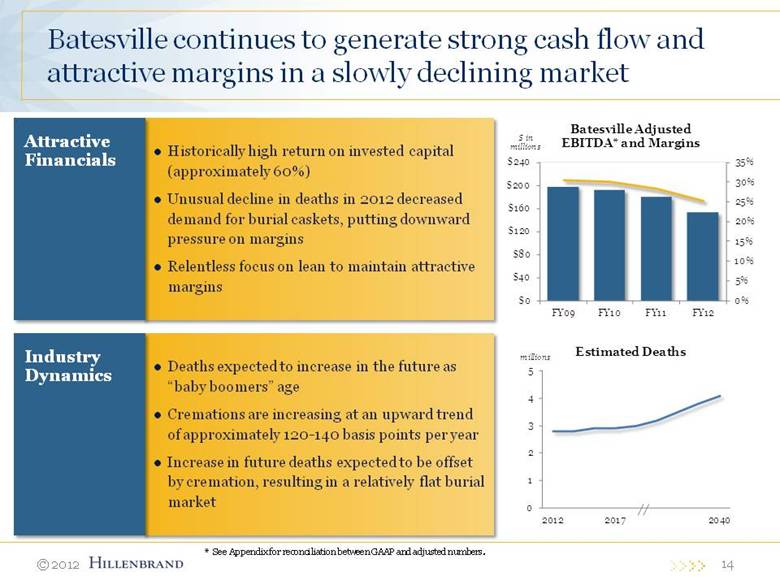
14 Batesville continues to generate strong cash flow and attractive margins in a slowly declining market Historically high return on invested capital (approximately 60%) Unusual decline in deaths in 2012 decreased demand for burial caskets, putting downward pressure on margins Relentless focus on lean to maintain attractive margins Attractive Financials Deaths expected to increase in the future as “baby boomers” age Cremations are increasing at an upward trend of approximately 120-140 basis points per year Increase in future deaths expected to be offset by cremation, resulting in a relatively flat burial market Industry Dynamics * See Appendix for reconciliation between GAAP and adjusted numbers. 0 1 2 3 4 5 2012 2017 2040 Estimated Deaths millions 0% 5% 10% 15% 20% 25% 30% 35% $0 $40 $80 $120 $160 $200 $240 FY09 FY10 FY11 FY12 Batesville Adjusted EBITDA* and Margins $ in millions |
|
|
Financial Results 15 |

|
|
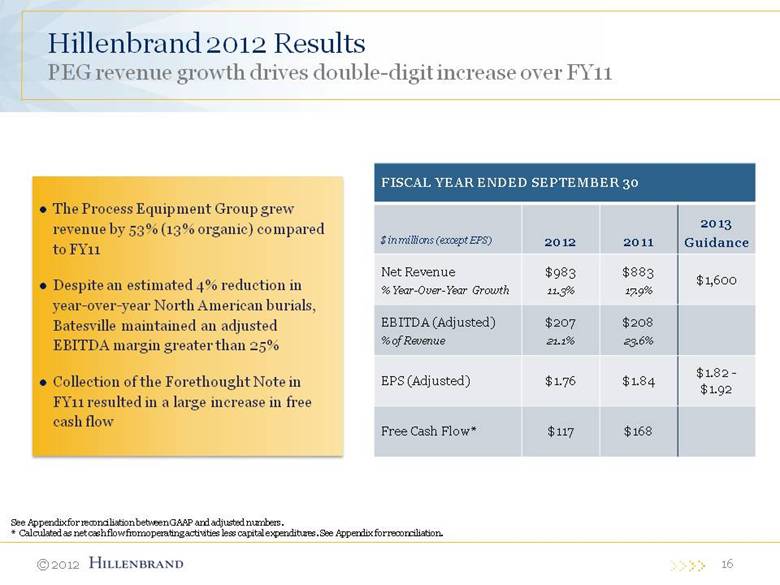
16 The Process Equipment Group grew revenue by 53% (13% organic) compared to FY11 Despite an estimated 4% reduction in year-over-year North American burials, Batesville maintained an adjusted EBITDA margin greater than 25% Collection of the Forethought Note in FY11 resulted in a large increase in free cash flow FISCAL YEAR ENDED SEPTEMBER 30 $ in millions (except EPS) 2012 2011 2013 Guidance Net Revenue % Year-Over-Year Growth $983 11.3% $883 17.9% $1,600 EBITDA (Adjusted) % of Revenue $207 21.1% $208 23.6% EPS (Adjusted) $1.76 $1.84 $1.82 - $1.92 Free Cash Flow* $117 $168 Hillenbrand 2012 Results PEG revenue growth drives double-digit increase over FY11 See Appendix for reconciliation between GAAP and adjusted numbers. * Calculated as net cash flow from operating activities less capital expenditures. See Appendix for reconciliation. |
|
|
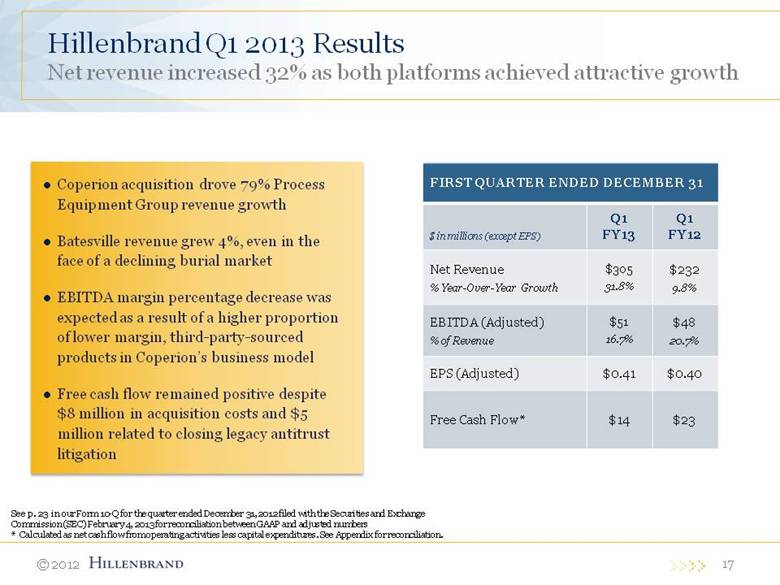
17 Hillenbrand Q1 2013 Results Net revenue increased 32% as both platforms achieved attractive growth FIRST QUARTER ENDED DECEMBER 31 $ in millions (except EPS) Q1 FY13 Q1 FY12 Net Revenue % Year-Over-Year Growth $305 31.8% $232 9.8% EBITDA (Adjusted) % of Revenue $51 16.7% $48 20.7% EPS (Adjusted) $0.41 $0.40 Free Cash Flow* $14 $23 Coperion acquisition drove 79% Process Equipment Group revenue growth Batesville revenue grew 4%, even in the face of a declining burial market EBITDA margin percentage decrease was expected as a result of a higher proportion of lower margin, third-party-sourced products in Coperion’s business model Free cash flow remained positive despite $8 million in acquisition costs and $5 million related to closing legacy antitrust litigation See p. 23 in our Form 10-Q for the quarter ended December 31, 2012 filed with the Securities and Exchange Commission (SEC) February 4, 2013 for reconciliation between GAAP and adjusted numbers * Calculated as net cash flow from operating activities less capital expenditures. See Appendix for reconciliation. |
|
|
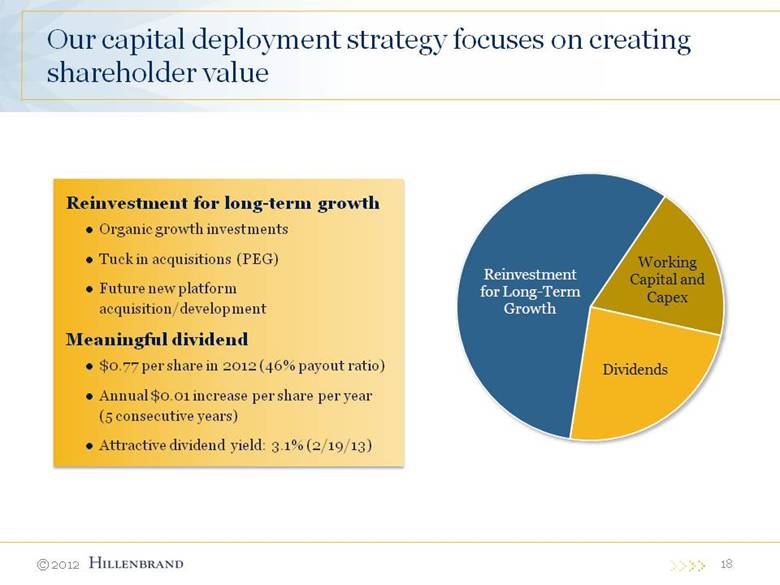
18 Our capital deployment strategy focuses on creating shareholder value Reinvestment for long-term growth Organic growth investments Tuck in acquisitions (PEG) Future new platform acquisition/development Meaningful dividend $0.77 per share in 2012 (46% payout ratio) Annual $0.01 increase per share per year (5 consecutive years) Attractive dividend yield: 3.1% (2/19/13) Reinvestment for Long - Term Growth Working Capital and Capex Dividends |
|
|
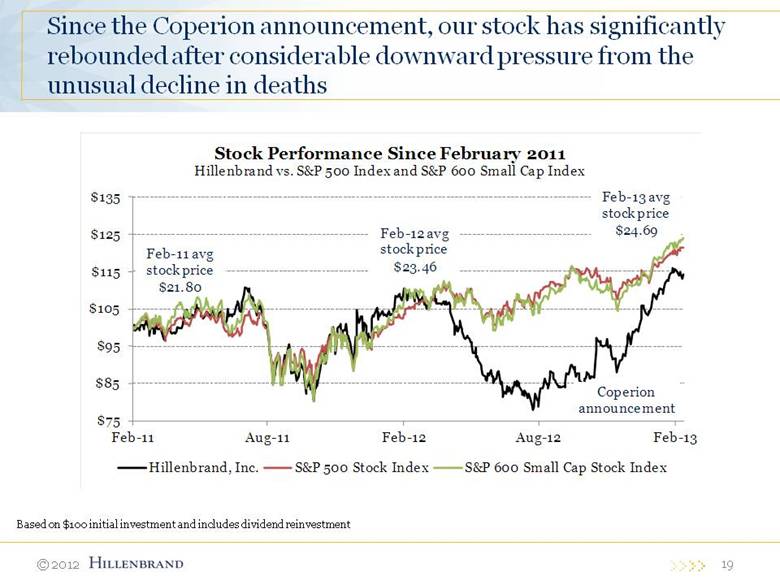
19 Since the Coperion announcement, our stock has significantly rebounded after considerable downward pressure from the unusual decline in deaths Based on $100 initial investment and includes dividend reinvestment $75 $85 $95 $105 $115 $125 $135 Feb - 11 Aug - 11 Feb - 12 Aug - 12 Feb - 13 Stock Performance Since February 2011 Hillenbrand vs. S&P 500 Index and S&P 600 Small Cap Index Hillenbrand, Inc. S&P 500 Stock Index S&P 600 Small Cap Stock Index Feb - 11 avg stock price $21.80 Feb - 12 avg stock price $23.46 Feb - 13 avg stock price $24.69 Coperion announcement |
|
|
Continued execution of the Hillenbrand transformation strategy promises an exciting future 20 Tuck-ins and adjacent PEG acquisitions $678M Revenue $1.6B Revenue Double-digit growth targets 19% Compounded Annual Growth Rate $983M Revenue 2013 Guidance Funeral Products Process Equipment 2008 Funeral Products 2012 Funeral Products Process Equipment 2017 Vision Third Platform Funeral Products Process Equipment Tuck-ins and adjacent PEG acquisitions |
|
|
Questions? |

|
|
Annual Shareholder Meeting February 27, 2013 HILLENBRAND |

|
|
Appendix |

|
|
24 Disclosure regarding non-GAAP measures While we report financial results in accordance with accounting principles generally accepted in the United States (GAAP), we also provide certain non-GAAP operating performance measures. These non-GAAP measures exclude the tax benefit of the international integration described in Item 1 of our 2012 Form 10-K filed with the Securities and Exchange Commission (SEC) November 26, 2012 , expenses associated with long-term incentive compensation related to the international integration, backlog amortization, antitrust litigation, business acquisitions, restructuring, and sales tax adjustments, as well as the related income tax. This non-GAAP information is provided as a supplement, not as a substitute for, or as superior to, measures of financial performance prepared in accordance with GAAP. We use this information internally to make operating decisions and believe it is helpful to investors because it allows more meaningful period-to-period comparisons of our ongoing operating results. The information can also be used to perform trend analysis and to better identify operating trends that may otherwise be masked or distorted by these types of items. Finally, the Company believes such information provides a higher degree of transparency for certain items. Investors should consider non-GAAP measures in addition to, not as a substitute for, or as superior to, measures of financial performance prepared in accordance with GAAP. |
|
|
25 GAAP to adjusted reconciliation (amounts in millions) See our 2012 Form 10-K filed with the Securities and Exchange Commission (SEC) November 26, 2012, for fiscal year 2012, 2011, and 2010 consolidated EBITDA on page 24 and segment EBITDA on page 60. See our 2011 Form 10-K filed with the SEC November 28, 2011, for fiscal year 2009 consolidated EBITDA on page 19 and segment EBITDA on page 60. Adj GAAP Adj Adj GAAP Adj $ 594.3 $ (4.2) (a) $ 590.1 $ 513.5 $ (2.8) (b) $ 510.7 $ 435.9 $ (11.6) (b) $ 424.3 $ 374.7 $ - $ 374.7 388.9 4.2 393.1 369.9 2.8 372.7 313.3 11.6 324.9 274.4 - 274.4 240.1 (18.8) (c) 221.3 211.3 (8.9) (d) 202.4 175.4 (15.5) (e) 159.9 119.4 (2.3) (f) 117.1 148.8 23.0 171.8 158.6 11.7 170.3 137.9 27.1 165.0 155.0 2.3 157.3 30.1 18.1 (g) 48.2 51.7 4.0 (h) 55.7 54.1 7.8 (h) 61.9 58.5 0.8 (h) 59.3 4.9 7.7 19.3 1.5 1.68 0.08 1.76 1.71 0.13 1.84 1.49 0.31 1.80 1.66 0.02 1.68 (a) Restructuring ($0.9 P, $3.3 B) (b) Inventory step-up (FY2011: $2.8 P, FY2010: $11.6 P) (c) (d) Restructuring ($1.3 B), antitrust litigation ($1.3 B), business acquisition costs ($0.3 P, $6.0 C), backlog amortization ($0.8 P), and sales tax recoveries ($0.8 B) (e) Business acquisition costs ($0.3 P, $10.2 C), antitrust litigation ($5.0 B), restructuring ($3.0 C), backlog ($1.7 P), and sales tax recoveries ($4.7 B) (f) Antitrust litigation ($2.2 B), restructuring ($0.1 C) (g) (h) Tax effect of adjustments Years Ended September 30, 2012 2011 2010 2009 Adjusted Adjusted Cost of goods sold Gross profit Operating expenses GAAP Adjusted Adjusted GAAP Operating profit Income tax expense (benefit) Net income 104.8 106.1 109.7 92.3 113.8 103.8 Diluted EPS 102.3 111.6 P = Process Equipment Group; B = Batesville; C = Corporate Tax benefit of the international integration ($10.4) and tax effect of adjustments Antitrust litigation ($5.5 B), restructuring ($2.8 P, $0.6 B, $0.9 C), business acquisition costs ($4.2 C), backlog amortization ($2.5 P), long-term incentive compensation related to the international integration ($0.2 P, $0.8 B, $1.2 C), and other ($0.1 C) |
|
|
26 FY12 & FY11 GAAP cash flow (amounts in millions) Years Ended September 30, 2012 2011 Operating Activities Net income $104.8 $106.1 Depreciation & amortization 40.4 36.1 Interest income on Forethought Note - (6.4 ) Forethought Note interest payment - 59.7 Change in working capital (19.8 ) (16.4 ) Other, net 12.8 10.4 Net cash flow from operating activities (A) 138.2 189.5 Capital expenditures (B) (20.9 ) (21.9 ) Forethought Note principal repayment - 91.5 Acquisitions of businesses, net of cash acquired (4.4 ) (240.9 ) Proceeds from redemption and sales, and ARS and investments 0.8 12.4 Debt activity (162.3 ) 28.1 Dividends (47.6 ) (46.9 ) Purchase of common stock - (3.8 ) Other 0.9 9.1 Net change in cash $(95.3 ) $17.1 Free cash flow (A-B) $117.3 $167.6 |
|
|
27 Q1 FY13 & Q1 FY12 GAAP cash flow (amounts in millions) Quarter Ended December 31, 2012 2011 Operating Activities Net income $14.6 $31.3 Depreciation & amortization 15.0 12.2 Change in working capital 12.9 (1.6 ) Other, net (22.8 ) (14.9 ) Net cash flow from operating activities (A) 19.7 27.0 Capital expenditures (B) (5.6 ) (4.2 ) Acquisitions of businesses, net of cash acquired (415.6 ) - Debt activity 494.8 - Dividends (12.1 ) (11.9 ) Other 0.7 (3.9 ) Net change in cash $81.9 $7.0 Free cash flow (A-B) $14.1 $22.8 |