Attached files
| file | filename |
|---|---|
| 8-K - FORM 8-K - Tower Group International, Ltd. | d491262d8k.htm |
 1.
Fourth Quarter 2012
Earnings Call Presentation
February 26, 2013
Exhibit 99.1 |
 1
Forward-Looking Statements
The Private Securities Litigation Reform Act of 1995 provides a "safe
harbor" for forward-looking statements. This presentation and any
other written or oral statements made by or on behalf of Tower may include
forward-looking statements that reflect Tower's current views with
respect to future events and financial performance. All statements other than statements of historical fact included in this
presentation are
forward-looking statements. Forward-looking statements can generally be identified by the use of forward-looking
terminology such as "may," "will," "plan,"
"expect," "project," "intend," "estimate," "anticipate," "believe" and "continue" or their negative or
variations or similar terminology. All forward-looking statements address
matters that involve risks and uncertainties. Accordingly, there are or
will be important factors that could cause the actual results of Tower to differ materially from those indicated in these statements.
Please refer to Tower’s filings with the SEC, including among others
Tower’s Annual Report on Form 10-K/A for the year ended December
31, 2011 and subsequent filings on Forms 10-Q/A, for a description of the
important factors that could cause the actual results of Tower to differ
materially from those indicated in these statements. Forward-looking statements speak only as of the date on which they are made,
and Tower undertakes no obligation to update publicly or revise any
forward-looking statement, whether as a result of new information,
future developments or otherwise.
Notes on Non-GAAP Financial Measures
Combined ratio excluding the impact of catastrophes and reserve development is
the sum of the loss and loss adjustment expense ratio and the expense
ratio excluding the impact of catastrophes and reserve development. We believe this presentation enhances the
understanding of our results by eliminating what we believe are volatile and
unusual events and presenting the ratios with what we believe are the
underlying run rates of the business. A reconciliation of combined ratio to combined ratio excluding the impact of catastrophes and
reserve development is provided in an accompanying table.
Book value per share is calculated as Tower Group, Inc. stockholders’
equity divided by the number of shares outstanding. We believe that book
value per share is an important measure of our ability to grow shareholder value. The computation of book value per share is provided
in an accompanying table.
Total premiums include gross premiums written through our insurance
subsidiaries and produced as managing general agent on behalf of other
insurance companies, including the reciprocal exchanges. Operating income (loss) excludes realized gains and losses,
acquisition-related transaction costs and the results of the reciprocal business,
net of tax. Operating income is a common measurement for property and casualty
insurance companies. We believe this presentation enhances the
understanding of our results of operations by highlighting the underlying profitability of our insurance business. Additionally,
these measures are a key internal management performance standard. Operating
earnings (loss) per share is operating income (loss)
divided by diluted weighted average shares outstanding. Net income (loss)
attributable to Tower Group, Inc. is the most directly comparable GAAP
measure. Operating return on equity is annualized operating income (loss) divided by average common equity, and operating return
on equity excluding the impact of catastrophes and reserve development is
calculated by eliminating the impact of catastrophes and reserve
development on operating income (loss). See footnote 2 for additional discussion of the exclusion of catastrophes and reserve
development. A reconciliation of net income (loss) attributable to Tower Group,
Inc. to operating income (loss) and return on average equity to
operating return on average equity is provided in an accompanying table. |
 2
Fourth Quarter and 2012 Snapshot
Fourth Quarter:
•
Operating loss of $54.9 million due to $80.1 million after-tax loss from
Superstorm Sandy
2012:
•
Operating loss of $27.9 million due to $50.9 million after-tax reserve
strengthening and $80.1 million loss from Superstorm Sandy
»
Excluding Sandy and reserve charges, the core business remains strong
with full year combined ratio of 97.4% and operating ROE of 10.1%
•
Premium growth driven organically
»
Gross premiums written and managed increased 8.8% to $2 billion
»
Two newly created business units generated $195 million GPW in 2012
Canopius merger
•
Key step in executing long-term plan to create a global diversified
specialty insurance company
•
Expect to close in first quarter 2013 |
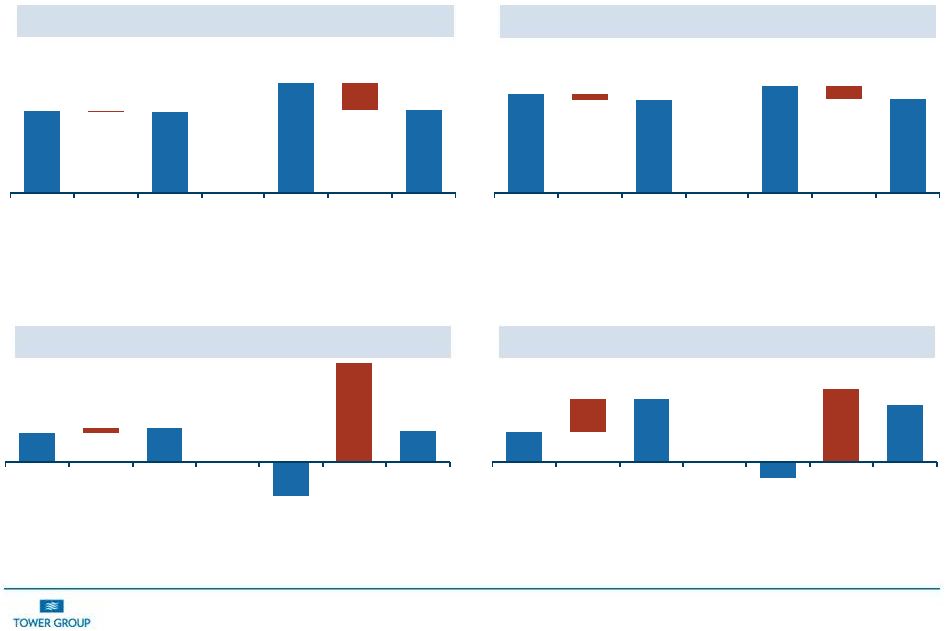
 3
23.5
23.5
27.9
(54.9)
25.2
4.4
80.1
4Q11
Storms &
Dev.
Pro -
Forma
4Q11
4Q12
Storms &
Dev.
Pro -
Forma
4Q12
56.3
115.7
(27.9)
(27.9)
106.4
59.4
134.3
2011
Storms &
Dev.
Pro -
Forma
2011
2012
Storms &
Dev.
Pro -
Forma
2012
0.59
0.70
(1.43)
0.66
0.11
2.09
4Q11
Storms &
Dev.
Pro -
Forma
4Q11
4Q12
Storms &
Dev.
Pro -
Forma
4Q12
1.38
2.83
(0.72)
2.74
1.45
3.46
2011
Storms &
Dev.
Pro -
Forma
2011
2012
Storms &
Dev.
Pro -
Forma
2012
Fourth Quarter and Full Year Highlights
Q4 Operating EPS (Loss)
Full Year Operating EPS (Loss)
Q4 Operating Earnings (Loss) $ in millions
Full Year Operating Earnings (Loss) $ in millions |
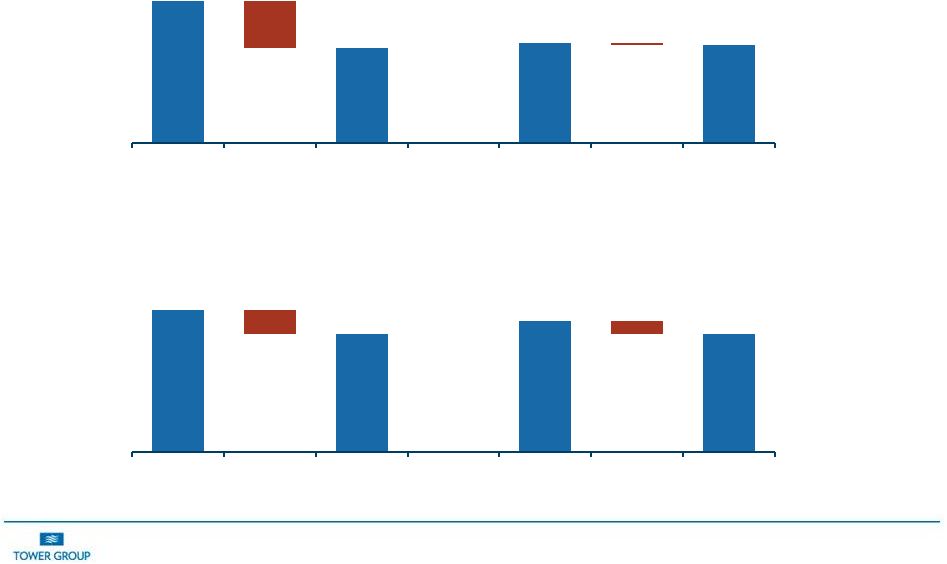
 4
Fourth Quarter and 2012 Highlights
1,034
981
12-31-2011
12-31-2012
26.36
25.54
12-31-2011
12-31-2012
($ millions)
434
481
Q411
Q412
1,811
1,971
2011
2012
*Tower has repurchased $21.0 million of its common stock (1.1
million shares) and has paid $0.75 per share ($29 million) in dividends since 4Q 2011 .
Stockholders' Equity ($ millions)*
Book Value per Share ($)*
Q4 Gross Premiums Written and Managed
Full Year Gross Premiums Written and Managed |
 5
Superstorm Sandy Impact
Tower’s net Losses from Sandy:
•
$123.3 million pre-tax ($80.1 million after-tax)
»
Includes reinstatement premiums and investment loss from Canopius
Through February 24, 2013, Tower has closed 93.7% of 30,511
personal lines claims received by our stock companies and reciprocal
exchanges
•
99% of these claims were received by February 1, 2013
•
$164 million in gross paid claims
2013 reinsurance program will include a 30% quota share of Tower’s
traditional homeowners business to further reduce catastrophic
volatility |
 6
Full Year Business Segment Results
Commercial
Personal
Insurance
General
Specialty
Services
Business Units / Products
Small business;
Middle market
National Programs, E&S,
Customized Solutions,
Transportation and
Assumed Reinsurance
Homeowners and
private passenger
auto
YTD 2012 GPW ($ millions)
$706
$622
$643
$34*
YTD 2011 GPW ($ millions)
718
508
586
31*
2012 % of total GPW
36%
31%
33%
n/a
Commercial Consolidated
Loss Ratio**
73.7%
72.5%
n/a
Expense Ratio
34.3%
40.1%
n/a
Combined Ratio
108%
112.6%
n/a
Retention
81%
85%
n/a
Renewal Premium Change
4.0%
4.6%
n/a
Segment
Summary
* Total revenue for the segment
Expanding small
workers
compensation
business
Seeing signs of
pricing improvement
in the middle
market business
Focus on expanding
relationships with
MGA’s writing
specialty business
Customized
solutions and
assumed
reinsurance
generating organic
growth
Focus on reducing
expenses by
replacing OBPL
systems; rollout of
the new personal
lines system in 1st
half of 2012
Expanding licensing
to expand writings
in other states and
thereby increasing
fee income
** Loss Ratio for 2012 includes 30 points from Superstorm Sandy
|
 7
100.8
94.3
94.3
109.0
96.0
96.0
-6.5
-13.0
2011
Storms &
Dev.
Pro -
Forma
2011
2012
Storms &
Dev.
Pro -
Forma
2012
Fourth Quarter and Full Year Highlights
5.4
11.0
(2.7)
10.1
5.6
12.8
2011
Storms
Pro -
Forma
2011
2012
Storms &
Q2 Dev.
Pro -
Forma
2012
9.0
9.0
10.6
(21.4)
9.6
1.6
30.9
4Q11
Storms
Pro -
Forma
4Q11
4Q12
Storms
Pro -
Forma
4Q12
97.5
95.6
95.6
130.3
98.5
98.5
-1.9
-31.8
4Q11
Storms &
Dev.
Pro -
Forma
4Q11
4Q12
Storms &
Dev.
Pro -
Forma
4Q12
Full Year Operating ROE (%)
Full Year Combined Ratio (%)
4Q Operating ROE (%)
4Q Combined Ratio (%) |
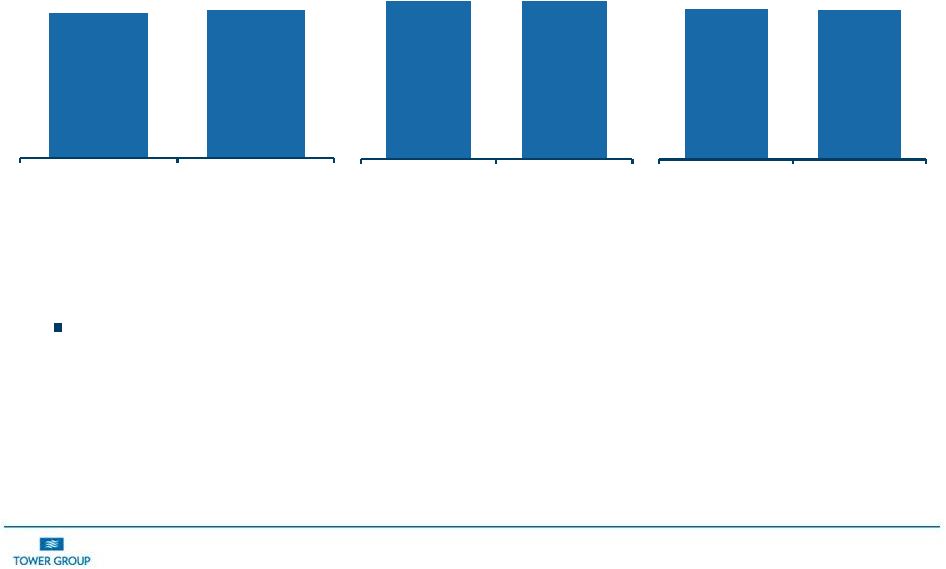
 8
Fourth Quarter and Full Year 2012 Loss Ratio
73.5
60.9
67.6
61.1
-12.6
-6.5
2012
Storms &
Dev.
Pro -
Forma
2012
2011
Storms &
Dev.
Pro -
Forma
2011
Full Year Loss Ratio (%)
2012
2011
91.8
61.7
65.0
63.2
-30.1
-1.8
4Q12
Storms &
Dev.
Pro -
Forma
4Q12
4Q11
Storms &
Dev.
Pro -
Forma
4Q11
Fourth Quarter Loss Ratio (%)
4Q12
4Q11 |
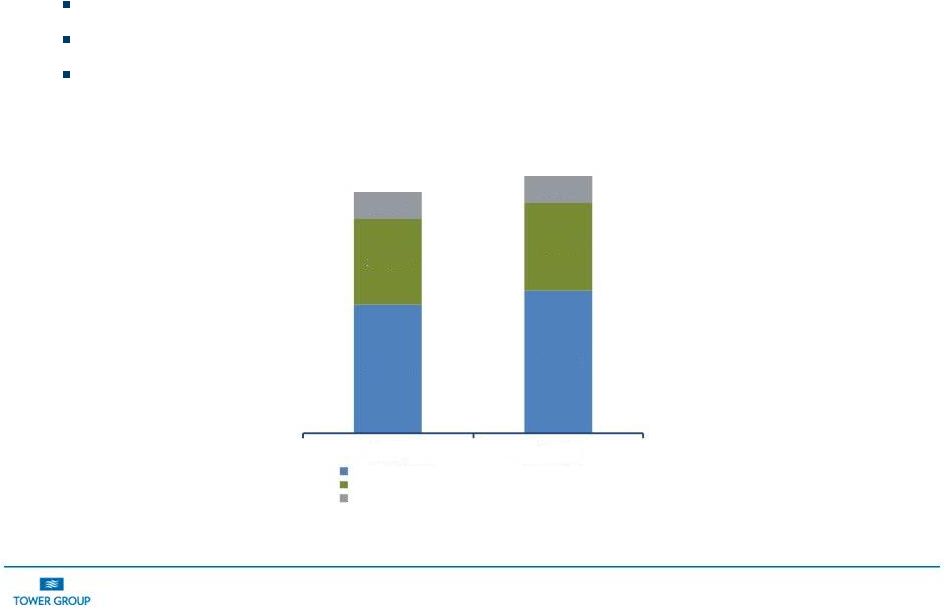 9
Full Year Expense Ratio Excluding Reciprocals
Reinstatement premiums added 1.8 points to fourth quarter 2012 expense
ratio Commission rate higher year over year due to assumed
reinsurance As
systems
initiatives
relating
to
personal
lines
are
completed,
we
expect
scale
advantage to drive expense ratio down
Note: Excludes reciprocals
17.8%
19.7%
11.7%
12.0%
3.7%
3.8%
33.2%
35.5%
2011
2012
Commissions, net of ceding commissions
OUE, net of fees
BB&T expenses |
 10
Fourth Quarter 2012 Investment Performance
Investment income continues to be constrained by low interest
rates, which we are addressing by allocating funds into dividend
paying equity securities and alternative investments. Going
forward, we are continuing to look at real estate and alternative
investments as classes to enhance investment returns.
Note: Cash & Invested Assets, Tax–Equivalent Fixed Income Yield and
Net Investment Income exclude reciprocals $2,359
$2,399
12-31-2012
12-31-2011
Cash and Invested Assets ($millions)
4.7
4.7
4Q 2012
4Q 2011
Tax-
Equivalent Fixed Income
Yield (%)
$127
$126
12-31-2012
12-31-2011
Net Investment Income
($millions) |
 11
Update on Proposed Merger Transaction
Merger agreement with Canopius Holdings Bermuda Limited
(CHBL)
•
Announced July 30, 2012
•
Merger will create new Bermuda-domiciled holding company: Tower
Group International, Ltd. (will continue to trade on NASDAQ under
symbol TWGP)
•
Special meeting of Tower shareholders to approve merger on March
12, 2013
•
CHBL to raise third party capital in the near future
•
Closing expected in March
Financial impact of the merger
•
EPS accretion expected to be over 5% in 2013 and projected to be
over 15% in 2014
•
Expected
to
increase
ROE
to
13%
-
15%
within
18
months
•
Tower Group expects to report 2013 operating earnings per share in
a range of $2.75 to $2.95 including the effect of the proposed
merger transaction |