Attached files
| file | filename |
|---|---|
| 8-K - ROSE 8K 4Q 2012 EARNINGS CALL PRESENTATION - NBL Texas, LLC | rose8k_earningscall.htm |

REDEFINED BUILDING VALUE IN UNCONVENTIONAL RESOURCES Rosetta Resources Inc. Fourth Quarter and Full Year 2012 Earnings Review February 26, 2013 Exhibit 99.1

* Earnings Call Agenda • Opening Remarks Randy Limbacher • Overview Jim Craddock • Financial Update John Hagale • Operational Update John Clayton • Closing Remarks Jim Craddock
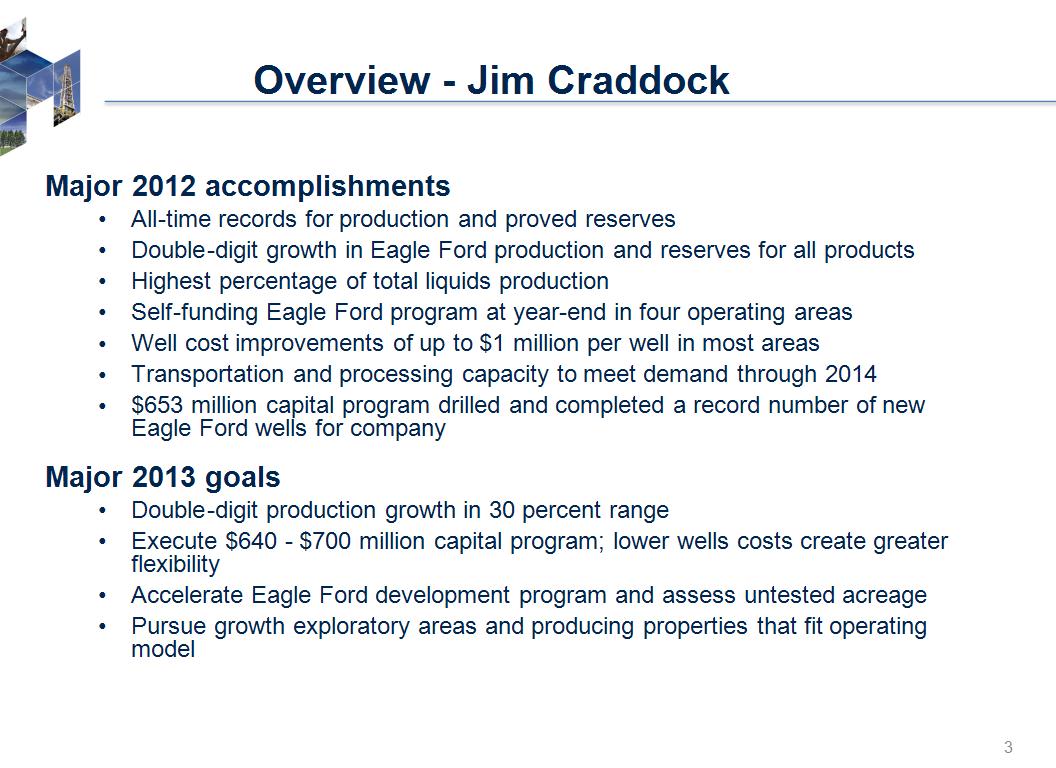
Major 2012 accomplishments All-time records for production and proved reserves Double-digit growth in Eagle Ford production and reserves for all products Highest percentage of total liquids production Self-funding Eagle Ford program at year-end in four operating areas Well cost improvements of up to $1 million per well in most areas Transportation and processing capacity to meet demand through 2014 $653 million capital program drilled and completed a record number of new Eagle Ford wells for company Major 2013 goals Double-digit production growth in 30 percent range Execute $640 - $700 million capital program; lower wells costs create greater flexibility Accelerate Eagle Ford development program and assess untested acreage Pursue growth exploratory areas and producing properties that fit operating model * Overview – Jim Craddock
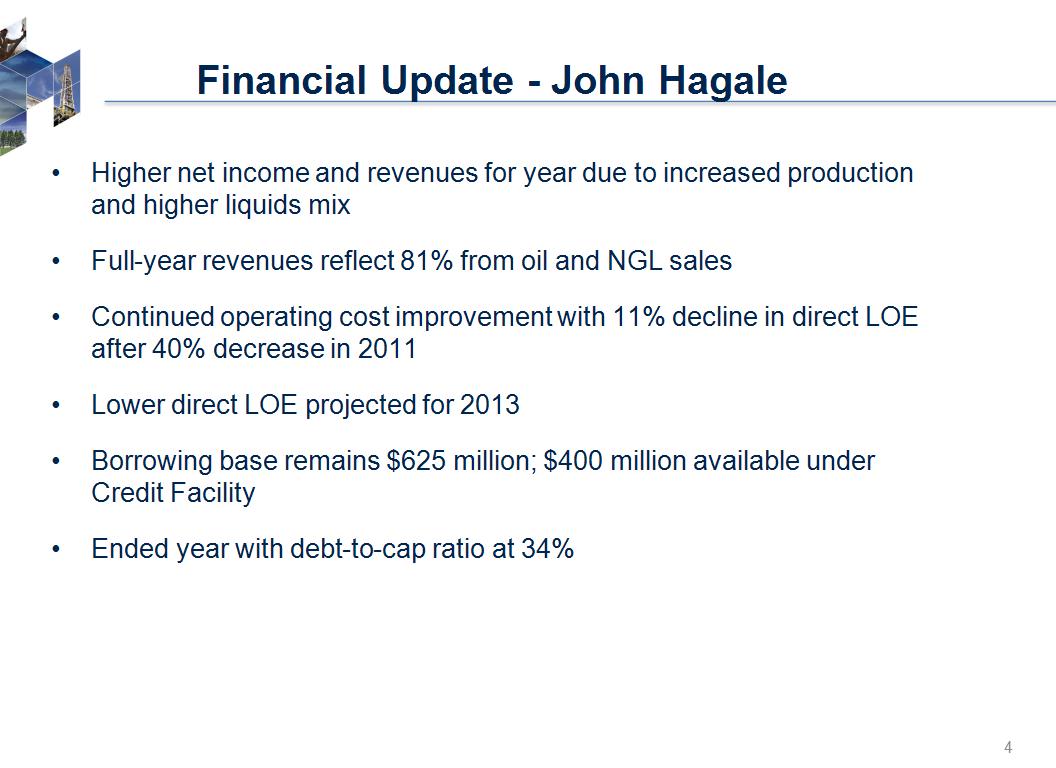
Higher net income and revenues for year due to increased production and higher liquids mix Full-year revenues reflect 81% from oil and NGL sales Continued operating cost improvement with 11% decline in direct LOE after 40% decrease in 2011 Lower direct LOE projected for 2013 Borrowing base remains $625 million; $400 million available under Credit Facility Ended year with debt-to-cap ratio at 34% * Financial Update – John Hagale
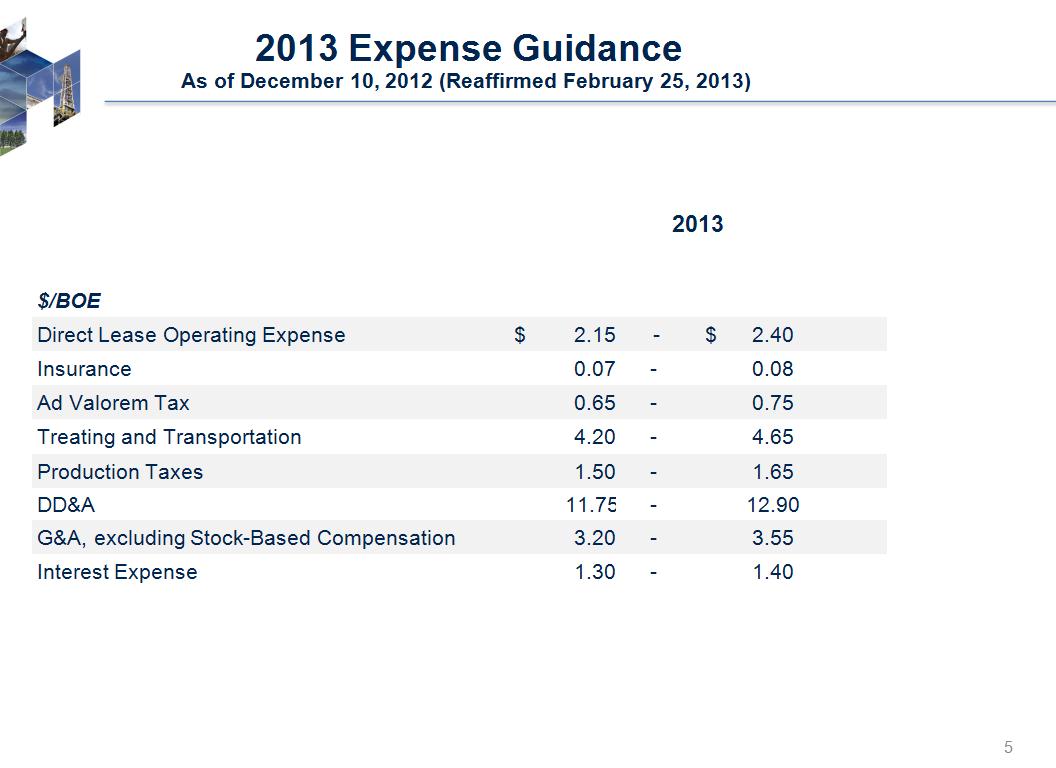
2013 2013 2013 2013 $/BOE Direct Lease Operating Expense $ 2.15 - $ 2.40 Insurance 0.07 - 0.08 Ad Valorem Tax 0.65 - 0.75 Treating and Transportation 4.20 - 4.65 Production Taxes 1.50 - 1.65 DD&A 11.75 - 12.90 G&A, excluding Stock-Based Compensation 3.20 - 3.55 Interest Expense 1.30 - 1.40 * 2013 Expense Guidance As of December 10, 2012 (Reaffirmed February 25, 2013)

Spent $653 million in 2012 capex; drilled 85 gross wells with 100% success rate and completed 64 (62 Eagle Ford) Exited 2012 with total production of 47.3 MBoe/d; 28% oil, 34% NGLs January 2013 production averaged 47.4 MBoe/d; 29% oil, 34% NGLs Operated five rigs, three in Gates Ranch, one in Karnes Trough, and one at Briscoe Ranch Replaced 472% of 2012 production at $10.03/Boe 2013 Guidance Updated capital estimate to range from $640 – $700 million Increased annual production guidance to 47 – 51 MBoe/d Reaffirmed exit rate guidance at 52 – 56 MBoe/d * Operational Update – John Clayton

Feb 25, 2013 2013 Guidance Quarterly Production Performance * % Liquids 14 19 24 29 33 46 51 49 52 59 60 62 62 - 63 % Oil 5 7 10 12 15 18 19 22 22 24 30 26 30 52 - 56 47 - 51

* Karnes Trough Area SUMMARY 1,900 net acres; located in oil window 17 total completions as of 12/31/2012 1Q & 2Q 2012: 9 completions 4Q 2012: 7 completions 8 well locations remaining to be completed 5 wells drilled awaiting completion Well Costs: $7.5 - $8.0 million Activity planned through mid-2013 Klotzman (Dewitt County) 15 total completions as of 12/31/2012 1Q & 2Q 2012: 7 completions 4Q 2012: 7 completions Rosetta-owned oil truck terminal operating since late July 2012 Reilly (Gonzales County) 2 completions as of 12/31/2012 1Q 2012: 1 completion 2Q 2012: 1 completion 5 wells drilled awaiting completion *Seven-day stabilized rate Klotzman 1H Discovery Well Initial Rate* – 11/2011 3,033 Boe/d, 81% Oil (2,450 Bo/d, 250 B/d NGLs, 2,000 Mcf/d) Adele Dubose 1H Delineation Well Initial Rate* – 2/2012 1,463 Boe/d, 76% Oil (1,109 Bo/d, 153 B/d NGLs, 1,200 Mcf/d)
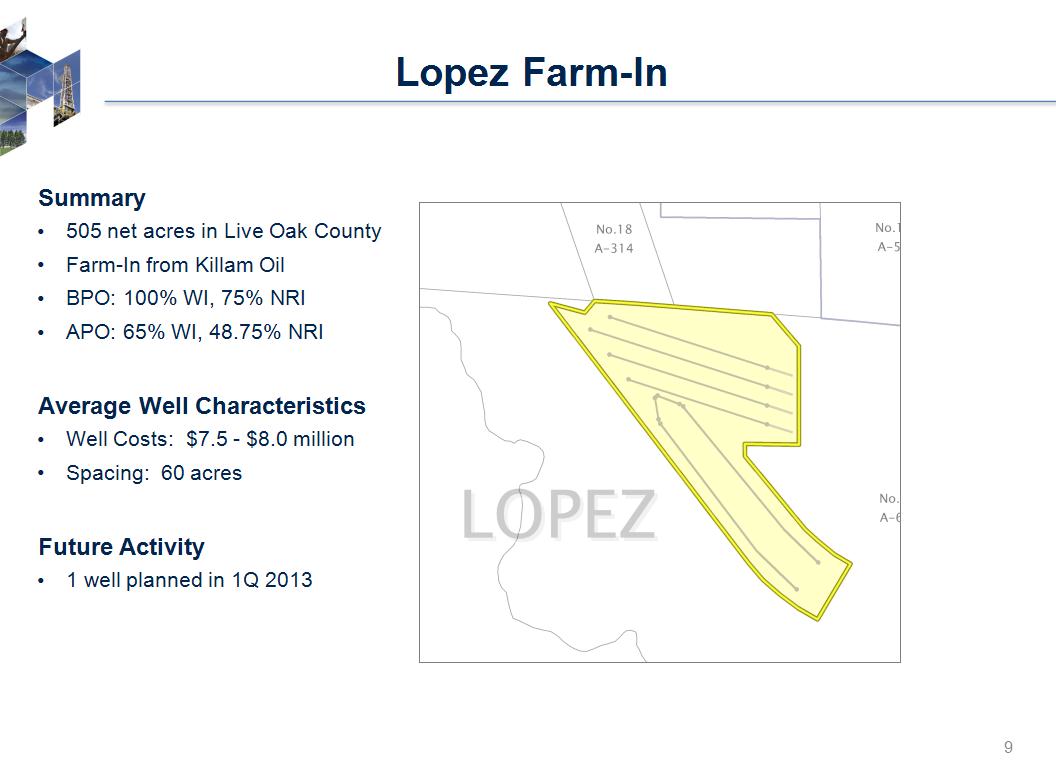
* Lopez Farm-In Summary 505 net acres in Live Oak County Farm-In from Killam Oil BPO: 100% WI, 75% NRI APO: 65% WI, 48.75% NRI Average Well Characteristics Well Costs: $7.5 - $8.0 million Spacing: 60 acres Future Activity 1 well planned in 1Q 2013

Eagle Ford Inventory +/- 900 net wells remaining as of 12/31/2012 * Denotes roughly 12,000 net acres in the liquids window of the play. *

This presentation includes forward-looking statements, which give the Company's current expectations or forecasts of future events based on currently available information. Forward-looking statements are statements that are not historical facts, such as expectations regarding drilling plans, including the acceleration thereof, production rates and guidance, resource potential, incremental transportation capacity, exit rate guidance, net present value, development plans, progress on infrastructure projects, exposures to weak natural gas prices, changes in the Company's liquidity, changes in acreage positions, expected expenses, expected capital expenditures, and projected debt balances. The assumptions of management and the future performance of the Company are subject to a wide range of business risks and uncertainties and there is no assurance that these statements and projections will be met. Factors that could affect the Company's business include, but are not limited to: the risks associated with drilling of oil and natural gas wells; the Company's ability to find, acquire, market, develop, and produce new reserves; the risk of drilling dry holes; oil and natural gas price volatility; derivative transactions (including the costs associated therewith and the abilities of counterparties to perform thereunder); uncertainties in the estimation of proved, probable, and possible reserves and in the projection of future rates of production and reserve growth; inaccuracies in the Company's assumptions regarding items of income and expense and the level of capital expenditures; uncertainties in the timing of exploitation expenditures; operating hazards attendant to the oil and natural gas business; drilling and completion losses that are generally not recoverable from third parties or insurance; potential mechanical failure or underperformance of significant wells; availability and limitations of capacity in midstream marketing facilities, including processing plant and pipeline construction difficulties and operational upsets; climatic conditions; availability and cost of material, supplies, equipment and services; the risks associated with operating in a limited number of geographic areas; actions or inactions of third-party operators of the Company's properties; the Company's ability to retain skilled personnel; diversion of management's attention from existing operations while pursuing acquisitions or dispositions; availability of capital; the strength and financial resources of the Company's competitors; regulatory developments; environmental risks; uncertainties in the capital markets; general economic and business conditions (including the effects of the worldwide economic recession); industry trends; and other factors detailed in the Company's most recent Form 10-K, Form 10-Q and other filings with the Securities and Exchange Commission. If one or more of these risks or uncertainties materialize (or the consequences of such a development changes), or should underlying assumptions prove incorrect, actual outcomes may vary materially from those forecasted or expected. The Company undertakes no obligation to publicly update or revise any forward-looking statements except as required by law. * Forward-Looking Statements and Terminology Used

For filings reporting year-end 2012 reserves, the SEC permits the optional disclosure of probable and possible reserves. The Company has elected not to report probable and possible reserves in its filings with the SEC. We use the term “net risked resources” to describe the Company’s internal estimates of volumes of natural gas and oil that are not classified as proved reserves but are potentially recoverable through exploratory drilling or additional drilling or recovery techniques. Estimates of unproved resources are by their nature more speculative than estimates of proved reserves and accordingly are subject to substantially greater risk of actually being realized by the Company. Estimates of unproved resources may change significantly as development provides additional data, and actual quantities that are ultimately recovered may differ substantially from prior estimates. We use the term “BFIT NPV10” to describe the Company’s estimate of before income tax net present value discounted at 10 percent resulting from project economic evaluation. The net present value of a project is calculated by summing future cash flows generated by a project, both inflows and outflows, and discounting those cash flows to arrive at a present value. Inflows primarily include revenues generated from estimated production and commodity prices at the time of the analysis. Outflows include drilling and completion capital and operating expenses. Net present value is used to analyze the profitability of a project. Estimates of net present value may change significantly as additional data becomes available, and with adjustments in prior estimates of actual quantities of production and recoverable reserves, commodity prices, capital expenditures, and/or operating expenses. * Forward-Looking Statements and Terminology Used (cont.)