Attached files
| file | filename |
|---|---|
| 8-K - FORM 8-K - Diamond Foods Inc | d492311d8k.htm |
 February 2013
Diamond Foods
Building Sustainable Premium Brands
Exhibit 99.1 |
 1
Important Information
This presentation includes forward-looking statements, including statements
about our future financial and operating
performance
and
results,
competitive
advantages
of
our
products,
progress
on
brand
growth
strategies, impact of walnut supply, trends in promotional spend, estimated cost
savings from optimizing cost
structure
and
possible
restructuring
of
our
balance
sheet.
These
forward-looking
statements
are
based
on our assumptions, expectations and projections about future events only as of
the date of this presentation, and
we
make
such
forward-looking
statements
pursuant
to
the
“safe
harbor”
provisions
of
the
Private
Securities Litigation Reform Act of 1995.
Many of our forward-looking statements include discussions of
trends
and
anticipated
developments
under
the
“Risk
Factors”
and
“Management’s
Discussion
and
Analysis
of
Financial
Condition
and
Results
of
Operations”
sections
of
the
periodic
reports
that
we
file
with
the
SEC.
We
use
the
words
“anticipate,”
“believe,”
“estimate,”
“expect,”
“intend,”
“plan,”
“seek,”
“may”
and
other
similar expressions to identify forward-looking statements that discuss our
future expectations, contain projections
of
our
results
of
operations
or
financial
condition
or
state
other
“forward-looking”
information.
You also should carefully consider other cautionary statements elsewhere in this
presentation and in other documents we file from time to time with the
SEC. We do not undertake any obligation to update forward-
looking
statements
to
reflect
events
or
circumstances
occurring
after
the
date
of
this
presentation.
Actual
results may differ materially from what we currently expect because of many risks
and uncertainties, such as:
risks
relating
to
our
leverage
and
its
effect
on
our
ability
to
respond
to
changes
in
our
business,
markets
and
industry;
increase
in
the
cost
of
our
debt;
ability
to
raise
additional
capital
and
possible
dilutive
impact
of raising such capital; risks relating to litigation and regulatory proceedings;
uncertainties relating to relations with
growers; availability and cost of walnuts and other raw materials; increasing competition and
possible
loss
of
key
customers;
and
general
economic
and
capital
markets
conditions.
Diamond
Foods
separately reports financial results using non-GAAP financial measures; a
reconciliation of Diamond’s financial results determined in
accordance with GAAP can be found in our press release. |
 2
Who we Are
Building a company focused
on sustainable, profitable
growth
Diamond is an innovative
packaged food company
focused on building and
energizing brands |
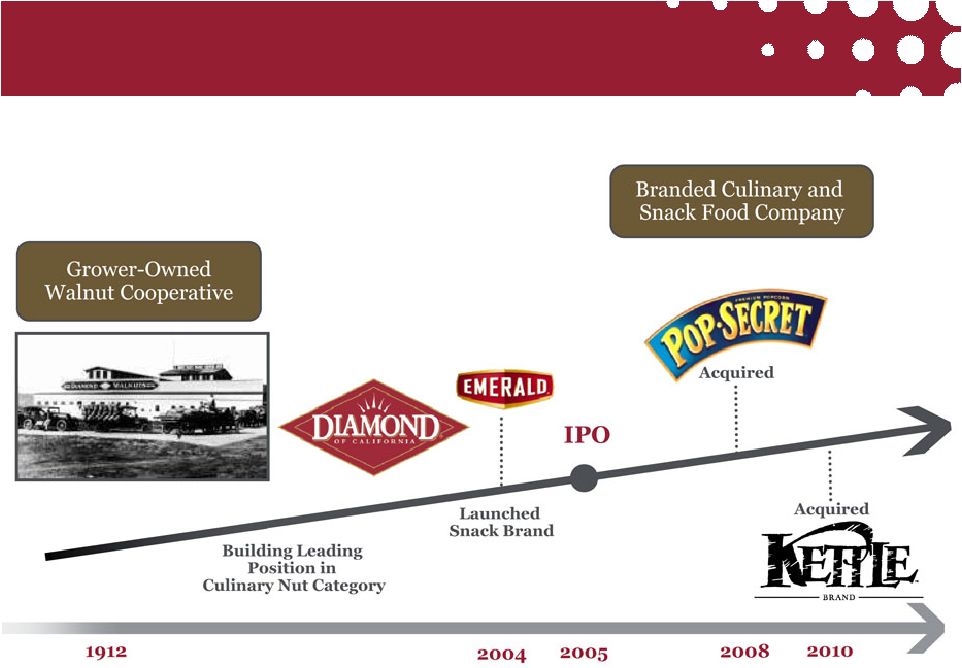 3
Company History |
 4
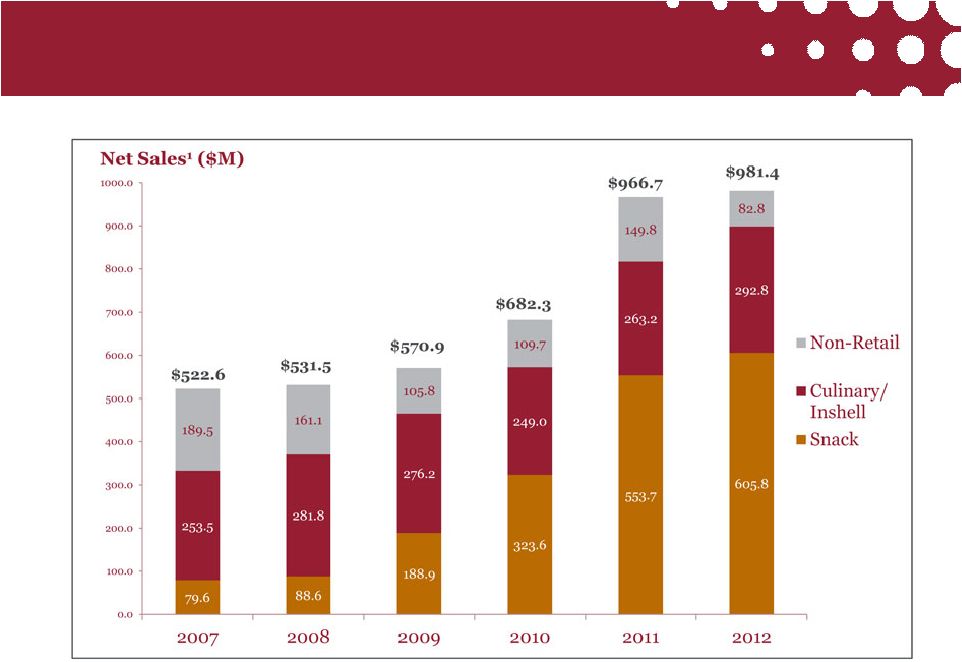
Revenue Mix Has Changed Significantly
Over Time
1
Numbers rounded |
  5
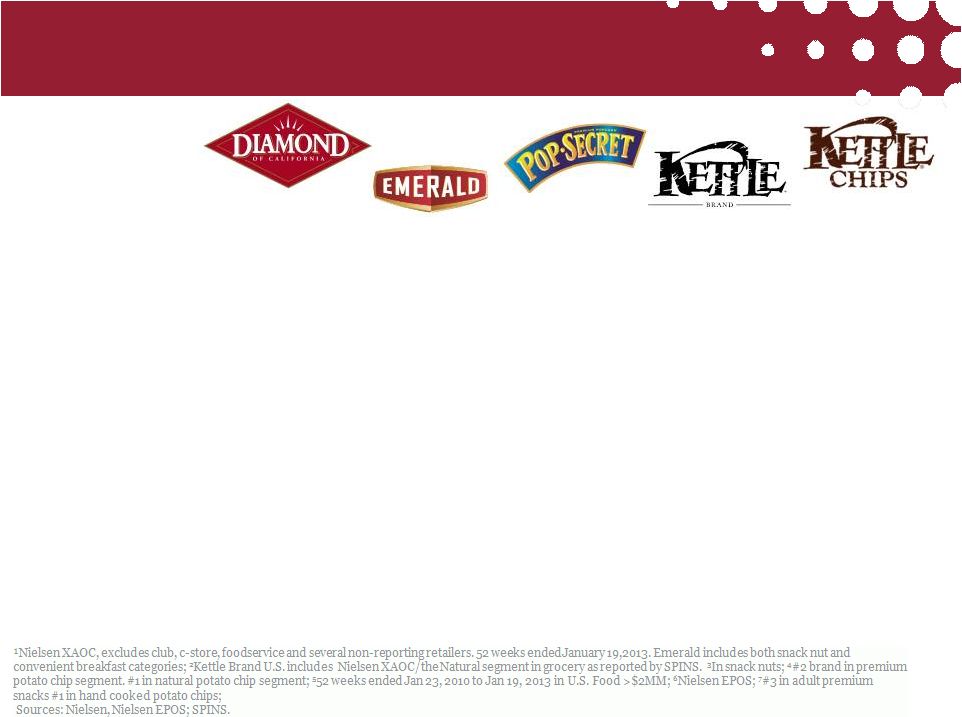
Our brands compete in large and growing categories, possess insulating
competitive advantages and have the range to allow us to compete in
complimentary segments. Transformation into a Branded Snack Player
Brands in the Portfolio
Category Size¹
($B)
$1.1B
$6.0B
$0.9B
$5.8B/$0.2B
$3.4B
6
Category Growth¹
(%)
6.7%
4.9%
0.7%
6.2%/4.0%
5.4%
Brand Position
#1
#3³
#2
#2/#1
2,4
#3
7
Market Share
24.4%¹
6.3%
1,3
22.3%¹
2.6%/58.4%²
4.4%
Brand Highlights
Branded
category leader
with 100 years
of history
Brand extended
to broader U.S.
Grocery
convenient
breakfast
category in 2011
Has gained 400
basis pts of
share in past
three years
5
Leading potato
chip brand in
natural
segment; over
3x the size of the
next largest
brand
Leading
premium potato
chip brand in
U.K. Named to
U.K.
“Superbrands”
list in 2012
2
2 |
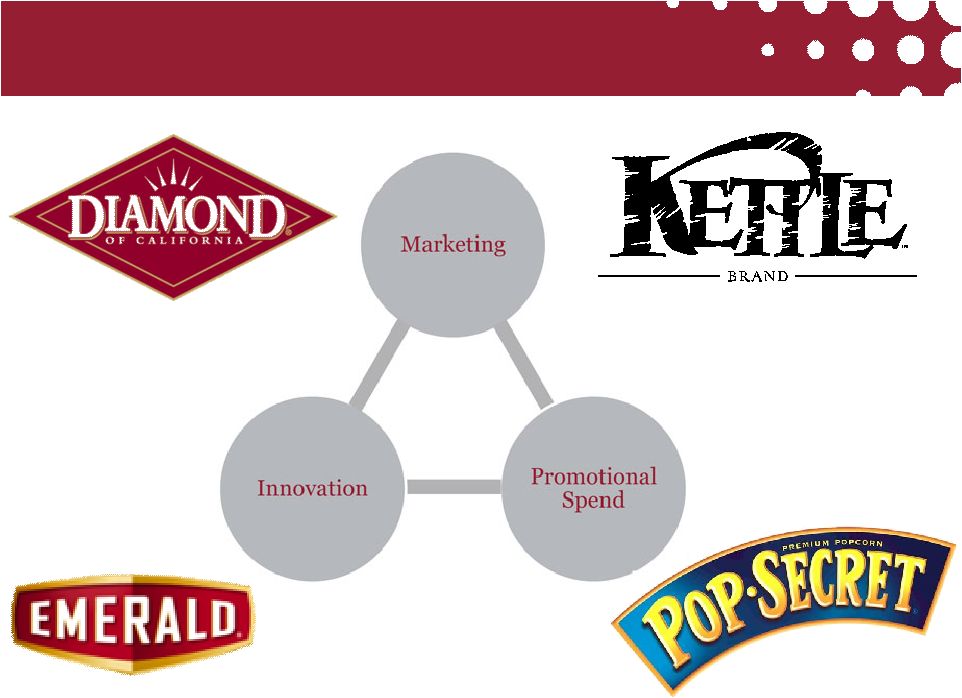
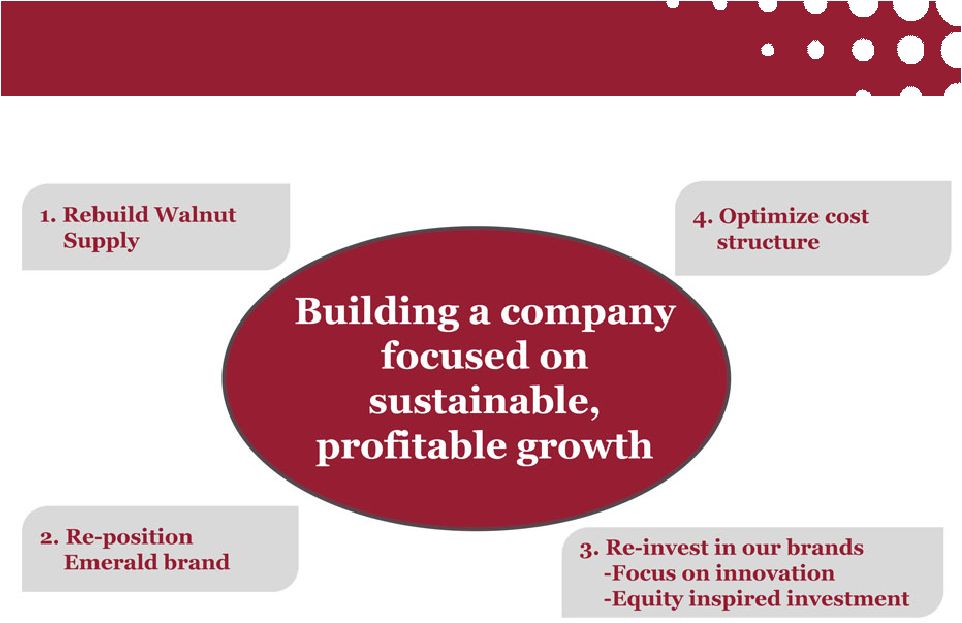 6
Diamond is Focused on Four Key Initiatives |
 7
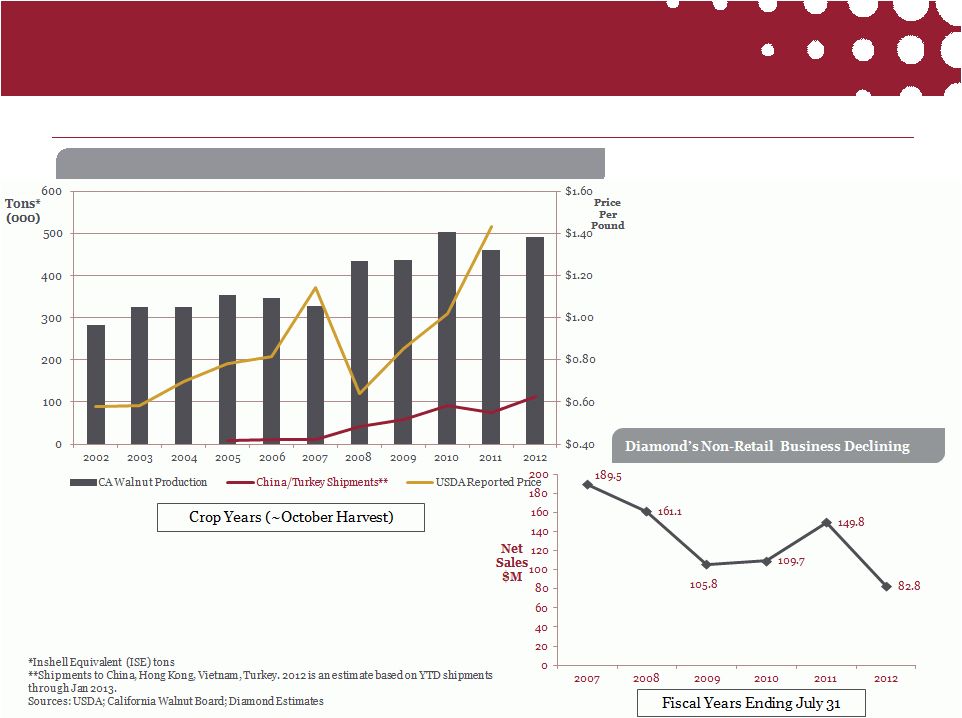
1. Rebuild Walnut Supply
Both Price and Supply of Walnuts Have Grown Rapidly
California Walnut Production , China/Turkey Demand and Reported Price
|
 8
1.
Competitive pricing and contract terms
2.
Grower incentives
3.
Expanded grower services team
4.
Grower Advisory Board
5.
Continued leadership in grower services
6.
Significant increase in investment in Diamond brand culinary nuts
1. Rebuild Walnut Supply
Actions we are taking |
 9
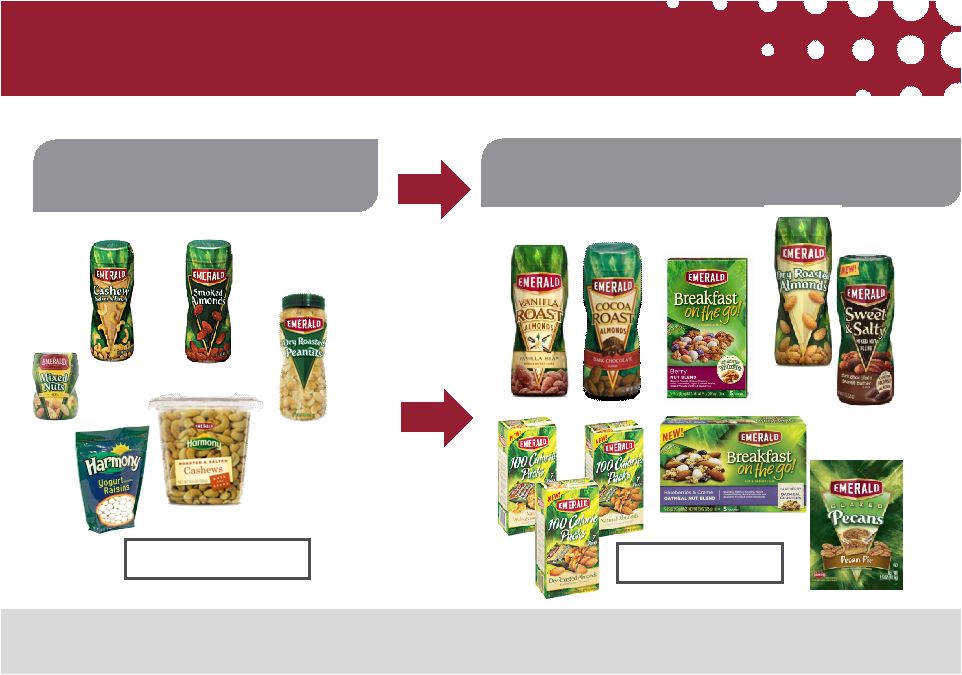
2. Re-Position the Emerald brand
From: Top Line Focus
To: Sustainable Growth Focus
Focusing the portfolio on “insulated”
items
< 90 SKUs
> 250 SKUs |
 3.
Re-invest in our Brands 10 |
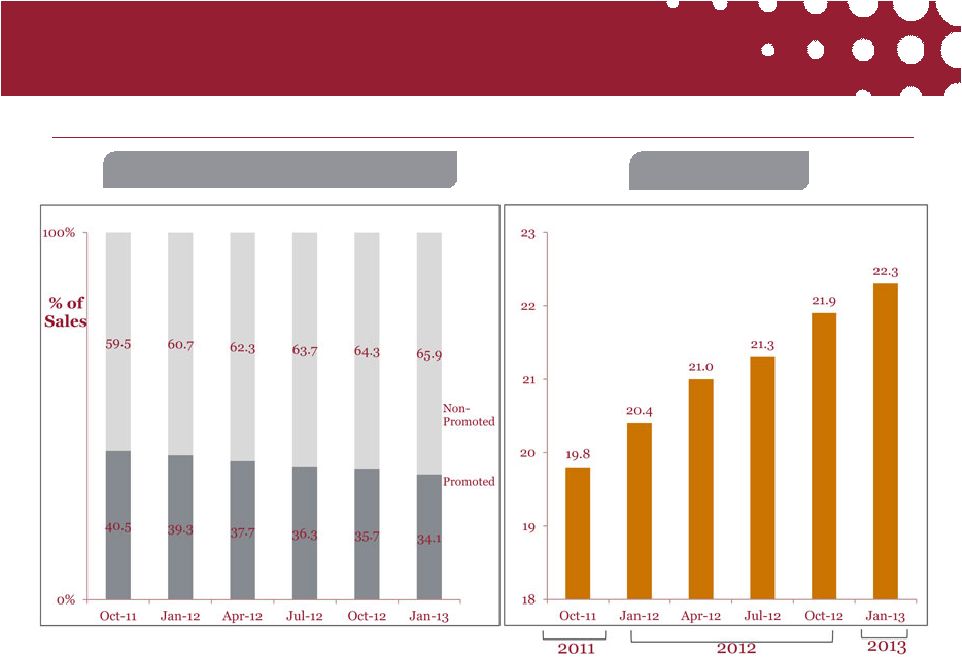 3.
Re-invest in our Brands: Pop Secret (I) Pop-Secret Reducing
Reliance on Promotional Spend while Improving Market Share
Promoted/Non-Promoted Sales*
Market Share *
*52 Week Periods in U.S. xAOC
Source: Nielsen
11 |
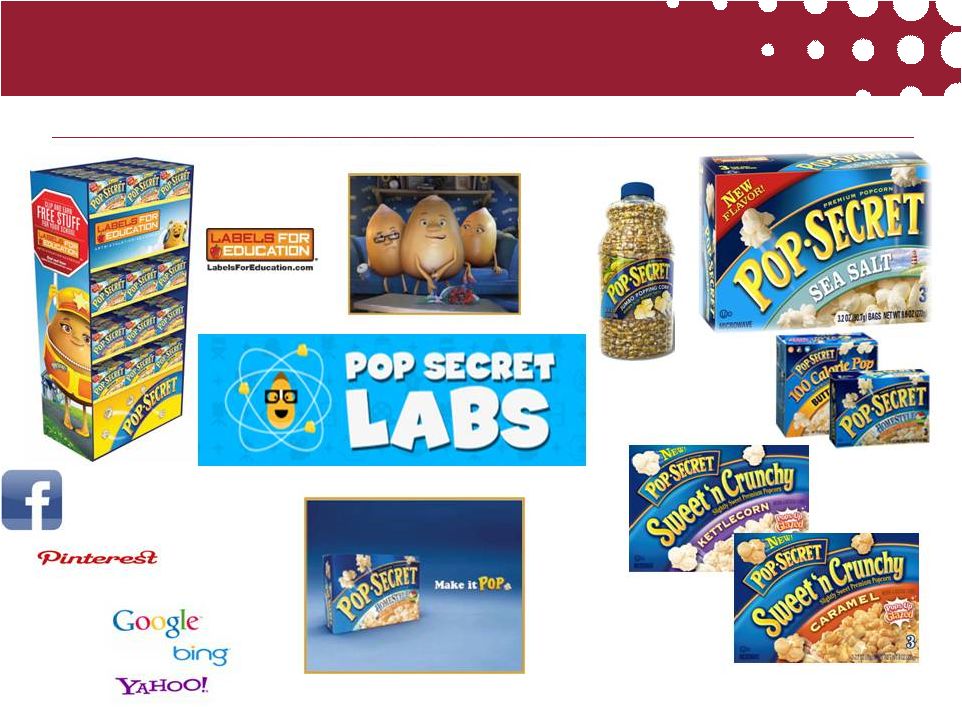 3.
Re-invest in our Brands: Pop Secret (II) Pop-Secret Investing
in Consumer Support and Innovation Search
Social
Digital
Media
12 |
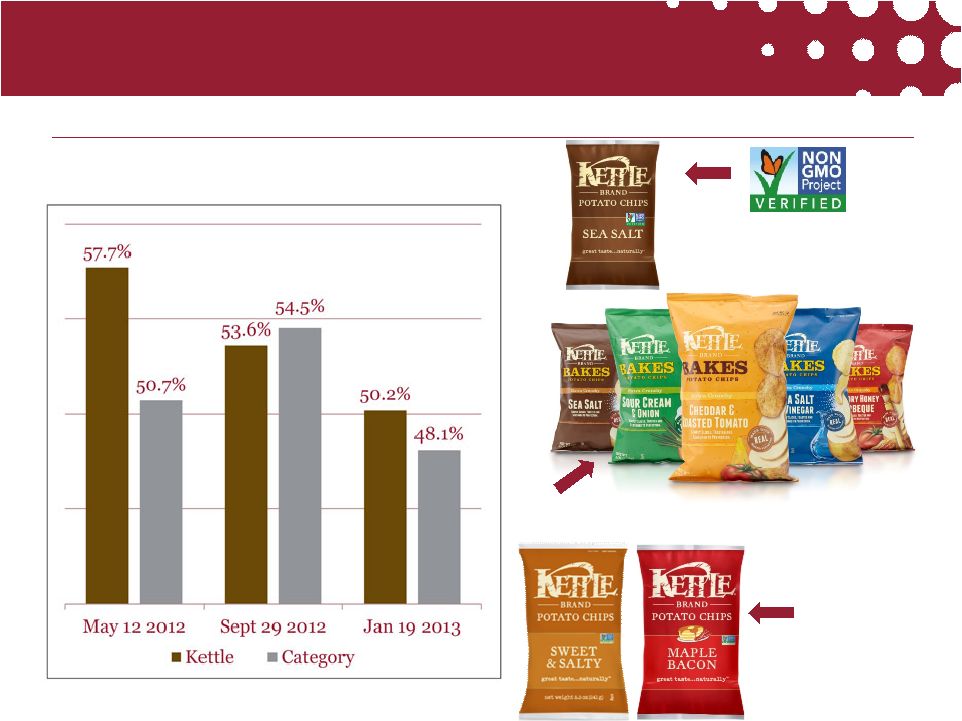 Kettle focus more balanced between innovation and promotional spending
Percent of Sales Sold on Promotion*
*Premium Kettle style segment of potato chip category
Source: Nielsen U.S. >$2MM, 12 week periods
First Potato Chip with Non-
GMO Project Verification
Only Baked Potato Chip made with real sliced potatoes
New On-Trend
Flavors
3. Re-invest in our Brands: Kettle Brand
13 |
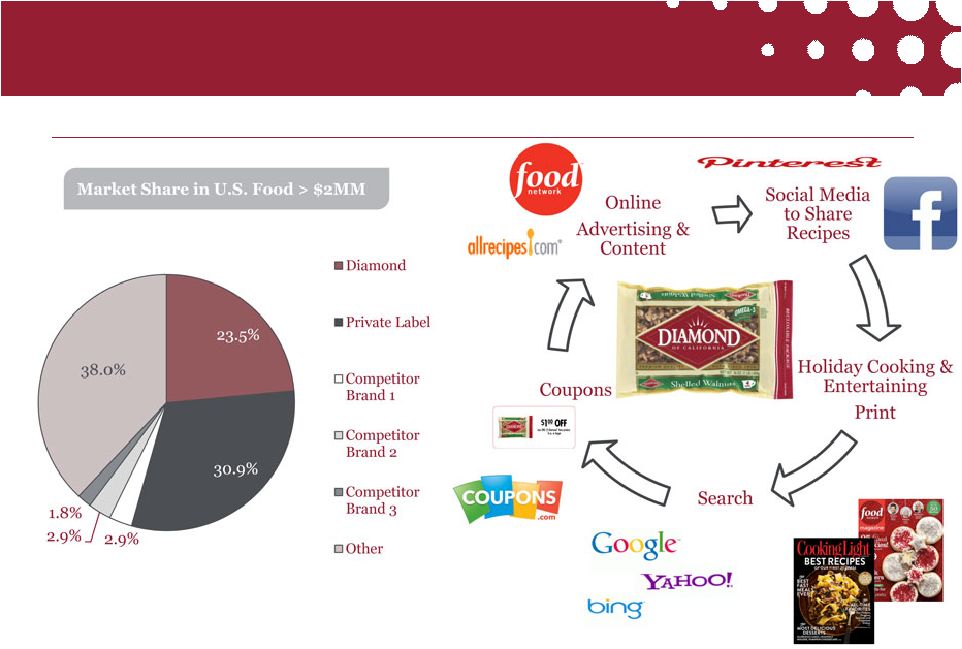 Source: Nielsen U.S. Food, 52 weeks ended Jan 19, 2013
3. Re-invest in our Brands: Diamond of
California
Diamond, the branded leader in Culinary Nuts supported by marketing focused on
foodies, bakers and cooks who value quality 14
|
 4.
Optimize Cost Structure Operations
•
Capacity rationalization
•
Productivity
•
Transportation and
Warehousing
•
Supplier Contracts
•
Formulation and
Packaging Optimization
Sourcing
SG& A
Cost savings estimated to be in the range of $20-40M
15 |
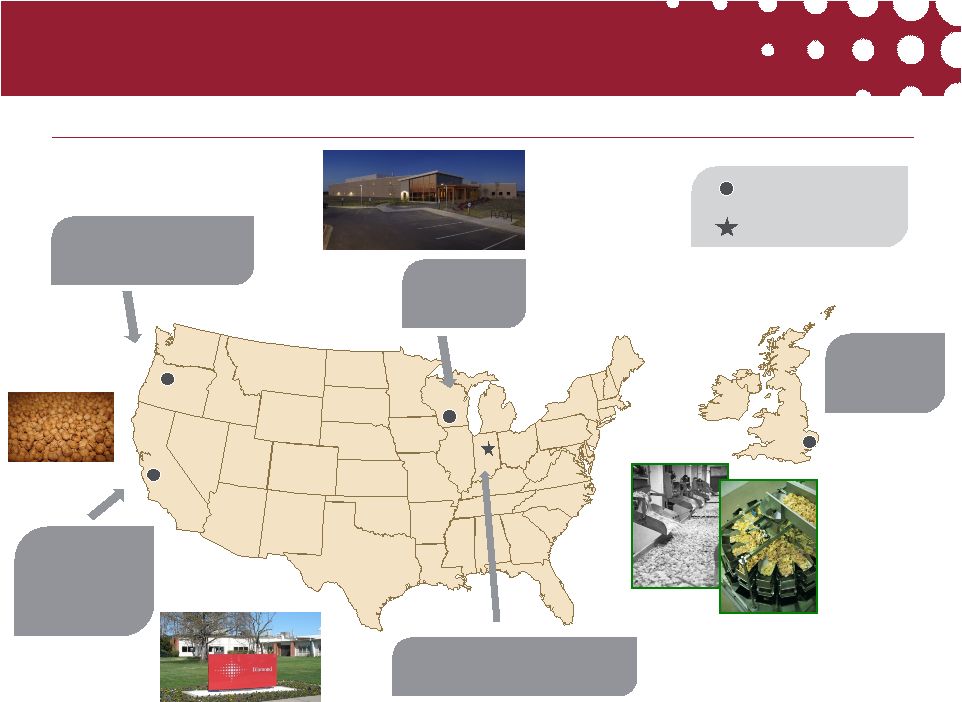 4. Optimize Cost Structure
Manufacturing Footprint
Beloit, WI
Salem, OR
Norwich, England
Stockton, CA
Van Buren, IN
Doubled
capacity in
2012
Added additional 25%
capacity in 2011
Consolidating
all Emerald
production
Added
packaging
capacity in
2011/2012
Recently closed Fishers, IN
Emerald production facility
Production Facility
Co-Pack Facility
16 |
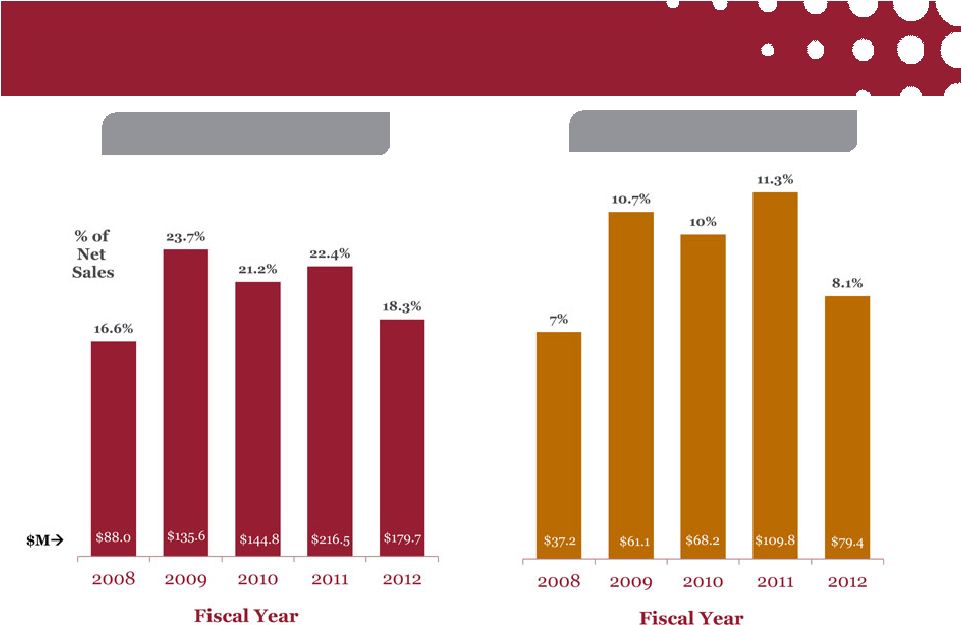 * Calculated as Earnings before Interest and Taxes, excluding costs associated
with acquisitions and integration , warrant liability expense, certain SG&A costs related to Audit
Committee investigation, re-statement related expenses., consulting fees,
retention and severance, stock based compensation and depreciation and amortization.
Financial Performance
Gross Margin
Adjusted EBITDA* Margin
17 |
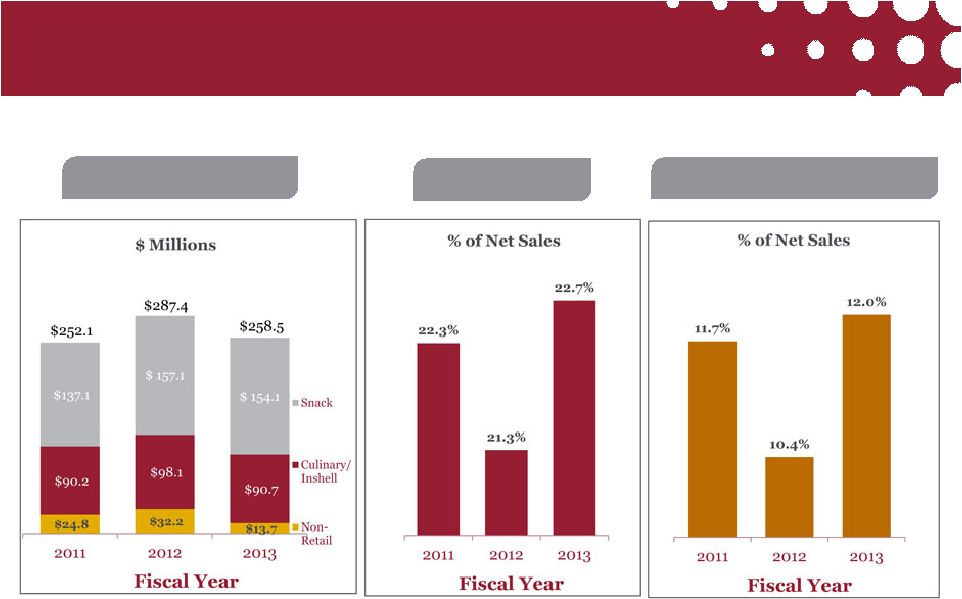 Q1
Performance Over Past Three Years Gross Margin
Revenue –
Net Sales
Adjusted EBITDA* Margin
* Calculated as Earnings before Interest and Taxes, excluding costs associated
with acquisitions and integration , warranty liability expense, certain SG&A costs related to Audit
Committee investigation, re-statement related expenses., consulting fees,
retention and severance, stock based compensation and depreciation and amortization.
18 |
 Overview of Selected Elements of the
Balance Sheet
Bank Revolving Credit
Facility
Bank Term Loan facility
Kettle Guaranteed Loan
Oaktree Senior Notes
Oaktree Warrants
•
Libor + 550 basis points, with 1.25% floor
•
Maturity: Feb 25, 2015
•
Approximately $133M outstanding on the $255M revolving
facility as of Jan 31, 2013
•
Revolving credit facility decreases to $230M in July, 2013
•
$218M balance on term loan on October 31, 2012
•
Quarterly term payments $909K
•
Low interest,
fixed rate loan
•
Established as
part of Beloit
plant expansion
•
$18.2M balance
as of Oct 31, 2012
•
$225M unsecured senior notes
•
12% coupon, PIK at company’s option for first two years
•
Call premium, currently 101%, goes to 112% on May 29, 2013
•
Maturity 2020
•
For ~4.4M shares with exercise price of $10 per share
•
Implied ownership of 16.4% on fully diluted basis at close
19 |
 Diamond Foods
Building a company focused
on sustainable, profitable
growth
20 |
 Non-GAAP Reconciliation
($Millions, except per share amounts)
Q1’13
2012
2011
2010
2009
2008
GAAP Net Sales
$258.5
$981.4
$966.7
$682.3
$570.9
$531.5
GAAP Cost of Sales
$199.9
$801.7
$750.2
$537.5
$435.3
$443.5
GAAP Operating Expense
$54.7
$230.4
$162.9
$109.6
$89.8
$64.1
Adjustment for acquisition and integration
related expenses; loss on warrant liability;
stock based compensation; asset
impairment; forbearance fees; fees for tax
projects; certain SG&A costs
1
($18.0)
($92.6)
($20.4)
($12.1)
--
--
Non-GAAP Operating Expense
$36.7
$137.8
$142.5
$97.5
$89.8
$64.1
Non-GAAP Income from Operations
$21.9
$41.9
$74.0
$47.4
$45.8
$23.9
Stock-based compensation expense
$1.2
$9.2
$7.7
$3.7
$3.9
$6.9
Depreciation and Amortization
$7.9
$28.3
$28.1
$17.2
$11.4
$6.4
Adjusted EBITDA
$31.0
$79.4
$109.8
$68.2
$61.1
$37.2
GAAP Interest
$13.9
$34.0
$23.9
$10.2
$6.3
$1.0
GAAP Income Tax Expense (Benefit)
$0.6
$1.7
$3.1
$7.5
$14.9
$8.1
Tax effect of Non-GAAP adjustments
$2.4
($4.1)
$7.0
$4.8
$0.4
--
Non-GAAP Income Tax Expense (Benefit)
$3.0
($2.4)
$10.1
$12.4
$15.3
$8.1
GAAP Net Income
($10.7)
($86.3)
$26.6
$15.7
$23.7
$14.8
Non-GAAP Net Income
$5.2
$12.7
$39.9
$24.8
$24.3
$14.8
GAAP EPS Diluted
($0.49)
($3.98)
$1.17
$0.82
$1.44
$0.91
Non-GAAP EPS Diluted
$0.21
$0.58
$1.76
$1.29
$1.47
$0.91
1
Related primarily to audit committee investigation, restatement related expenses,
consulting fees, retention and severance 21 |