Attached files
| file | filename |
|---|---|
| 8-K - 8-K - DELUXE CORP | a13-6108_18k.htm |
Exhibit 99.1
|
|
First Quarter – 2013 Deluxe Corporation Overview, Strategy and Financial Information |
|
|
2 Presentation Scope Comments are limited to information already publicly released: 10-K for 2012, filed February 22, 2013 All estimates and projections are subject to risks and uncertainties that could cause actual future results to differ materially from those estimated or projected. Additional information about various factors that could cause actual results to differ from those projected are contained in the Company’s Form 10-K for the year ended December 31, 2012 All forward-looking statements included in this presentation are based upon information available to Deluxe as of the date hereof and Deluxe assumes no obligation to update or revise any such forward-looking statements Non-GAAP financial measures are reconciled to the comparable GAAP financial measure in our quarterly earnings releases furnished on Form 8-K, and posted on www.deluxe.com/investor |
|
|
3 Lee Schram Chief Executive Officer Terry Peterson SVP and Chief Financial Officer Jeff Johnson Treasurer and VP, Investor Relations Deluxe Spokespeople |
|
|
4 Who Is Deluxe? Financial Services Small Business Services Direct Checks Leading provider of products and services to financial institutions ~5,700 FI customers Adjusted operating margin 23.4% America’s leading direct-to-consumer check supplier ~8 million customers Adjusted operating margin 31.4% (23%) (14%) Marketing Solutions & Other Services Forms, accessories, & other products Checks Revenue: $1.51B (7% growth) Adjusted Operating Income: $313M Adjusted EPS: $3.53 Cash From Operations: $244M 2012 (63%) Leading provider of personalized products and services to small businesses ~4M customers; ~550K web-sites Adjusted operating margin 17.4% MOS MOS FORMS CHECKS MOS FORMS CHECKS FORMS CHECKS $1.51B revenue company transforming to marketing solutions and other services provider that helps Small Businesses and Financial Institutions grow |

|
|
Small Business Core Products Grow online, distributor, major accounts Improve segmented customer focus Small Business Marketing Solutions and Other Services Grow web design / hosting, web-to-print, SEM/SEO, logo, social media, payroll, fraud & security Financial Institutions Grow check share Expand marketing solutions and other services (customer acquisition, risk management, profitability analytics and new services opportunities) Direct-to-Consumer Optimize cash flow Scale WishingTreeDesignsTM Cost Reductions and Simplification Continuous improvement / lean / annual cost reduction initiative 5 Become the best at helping small businesses and financial institutions grow By Offering A suite of life-cycle driven solutions that help customers grow, operate and protect their business Strategy / Key Focus Areas Strategy Five Key Focus Areas to Deliver Strategy |
|
|
Growth Driven by Changing Mix 6 Checks SB – market declines; high security checks FS – ~5-6% unit decline; Titan gains; 90% retention DC – upper single-digit unit declines Differentiated technology flat packaging, digital, online portal / dashboard tools Marketing Solutions and Other Services SB – Web design / hosting, Web-to-Print, SEM/SEO, logo, payroll, marketing, fraud & security, social media FS – customer acquisition, risk management, profitability analytics DC – fraud & security Revenue $ (in millions) % of Total Revenue % of Total Revenue Checks Marketing Solutions and Other Services Revenue $ (in millions) $162 $188 $223 $286 12 % 13 % 16 % 19 % 0 50 100 150 200 250 300 2009 2010 2011 2012 $854 $897 $872 $890 64 % 64 % 61 % 59 % 300 400 500 600 700 800 900 1000 2009 2010 2011 2012 |

|
|
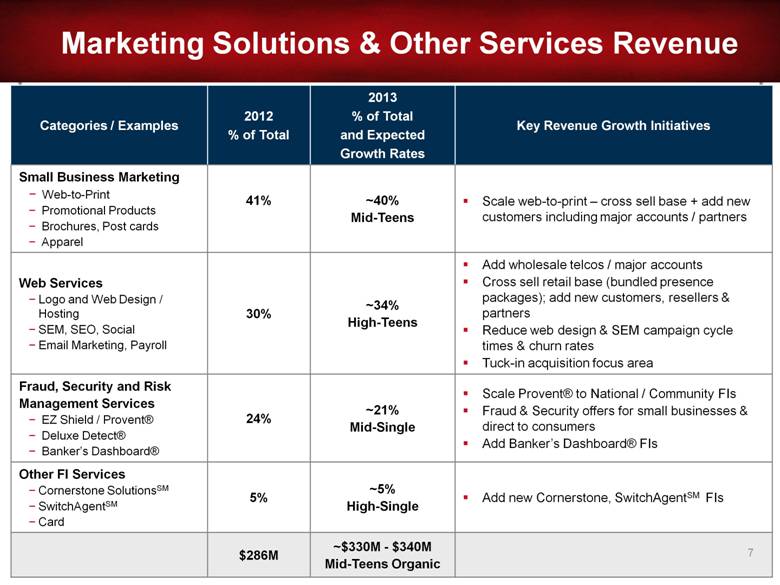
7 Marketing Solutions & Other Services Revenue Categories / Examples 2012 % of Total 2013 % of Total and Expected Growth Rates Key Revenue Growth Initiatives Small Business Marketing Web-to-Print Promotional Products Brochures, Post cards Apparel 41% ~40% Mid-Teens Scale web-to-print – cross sell base + add new customers including major accounts / partners Web Services Logo and Web Design / Hosting SEM, SEO, Social Email Marketing, Payroll 30% ~34% High-Teens Add wholesale telcos / major accounts Cross sell retail base (bundled presence packages); add new customers, resellers & partners Reduce web design & SEM campaign cycle times & churn rates Tuck-in acquisition focus area Fraud, Security and Risk Management Services EZ Shield / Provent® Deluxe Detect® Banker’s Dashboard® 24% ~21% Mid-Single Scale Provent® to National / Community FIs Fraud & Security offers for small businesses & direct to consumers Add Banker’s Dashboard® FIs Other FI Services Cornerstone SolutionsSM SwitchAgentSM Card 5% ~5% High-Single Add new Cornerstone, SwitchAgentSM FIs $286M ~$330M - $340M Mid-Teens Organic |
|
|
Advertising campaign: Television commercials, late 2012 Television, print ads, digital online and radio, staggered throughout 2013 Brand Awareness Campaign Link to Deluxe Work Happy videos |
|
|
9 Social Media Market Intelligence Branding Promoting Operating Mobile Branding Logo Design Imaging/ Promo Mobile Promotions SEM /SEO Services E-mail Marketing Direct Mail Full Color/ Web-to-Print Security/ Fraud Prot. Payroll Services Other Printed Prod. Checks, Forms Web Hosting Web Design Selling Small Business Workflow Grow core products Grow e-commerce Improve segmentation Enhance channels Grow marketing solutions and other services SBS Strategic Execution Roadmap Small Business Services Channels Services Wholesale Services Retail Distributor Major Accounts Dealer Call Center Online Partners Financial Institutions |
|
|
10 Grow check share (technology focus) FS Strategic Execution Roadmap Grow marketing solutions & other services Financial Services Customer Acquisition Risk Management Loyalty SwitchAgentSM Onboarding Cornerstone Analytics Dashboard Provent® Detect Marketing Solutions & Other Services Offers COFS “Automated Flats Packaging” Vaya “FI Reporting Dashboard & Consultative Tools” |
|
|
11 Revenue $ in millions Cash from Operations $ in millions Net Debt Outstanding(2) $ in millions Adjusted EPS excludes $0.50 in 2009, $0.21 in 2010, $0.31 in 2011 and $0.21 in 2012 for costs related to net loss on repurchases of debt, restructuring, asset impairment charges, transaction related costs and tax impact of health care legislation (see page 16 for reconciliation) Net debt outstanding includes cash and cash equivalents of $13M in 2009, $17M in 2010, $29M in 2011 and $45M in 2012 see page 18 for reconciliation) Delivered Another Outstanding Year of Growth Expect Continued EPS and Revenue Growth in 2013 Strong Financial Performance Diluted EPS – Adjusted(1) From continuing operations $756 $738 $713 $608 2009 2010 2011 2012 $1,344 $1,402 $1,418 $1,515 2009 2010 2011 2012 $206 $213 $235 $244 2009 2010 2011 2012 |
|
|
EBITDA Margin Trends 12 Core Deluxe MOS EBITDA % (Scale does not start at 0) Ranges from historic to strategic time frames Key Highlights / Takeaways MOS currently contributing double-digit EBITDA margins & expanding Largest component of MOS, small business marketing (products), has higher gross margin than services MOS EBITDA margins lower as absorbing disproportionate share of investment, but expanding Expect Deluxe EBITDA margins to expand only slightly over strategic period with MOS EBITDA expected to expand at faster rate due to: Web services & SEM/SEO scale leverage driven by telco / media / partner migrations Integrating & extending current portfolio Effectively acquiring & retaining customers across multiple channels Building more effective retail services sales model Strong track record of cost reductions & operating margin expansion as MOS mix of revenue grows 1. 2. 3. 4. 5. |

|
|
13 Capital Structure Strategy Our strong cash flow, strengthened balance sheet and flexible capital structure position us well to continue advancing our transformation Expect to: Invest organically Small to medium-sized acquisitions Maintain current dividend level Repurchase shares to off-set dilution Excess used to accumulate cash to pay down debt 13 Debt Outstanding At 12/31/2012 = $653M Cash and Cash Equivalents At 12/31/2012 = $45M Bonds and notes Credit facility Year and Amount of Debt Maturity (1) Face value of 2014 notes is $254M. The carrying amount has increased $3M due to changes in fair-value of the hedged debt. (2) Face value of 2020 notes is $200M. The carrying amount has decreased $4M due to changes in fair-value of the hedged debt. (1) (2) $0 Draw L+ ~2% |
|
|
14 (1) The annual savings noted are net of investment – measured on a year-over-year basis (2) Reductions not linear in 2013 1/3 COGS 2/3 SG&A $15M $105M $155M $260M $325M Delivered $435M annual net cost savings mid-2006 to 2012(1) Target $50M incremental net cost savings in 2013(2) Cost Reduction Plan Cumulative Savings $385M $435M |
|
|
15 Why is Deluxe an Attractive Investment? Aggressive Turnaround on Track Investing in scalable growing markets Strong 2012 results – delivered on our commitments Secular FI consumer check decline rate moderating Results-Oriented Management Team Experienced and united leadership team, focused sense of urgency, positively changing culture Proactive response to marketplace challenges Strong Customer Base Leveragable for growth — stabilizing our core ~4.3 million active small businesses ~5,700 financial institutions ~8 million direct-to-consumer customers in last two years Financial Flexibility Well positioned for growth Revenue and cash from operations growth Effectively managing cost structure Attractive dividend No significant long-term debt maturities until end of 2014 |
|
|
Appendix |
|
|
17 Adjusted Earnings Per Share (EPS) Reconciliation to reported EPS – Diluted (from continuing operations) This table is provided to assist in understanding the comparability of the Company’s results of operations actuals for years ending December 31, 2012, 2011, 2010, and 2009 . The Company’s management believes that adjusted earnings per share (EPS) is a useful financial measure because certain items during 2012, 2011, 2010 and 2009 impacted the comparability of reported net income. This presentation is not intended as an alternative to results reported in accordance with generally accepted accounting principles (GAAP) in the United States of America. Instead, the Company believes that this information is a useful financial measure to be considered in addition to GAAP performance measures. Year Ended December 31, 2012 2011 2010 2009 Adjusted Diluted EPS $3.53 $3.11 $3.18 $2.44 Restructuring related costs (0.13) (0.18) (0.14) (0.18) Net gain/(loss) on repurchase of debt (0.07) (0.11) - 0.11 Tax impact of health care legislation - - (0.07) - Transaction related costs (0.01) (0.01) - (0.03) Asset impairment charges - (0.01) - (0.40) Reported Diluted EPS $3.32 $2.80 $2.97 $1.94 |
|
|
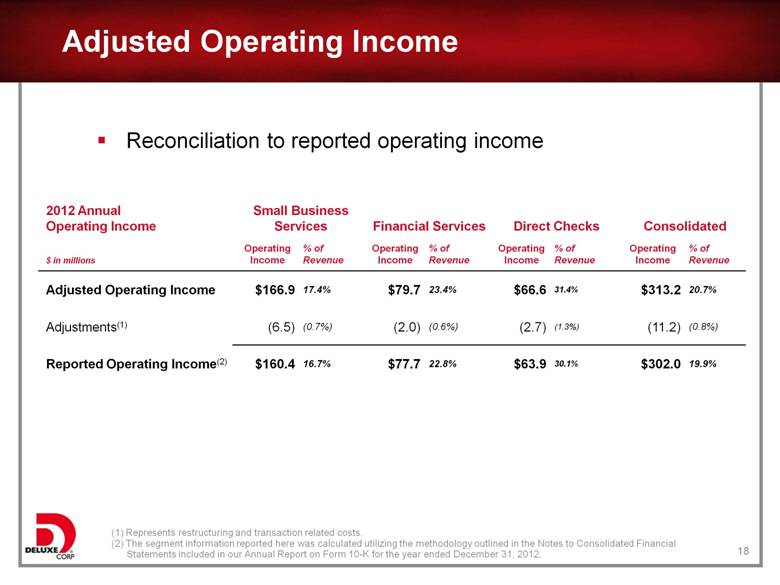
18 Adjusted Operating Income Reconciliation to reported operating income (1) Represents restructuring and transaction related costs. (2) The segment information reported here was calculated utilizing the methodology outlined in the Notes to Consolidated Financial Statements included in our Annual Report on Form 10-K for the year ended December 31, 2012. 2012 Annual Operating Income Small Business Services Financial Services Direct Checks Consolidated $ in millions Operating Income % of Revenue Operating Income % of Revenue Operating Income % of Revenue Operating Income % of Revenue Adjusted Operating Income $166.9 17.4% $79.7 23.4% $66.6 31.4% $313.2 20.7% Adjustments(1) (6.5) (0.7%) (2.0) (0.6%) (2.7) (1.3%) (11.2) (0.8%) Reported Operating Income(2) $160.4 16.7% $77.7 22.8% $63.9 30.1% $302.0 19.9% |
|
|
19 Net Debt Reconciliation to Total Debt $ in millions 2012 2011 2010 2009 Net Debt $608 $713 $738 $756 Cash and Cash Equivalents 45 29 17 13 Total Debt $653 $742 $755 $769 |
|
|
20 Thank You Investor Relations Contact: Jeff L. Johnson Treasurer & Vice President, Investor Relations Tel: 651-787-1068 Investor.Relations@deluxe.com |