Attached files
| file | filename |
|---|---|
| 8-K - FORM 8-K - CyrusOne Inc. | d492944d8k.htm |
| EX-99.1 - EX-99.1 - CyrusOne Inc. | d492944dex991.htm |
 Fourth Quarter
and Year End 2012 Financial Results
February 26, 2013
Exhibit 99.2 |
 Safe
Harbor 2
This presentation contains forward-looking statements regarding future events and our
future results that are subject to the “safe harbor”
provisions of the Private Securities Litigation Reform Act of 1995. All statements, other than
statements of historical facts, are statements that could be deemed forward-looking
statements. These statements are based on current expectations, estimates, forecasts,
and projections about the industries in which we operate and the beliefs and assumptions of our management. Words such as
“expects,”
“anticipates,”
“predicts,”
“projects,”
“intends,”
“plans,”
“believes,”
“seeks,”
“estimates,”
“continues,”
“endeavors,”
“strives,”
“may,”
variations of such words and similar expressions are intended to identify such
forward-looking statements. In addition, any statements that refer to projections
of our future financial performance, our anticipated growth and trends in our businesses, and other
characterizations of future events or circumstances are forward-looking statements.
Readers are cautioned these forward-looking statements are based on current
expectations and assumptions that are subject to risks and uncertainties, which could cause our actual
results to differ materially and adversely from those reflected in the forward-looking
statements. Factors that could cause or contribute to such differences include, but are
not limited to, those discussed in this release and those discussed in other documents we file with
the Securities and Exchange Commission (SEC). More information on potential risks and
uncertainties is available in our recent filings with the SEC, including
CyrusOne’s Form 424B4, related amendments, and Form 8-Ks. Actual results may differ materially and adversely
from those expressed in any forward-looking statements. We undertake no obligation to
revise or update any forward-looking statements for any reason.
|
 Highlights
•
Continued top line growth in excess of 20%
•
Revenue of $58.0M for Q4 2012 increased 21% from Q4 2011
•
Revenue of $220.8M for FY2012 increased 22% from FY 2011
•
Data
center
capacity
expanded
to
1.7M
NRSF
(2)
and
932K
CSF
(1)
,
both
up
22%
y/y
•
Two new markets in 2012 –
Phoenix and San Antonio
•
Four new facilities developed with significant expansion capabilities
•
9
of
the
Fortune
20
and
115
of
the
Fortune
1000
(3)
•
Successful
IPO
of
common
shares
in
January
2013
raising
$337M
(4)
to
fund
future development
Fourth Quarter and 2012
Note:
3
1.
Net rentable square feet (NRSF ) represent the total square feet of a building currently
leased or available for lease based on engineers’ drawings and estimates but does not include
space held for development or space used by CyrusOne.
2.
Colocation square feet (CSF) represents NRSF currently leased or available for lease as
colocation space, where customers locate their servers and other IT equipment.
3.
Customer’s ultimate parent is a Fortune 1000 company or a foreign or private company of
equivalent size.
4.
After underwriter’s discount and before other expenses |
 •
76%
of
annualized
rent
(1)
is
from
the
Fortune
1000
(2)
•
57%
of
annualized
rent
(1)
is
from
investment
grade
companies
(2)
•
9 of the Fortune 20 are customers
•
Niche in large and growing
energy vertical
-
5 of the 6 “Supermajor”
oil and gas companies
-
Need for data sharing = powerful network effects
Notes:
Revenue Diversity with a Geographic Niche …
Energy
Other
Telecommunications
Financial Services
Healthcare
IT
Our Customer Base
Full Service
Customers
Metered Power
Customers
% of Annualized Rent
(1)
…
And Equal Mix of Metered Power and Full Service
% of Annualized Rent
(1)
0.4%
0.5%
1.8%
1.5%
0.6%
4Q'11
1Q'12
2Q'12
3Q'12
4Q'12
Consistently Low Churn
Recurring Rent Quarterly Churn
(3)
4.6% annual churn for 2012
4
1.
Annualized Rent represents monthly contractual rent (defined as cash rent including metered
power reimbursements) under existing customer leases as of December 31, 2012,
multiplied by 12.
2.
Customer’s ultimate parent is a Fortune 1000 company or a foreign or private company of
equivalent size.
3.
Recurring Rent Quarterly Churn is defined as any reduction in recurring rent due to customer
terminations, service reductions or net pricing decreases as a percentage of annualized
rent at the beginning of the quarter, excluding any impact from
metered power reimbursements. |
   Portfolio
Update 22% increase in capacity in 2012 providing inventory for growth
Market
CSF Capacity
(Sq Ft)
% Utilized
CSF Capacity
(Sq Ft)
% Utilized
Cincinnati
411,730
92%
436,613
91%
Dallas
171,100
69%
123,945
82%
Houston
188,602
93%
153,593
90%
Austin
57,078
32%
15,459
92%
Phoenix
36,222
0%
-
0%
San Antonio
35,765
61%
-
0%
Chicago
23,278
52%
25,485
77%
International
8,200
52%
8,200
17%
Total Footprint
931,975
78%
763,295
88%
As of December 31, 2011
As of December 31, 2012
•
Capacity added in Austin,
Houston, Dallas, San Antonio,
and Phoenix in 2012
•
Phoenix facility commissioned in
late December
•
San Antonio and Carrollton were
commissioned in Q312, with San
Antonio already at 60%+
utilization
•
London footprint will double in
Q113 with one new customer
taking 100% of expansion
•
Powered shell available for
incremental development in
almost all markets in
addition
to
existing
inventory
5
(1)
(1)
Notes:
1.
Colocation square feet (CSF) represents NRSF currently leased or available for lease as
colocation space, where customers locate their servers and other IT equipment. |
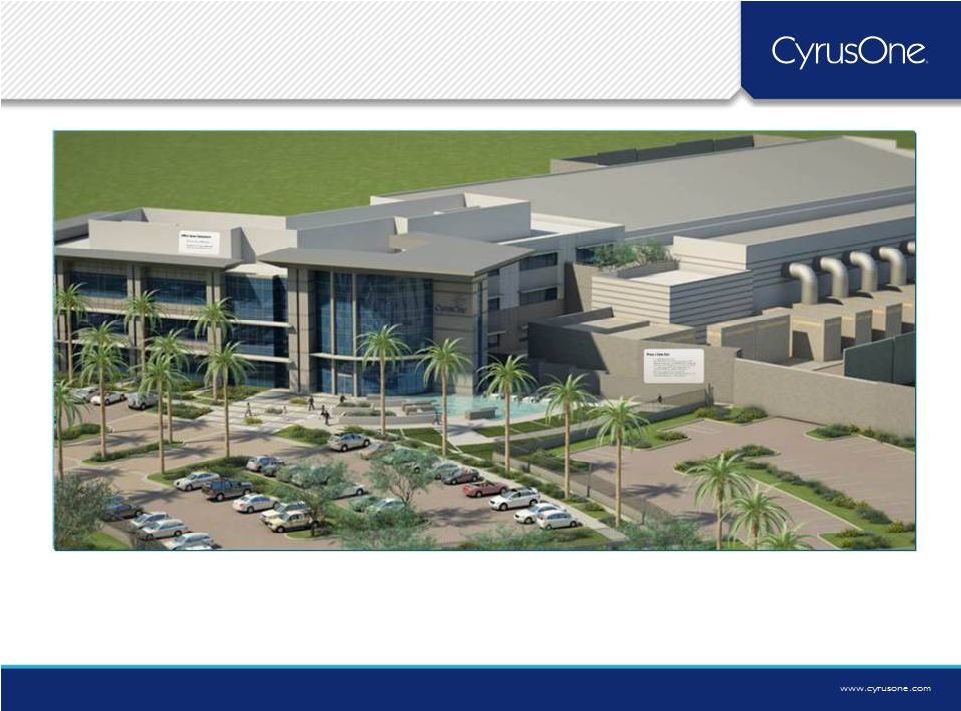 Phoenix,
AZ 6 |
 •
Creating a statewide interconnection
platform, connecting all CyrusOne facilities
within Texas
•
Powerful network effects that create an
even more captive customer base
•
Further separates CyrusOne from its
competitors in the marketplace
•
Opportunity for rapid growth on top of
demonstrated strong growth trends
•
High margin revenue
CyrusOne Interconnection
Enhancing Asset Value and Tenant Loyalty With Connectivity
Overview of Interconnection Initiative
Interconnection benefits current customers and drives new customers from underserved
markets 7
“Sky for the cloud” |
 Fourth Quarter
Review |
 Revenue
Fourth Quarter
($MM)
2012
($MM)
•
Revenue growth of 21% and 22% for the quarter and full year of 2012, respectively
•
Existing customers drove 65% of growth in annualized rent
•
Expansion of customer base to 518 customers at December 31, 2012, up from 487 at the end of
2011 •
Signed leases for approximately 41,000 square feet of data center space in the fourth quarter
across 8 facilities with over half in San Antonio and Houston
•
22% increase in available CSF capacity with 78% utilization as of December 31, 2012
9
Highlights: |
 NOI, Adj.
EBITDA and Normalized FFO ($MM)
Three Months Ended
December 31,
Twelve Months Ended
December 31,
2012
2011
$
Change
%
Change
2012
2011
$ Change
%
Change
Net Operating
Income (NOI)
$37.4
$33.1
$4.3
13%
$144.8
$123.5
$21.3
17%
Adjusted EBITDA
$27.8
$26.8
$1.0
4%
$113.4
$99.6
$13.8
14%
Normalized Funds
from Operations
(FFO)
$16.8
$14.3
$2.5
17%
$67.4
$56.8
$10.6
19%
Highlights:
10
•
NOI increased by 13% over fourth quarter of 2012 due to revenue growth •
Adjusted EBITDA growth of 4% and 14% for fourth quarter and FY 2012, respectively •
Additional investment in the quarter in sales and marketing to support 2013 growth General and
administrative expenses increased to support an independent public company and
certain one-time items
•
Normalized FFO increased 17% in fourth quarter and 19% for FY 2012 |
 Capital
Expenditures (87%)
11
•
Capital
expenditures
nearly
doubled
2011
spend
with
$208
million
spent
on
Data
Center
development
•
~310,000 NRSF constructed in 2012 compared to ~170,000 NRSF in 2011
•
~195,000 CSF constructed in 2012 compared to ~125,000 CSF in 2011
•
New facilities opened in Dallas (Carrollton), Phoenix, Austin and San Antonio
•
Houston West and Lewisville -
added CSF and increased power density
•
Houston West expansion –
acquired adjacent land and began substantial construction of a new building that
will ultimately provide 85,000 CSF
•
Network assets were purchased to support our interconnection business
Fourth Quarter
($MM)
Recurring Capex
1.
Development Capex includes development of real estate, acquisition of real estate and other
non-real estate capex. YTD
($MM)
Development
Capex
(1)
as % of
Total Capex
Highlights:
Notes: |
 Financial
Policy •
Strong balance sheet with no near-term
maturities
-
Pro Forma net leverage of 1.8x
-
Pro Forma liquidity of $579M, including
undrawn revolver capacity of $225M and cash
December 31,
2012
Long term debt
$525.0
Capital lease obligations
32.2
Less:
Cash and cash equivalents
(16.5)
Net debt
$540.7
IPO proceeds to Balance Sheet
(337.1)
Pro Forma Net Debt at December 31, 2012
$203.6
•
Targeting an investment grade balance sheet over
time
-
Demonstrated access to debt capital markets
-
Prudent use of leverage in acquisitions
-
Access to equity capital sources as conditions
allow
12
Note:
1.
After underwriter’s discount and before other expenses
(1)
($MM) |
 See Earnings
Release Supplement at www.cyrusone.com for reconciliations of
Non-GAAP financial measures |
 www.cyrusone.com |