Attached files
| file | filename |
|---|---|
| 8-K/A - FORM 8-K/A - Cooper-Standard Holdings Inc. | d493374d8ka.htm |
 Cooper Standard
Fourth Quarter & Full Year 2012 Earnings Call
February 26, 2013
Exhibit 99.2 |
 cooperstandard
2
Safe Harbor
This presentation includes “forward-looking statements” within the meaning of U.S.
federal securities laws, and we intend that such forward-looking statements be subject to
the safe harbor created thereby. We make forward-looking statements in this presentation and may make such statements in
future filings with the SEC. We may also make forward-looking statements in our press releases or
other public or stockholder communications. These forward-looking statements include
statements concerning our plans, objectives, goals, strategies, future events, future revenue or performance,
capital expenditures, financing needs, plans or intentions relating to acquisitions, business trends,
and other information that is not historical information. When used in this presentation, the
words “estimates,” “expects,” “anticipates,” “projects,” “plans,” “intends,” “believes,” “forecasts,” or
future or conditional verbs, such as “will,” “should,” “could,” or
“may,” and variations of such words or similar expressions are intended to identify
forward-looking statements. All forward-looking statements, including, without limitation,
management’s examination of historical operating trends and data are based upon our
current expectations and various assumptions. Our expectations, beliefs, and projections are expressed in good faith and we
believe there is a reasonable basis for them. However, no assurances can be made that these
expectations, beliefs and projections will be achieved. Forward-looking statements are not
guarantees of future performance and are subject to significant risks and uncertainties that may cause actual
results or achievements to be materially different from the future results or achievements expressed
or implied by the forward-looking statements.
There are a number of risks and uncertainties that could cause our actual results to differ materially
from the forward-looking statements contained in this presentation. Important factors
that could cause our actual results to differ materially from the forward-looking statements we make herein include,
but are not limited to: cyclicality of the automotive industry with the possibility of further
material contractions in automotive sales and production effecting the viability of our
customers and financial condition of our customers; global economic uncertainty, particularly in Europe; loss of large
customers or significant platforms; supply shortages; escalating pricing pressures and decline of
volume requirements from our customers; our ability to meet significant increases in demand;
availability and increasing volatility in cost of raw materials or manufactured components; our ability to
continue to compete successfully in the highly competitive automotive parts industry; risks associated
with our non-U.S. operations; foreign currency exchange rate fluctuations; our ability to
control the operations of joint ventures for our benefit; the effectiveness of our lean manufacturing and other
cost savings plans; product liability and warranty and recall claims that may be brought against us;
work stoppages or other labor conditions; natural disasters; our ability attract and retain key
personnel; our ability to meet our customers’ needs for new and improved products in a timely manner or
cost-effective basis; the possibility that our acquisition strategy may not be successful; our
legal rights to our intellectual property portfolio; environmental and other regulations; legal
proceedings or commercial and contractual disputes that we may be involved in; the possible volatility of our
annual effective tax rate; our ability to generate sufficient cash to service our indebtedness, obtain
future financing, and meet dividend obligations on our 7% preferred stock; our underfunded
pension plans; significant changes in discount rates and the actual return on pension assets; the possibility of
future impairment charges to our goodwill and long-lived assets; the ability of certain
stockholders to nominate certain members of the board of directors; and operating and financial
restrictions imposed on us by our bond indenture and credit agreement.
There may be other factors that may cause our actual results to differ materially from the
forward-looking statements. All forward-looking statements attributable to us or
persons acting on our behalf apply only as of the date of this presentation and are expressly qualified in their entirety by the
cautionary statements included herein. We undertake no obligation to update or revise
forward-looking statements to reflect events or circumstances that arise after the date
made or to reflect the occurrence of unanticipated events. |
 Jeff Edwards
Chief Executive Officer
Executive Overview
Fourth Quarter and Full Year 2012 |
 cooperstandard
4
Executive Overview
•
Strategy
•
Managing European downturn
•
Emerging market expansions
•
Key leadership appointments to facilitate growth |
 cooperstandard
5
First 120 Day CEO Plan
Day
0-45
Listen & Learn
Define the Vision
/ Path Forward
Unwavering
Execution
•
Met with Top 50 management
•
Met with plant management
teams
•
Visited global tech centers
•
Visited facilities in 9 countries
•
Engaged with 11 customers
•
Met with 6 business partners
Day
45-120
Day
120+
•
Determine capabilities
•
Analyze current portfolio
performance
•
Explore organization model
•
Determine human capital
needs
•
Create vision
•
Develop strategic priorities
•
Install process capabilities
•
Create priorities for capital and
innovation
•
Prioritize organizational
resources |
 cooperstandard
Key Elements to Success
•
Make shareholder value creation our over-arching objective
•
Have relentless
focus
on
our
customers
–
develop
deep
insight
into their needs and consistently beat our competition in most
effectively serving such needs
•
Achieve
profitable
growth
–
grow
the
top
line
and
expand
margins
•
Invest in our people and excel in the few essential capabilities
required to win
•
Build an operating model that enables and sustains success –
transform our people into a distinct competitive advantage
6 |
 cooperstandard
7
Strategic Priorities
•
Focus on our customers, develop deep insight
into their needs and how to most effectively serve them
•
Finalize product growth strategy
•
Accelerate profitable growth …
Brazil, India, China,
Southeast Asia
•
North America –
continue to invest in infrastructure to
support growth
•
Restructure Europe manufacturing footprint
–
Serbia, Romania (complete), Turkey and Poland
•
Focus on building centers of excellence within
our global functional organizations
•
Invest in Russia and Indonesia footprint |
 Financial Overview
Fourth Quarter and Full Year 2012
Allen Campbell
Chief Financial Officer |
 cooperstandard
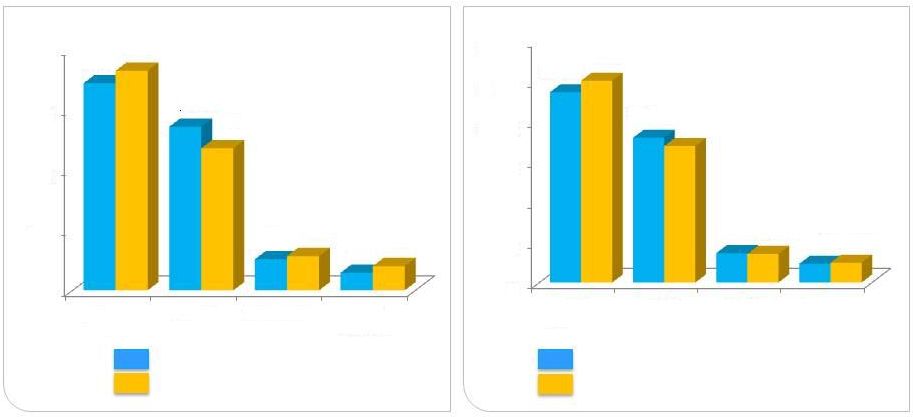
Q4 and FY 2012 Revenue
9
$ USD Millions
Q4 2011 Revenue: $695.7
Q4 2012 Revenue: $697.1
FY 2011 Revenue: $2,853.5
FY 2012 Revenue: $2,880.9
Note: Numbers subject to rounding
$0
$100
$200
$300
$400
North
America
Europe
Asia Pacific
South
America
$343.6
$271.4
$51.5
$29.1
$364.5
$235.8
$56.7
$40.1
$0
$300
$600
$900
$1,200
$1,500
$1,800
North
America
Europe
Asia Pacific
South
America
$1,417.3
$1,078.2
$218.5
$139.5
$1,503.7
$1,016.6
$213.2
$147.4 |
 cooperstandard
Q4 and FY 2012 Performance
$ USD Millions, except per share amounts
Q4 2011
Q4 2012
FY 2011
FY 2012
Sales
695.7
697.1
2,853.5
2,880.9
Gross Profit
97.6
99.7
450.6
438.9
SGA
66.7
74.8
257.6
281.3
Operating Profit
22.9
(2.1)
125.2
103.3
Net Income
23.2
(9.9)
102.8
102.8
Fully Diluted EPS
$0.84
($0.70)
$3.93
$4.14
Adjusted EBITDA
66.6
70.9
324.1
298.0
% Margin
9.6%
10.2%
11.4%
10.3%
Note: Numbers subject to rounding
10 |
 cooperstandard
EBITDA and Adjusted EBITDA Reconciliation
11
$ USD Millions
Net income
Provision (benefit) for income tax expense
EBITDA
Restructuring
Adjusted EBITDA
Twelve Months Ended Dec 31, 2012
Net interest expense
Depreciation and amortization
EBITDA and Adjusted EBITDA are Non-GAAP measures. Reference comments on slide
20 Net gain on partial sale of joint venture
(31.5)
44.8
122.7
238.8
25.8
-
298.0
Inventory fair value
-
102.8
Acquisition costs
-
Impairment charges
10.1
Payments to former CEO and transition cost
11.5
Others
-
Stock based compensation
9.8
Noncontrolling interest deferred tax valuation reversal
2.0
Note: Numbers subject to rounding |
 Cooper
Standard Non-Consolidated Joint Venture Sales Joint Venture
Partner
Product
Country
Huayu-Cooper Sealing
SAIC/HASCO
Sealing
China
Nishikawa Cooper
Nishikawa Rubber
Sealing
U.S.
Nishikawa Tachaplalert Cooper
Nishikawa Rubber
Sealing
Thailand
Sujan CSF India
Magnum Elastomers
AVS
India
$ million
$2,854
$2,881
$3,175
$3,288
Non-Consolidated Sales up 27%
cooperstandard
12
Non-Consolidated JV
Sales in Asia Pacific, as reported
Sales in other regions, as reported
$0
$500
$1,000
$1,500
$2,000
$2,500
$3,000
$3,500
2011
2012
$2,802
$2,824
$52
$57
$321
$407 |
 cooperstandard
Q4 and FY 2012 Cash Flow and Key Financial Ratios
Note: Numbers subject to rounding
Cash Balance as of December 31, 2011
$ 361.7
Cash used
(91.1)
Cash Balance as of December 31, 2012
$ 270.6
ABL Revolver
125.0
Letters of Credit
(27.0)
Total Liquidity
$ 368.6
($ USD Millions)
Q4 2012
FY 2012
Cash from business
$38.9
$204.3
Pension funding -
US
(3.3)
(30.1)
Changes in operating assets & liabilities
70.8
(89.8)
Cash from operations
106.4
84.4
Capital expenditures
(39.6)
(131.1)
Cash from (used) in operations including CAPEX
66.8
(46.7)
Acquisition of business, net cash acquired
-
(1.1)
Purchase of noncontrolling interest
(2.0)
(2.0)
Proceeds from sale of assets
5.6
14.6
Dividends –
Preferred Stock
(1.7)
(6.8)
Financing activities
1.6
(5.5)
Repurchase of preferred stock
(1.9)
(6.8)
Repurchase of common stock
(16.3)
(36.9)
Foreign exchange/other
0.7
0.1
Net cash used
$52.8
$(91.1)
•
Net leverage = $212.8 million
•
Net leverage ratio = 0.7
•
Interest coverage ratio = 6.7
•
No major debt maturity until 2018
Key Financial Ratios
13 |
 cooperstandard
14
2013 Guidance
•
Sales growth: 1% to 2%
•
Capital expenditures: $150 million
-
$170 million
•
Cash restructuring: $40 million -
$50 million
•
Cash taxes: $35 million -
$45 million
Guidance assumptions:
•
North American production:
15.6 million units
•
Europe (including Russia) production:
18.7 million units
•
Average full exchange rate:
$1.25 / 1 Euro |
 Questions & Answers |
 cooperstandard
16
Summary
•
Complete 120 day plan
•
Align organization to support customer
•
Leverage footprint and capabilities to win global
platforms
•
Attract and retain key talent to drive growth
–
Appointed Asian and European Presidents
–
Appointed executive to oversee emerging markets
•
Continue a relentless focus on our customers
through global support and innovation |
 Appendix |
 cooperstandard
18
Net Leverage Ratio as of Dec 31, 2012
(1)
Includes cash and non-cash restructuring.
(2)
Proportionate
share
of
restructuring
costs
related
to
FMEA
joint
venture.
(3)
Non-cash stock amortization expense and non-cash stock option expense for
grants issued at emergence from bankruptcy. (4)
Impairment charges related to goodwill ($2.8 million) and fixed assets ($7.3
million) (5)
Executive compensation for retired CEO and recruiting costs related to search for
new CEO (6)
Noncontrolling interest deferred tax valuation reversal
Note: Numbers subject to rounding
($ USD Millions)
Three Months Ended
Twelve
Months
Ended
Mar 31,
2012
Jun 30,
2012
Sep 30,
2012
Dec 31,
2012
Dec 30,
2012
Net income
$ 23.8
$ 77.3
$ 11.6
$ (9.9)
$ 102.8
Provision for income tax expense
8.1
(46.2)
5.4
1.2
(31.5)
Interest expense, net of interest income
11.2
10.8
11.3
11.5
44.8
Depreciation and amortization
31.6
30.5
29.1
31.5
122.7
EBITDA
$ 74.7
$ 72.4
$ 57.4
$ 34.3
$ 238.8
Restructuring
(1)
6.1
(0.5)
10.2
13.0
28.8
Noncontrolling interest restructuring
(2)
(0.3)
-
(0.2)
(2.5)
(3.0)
Stock-based compensation
(3)
2.7
2.2
2.4
2.5
9.8
Impairment charges
(4)
-
-
-
10.1
10.1
Payment to former CEO and transition cost
(5)
-
-
-
11.5
11.5
Noncontrolling deferred tax valuation reversal
(6)
-
-
-
2.0
2.0
Adjusted EBITDA
$ 83.2
$ 74.1
$ 69.8
$ 70.9
$ 298.0
Net Leverage
Debt payable within one year
32.6
Long-term debt
450.8
Less: cash and cash equivalents
(270.6)
Net Leverage
212.8
Net Leverage Ratio
0.7 |
 cooperstandard
19
Adjusted EBITDA as a Percent of Sales as of Dec 31,2012
Note: Numbers subject to rounding
($ USD Millions)
(1)
Includes cash and non-cash restructuring.
(2)
Proportionate
share
of
restructuring
costs
related
to
FMEA
joint
venture.
(3)
Non-cash stock amortization expense and non-cash stock option expense for
grants issued at emergence from bankruptcy. (4)
Impairment charges related to goodwill ($2.8 million) and fixed assets ($7.3
million) (5)
Executive compensation for retired CEO and recruiting costs related to search for
new CEO (6)
Noncontrolling interest deferred tax valuation reversal
Three Months Ended
Twelve
Months
Ended
Mar 31,
2012
Jun 30,
2012
Sep 30,
2012
Dec 31,
2012
Dec 30,
2012
Net income
$ 23.8
$ 77.3
$ 11.6
$ (9.9)
$ 102.8
Provision for income tax expense
8.1
(46.2)
5.4
1.2
(31.5)
Interest expense, net of interest income
11.2
10.8
11.3
11.5
44.8
Depreciation and amortization
31.6
30.5
29.1
31.5
122.7
EBITDA
$ 74.7
$ 72.4
$ 57.4
$ 34.3
$ 238.8
Restructuring
(1)
6.1
(0.5)
10.2
13.0
28.8
Noncontrolling interest restructuring
(2)
(0.3)
-
(0.2)
(2.5)
(3.0)
Stock-based compensation
(3)
2.7
2.2
2.4
2.5
9.8
Impairment charges
(4)
-
-
-
10.1
10.1
Payment to former CEO and transition cost
(5)
-
-
-
11.5
11.5
Noncontrolling
deferred
tax
valuation
reversal
(6)
-
-
-
2.0
2.0
Adjusted EBITDA
$ 83.2
$ 74.1
$ 69.8
$ 70.9
$ 298.0
Sales
765.3
734.5
684.0
697.1
2,880.9
Adjusted EBITDA as a percent of Sales
10.9%
10.1%
10.2%
10.2%
10.3% |
 cooperstandard
Non-GAAP Financial Measures
20
EBITDA and adjusted EBITDA are measures not recognized under Generally
Accepted Accounting Principles (GAAP) which exclude certain non-cash and
non- recurring items.
When analyzing the company’s operating performance, investors should use
EBITDA and adjusted EBITDA in addition to, and not as alternatives for, net
income (loss), operating income, or any other performance measure derived in
accordance with GAAP, or as an alternative to cash flow from operating
activities as a measure of the company’s performance. EBITDA and
adjusted EBITDA have limitations as analytical tools and should not be
considered in isolation or as substitutes for analysis of the company’s
results of operations as reported under GAAP. Other companies may report
EBITDA and adjusted EBITDA differently and therefore Cooper Standard’s
results may not be comparable to other similarly titled measures of other
companies. |