Attached files
| file | filename |
|---|---|
| 8-K - 8-K - Walter Energy, Inc. | a13-5960_18k.htm |
Exhibit 99.1
|
|
February 2013 |
|
|
Forward-Looking & Non-GAAP Statements 2 Statements in this presentation regarding Walter Energy, Inc.'s business, which are not historical facts, are "forward-looking statements" that involve risks and uncertainties and are made pursuant to the safe harbor provisions of the Private Securities Litigation Reform Act of 1995. Forward-looking statements are based on information available to management at the time, and they involve judgments and estimates. Forward-looking statements include expressions such as "believe," "anticipate," "expect,” "estimate," "intend," "may," "plan," "predict," "will," and similar terms and expressions. These forward-looking statements are made based on expectations and beliefs concerning future events affecting us and are subject to various risks, uncertainties and factors relating to our operations and business environment, all of which are difficult to predict and many of which are beyond our control, that could cause our actual results to differ materially from those matters expressed in or implied by these forward-looking statements. The following factors are among those that may cause actual results to differ materially from our forward-looking statements: the market demand for coal, coke and natural gas as well as changes in pricing and costs; the availability of raw material, labor, equipment and transportation; changes in weather and geologic conditions; changes in extraction costs, pricing and assumptions and projections concerning reserves in our mining operations; changes in customer orders; pricing actions by our competitors, customers, suppliers and contractors; changes in governmental policies and laws, including with respect to safety enhancements and environmental initiatives; availability and costs of credit, surety bonds and letters of credit; and changes in general economic conditions. Forward-looking statements made by us in this presentation speak only as of the date on which the statements were made. See also the factors under the heading "Risk Factors" included in, and incorporated by reference into, the preliminary offering memorandum for a discussion of additional risks and uncertainties that could cause actual results to differ from those contained in the forward-looking statements. New risks and uncertainties arise from time to time, and it is impossible for us to predict these events or how they may affect us or our anticipated results. We have no duty to, and do not intend to, update or revise the forward-looking statements in this presentation, except as may be required by law. In light of these risks and uncertainties, readers should keep in mind that any forward-looking statement made here may not occur. All data presented herein is as of the date of this writing unless otherwise noted. We use a number of different financial measures in assessing the overall performance of our business, including measures calculated in accordance with United States generally accepted accounting principles (“GAAP”) and non-GAAP numbers. EBITDA is a financial measure that is not calculated in conformity with GAAP and should be considered supplemental to, and not as a substitute or superior to, financial measures calculated in conformity with GAAP. We believe that EBITDA is a useful measure as some investors and analysts use EBITDA to compare us against other companies and to help analyze our ability to satisfy principal and interest obligations and capital expenditure needs. EBITDA may not be comparable to similarly titled measures used by other entities. |
|
|
Disclaimer 3 Important Information Walter Energy will file with the Securities and Exchange Commission (“SEC”) and provide to its stockholders a proxy statement and a white proxy card in connection with its 2013 Annual Meeting. STOCKHOLDERS ARE URGED TO READ THIS PROXY STATEMENT AND OTHER RELEVANT DOCUMENTS FILED BY WALTER ENERGY WITH THE SEC IN THEIR ENTIRETY WHEN THEY BECOME AVAILABLE BECAUSE THEY WILL CONTAIN IMPORTANT INFORMATION. Stockholders will be able to obtain free copies of these documents through the website maintained by the SEC at http://www.sec.gov and through the website maintained by Walter Energy at http://walterenergy.com. Certain Information Regarding Participants Walter Energy, its directors and certain of its officers may be deemed to be participants in the solicitation of Walter Energy’s stockholders in connection with its 2013 Annual Meeting. Information regarding the names, affiliations and direct and indirect interests (by security holdings or otherwise) of these persons will be found in Walter Energy’s proxy statement for its 2013 Annual Meeting, which Walter Energy will file with the SEC. Additional information regarding these persons can also be found in other documents filed by Walter Energy with the SEC. Stockholders will be able to obtain a free copy of the proxy statement and other documents filed by Walter Energy with the SEC from the sources listed above. |
|
|
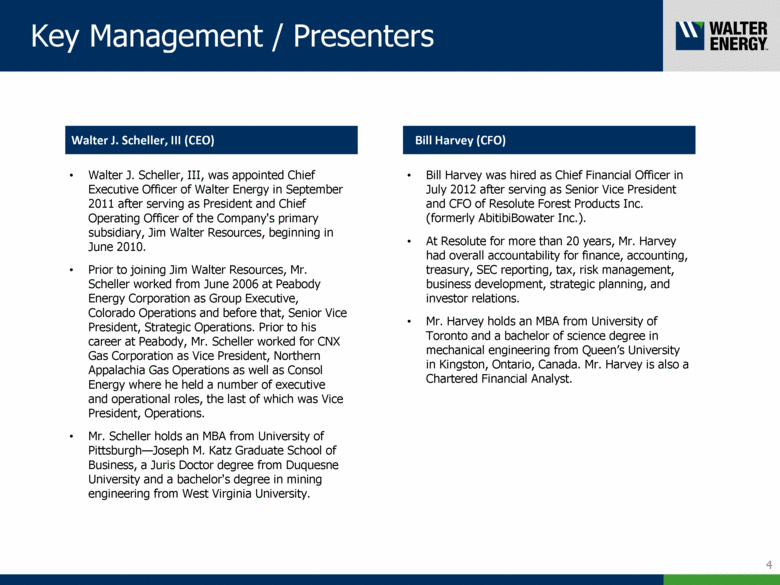
Walter J. Scheller, III, was appointed Chief Executive Officer of Walter Energy in September 2011 after serving as President and Chief Operating Officer of the Company's primary subsidiary, Jim Walter Resources, beginning in June 2010. Prior to joining Jim Walter Resources, Mr. Scheller worked from June 2006 at Peabody Energy Corporation as Group Executive, Colorado Operations and before that, Senior Vice President, Strategic Operations. Prior to his career at Peabody, Mr. Scheller worked for CNX Gas Corporation as Vice President, Northern Appalachia Gas Operations as well as Consol Energy where he held a number of executive and operational roles, the last of which was Vice President, Operations. Mr. Scheller holds an MBA from University of Pittsburgh—Joseph M. Katz Graduate School of Business, a Juris Doctor degree from Duquesne University and a bachelor's degree in mining engineering from West Virginia University. Walter J. Scheller, III (CEO) Bill Harvey (CFO) Bill Harvey was hired as Chief Financial Officer in July 2012 after serving as Senior Vice President and CFO of Resolute Forest Products Inc. (formerly AbitibiBowater Inc.). At Resolute for more than 20 years, Mr. Harvey had overall accountability for finance, accounting, treasury, SEC reporting, tax, risk management, business development, strategic planning, and investor relations. Mr. Harvey holds an MBA from University of Toronto and a bachelor of science degree in mechanical engineering from Queen’s University in Kingston, Ontario, Canada. Mr. Harvey is also a Chartered Financial Analyst. Key Management / Presenters 4 |
|
|
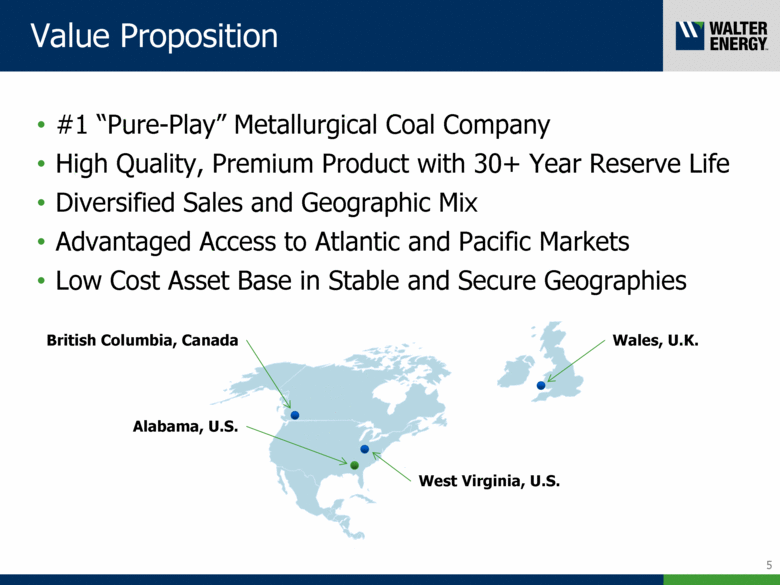
Value Proposition 5 #1 “Pure-Play” Metallurgical Coal Company High Quality, Premium Product with 30+ Year Reserve Life Diversified Sales and Geographic Mix Advantaged Access to Atlantic and Pacific Markets Low Cost Asset Base in Stable and Secure Geographies Alabama, U.S. West Virginia, U.S. British Columbia, Canada Wales, U.K. |
|
|
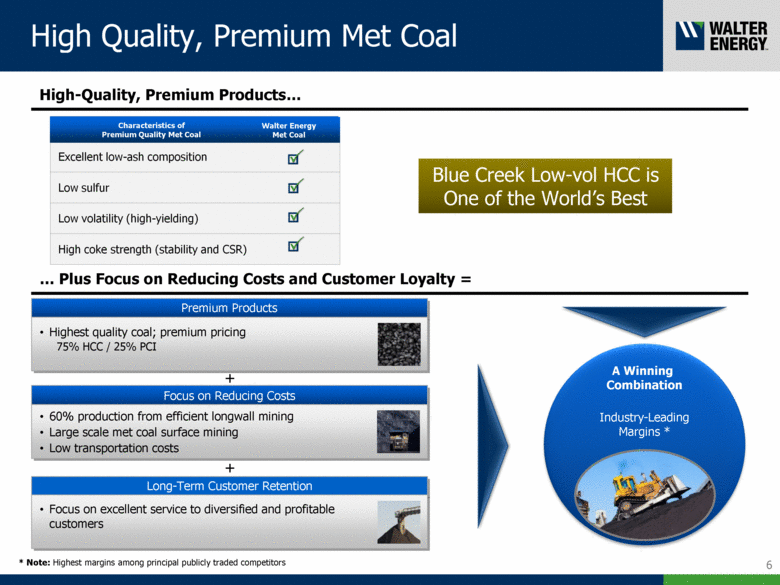
High Quality, Premium Met Coal 6 Blue Creek Low-vol HCC is One of the World’s Best Plus Focus on Reducing Costs and Customer Loyalty = Premium Products Highest quality coal; premium pricing 75% HCC / 25% PCI + Focus on Reducing Costs 60% production from efficient longwall mining Large scale met coal surface mining Low transportation costs Long-Term Customer Retention Focus on excellent service to diversified and profitable customers A Winning Combination Industry-Leading Margins * + High-Quality, Premium Products Characteristics of Premium Quality Met Coal Walter Energy Met Coal * Note: Highest margins among principal publicly traded competitors Excellent low-ash composition Low sulfur Low volatility (high-yielding) High coke strength (stability and CSR) |
|
|
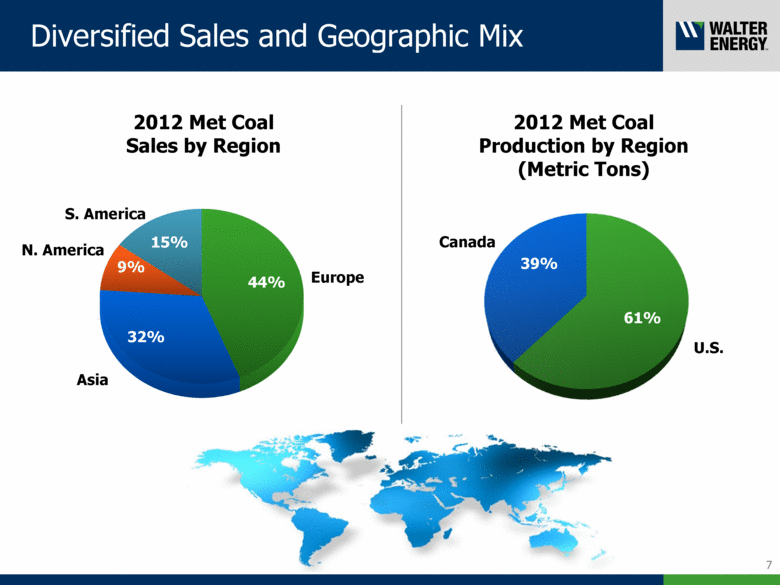
Diversified Sales and Geographic Mix 7 2012 Met Coal Sales by Region 2012 Met Coal Production by Region (Metric Tons) Europe Asia S. America N. America 61% 39% 44% 15% 9% 32% Canada U.S. |
|
|
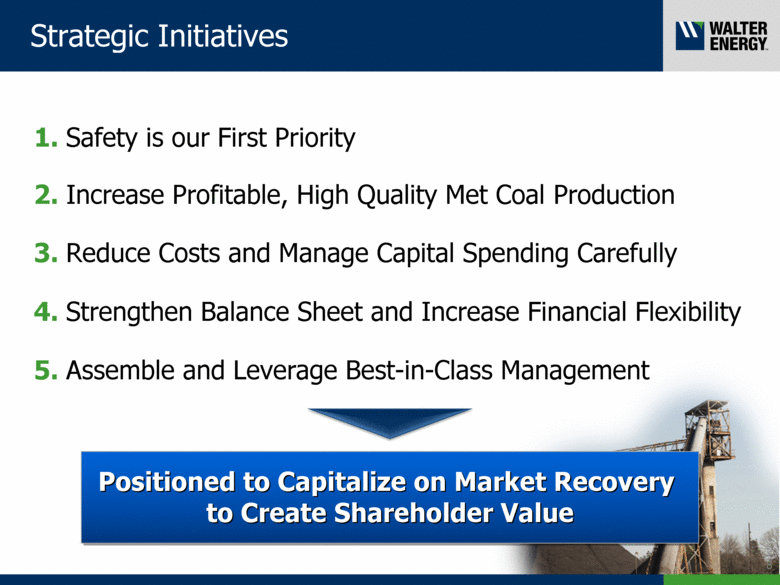
2. Increase Profitable, High Quality Met Coal Production Strategic Initiatives 8 1. Safety is our First Priority 3. Reduce Costs and Manage Capital Spending Carefully 4. Strengthen Balance Sheet and Increase Financial Flexibility 5. Assemble and Leverage Best-in-Class Management Positioned to Capitalize on Market Recovery to Create Shareholder Value |
|
|
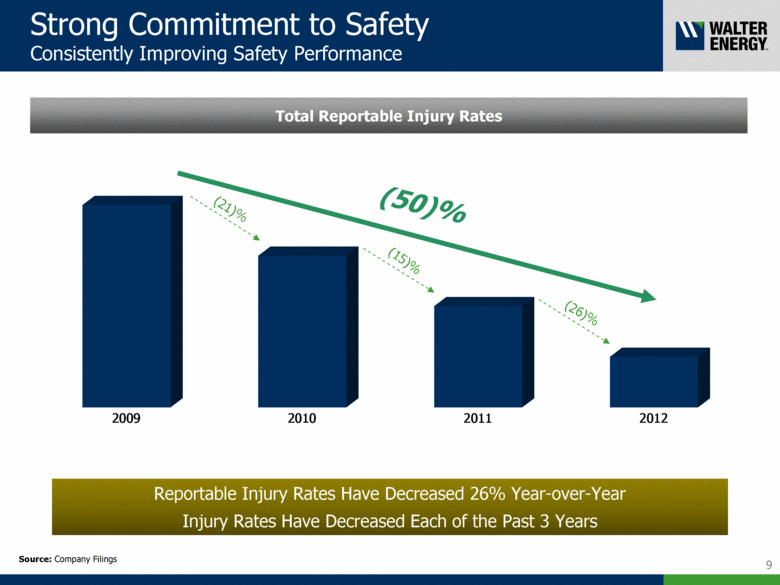
Strong Commitment to Safety Consistently Improving Safety Performance Total Reportable Injury Rates (21)% (15)% (26)% 9 Reportable Injury Rates Have Decreased 26% Year-over-Year Injury Rates Have Decreased Each of the Past 3 Years (50)% Source: Company Filings 2009 2010 2011 2012 |
|
|
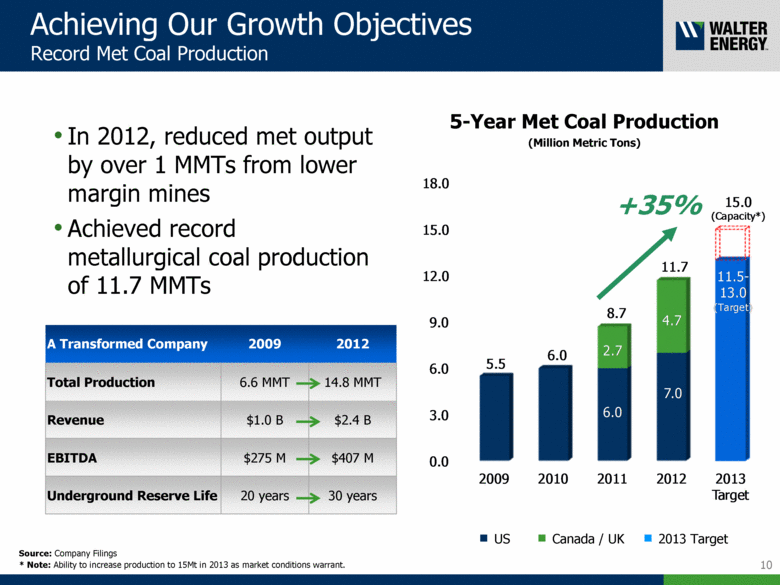
Achieving Our Growth Objectives Record Met Coal Production 10 A Transformed Company 2009 2012 Total Production 6.6 MMT 14.8 MMT Revenue $1.0 B $2.4 B EBITDA $275 M $407 M Underground Reserve Life 20 years 30 years In 2012, reduced met output by over 1 MMTs from lower margin mines Achieved record metallurgical coal production of 11.7 MMTs Canada / UK 2013 Target +35% Source: Company Filings * Note: Ability to increase production to 15Mt in 2013 as market conditions warrant. 5-Year Met Coal Production (Million Metric Tons) 0.0 3.0 6.0 9.0 12.0 15.0 18.0 2009 2010 2011 2012 2013 Target 6.0 7.0 11.5 - 13.0 (Target) 2.7 4.7 5.5 6.0 8.7 11.7 15.0 (Capacity*) |
|
|
Significant Organic Growth Opportunities Existing Capacity to Increase Production 11 Metallurgical Coal Production (Million Metric Tons) Blue Creek Belcourt Saxon Willow Creek 5.0 Ability to Increase Production in 2013 to 15 MMT as Market Conditions Warrant Source: Company Filings 15.0 (Capacity) 11.5-13 (Target) 8.7 11.7 20+ 2011 2012 2013E 2020+ |
|
|
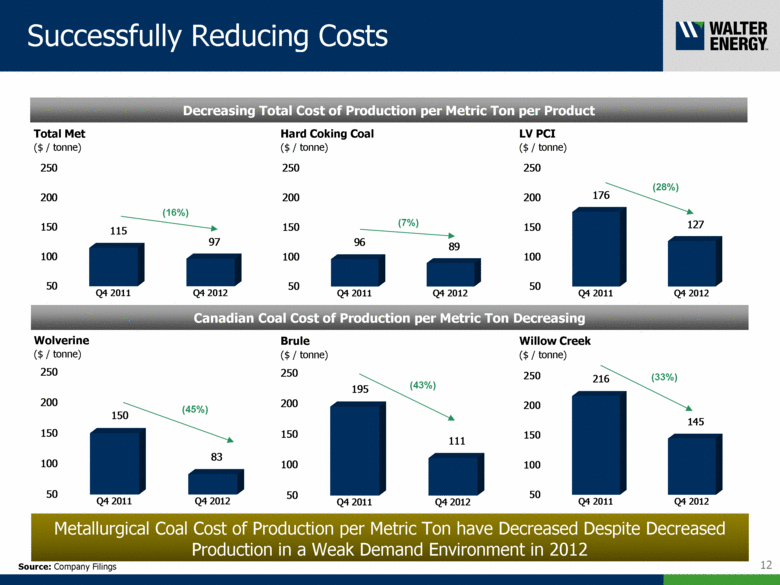
Successfully Reducing Costs 12 Source: Company Filings Wolverine Brule Willow Creek ($ / tonne) ($ / tonne) ($ / tonne) (45%) (43%) Decreasing Total Cost of Production per Metric Ton per Product Metallurgical Coal Cost of Production per Metric Ton have Decreased Despite Decreased Production in a Weak Demand Environment in 2012 (33%) Canadian Coal Cost of Production per Metric Ton Decreasing Total Met ($ / tonne) (16%) Hard Coking Coal ($ / tonne) (7%) LV PCI ($ / tonne) (28%) 216 145 50 100 150 200 250 Q4 2011 Q4 2012 115 97 50 100 150 200 250 Q4 2011 Q4 2012 96 89 50 100 150 200 250 Q4 2011 Q4 2012 176 127 50 100 150 200 250 Q4 2011 Q4 2012 150 83 50 100 150 200 250 Q4 2011 Q4 2012 195 111 50 100 150 200 250 Q4 2011 Q4 2012 |
|
|
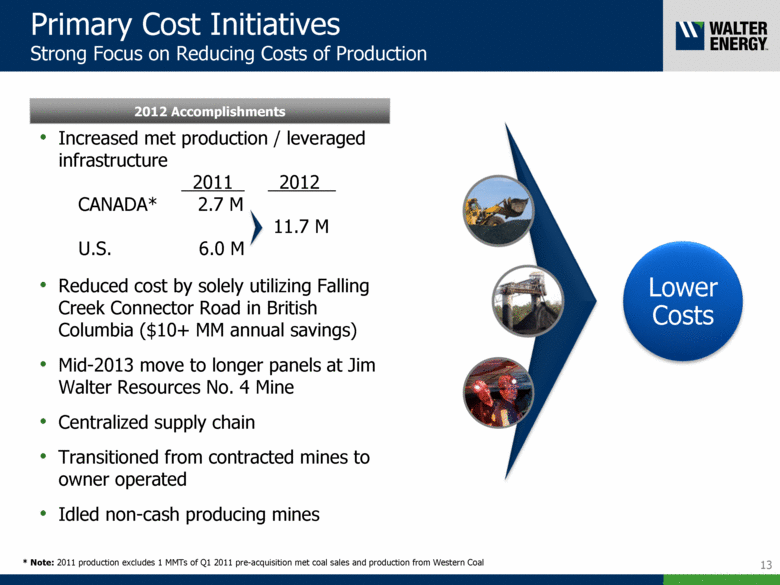
Primary Cost Initiatives Strong Focus on Reducing Costs of Production 13 Lower Costs * Note: 2011 production excludes 1 MMTs of Q1 2011 pre-acquisition met coal sales and production from Western Coal Increased met production / leveraged infrastructure 2011 2012 _ CANADA* 2.7 M 11.7 M U.S. 6.0 M Reduced cost by solely utilizing Falling Creek Connector Road in British Columbia ($10+ MM annual savings) Mid-2013 move to longer panels at Jim Walter Resources No. 4 Mine Centralized supply chain Transitioned from contracted mines to owner operated Idled non-cash producing mines 2012 Accomplishments |
|
|
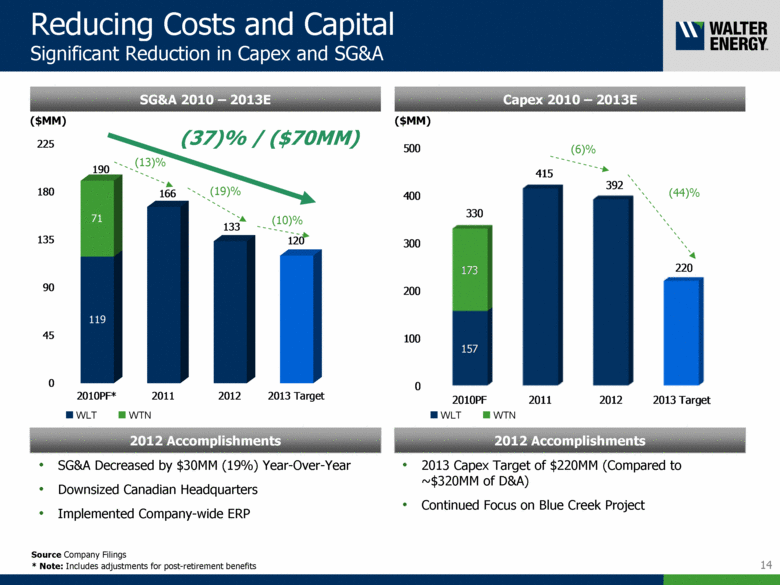
Reducing Costs and Capital Significant Reduction in Capex and SG&A 14 2012 Accomplishments SG&A 2010 – 2013E ($MM) SG&A Decreased by $30MM (19%) Year-Over-Year Downsized Canadian Headquarters Implemented Company-wide ERP WLT WTN (19)% (10)% (13)% (37)% / ($70MM) Source Company Filings * Note: Includes adjustments for post-retirement benefits Capex 2010 – 2013E ($MM) WLT WTN (44)% (6)% 2012 Accomplishments 2013 Capex Target of $220MM (Compared to ~$320MM of D&A) Continued Focus on Blue Creek Project 119 71 190 166 133 120 0 45 90 135 180 225 2010PF* 2011 2012 2013 Target 0 100 200 300 400 500 2010PF 2011 2012 2013 Target 157 173 330 415 392 220 |
|
|
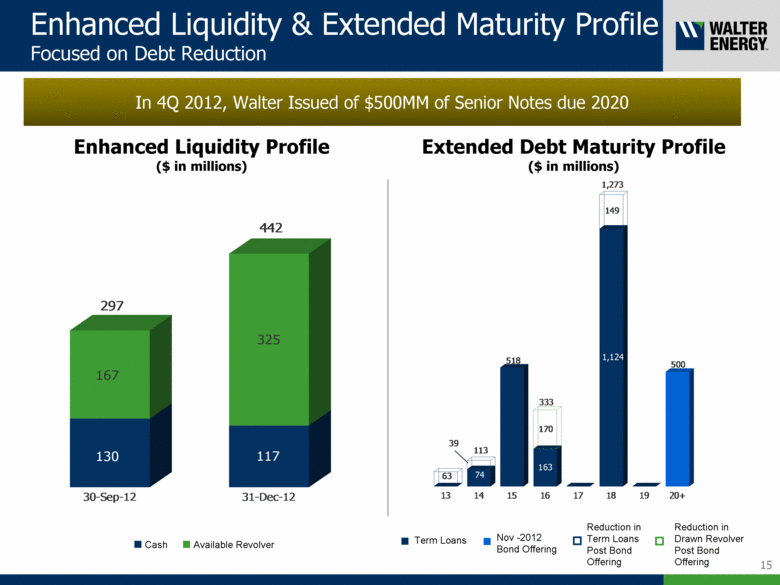
Available Revolver Enhanced Liquidity Profile ($ in millions) 15 Extended Debt Maturity Profile ($ in millions) Enhanced Liquidity & Extended Maturity Profile Focused on Debt Reduction Cash Reduction in Term Loans Post Bond Offering Term Loans Nov -2012 Bond Offering Reduction in Drawn Revolver Post Bond Offering In 4Q 2012, Walter Issued of $500MM of Senior Notes due 2020 130 167 297 117 325 442 30-Sep-12 31-Dec-12 63 74 39 113 518 163 170 333 1,124 149 1,273 500 13 14 15 16 17 18 19 20+ |
|
|
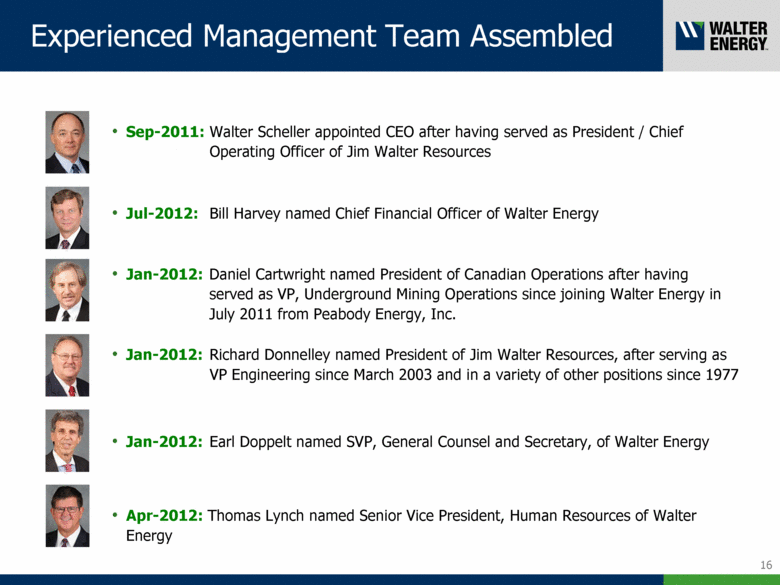
Jul-2012: Bill Harvey named Chief Financial Officer of Walter Energy Experienced Management Team Assembled 16 Sep-2011: Walter Scheller appointed CEO after having served as President / Chief Operating Officer of Jim Walter Resources Jan-2012: Daniel Cartwright named President of Canadian Operations after having served as VP, Underground Mining Operations since joining Walter Energy in July 2011 from Peabody Energy, Inc. Jan-2012: Richard Donnelley named President of Jim Walter Resources, after serving as VP Engineering since March 2003 and in a variety of other positions since 1977 Jan-2012: Earl Doppelt named SVP, General Counsel and Secretary, of Walter Energy Apr-2012: Thomas Lynch named Senior Vice President, Human Resources of Walter Energy |
|
|
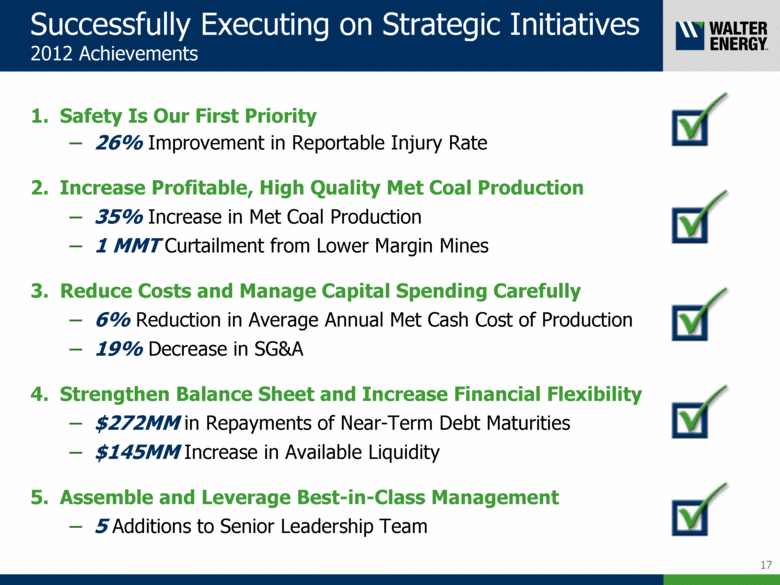
Successfully Executing on Strategic Initiatives 2012 Achievements Safety Is Our First Priority 26% Improvement in Reportable Injury Rate Increase Profitable, High Quality Met Coal Production 35% Increase in Met Coal Production 1 MMT Curtailment from Lower Margin Mines Reduce Costs and Manage Capital Spending Carefully 6% Reduction in Average Annual Met Cash Cost of Production 19% Decrease in SG&A Strengthen Balance Sheet and Increase Financial Flexibility $272MM in Repayments of Near-Term Debt Maturities $145MM Increase in Available Liquidity Assemble and Leverage Best-in-Class Management 5 Additions to Senior Leadership Team 17 1. 2. 3. 4. 5. |
|
|
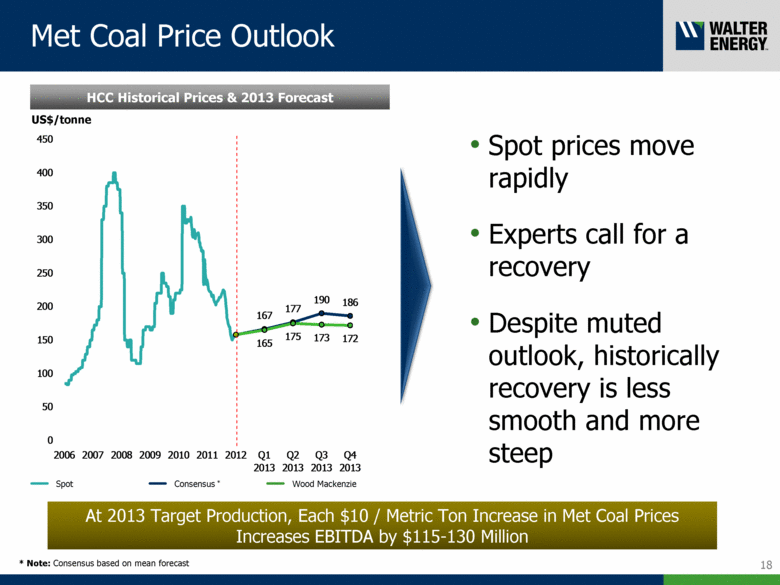
HCC Historical Prices & 2013 Forecast US$/tonne 18 * Note: Consensus based on mean forecast Met Coal Price Outlook Wood Mackenzie Spot Spot prices move rapidly Experts call for a recovery Despite muted outlook, historically recovery is less smooth and more steep At 2013 Target Production, Each $10 / Metric Ton Increase in Met Coal Prices Increases EBITDA by $115-130 Million 186 190 177 167 172 173 175 165 0 50 100 150 200 250 300 350 400 450 2006 2007 2008 2009 2010 2011 2012 Q1 2013 Q2 2013 Q3 2013 Q4 2013 |
|
|
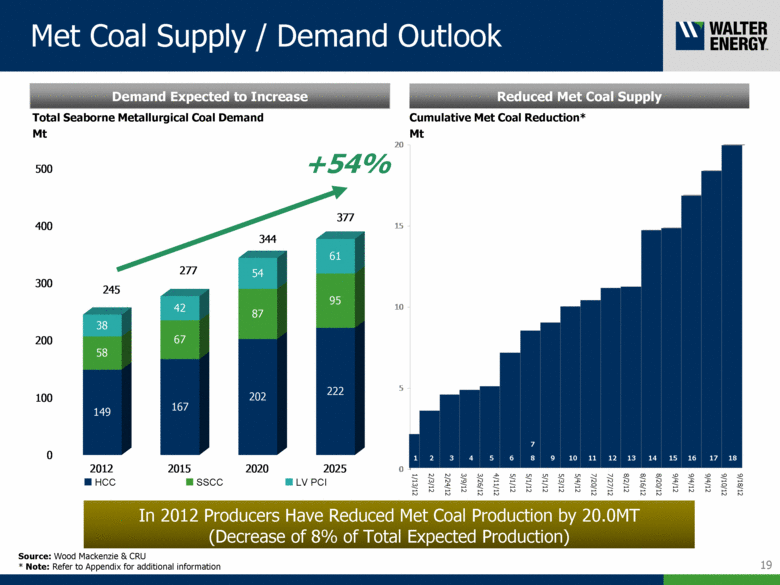
19 1/13/12 2/3/12 2/24/12 3/9/12 3/26/12 4/11/12 5/1/12 5/1/12 5/1/12 5/3/12 5/4/12 7/20/12 7/27/12 8/2/12 8/16/12 8/20/12 9/4/12 9/4/12 9/4/12 9/10/12 9/18/12 1 2 3 4 5 6 7 9 10 11 12 13 14 15 16 17 18 8 Source: Wood Mackenzie & CRU * Note: Refer to Appendix for additional information Total Seaborne Metallurgical Coal Demand Mt LV PCI SSCC +54% Met Coal Supply / Demand Outlook Demand Expected to Increase Reduced Met Coal Supply Cumulative Met Coal Reduction* Mt In 2012 Producers Have Reduced Met Coal Production by 20.0MT (Decrease of 8% of Total Expected Production) 0 5 10 15 20 149 58 38 245 167 67 42 277 202 87 54 344 222 95 61 377 0 100 200 300 400 500 2012 2015 2020 2025 HCC |
|
|
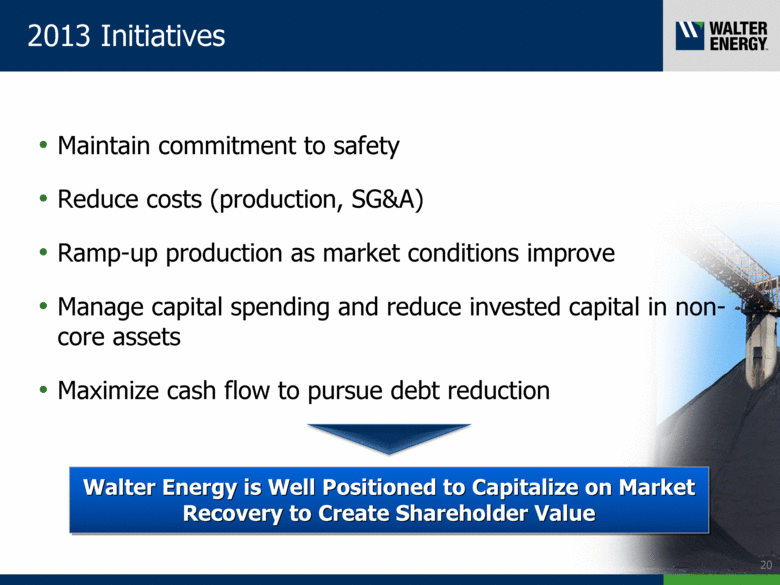
2013 Initiatives Maintain commitment to safety Reduce costs (production, SG&A) Ramp-up production as market conditions improve Manage capital spending and reduce invested capital in non-core assets Maximize cash flow to pursue debt reduction 20 Walter Energy is Well Positioned to Capitalize on Market Recovery to Create Shareholder Value |
|
|
-Questions and Answers- |
|
|
-Appendix- |
|
|
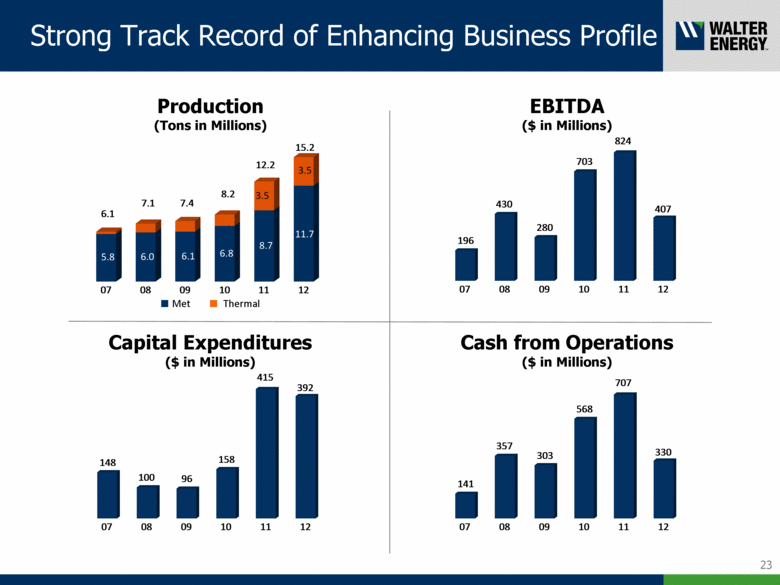
Strong Track Record of Enhancing Business Profile 23 Production (Tons in Millions) Thermal EBITDA ($ in Millions) Capital Expenditures ($ in Millions) Cash from Operations ($ in Millions) 5.8 6.1 6.0 7.1 6.1 7.4 6.8 8.2 8.7 3.5 12.2 11.7 3.5 15.2 07 08 09 10 11 12 196 430 280 703 824 407 07 08 09 10 11 12 141 357 303 568 707 330 07 08 09 10 11 12 148 100 96 158 415 392 07 08 09 10 11 12 Met |
|
|
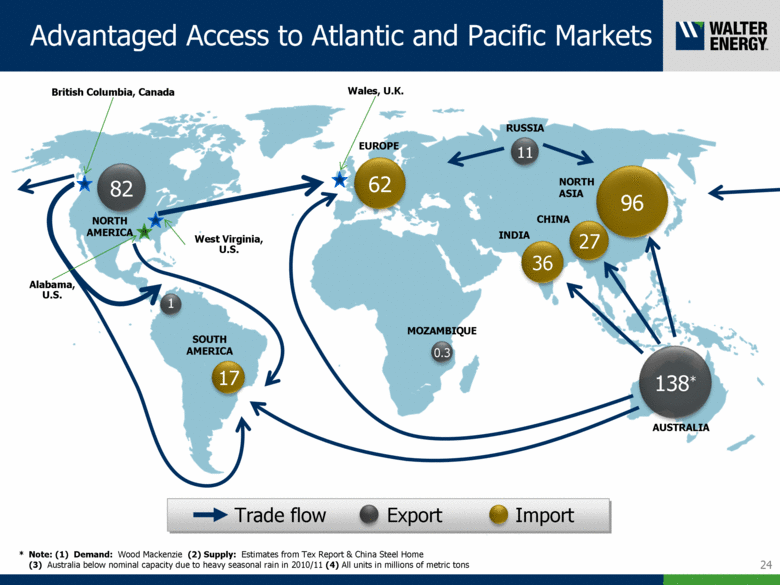
Advantaged Access to Atlantic and Pacific Markets 96 27 36 138* 11 17 62 82 0.3 1 Trade flow Export Import SOUTH AMERICA MOZAMBIQUE EUROPE RUSSIA AUSTRALIA INDIA CHINA NORTH ASIA 24 * Note: (1) Demand: Wood Mackenzie (2) Supply: Estimates from Tex Report & China Steel Home (3) Australia below nominal capacity due to heavy seasonal rain in 2010/11 (4) All units in millions of metric tons Alabama, U.S. West Virginia, U.S. British Columbia, Canada Wales, U.K. NORTH AMERICA |
|
|
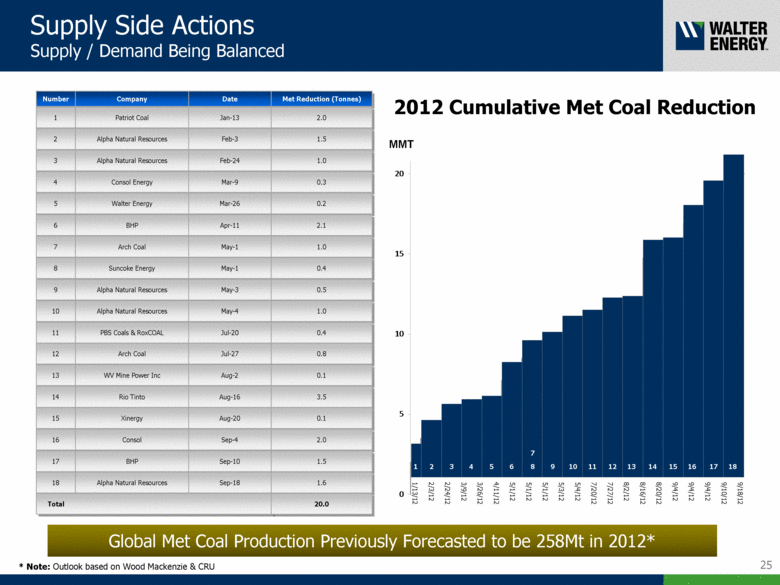
Supply Side Actions Supply / Demand Being Balanced 25 2012 Cumulative Met Coal Reduction 1/13/12 2/3/12 2/24/12 3/9/12 3/26/12 4/11/12 5/1/12 5/1/12 5/1/12 5/3/12 5/4/12 7/20/12 7/27/12 8/2/12 8/16/12 8/20/12 9/4/12 9/4/12 9/4/12 9/10/12 9/18/12 1 2 3 4 5 6 7 9 10 11 12 13 14 15 16 17 18 8 Number 1 2 3 4 5 6 7 8 9 10 11 12 13 14 15 16 17 Company Patriot Coal Alpha Natural Resources Alpha Natural Resources Consol Energy Walter Energy BHP Arch Coal Suncoke Energy Alpha Natural Resources Alpha Natural Resources PBS Coals & RoxCOAL Arch Coal WV Mine Power Inc Rio Tinto Xinergy Consol BHP Date Jan-13 Feb-3 Feb-24 Mar-9 Mar-26 Apr-11 May-1 May-1 May-3 May-4 Jul-20 Jul-27 Aug-2 Aug-16 Aug-20 Sep-4 Sep-10 Met Reduction (Tonnes) 2.0 1.5 1.0 0.3 0.2 2.1 1.0 0.4 0.5 1.0 0.4 0.8 0.1 3.5 0.1 2.0 1.5 18 Alpha Natural Resources Sep-18 1.6 Total 20.0 MMT * Note: Outlook based on Wood Mackenzie & CRU Global Met Coal Production Previously Forecasted to be 258Mt in 2012* 0 5 10 15 20 |
|
|
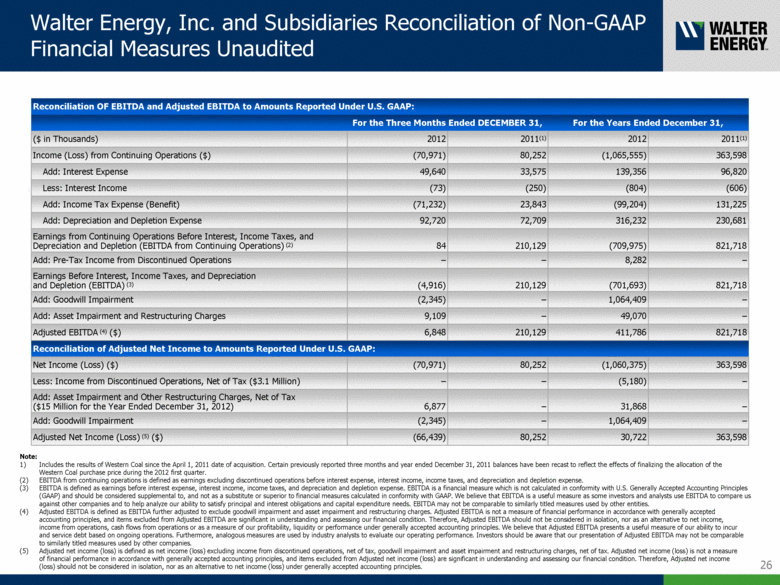
Walter Energy, Inc. and Subsidiaries Reconciliation of Non-GAAP Financial Measures Unaudited Reconciliation OF EBITDA and Adjusted EBITDA to Amounts Reported Under U.S. GAAP: For the Three Months Ended DECEMBER 31, For the Years Ended December 31, ($ in Thousands) 2012 2011(1) 2012 2011(1) Income (Loss) from Continuing Operations ($) (70,971) 80,252 (1,065,555) 363,598 Add: Interest Expense 49,640 33,575 139,356 96,820 Less: Interest Income (73) (250) (804) (606) Add: Income Tax Expense (Benefit) (71,232) 23,843 (99,204) 131,225 Add: Depreciation and Depletion Expense 92,720 72,709 316,232 230,681 Earnings from Continuing Operations Before Interest, Income Taxes, and Depreciation and Depletion (EBITDA from Continuing Operations) (2) 84 210,129 (709,975) 821,718 Add: Pre-Tax Income from Discontinued Operations – – 8,282 – Earnings Before Interest, Income Taxes, and Depreciation and Depletion (EBITDA) (3) (4,916) 210,129 (701,693) 821,718 Add: Goodwill Impairment (2,345) – 1,064,409 – Add: Asset Impairment and Restructuring Charges 9,109 – 49,070 – Adjusted EBITDA (4) ($) 6,848 210,129 411,786 821,718 Reconciliation of Adjusted Net Income to Amounts Reported Under U.S. GAAP: Net Income (Loss) ($) (70,971) 80,252 (1,060,375) 363,598 Less: Income from Discontinued Operations, Net of Tax ($3.1 Million) – – (5,180) – Add: Asset Impairment and Other Restructuring Charges, Net of Tax ($15 Million for the Year Ended December 31, 2012) 6,877 – 31,868 – Add: Goodwill Impairment (2,345) – 1,064,409 – Adjusted Net Income (Loss) (5) ($) (66,439) 80,252 30,722 363,598 Note: 1) Includes the results of Western Coal since the April 1, 2011 date of acquisition. Certain previously reported three months and year ended December 31, 2011 balances have been recast to reflect the effects of finalizing the allocation of the Western Coal purchase price during the 2012 first quarter. (2) EBITDA from continuing operations is defined as earnings excluding discontinued operations before interest expense, interest income, income taxes, and depreciation and depletion expense. (3) EBITDA is defined as earnings before interest expense, interest income, income taxes, and depreciation and depletion expense. EBITDA is a financial measure which is not calculated in conformity with U.S. Generally Accepted Accounting Principles (GAAP) and should be considered supplemental to, and not as a substitute or superior to financial measures calculated in conformity with GAAP. We believe that EBITDA is a useful measure as some investors and analysts use EBITDA to compare us against other companies and to help analyze our ability to satisfy principal and interest obligations and capital expenditure needs. EBITDA may not be comparable to similarly titled measures used by other entities. (4) Adjusted EBITDA is defined as EBITDA further adjusted to exclude goodwill impairment and asset impairment and restructuring charges. Adjusted EBITDA is not a measure of financial performance in accordance with generally accepted accounting principles, and items excluded from Adjusted EBITDA are significant in understanding and assessing our financial condition. Therefore, Adjusted EBITDA should not be considered in isolation, nor as an alternative to net income, income from operations, cash flows from operations or as a measure of our profitability, liquidity or performance under generally accepted accounting principles. We believe that Adjusted EBITDA presents a useful measure of our ability to incur and service debt based on ongoing operations. Furthermore, analogous measures are used by industry analysts to evaluate our operating performance. Investors should be aware that our presentation of Adjusted EBITDA may not be comparable to similarly titled measures used by other companies. (5) Adjusted net income (loss) is defined as net income (loss) excluding income from discontinued operations, net of tax, goodwill impairment and asset impairment and restructuring charges, net of tax. Adjusted net income (loss) is not a measure of financial performance in accordance with generally accepted accounting principles, and items excluded from Adjusted net income (loss) are significant in understanding and assessing our financial condition. Therefore, Adjusted net income (loss) should not be considered in isolation, nor as an alternative to net income (loss) under generally accepted accounting principles. 26 |
|
|
-WLT- |

