Attached files
| file | filename |
|---|---|
| 8-K - FORM 8-K - SEALED AIR CORP/DE | d492553d8k.htm |
 SEALED AIR CORPORATION
JP Morgan Global High Yield and Leveraged Finance Conference
February 25, 2013
Carol P. Lowe –
Senior Vice President & Chief Financial Officer
Tod S. Christie -
Treasurer
Exhibit 99.1 |
 Safe
Harbor and Regulation G Statement 1
•
This presentation contains “forward-looking statements” within the meaning of the
Private Securities Litigation Reform Act of 1995. Forward-looking statements can be
identified by such words as “anticipates,” “believes,” “plan,”
“assumes,” “could,” “estimates,” “expects,” “intends,” “may,” “plans to,” “will” and similar expressions.
Examples of these forward-looking statements include 2013 financial expectations and assumptions
associated with our 2011-2014 Integration & Optimization Program, availability and
pricing of raw materials, success of our growth programs, economic conditions, and the success
of pricing actions. These statements reflect our beliefs and expectations as to future events
and trends affecting our business, our consolidated financial position and our results of
operations. A variety of factors may cause actual results to differ materially from these
expectations, including general domestic and international economic and political conditions
affecting packaging utilization; changes in our raw material and energy costs; credit ratings;
competitive conditions and contract terms; currency translation and devaluation effects,
including Venezuela; the success of our financial growth, profitability and manufacturing
strategies and our cost reduction and productivity efforts; the effects of animal and
food-related health issues; pandemics; environmental matters; regulatory actions and legal
matters; and the successful integration of Diversey. For more extensive information, see
“Risk Factors” and “Cautionary Notice Regarding Forward-Looking Statements,”
which appear in our most recent Annual Report on Form 10-K, as filed with the Securities
and Exchange Commission, and as revised and updated by our Quarterly Reports on Form 10-Q
and Current Reports on Form 8-K. While we may elect to update these forward-looking
statements at some point in the future, we specifically disclaim any obligation to do so,
whether as a result of new information, future events, or otherwise.
•
Our management uses non-U.S. GAAP financial measures to evaluate the Company’s performance,
which exclude items we consider unusual or special items. We believe the use of such financial
measures and information may be useful to investors. We believe that the use of non-U.S.
GAAP measures helps investors to gain a better understanding of core operating results and
future prospects, consistent with how management measures and forecasts the Company's
performance, especially when comparing such results to previous periods or forecasts. For
important information on our use of non-U.S. GAAP financial measures and information,
including reconciliations of such non-U.S. GAAP financial measures and information to
comparable U.S. GAAP measures and information, please refer to the financial tables and information
provided in our earnings release. |
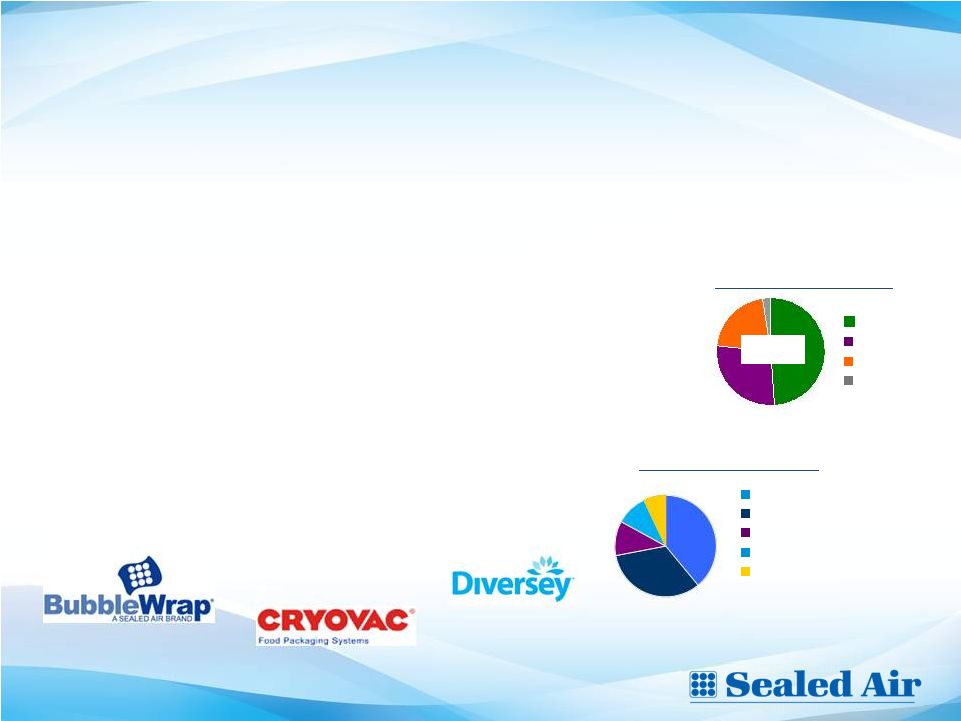 Premium global provider with #1 or #2 position in our principal
applications
2
(1)
Please see Sealed Air’s February 19, 2013 earnings press release for a
definition of developing regions. •
Food and Beverage (F&B)
–
Food Packaging and Food Solutions businesses, along with Diversey food and
beverage hygiene solutions business •
Protective Packaging (PP)
–
Protective Packaging and Specialty Materials (formerly part of Other)
•
Institutional and Laundry (I&L)
–
Building services, food service, health care, hospitality and retail markets
•
Medical Applications and New Ventures (Other category)
•
Geographic Reporting structure
–
North America
–
Europe
–
Latin America
–
AMAT (Asia, Middle East, Africa and Turkey)
–
Japan and Australia/New Zealand
49% F&B
28% I&L
21% PP
2% Other
Diversified Revenue
Geographical Reach
39% N. Am
33% Europe
11% L. Am
10% AMAT
7%
Japan/ANZ
24% Developing
regions
(1)
$7.6B |
 3
2013: Focus on Quality of Earnings
•
Improving Profitability
–
Pricing Discipline
–
Deliver cost synergies and manage cost structure
•
Resource Prioritization
–
Repayment of debt
–
Dividends
–
R&D productivity
•
Alignment of Management Goals
–
Productivity: Support expenses measured in
relation to profitability –
Achieving Plan: Adjusted EBITDA
–
Cash Flow: Reduced investment in working
capital 3 |
 4
Food & Beverage: Value Creation In Operations and Downstream
•
We protect customers’
products from farm to fork
and add value through operational efficiency and
waste reduction
•
Distinct Competitive Advantages:
Focused on food safety, shelf life extension, brand enhancement
and operational efficiency
Breadth to address hygiene, water/energy management, packaging
and integrated solutions
Only provider with a total system solution
Long-standing relationships and large installed equipment base
Global footprint serves multi-national & local customers
Solutions designed for operational efficiency & lower waste
Fast Facts
$50B global industry with
2-3% p.a. growth rate (‘11-‘16)
#1 position in targeted app’s
2012 SNAPSHOT
Sales: $3.7B
Sales Mix by Geography:
Sales Mix by End Sector:
N. Am
Europe
L. Am
AMAT
J/ANZ
40%
28%
14%
6%
12%
*FM=Fresh meat (all types); S&P=Smoked & Processed; Other: Microwavable meals, Fluids;
C&H=Cleaning & Hygiene. All include their related equipment sales.
42%
15%
10%
15%
19%
FM*
S&P*
Dairy
Other*
C&H* |
 5
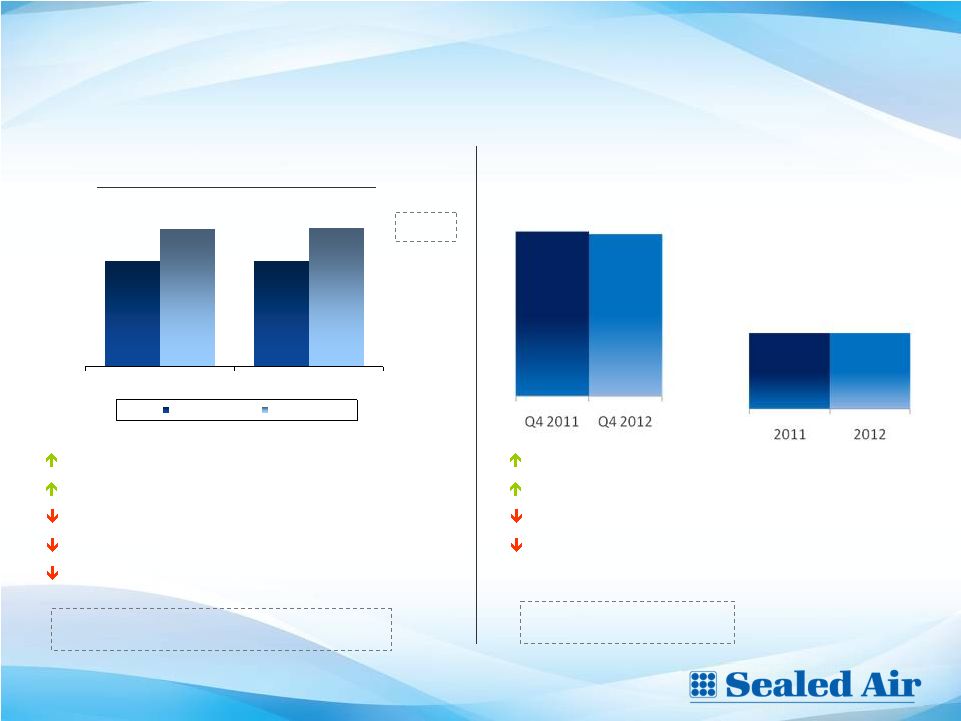
Food & Beverage: Achieved Volume and Margin Improvement
•
•
Hygiene Sales Organic Growth: 5.6%
•
Food Pkg. & Sol. Org. Growth: 1.7%
•
•
Hygiene Sales Organic Growth: 4.1%
•
Food Pkg. & Sol. Org. Growth: 2.1%
•
•
•
•
Food and Beverage
Net Sales Trends
Net Sales ($M)
Adj. EBITDA ($M)
172
259
547
Q4 2011
978
175
247
564
Q4 2012
986
PF Net Sales ($M)
PF Adj. EBITDA ($M)
3740
708
3777
2053
987
2061
1015
690
14.3%
15.6%
154
139
534
527
14.3%
14.0%
2011
2012
2011
2012
Hygiene
Food
Solutions
Food
Packaging
Q4 Net Sales: +2.4% organic growth
2012 Net Sales: +2.4% organic growth
Q4
Adjusted
EBITDA
growth
of
10.4%
2012 FY Pro Forma Adjusted EBITDA growth
of 1.3%
Largest
growth
drivers:
Developing
regions:
Brazilian
beef
production,
new
products
Challenges:
North
American
protein
supply
constraints,
product
mix
Q4 2011
Q4 2012
Please see Sealed Air’s February 19, 2013 earnings press release for important information about
the use of non-U.S. GAAP financial measurers, including applicable reconciliations to U.S.
GAAP financial measures.
All results are on a continuing operations
basis. |
 6
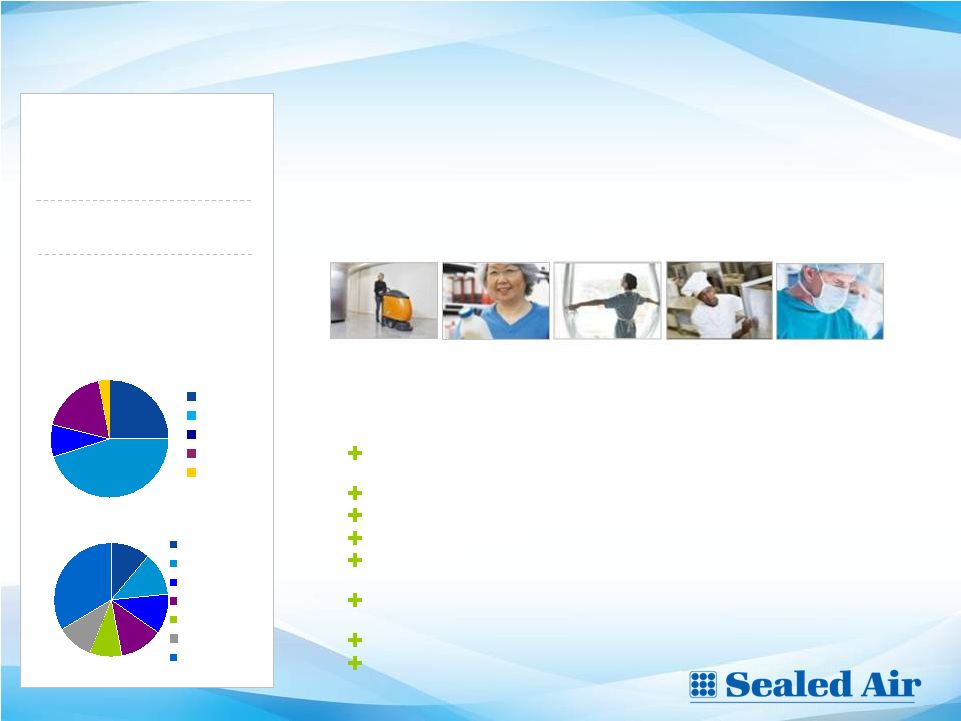
Institutional & Laundry: Reducing the “Total Cost to Clean”
•
Provide innovative, integrated cleaning, hygiene,
food safety and infection prevention solutions
•
Focused on growth in five sectors
•
Distinct Competitive Advantages:
Cost savings through operational efficiencies and Integrated
solutions
Market leadership in Europe & developing regions (80% of sales)
Global footprint serves multi-national & local customers,
Building service contractor sector dominance
Integrated Floor care Solutions ( Machines, Cleaning tools &
Chemicals) -
TASKI
®
Industry and Application expertise to ensure adherence to
protocols, optimal use of resources (water, effluence, energy),
Strong Distributor relationships
Emerging Markets leadership
Fast Facts
$30B global industry with
2-3% p.a. growth rate (‘11-‘16)
#1, #2 position
globally, #1 in
floor care solutions 2012 Snapshot
Sales: $2.1B
Sales Mix by Geography:
Sales Mix by End Sector:
11%
12%
11%
12%
9%
10%
33%
BSC**
Food Svc
Retail
Lodging
Hlthcare
Other
Distrib
Facility
Management &
BSC
Retailers
Hospitality
Food Service
Healthcare
**BSC=Building Service Contractors
25%
45%
9%
18%
3%
N. Am
Europe
L. Am
AMAT
Japan/ANZ |
 7
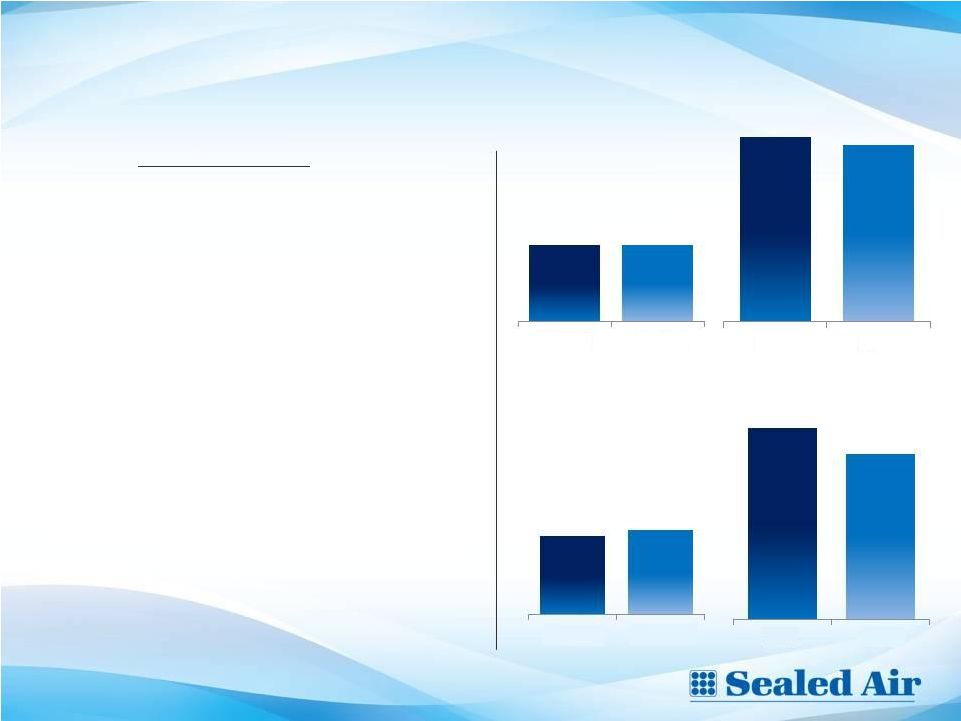
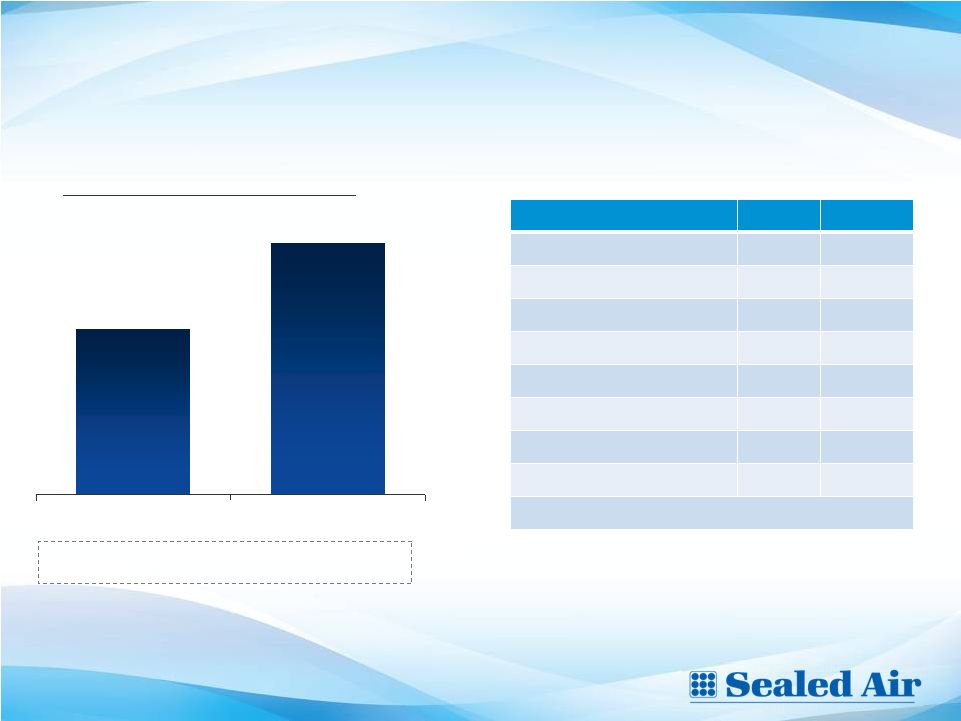
Institutional and Laundry: Adjusted EBITDA and Margin Improvement
•
Q4 Net Sales: -0.1%; +2.3% organic growth
•
+1.6% price/mix
•
+0.7% volume
•
2012 Net Sales: -4.5%, +0.2% organic growth:
•
+2.2% price/mix
•
-2.0% volume
•
Q4 Adjusted EBITDA growth of 9.1%
•
2012 FY Pro Forma Adjusted EBITDA decline
of -10.5%
•
•
Institutional & Laundry
Net Sales Trends
Please see Sealed Air’s February 19, 2013 earnings press release for important
information about the use of non-U.S. GAAP financial measurers,
including applicable reconciliations to U.S. GAAP financial measures. All
results are on a continuing operations basis. Net Sales ($M)
534
Adj. EBITDA ($M)
PF Net Sales ($M)
PF Adj. EBITDA ($M)
196
219
7.2%
7.9%
9.8%
9.2%
Q4 2011
Q4 2012
Q4 2011
Q4 2012
2232
2132
2011
2012
534
2011
2012
Challenges
:
Europe
–
Gov’t/Educ.,
Consumer
Brands, and Building Service contractors due to lower
equipment orders, Southern Europe
Largest
Growth
Drivers:
New
customers
in
China/India and Brazil/Mexico, New healthcare business
39
42 |
 8
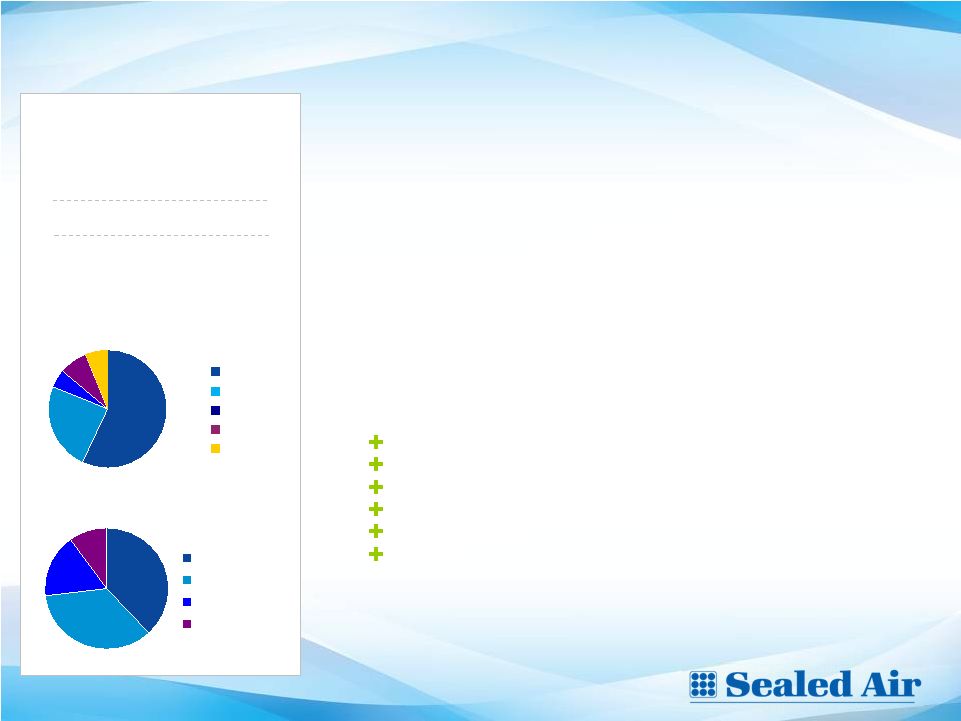
Protective Packaging: Focused on Sustainable & Efficient Delivery
•
Packaging solutions that provide efficiency and
sustainability from factory floor to the customer’s
door
•
Revenue mix by channel:
–
~80%
via
business
supply
distributors
–
sold
to
businesses
representing 400+ SIC codes (largely industrial use)
–
~15% direct (OEMs, E-commerce, Fulfillment firms)
–
~5% at retailers
•
Distinct Competitive Advantages:
Innovative: market and technical leadership
Broadest, high performance, sustainable solutions offer
Total system: operational efficiency, ease of use, less waste
Unparalleled customer support: sales, service, design labs
Strong channel partnerships
Global footprint for multi-national and local customers
Fast Facts
$18B global industry with
~3% p.a. growth rate (‘11-‘16)
Leader in targeted applications
2012 SNAPSHOT
Sales: $1.6B
Sales Mix by Geography:
Sales Mix by End Sector:
38%
35%
17%
10%
Cushioning
Core*
Shrink
Pack Sys*
*Core=Bubblewrap, PakNatural loose fill, Jiffy mailers; Pack Sys=NewAir IB,
PriorityPak, Fill-Air, FilTeck, PackTiger, FasFil EZ, RapidFill 57%
24%
5%
8%
6%
N. Am
Europe
L. Am
AMAT
Japan/ANZ |
 9
Protective Packaging: Gains in Adjusted EBITDA and Margin
•
Q4 Net Sales: +0.6%; 1.5% organic growth
•
2.6% volume
•
(1.1)% price/mix
•
2012 Net Sales: -1.1%; 1.4% organic growth
•
1.4% volume
•
-0.2% price/mix
•
Q4 Adjusted EBITDA growth of 4.2%
•
2012 FY Adjusted EBITDA growth of 1.4%
•
Largest
growth
drivers:
E-commerce
application systems in North America, and new
customers
•
Challenges:
Competitive pricing environment
with not all market participants seeking raw material
cost recovery. Pricing actions in place for 1H 2013.
Protective Packaging Segment
Net Sales Trends
Net Sales ($M)
Adj. EBITDA ($M)
PF Net Sales ($M)
Adj. EBITDA ($M)
Please see Sealed Air’s February 19, 2013 earnings press release for important information about
the use of non-U.S. GAAP financial measurers, including applicable reconciliations to U.S.
GAAP financial measures.
All results are on a continuing operations
basis. |
 10
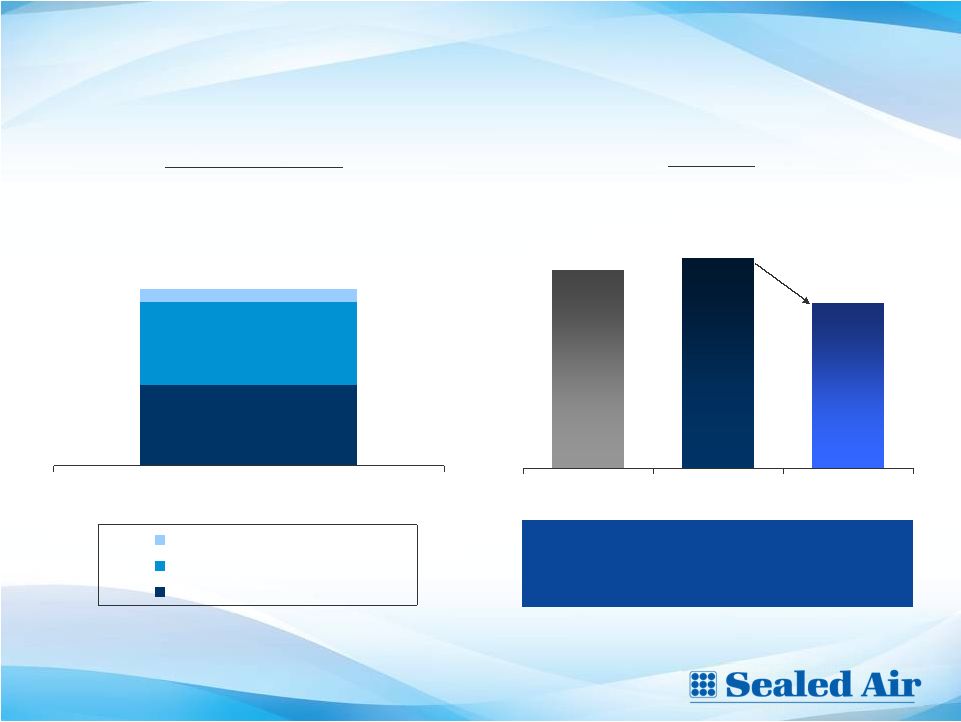
Consolidated Adjusted EBITDA Performance
Fourth Quarter 2012
229
229
267
269
Actual
Constant Dollar
Q4 2011
Q4 2012
Cost synergies
Volume
Price Cost Spread
SG&A Expenses
Currency
($ in millions)
Q4-12 YEAR-OVER-YEAR
Adjusted
EBITDA
Performance
Volume
Synergies
Currency
SG&A Expenses
Reported U.S. GAAP Net Earnings/(Loss):
Q4-2012: $174M, Q4-2011: $(60)M, 3Q-2012: $74M
11.7%
13.5%
11.7%
+17%
13.5%
13.5%
7785
7648
13.5%
13.5%
996
996
Reported U.S. GAAP Net Sales:
2011: $5.6B, 2012: $7.6B
12.8%
13.0%
2012
PF Net Sales ($M)
2012
PF Adj. EBITDA ($M)
Please see Sealed Air’s February 19, 2013 earnings press release for important information about
the use of non-U.S. GAAP financial measurers, including applicable reconciliations to U.S.
GAAP financial measures.
All results are on a continuing operations
basis. |
 11
11
Adjusted Free Cash Flow and Working Capital
($ in millions)
266
405
4Q-2012
YTD
Free Cash Flow Performance
Reported U.S. GAAP Net Income:
Q4 2012
$(11)M (Loss) YTD-2012 = $(1.3)B
* Working
Capital
includes
the
impact
of
foreign
currency
translation
and
is
defined
as
Trade
Accounts
Receivable,
Inventory
and
Trade
Accounts
Payable.
Please see Sealed Air’s February 19, 2013 earnings press release for important
information about the use of non-U.S. GAAP financial measurers,
including applicable reconciliations to U.S. GAAP financial measures. All
results are on a continuing operations basis. Adjusted Free Cash Flow
Q412
2012
Adjusted Net Earnings
$ 69.9
$ 200.5
Amortization of Intangibles
25.2
97.7
Non-cash Interest & Taxes
94.2
103.0
Depreciation and Amortization
12.6
170.1
Capital Expenditures
(26.6)
(124.4)
Changes in Working Capital*
91.0
(41.8)
Adjusted Free Cash Flow
$ 266.3
$ 405.1
*Currency impact on FY working capital: $(14) |
 680
700
112
December 2012
AR Securitization
Revolving Credit Facility
Cash & Cash Equivalents
12
12
Liquidity & Net Debt
($ in millions)
Liquidity Position
1,492
5,262
5,131
4,779
Dec 2011
Sept 2012
Dec 2012
Net Debt
Full year net debt reduction includes
use of $313 million from proceeds of
Diversey Japan
(483)
Please see Sealed Air’s February 19, 2013 earnings press release for important information
about the use of non-U.S. GAAP financial measurers, including applicable reconciliations to
U.S. GAAP financial measures.
All results are on a continuing operations
basis. |
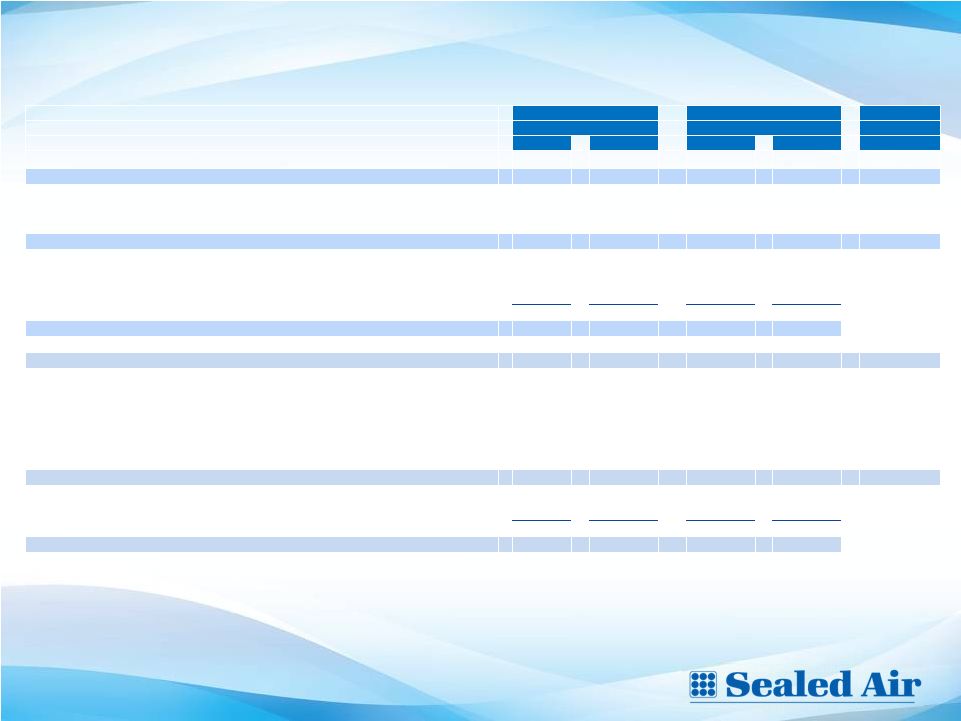
 13
Q4 Actions have amended covenants to provide ample flexibility
and have extended our maturity schedule
330
408
400
750
425
750
450
925
8
150
760
150
2013
2014
2015
2016
2017
2018
2019
2020
2021
2033
= Senior Secured Credit Facilities (term loans) = $1.655B
= W.
R.
Grace
Settlement
**
= Bonds (associated interest rate) =
$2.925B Updated Debt Maturity Schedule*
($ millions)
12.0%
7.875%
8.125%
8.375%
6.875%
* For more detail, please see Sealed Air’s Form 8-K filing dated
11/19/2012 **Reflects estimated cash liability at December 31, 2013. Exact
timing of the settlement is unknown. 6.5%
Updated
Covenant:
Net
Total
Leverage
Ratio*
(fiscal
year
ending
December
31
st
)
2012
2013
2014
2015
2016+
5.50
5.25
4.50
3.75
3.25
Weighted average interest rate
Is approx. 6.4% |
 FY2013 Outlook
•
Management estimates achieving the following full year results:
–
Net Sales between approximately $7.7 billion and $7.9 billion
–
Adjusted EBITDA between approximately $1.01 billion and $1.03 billion
–
Earnings Per Share between approximately $1.10 and $1.20 per share
–
Free Cash Flow approximately $300 million to $350 million
•
Compares with $280 million in 2012
14
Adjusted EPS guidance excludes the payment of the W. R. Grace settlement, as the
exact timing of the settlement is unknown. Final payment of the W. R.
Grace settlement is expected to be accretive to adjusted EPS by approximately $0.13 annually following the payment date under
the assumption of using a substantial portion of cash on hand for the payment and
ceasing to accrue interest on the settlement amount. Additionally,
guidance excludes any non-operating gains or losses that may be recognized in 2013 due to currency fluctuations in Venezuela.
Please see Sealed Air’s February 19, 2013 earnings press release for important information about
the use of non-U.S. GAAP financial measurers, including applicable reconciliations to U.S.
GAAP financial measures.
All results are on a continuing operations
basis. |
 SEALED AIR CORPORATION
Earnings Conference Call
Fourth Quarter 2012
Q&A
Please see Sealed Air’s February 19, 2013 earnings press release for important information about
the use of non-U.S. GAAP financial measurers, including applicable reconciliations to U.S.
GAAP financial measures.
All results are on a continuing operations
basis. |
 SEALED AIR CORPORATION
Earnings Conference Call
Fourth Quarter 2012
Appendix
Please see Sealed Air’s February 19, 2013 earnings press release for important information about
the use of non-U.S. GAAP financial measurers, including applicable reconciliations to U.S.
GAAP financial measures.
All results are on a continuing operations
basis. |
 2012
Adjusted EPS Calculation 17
2012
Net Sales
$ 7,648
Adjusted EBITDA
996.0
Interest expense
(385.0)
Depreciation and amortization
(321.0)
Non-cash profit sharing
(1)
(18.9)
Adjusted Pre-tax Earnings
271.1
Core income tax provision
26.1%
Core income taxes
70.7
Adjusted Net Earnings
200.4
Diluted shares outstanding
211.2
Adjusted EPS
$
0.95
Reported U.S. GAAP Measures (from Continuing Operations):
2012 Net Sales: $7.6B, Operating Loss: $(0.8)B; Net Loss $(1.3)B
(1)
Contributions to be made in Sealed Air common stock
Please see Sealed Air’s February 19, 2013 earnings press release for important information about
the use of non-U.S. GAAP financial measurers, including applicable reconciliations to U.S.
GAAP financial measures.
All results are on a continuing operations
basis. |
 Q4
2012 Adjusted EBITDA Bridge 18
229
-11
17
35
-22
7
12
267
($ millions)
Please see Sealed Air’s February 19, 2013 earnings press release for important
information about the use of non-U.S. GAAP financial measurers,
including applicable reconciliations to U.S. GAAP financial measures. All
results are on a continuing operations basis. Q4 2011
Volume
Price-Cost
Spread
Synergies
SG&A
SARs
Other
Q4 2012 |
 Reconciliation of US GAAP Gross Profit and Operating Profit To
Non U.S. GAAP Adjusted Gross Profit and Operating Profit
19
Three Months Ended
Year Ended
Year Ended
($ in millions)
December 31,
December 31,
December 31,
2012
2011
2012
2011
2011
Revised
(2)
Revised
(2)
Pro Forma
(3)
U.S.
GAAP
gross
profit
-
continuing
operations
$
651.3
$
631.4
$
2,544.3
$
1,600.3
$
2,616.0
As a % of total net sales
32.9%
32.2%
33.3%
28.8%
33.6%
Segment special items
(4)
7.4
15.9
18.0
16.4
5.0
Non-U.S.
GAAP
adjusted
gross
profit
-
continuing
operations
$
658.7
$
647.3
$
2,562.3
$
1,616.7
$
2,621.2
As a % of total net sales
33.3%
33.0%
33.5%
29.1%
33.7%
Gross profit from discontinued operations
18.8
40.9
114.0
40.9
Total non-U.S. GAAP adjusted gross profit
$
677.5
$
688.2
$
2,676.3
$
1,657.6
U.S.
GAAP
operating
profit
-
continuing
operations
$
118.2
$
47.5
$
(881.2)
$
429.4
$
596.0
Special items:
Restructuring charges
32.3
52.4
142.4
52.2
53.4
Costs related to the acquisition and integration of Diversey
2.6
34.1
7.4
64.8
-
Segment special items
(5)
38.1
24.2
1,397.1
24.2
31.1
Non-U.S.
GAAP
adjusted
operating
profit
-
continuing
operations
$
191.2
$
158.2
$
665.7
$
570.6
$
680.5
9.7%
8.1%
8.7%
10.3%
8.7%
Operating profit from discontinued operations
8.2
17.9
34.2
17.9
Total non-U.S. GAAP adjusted operating profit
$
199.4
$
176.1
$
699.9
$
588.5
As a % of total net sales
10.1%
9.0%
9.2%
10.6%
The Company is working to finalize its goodwill and other intangible assets
impairment analysis prior to the filing of its Annual Report on Form
10-K for the year ended December 31, 2012, and as a result may incur additional impairment
charges
(4) For 2012, these items primarily consist of costs associated with our 2011 - 2014 Integration
and Optimization program, including asset impairment charges in 2012. For 2011, these items primarily consist of the step-up in inventories as a result the purchase accounting for the
acquisition of Diversey. These items are not part of our on-going business and are not expected to
have a continuing impact on our consolidated results. (5) For 2012, these items are certain one-time costs that were included in our segments' operating
results. For 2012, these items primarily include the impairment charges recorded for impairment of goodwill and other intangible assets and in-process research and development. For
2011, these costs primarily include the step-up in inventories mentioned above and costs related to
the implementation of our European principal company structure. These items are not part of our ongoing business and are not expected to have a continuing impact on our
consolidated results.
The amounts presented for 2012 are subject to change prior to the filing of our upcoming Annual Report
on Form 10-K. In November 2012, we sold our Diversey Japan business. The financial results of the Diversey Japan
business are reported as discontinued operations, and, accordingly all previously reported financial information has been revised.
The pro forma information included in this supplemental information consist of estimates based on
historical data of Diversey and illustrate the effects of our acquisition of Diversey, assuming it had been completed on January 1, 2011. The unaudited pro forma results are not
necessarily indicative of the results of operations that would have actually occurred had the
acquisition been completed as of that date, nor are they indicative of future operating results of the combined company. The pro forma results reflect adjustments made in accordance with
Article 11 of Regulation S-X. We have changed certain estimates and assumptions supporting the pro
forma information to reflect the sale of the Diversey Japan business, the refinement of estimates and assumptions related to the amortization of acquired intangible assets,
additional policy harmonization and foreign currency exchange rates.
(1)
(2)
(3) |
 Revised Segment and Consolidated Adjusted Operating Profit and
Adjusted EBITDA
(1)(2)
Three Months Ended March 31, 2012
Food & Beverage
Institutional
& Laundry
Protective
Packaging
Medical Applications
and New Ventures
Restructuring
and other costs
Total Segments
and Other
Net Sales
$
895.1
$ 510.2
$ 391.3
$
48.8 NA
$
1,845.4 Operating profit
$
82.3
$
(0.7)
$ 50.9
$
(0.6)
$
(48.8)
$
83.1 Add:
Business
segment
special
items
(3)
2.4
5.5
0.1
-
48.8
56.8
Adjusted operating profit
84.7
4.8
51.0
(0.6)
-
139.9
as a % of net sales
9.5%
0.9%
13.0%
-1.2%
7.6%
Depreciation and amortization
41.4
30.7
9.7
2.7
NA
84.5
Segment and Other Adjusted EBITDA
$
126.1
$ 35.5
$
60.7
$
2.1
$
-
$
224.4 as a % of net sales
14.1%
7.0%
15.5%
4.3%
12.2%
Segment and Other Adjusted EBITDA
$
224.4 Non-cash profit sharing
expense 7.8
Other income and expense
(4.0)
Add:
Other
special
items
(4)
0.2
Consolidated Adjusted EBITDA
$
228.4 as a % of net sales
12.4%
20
The Company is working to finalize its goodwill and other intangible assets
impairment analysis prior to the filing of its Annual Report on Form
10-K for the year ended December 31, 2012, and as a result may incur additional impairment
charges
During the fourth quarter of 2012, we began to operate under a new business division structure for our
segment reporting structure. The new segment reporting structure consists of three global business
divisions: Food & Beverage, Institutional & Laundry, Protective Packaging and an
“Other” category, which includes our Medical Applications and New Ventures businesses. This new structure replaced our
legacy seven business unit structure and Diversey's legacy four region-based structure. The changes
to the segment structure have no effect on the historical consolidated results of operations. Prior period
segment results have been conformed to the new segment presentation. In November 2012,
we sold our Diversey Japan business. The financial results of the Diversey Japan business are reported as discontinued operations, and, accordingly all previously reported financial
information has been revised. (3) These special
items consist of certain one-time costs or charges that were included in our segments' operating results, including non-cash impairment charges recorded for impairment of goodwill and
other intangible assets and in-process research and development. These special items also include
costs associated with our 2011 - 2014 Integration and Optimization Program.
(4) These special items primarily consist of certain one-time costs or charges that were included in
other income and expense on our consolidated statements of operations, including an other-than-temporary
impairment on one of our equity method investments in a joint venture
(1)
(2)
(3)
(4)
50.9 |
 Revised Segment and Consolidated Adjusted Operating Profit and
Adjusted EBITDA
(1)(2)
Three Months Ended June 30, 2012
Food & Beverage
Institutional
& Laundry
Protective
Packaging
Medical Applications
and New Ventures
Restructuring
and other costs
Total Segments
and Other
Net Sales
$ 922.6
$ 560.5
$ 390.8
$
50.7 NA
$
1,924.6 Operating profit
$
69.9
$ 20.9
$
46.7
$
(1.0)
$
(28.0)
$
108.5 6.0
7.4
0.4
-
28.0
41.8
Adjusted operating profit
75.9
28.3
47.1
(1.0)
-
150.3
as a % of net sales
8.2%
5.0%
12.1%
-2.0%
7.8%
Depreciation and amortization
36.5
32.4
9.5
2.7
NA
81.1
Segment and Other Adjusted EBITDA
$ 112.4
$ 60.7
$
56.6
$
1.7
$
-
$
231.4 as a % of net sales
12.2%
10.8%
14.5%
3.4%
12.0%
Segment and Other Adjusted EBITDA
$
231.4 Non-cash profit sharing
expense 1.8
Other income and expense
(29.2)
Add: Other special items
23.6
Consolidated Adjusted EBITDA
$
227.6 as a % of net sales
11.8%
21
(1)
During
the
fourth
quarter
of
2012,
we
began
to
operate
under
a
new
business
division
structure
for
our
segment
reporting
structure.
The
new
segment
reporting
structure
consists
of
three
global
business
divisions:
Food
&
Beverage,
Institutional
&
Laundry,
Protective
Packaging
and
an
“Other”
category,
which
includes
our
Medical
Applications
and
New
Ventures
businesses.
This
new
structure
replaced
our
legacy
seven
business
unit
structure
and
Diversey's
legacy
four
region-based
structure.
The
changes
to
the
segment
structure
have
no
effect
on
the
historical
consolidated
results
of
operations.
Prior
period
segment
results
have
been
conformed
to
the
new
segment
presentation.
(2)
In November 2012, we sold our Diversey Japan business. The financial results of the
Diversey Japan business are reported as discontinued operations, and, accordingly all previously reported financial information has been revised.
(3)
(3) These special items consist of certain one-time costs or charges that were
included in our segments' operating results, including non-cash impairment charges recorded for impairment of goodwill and other intangible assets and in-
(4)
(4) These special items primarily consist of certain one-time costs or charges
that were included in other income and expense on our consolidated statements of operations, including an other-than-temporary impairment on one of our
equity method investments in a joint venture
The Company is working to finalize its goodwill and other intangible assets
impairment analysis prior to the filing of its Annual Report on Form
10-K for the year ended December 31, 2012, and as a result may incur additional impairment
charges
process research and development. These special items also include costs associated with our 2011 -
2014 Integration and Optimization Program. (3)
(4)
Add: Business segment special items |
 Revised Segment and Consolidated Adjusted Operating Profit and
Adjusted EBITDA
(1)(2)
Three Months Ended September 30, 2012
Food & Beverage
Institutional
& Laundry
Protective
Packaging
Medical Applications
and New Ventures
Restructuring
and other costs
Total Segments
and Other
Net Sales
$ 935.5
$ 527.2
$ 388.9
$
48.7 NA
$
1,900.3 Operating profit
$ (228.1)
$ (976.1)
$
52.9
$
(1.6)
$
(38.1)
$
(1,191.0) Add:
Business
segment
special
items
334.9
1,001.2
1.0
0.1
38.1
1,375.3
Adjusted operating profit
106.8
25.1
53.9
(1.5)
-
184.3
as a % of net sales
11.4%
4.8%
13.9%
-3.1%
9.7%
Depreciation and amortization
34.9
32.6
10.4
4.3
NA
82.2
Segment and Other Adjusted EBITDA
$ 141.7
$ 57.7
$
64.3
$
2.8
$
-
$
266.5 as a % of net sales
15.1%
10.9%
16.5%
5.7%
14.0%
Segment and Other Adjusted EBITDA
$
266.5 Non-cash profit sharing
expense 4.7
Other income and expense
1.2
Add:
Other
special
items
0.5
Consolidated Adjusted EBITDA
$
272.9 as a % of net sales
14.4%
22
(1)
During
the
fourth
quarter
of
2012,
we
began
to
operate
under
a
new
business
division
structure
for
our
segment
reporting
structure.
The
new
segment
reporting
structure
consists
of
three
global
business
divisions:
Food
&
Beverage,
Institutional
&
Laundry,
Protective
Packaging
and
an
“Other”
category,
which
includes
our
Medical
Applications
and
New
Ventures
businesses.
This
new
structure
replaced
our
legacy
seven
business
unit
structure
and
Diversey's
legacy
four
region-based
structure.
The
changes
to
the
segment
structure
have
no
effect
on
the
historical
consolidated
results
of
operations.
Prior
period
segment
results
have
been
conformed
to
the
new
segment
presentation.
(2)
In November 2012, we sold our Diversey Japan business. The financial results of the
Diversey Japan business are reported as discontinued operations, and, accordingly all previously reported financial information has been revised.
(3)
(3) These special items consist of certain one-time costs or charges that were
included in our segments' operating results, including non-cash impairment charges recorded for impairment of goodwill and other intangible assets and in-
(4)
(4) These special items primarily consist of certain one-time costs or charges
that were included in other income and expense on our consolidated statements of operations, including an other-than-temporary impairment on one of our
equity method investments in a joint venture
The Company is working to finalize its goodwill and other intangible assets
impairment analysis prior to the filing of its Annual Report on Form
10-K for the year ended December 31, 2012, and as a result may incur additional impairment
charges
process research and development. These special items also include costs associated with our 2011 -
2014 Integration and Optimization Program. (3)
(4) |
 Revised Segment and Consolidated Adjusted Operating Profit and
Adjusted EBITDA
(1)(2)
Three Months Ended December 31, 2012
Food & Beverage
Institutional
& Laundry
Protective
Packaging
Medical
Applications
and New Ventures
Restructuring
and other costs
Total Segments
and Other
Net Sales
$ 986.4
$ 533.6
$ 407.4
$
50.4 NA
$
1,977.8 Operating profit
$ 114.8
$
3.6
$ 57.0
$
(22.3)
$
(34.9)
$
118.2 Add:
Business
segment
special
items
9.7
6.8
1.9
19.7
34.9
73.0
Adjusted operating profit
124.5
10.4
58.9
(2.6)
-
191.2
as a % of net sales
12.6%
1.9%
14.5%
-5.2%
9.7%
Depreciation and amortization
29.4
31.6
8.7
3.4
NA
73.1
Segment and Other Adjusted EBITDA
$ 153.9
$ 42.0
$
67.6
$
0.8
$
-
$
264.3 as a % of net sales
15.6%
7.9%
16.6%
1.6%
13.4%
Segment and Other Adjusted EBITDA
$
264.3 Non-cash profit sharing
expense 4.6
Other income and expense
(38.2)
Add:
Other
special
items
36.2
Consolidated Adjusted EBITDA
$
266.9 as a % of net sales
13.5%
23
(1)
During
the
fourth
quarter
of
2012,
we
began
to
operate
under
a
new
business
division
structure
for
our
segment
reporting
structure.
The
new
segment
reporting
structure
consists
of
three
global
business
divisions:
Food
&
Beverage,
Institutional
&
Laundry,
Protective
Packaging
and
an
“Other”
category,
which
includes
our
Medical
Applications
and
New
Ventures
businesses.
This
new
structure
replaced
our
legacy
seven
business
unit
structure
and
Diversey's
legacy
four
region-based
structure.
The
changes
to
the
segment
structure
have
no
effect
on
the
historical
consolidated
results
of
operations.
Prior
period
segment
results
have
been
conformed
to
the
new
segment
presentation.
(2)
In November 2012, we sold our Diversey Japan business. The financial results of the
Diversey Japan business are reported as discontinued operations, and, accordingly all previously reported financial information has been revised.
(3)
(3) These special items consist of certain one-time costs or charges that were
included in our segments' operating results, including non-cash impairment charges recorded for impairment of goodwill and other intangible assets and in-
(4)
(4) These special items primarily consist of certain one-time costs or charges
that were included in other income and expense on our consolidated statements of operations, including an other-than-temporary impairment on one of our
equity method investments in a joint venture
The Company is working to finalize its goodwill and other intangible assets
impairment analysis prior to the filing of its Annual Report on Form
10-K for the year ended December 31, 2012, and as a result may incur additional impairment
charges
process research and development. These special items also include costs associated with our 2011 -
2014 Integration and Optimization Program. (3)
(4)
57.0 |
 Revised Segment and Consolidated Adjusted Operating Profit and
Adjusted EBITDA
(1)(2)
Year Ended December 31, 2012
Food & Beverage
Institutional
& Laundry
Protective
Packaging
Medical
Applications
and New Ventures
Restructuring and
other costs
Total Segments
and Other
Net Sales
$ 3,739.6
$ 2,131.5
$ 1,578.4
$
198.6 NA
$
7,648.1 Operating profit
$
38.9 $ (952.3)
$ 207.5
$
(25.5)
$ (149.8)
$
(881.2) Add:
Business
segment
special
items
(3)
353.0
1,020.9
3.4
19.8
149.8
1,546.9
Adjusted operating profit
391.9
68.6
210.9
(5.7)
-
665.7
as a % of net sales
10.5%
3.2%
13.4%
-2.9%
8.7%
Depreciation and amortization
142.2
127.3
38.3
13.1
NA
320.9
Segment and Other Adjusted EBITDA
$ 534.1
$ 195.9
$ 249.2
$
7.4
$
-
$
986.6 as a % of net sales
14.3%
9.2%
15.8%
3.7%
12.9%
Segment and Other Adjusted EBITDA
$
986.6 Non-cash profit sharing
expense 18.9
Other income and expense
(70.2)
Add:
Other
special
items
(4)
60.5
Consolidated Adjusted EBITDA
$
995.8 as a % of net sales
13.0%
24
(1)
During
the
fourth
quarter
of
2012,
we
began
to
operate
under
a
new
business
division
structure
for
our
segment
reporting
structure.
The
new
segment
reporting
structure
consists
of
three
global
business
divisions:
Food
&
Beverage,
Institutional
&
Laundry,
Protective
Packaging
and
an
“Other”
category,
which
includes
our
Medical
Applications
and
New
Ventures
businesses.
This
new
structure
replaced
our
legacy
seven
business
unit
structure
and
Diversey's
legacy
four
region-based
structure.
The
changes
to
the
segment
structure
have
no
effect
on
the
historical
consolidated
results
of
operations.
Prior
period
segment
results
have
been
conformed
to
the
new
segment
presentation.
(2)
In November 2012, we sold our Diversey Japan business. The financial results of the
Diversey Japan business are reported as discontinued operations, and, accordingly all previously reported financial information has been revised.
(3)
(3) These special items consist of certain one-time costs or charges that were
included in our segments' operating results, including non-cash impairment charges recorded for impairment of goodwill and other intangible assets and in-
(4)
(4) These special items primarily consist of certain one-time costs or charges
that were included in other income and expense on our consolidated statements of operations, including an other-than-temporary impairment on one of our
equity method investments in a joint venture
The Company is working to finalize its goodwill and other intangible assets
impairment analysis prior to the filing of its Annual Report on Form
10-K for the year ended December 31, 2012, and as a result may incur additional impairment
charges
process research and development. These special items also include costs associated with our 2011 -
2014 Integration and Optimization Program. |
 Regional Sales Performance
Fourth Quarter 2012
Latin
America
Reported: +7.5%
Organic: +13.2%
North
America
Reported: +2.3%
Organic: +2.1%
*Organic sales refers to unit volume and price/mix performance
and does not include the impact of currency translation
25
Japan/ANZ
Reported: +2.0%
Organic: -0.1%
Europe
Reported: -5.6%
Organic: -1.8%
AMAT
Reported: +9.6%
Organic: +9.7%
Please see Sealed Air’s February 19, 2013 earnings press release for important information about
the use of non-U.S. GAAP financial measurers, including applicable reconciliations to U.S.
GAAP financial measures.
All results are on a continuing operations
basis. |