Attached files
| file | filename |
|---|---|
| 8-K - 8-K - NORTHSTAR REALTY FINANCE CORP. | a13-5352_18k.htm |
Exhibit 99.1
|
|
Corporate Presentation February 2013 |
|
|
1 Safe Harbor This presentation contains forward-looking statements, within the meaning of the Private Securities Litigation Reform Act of 1995, including statements about future results, projected yields, rates of return and performance, projected cash available for distribution, projected cash from any single source of investment or fee stream, projected expenses, expected and weighted average return on equity, market and industry trends, investment opportunities, business conditions and other matters, including, among other things: the scalability of our investment platform; the size and timing of offerings or capital raises and actual management fee income derived from, the non-traded REITs we sponsor and advise; the ability to opportunistically participate in commercial real estate refinancings; the ability to realize upon attractive investment opportunities; the projected returns on, and cash earned from, investments, including investments funded by drawings from our credit facilities and securities offerings; equity and debt capital; and whether the Company’s recent transaction to acquire interests in private equity funds closes on the terms anticipated, if at all. Forward-looking statements concern future circumstances and results and other statements that are not historical facts and are sometimes identified by the words “may,” “will,” “should,” “potential,” “intend,” “expect,” “seek,” “anticipate,” “estimate,” “believe,” “could,” “project,” “predict,” “continue” or other similar words or expressions. The forward-looking statements involve a number of significant risks and uncertainties. A number of factors, including those factors set forth under the section entitled “Risk Factors” in the Annual Report on Form 10-K for the year ended December 31, 2011 of NorthStar Realty Finance Corp. (the “Company”), could cause the Company’s actual results, performance, achievements or industry results to be materially different from any future results, performance and achievements expressed or implied by these forward-looking statements. Additional information concerning factors that could cause actual results to materially differ from those in the forward-looking statements is contained in the Securities and Exchange Commission filings of the Company. The Company does not guarantee that the assumptions underlying such forward-looking statements are free from errors. The Company undertakes no obligation to publicly update any information whether as a result of new information, future events, or otherwise. Unless otherwise stated, historical financial information and per share data is as of December 31, 2012. This presentation is for informational purposes only and does not constitute an offer to sell or a solicitation of an offer to buy any securities of the Company. The footnotes herein contain important information that is material to an understanding of this presentation and you should read this presentation only with and in context of the footnotes. |
|
|
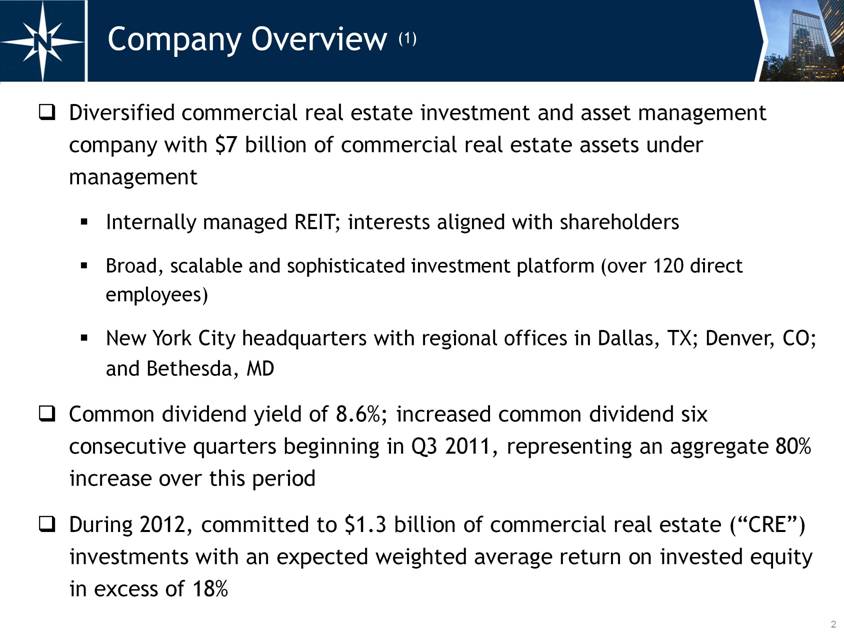
2 Diversified commercial real estate investment and asset management company with $7 billion of commercial real estate assets under management Internally managed REIT; interests aligned with shareholders Broad, scalable and sophisticated investment platform (over 120 direct employees) New York City headquarters with regional offices in Dallas, TX; Denver, CO; and Bethesda, MD Common dividend yield of 8.6%; increased common dividend six consecutive quarters beginning in Q3 2011, representing an aggregate 80% increase over this period During 2012, committed to $1.3 billion of commercial real estate (“CRE”) investments with an expected weighted average return on invested equity in excess of 18% Company Overview (1) |
|
|
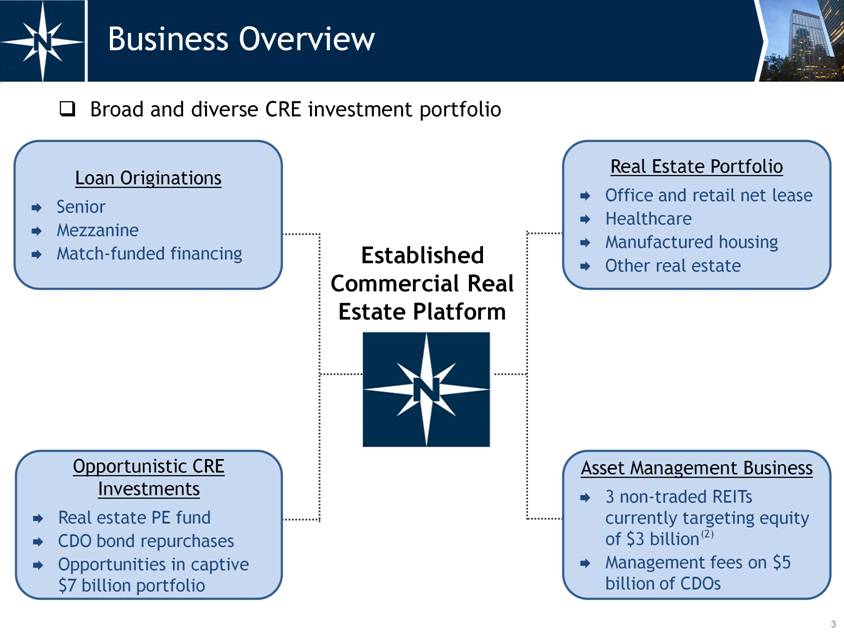
Established Commercial Real Estate Platform 3 Business Overview Broad and diverse CRE investment portfolio Loan Originations Senior Mezzanine Match-funded financing Asset Management Business 3 non-traded REITs currently targeting equity of $3 billion Management fees on $5 billion of CDOs Opportunistic CRE Investments Real estate PE fund CDO bond repurchases Opportunities in captive $7 billion portfolio Real Estate Portfolio Office and retail net lease Healthcare Manufactured housing Other real estate (2) |
|
|
4 2012 Investments (3) During 2012, NRF committed to $1.3 billion of diversified CRE investments with an expected WA return on equity in excess of 18% NorthStar 2012 Investments ($ in millions) Assets Invested Equity Expected ROE Opportunistic CRE investments 362 $ 362 $ 17% + CDO bond repurchases 326 159 20%+ Real estate portfolio 332 84 15% + CRE Loans 265 109 18% + Total / weighted average 1,285 $ 714 $ 18%+ Originated CRE loans in 2012 for NRF non-traded REIT 475 $ Total Loans 740 $ |

|
|
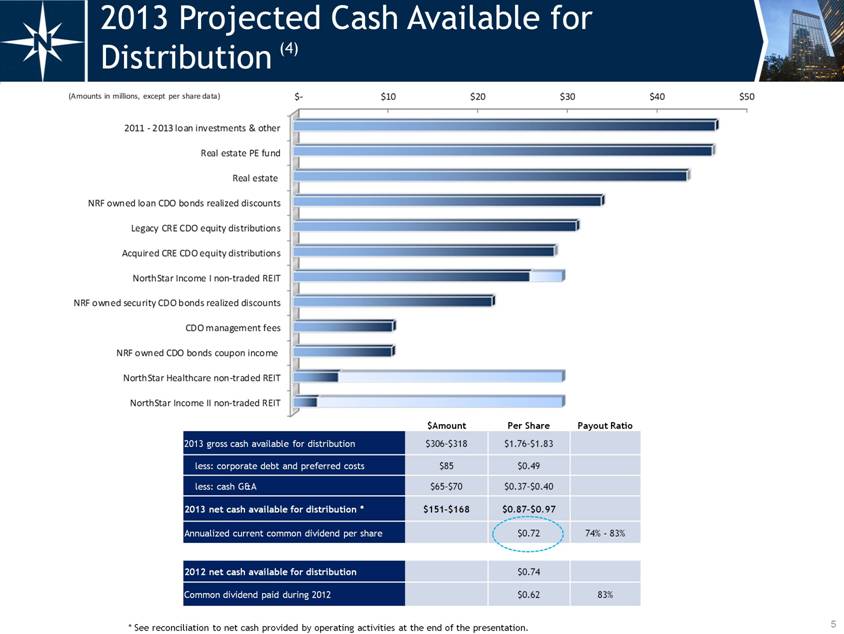
5 2013 Projected Cash Available for Distribution (4) $Amount Per Share Payout Ratio 2013 gross cash available for distribution $306–$318 $1.76–$1.83 less: corporate debt and preferred costs $85 $0.49 less: cash G&A $65–$70 $0.37–$0.40 2013 net cash available for distribution * $151–$168 $0.87–$0.97 Annualized current common dividend per share $0.72 74% - 83% 2012 net cash available for distribution $0.74 Common dividend paid during 2012 $0.62 83% * See reconciliation to net cash provided by operating activities at the end of the presentation. $- $10 $20 $30 $40 $50 NorthStar Income II non-traded REIT NorthStar Healthcare non-traded REIT NRF owned CDO bonds coupon income CDO management fees NRF owned security CDO bonds realized discounts NorthStar Income I non-traded REIT Acquired CRE CDO equity distributions Legacy CRE CDO equity distributions NRF owned loan CDO bonds realized discounts Real estate Real estate PE fund 2011 - 2013 loan investments & other (Amounts in millions, except per share data ) |
|
|
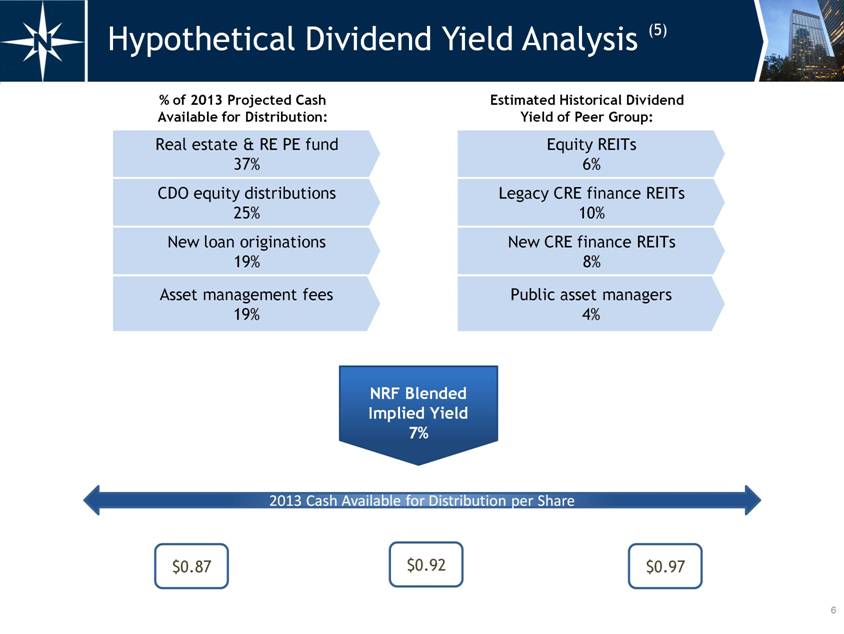
2013 Cash Available for Distribution per Share 6 Hypothetical Dividend Yield Analysis (5) $0.92 $0.87 $0.97 % of 2013 Projected Cash Available for Distribution: Estimated Historical Dividend Yield of Peer Group: CDO equity distributions 25% New loan originations 19% Asset management fees 19% Real estate & RE PE fund 37% Legacy CRE finance REITs 10% New CRE finance REITs 8% Public asset managers 4% Equity REITs 6% NRF Blended Implied Yield 7% |
|
|
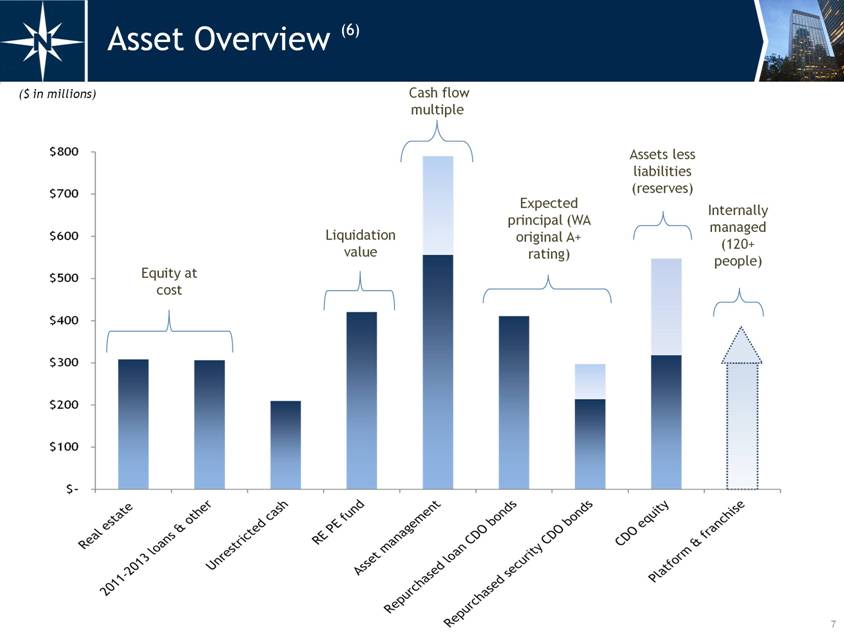
7 Asset Overview (6) ($ in millions) Expected principal (WA original A+ rating) Assets less liabilities (reserves) Equity at cost Liquidation value Cash flow multiple Internally managed (120+ people) $- $100 $200 $300 $400 $500 $600 $700 $800 |
|
|
Internally managed: platform and franchise value directly benefits shareholders 8 Asset Overview: Platform & Franchise Internally Managed (120+ people) Asset Management Business Over $40 million of 2013 projected net fees High multiple business Direct Benefit NRF Shareholders Externally Managed Asset Management and Fund Businesses Direct Benefit Shareholders (What about us?) Management NorthStar Most of “Peer” Group |

|
|
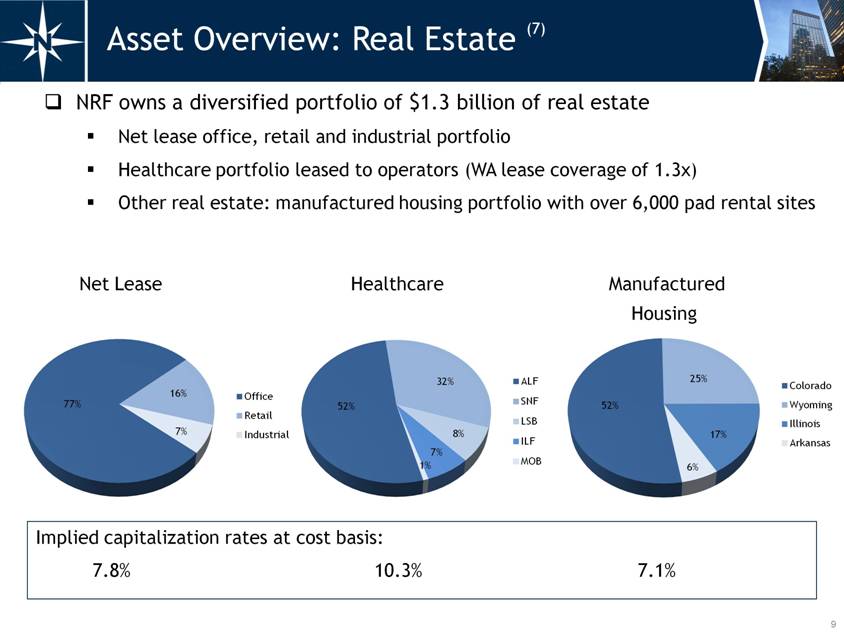
9 Asset Overview: Real Estate (7) NRF owns a diversified portfolio of $1.3 billion of real estate Net lease office, retail and industrial portfolio Healthcare portfolio leased to operators (WA lease coverage of 1.3x) Other real estate: manufactured housing portfolio with over 6,000 pad rental sites Net Lease Healthcare Manufactured Housing Implied capitalization rates at cost basis: 7.8% 10.3% 7.1% 52% 25% 17% 6% Colorado Wyoming Illinois Arkansas 52% 32% 8% 7% 1% ALF SNF LSB ILF MOB 77% 16% 7% Office Retail Industrial |
|
|
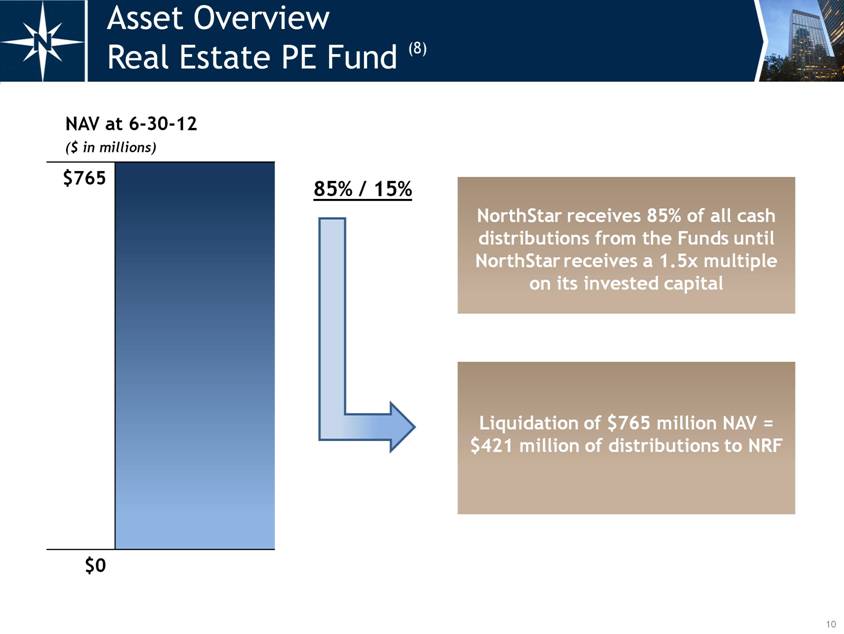
10 Asset Overview Real Estate PE Fund (8) NAV at 6-30-12 ($ in millions) $765 $0 85% / 15% NorthStar receives 85% of all cash distributions from the Funds until NorthStar receives a 1.5x multiple on its invested capital Liquidation of $765 million NAV = $421 million of distributions to NRF |
|
|
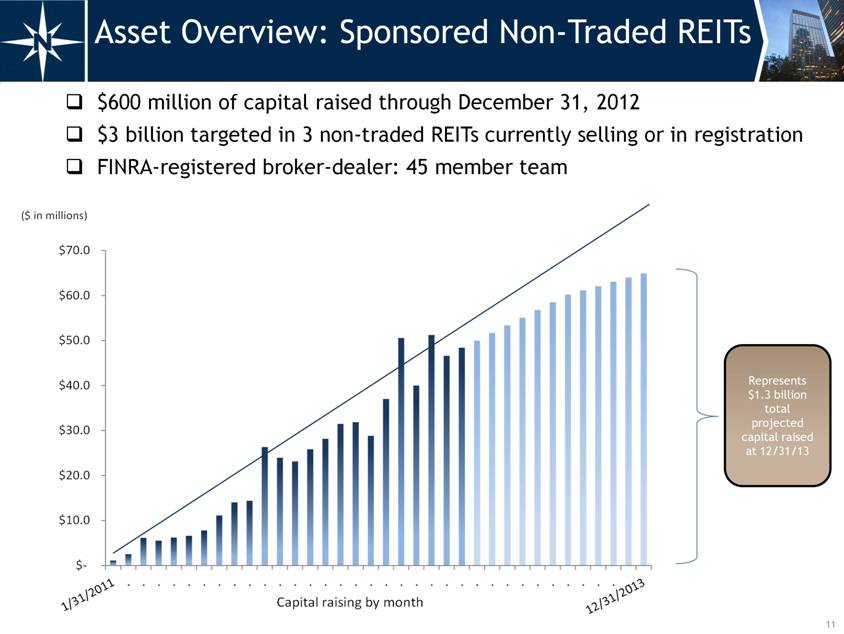
11 $600 million of capital raised through December 31, 2012 $3 billion targeted in 3 non-traded REITs currently selling or in registration FINRA-registered broker-dealer: 45 member team Asset Overview: Sponsored Non-Traded REITs Represents $1.3 billion total projected capital raised at 12/31/13 $- $10.0 $20.0 $30.0 $40.0 $50.0 $60.0 $70.0 Capital raising by month ($ in millions) |
|
|
12 As of December 31, 2012, principal proceeds NRF could receive from our owned CDO bonds is $708 million, of which $558 million were repurchased at significant discounts to par and had a WA original credit rating of A+ Potential realizable cash flow of $379 million Purchase price of $179 million (63% discount to par) NRF Owned CDO Principal $708 million Repurchased at Discounts $558 million Asset Overview: CDO Bonds Repurchased (9) $- $100 $200 $300 $400 $500 $600 $700 $800 ($ in millions) |

|
|
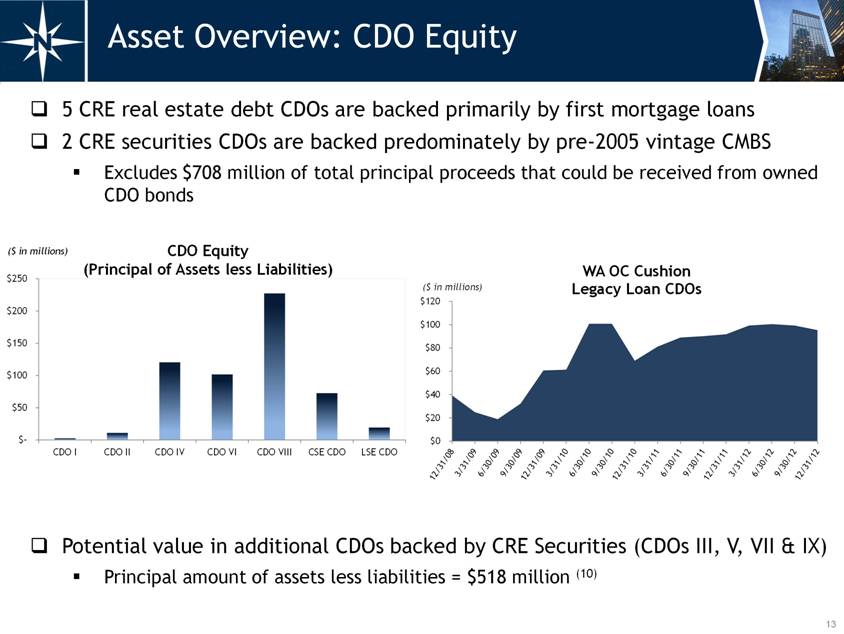
13 Asset Overview: CDO Equity 5 CRE real estate debt CDOs are backed primarily by first mortgage loans 2 CRE securities CDOs are backed predominately by pre-2005 vintage CMBS Excludes $708 million of total principal proceeds that could be received from owned CDO bonds Potential value in additional CDOs backed by CRE Securities (CDOs III, V, VII & IX) Principal amount of assets less liabilities = $518 million (10) $- $50 $100 $150 $200 $250 CDO I CDO II CDO IV CDO VI CDO VIII CSE CDO LSE CDO CDO Equity (Principal of Assets less Liabilities) ($ in millions) $0 $20 $40 $60 $80 $100 $120 WA OC Cushion Legacy Loan CDOs ($ in millions) |
|
|
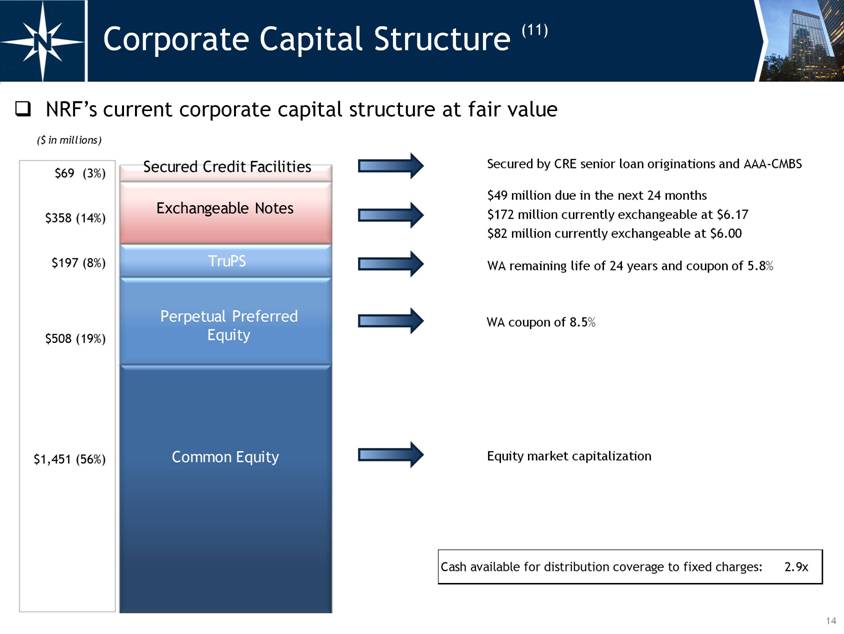
WA coupon of 8.5% WA remaining life of 24 years and coupon of 5.8% Equity market capitalization NRF’s current corporate capital structure at fair value 14 Corporate Capital Structure (11) $49 million due in the next 24 months $172 million currently exchangeable at $6.17 $82 million currently exchangeable at $6.00 Secured by CRE senior loan originations and AAA-CMBS Cash available for distribution coverage to fixed charges: 2.9x ($ in millions) $69 (3%) $358 (14%) $197 (8%) $508 (19 %) $1,451 (56%) Secured Credit Facilities Exchangeable Notes TruPS Perpetual Preferred Equity Common Equity |
|
|
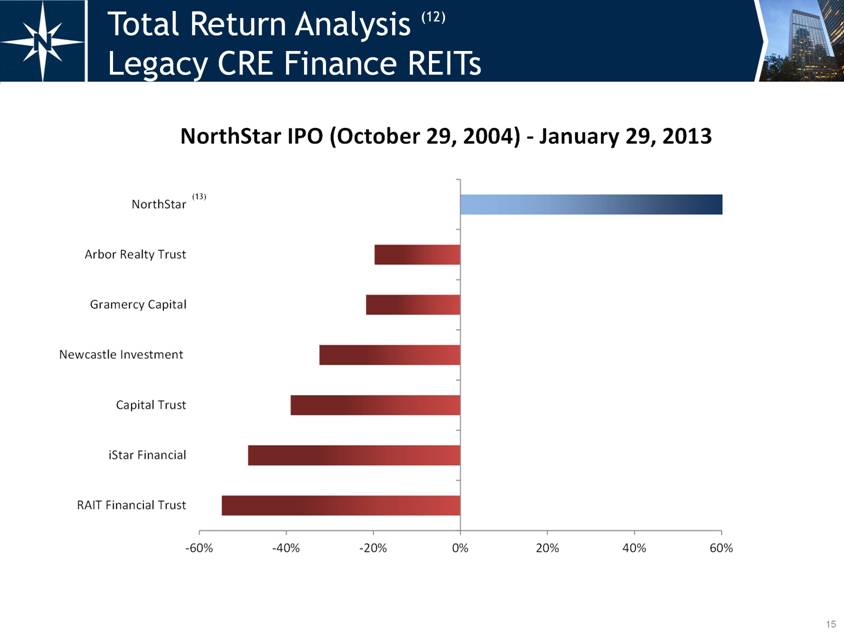
15 Total Return Analysis (12) Legacy CRE Finance REITs (13) -60% -40% -20% 0% 20% 40% 60% RAIT Financial Trust iStar Financial Capital Trust Newcastle Investment Gramercy Capital Arbor Realty Trust NorthStar NorthStar IPO (October 29, 2004) - January 29, 2013 |
|
|
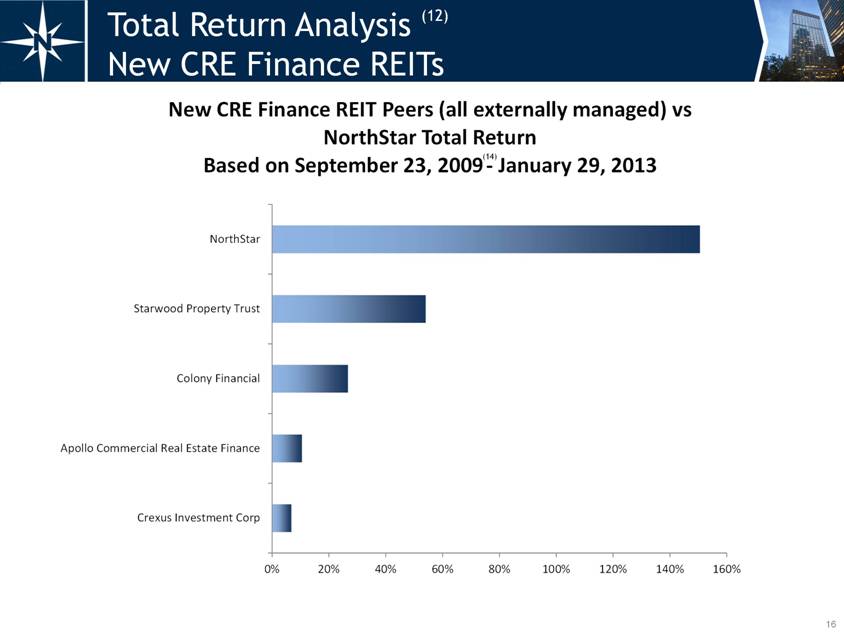
16 Total Return Analysis (12) New CRE Finance REITs (14) 0% 20% 40% 60% 80% 100% 120% 140% 160% Crexus Investment Corp Apollo Commercial Real Estate Finance Colony Financial Starwood Property Trust NorthStar New CRE Finance REIT Peers (all externally managed) vs NorthStar Total Return Based on September 23, 2009 - January 29, 2013 |
|
|
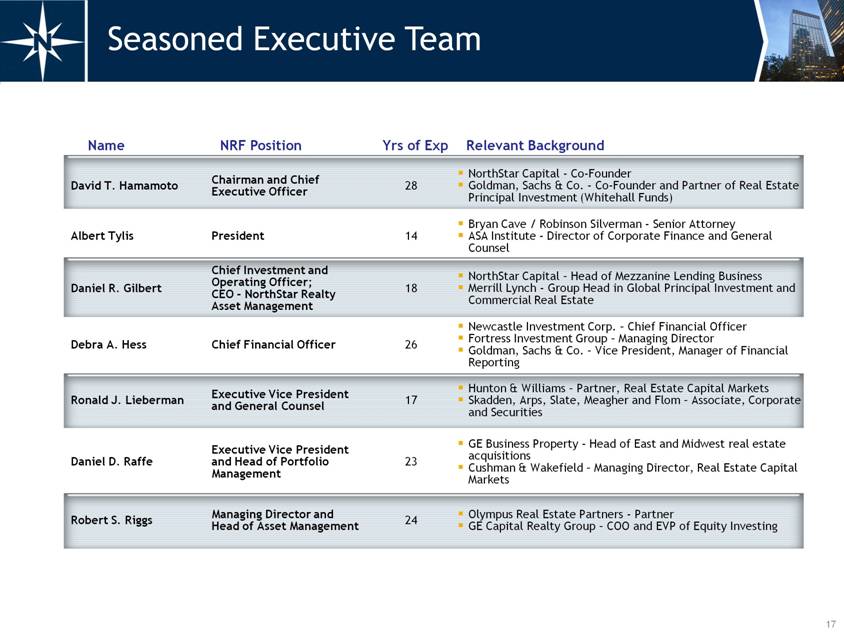
17 Seasoned Executive Team Name NRF Position Yrs of Exp Relevant Background David T. Hamamoto Chairman and Chief Executive Officer 28 NorthStar Capital - Co-Founder Goldman, Sachs & Co. - Co-Founder and Partner of Real Estate Principal Investment (Whitehall Funds) Albert Tylis President 14 Bryan Cave / Robinson Silverman - Senior Attorney ASA Institute - Director of Corporate Finance and General Counsel Daniel R. Gilbert Chief Investment and Operating Officer; CEO - NorthStar Realty Asset Management 18 NorthStar Capital – Head of Mezzanine Lending Business Merrill Lynch - Group Head in Global Principal Investment and Commercial Real Estate Debra A. Hess Chief Financial Officer 26 Newcastle Investment Corp. – Chief Financial Officer Fortress Investment Group – Managing Director Goldman, Sachs & Co. – Vice President, Manager of Financial Reporting Ronald J. Lieberman Executive Vice President and General Counsel 17 Hunton & Williams – Partner, Real Estate Capital Markets Skadden, Arps, Slate, Meagher and Flom – Associate, Corporate and Securities Daniel D. Raffe Executive Vice President and Head of Portfolio Management 23 GE Business Property - Head of East and Midwest real estate acquisitions Cushman & Wakefield – Managing Director, Real Estate Capital Markets Robert S. Riggs Managing Director and Head of Asset Management 24 Olympus Real Estate Partners - Partner GE Capital Realty Group – COO and EVP of Equity Investing |
|
|
18 Appendix Opportunistic Investment Example Repurchased CDO Bond Example 2012 Originated Loan Example 2012 CMBS Transaction Non-Traded REIT Industry New Capital Reconciliation of 2013 Projected Cash Available for Distribution Presentation Footnotes |
|
|
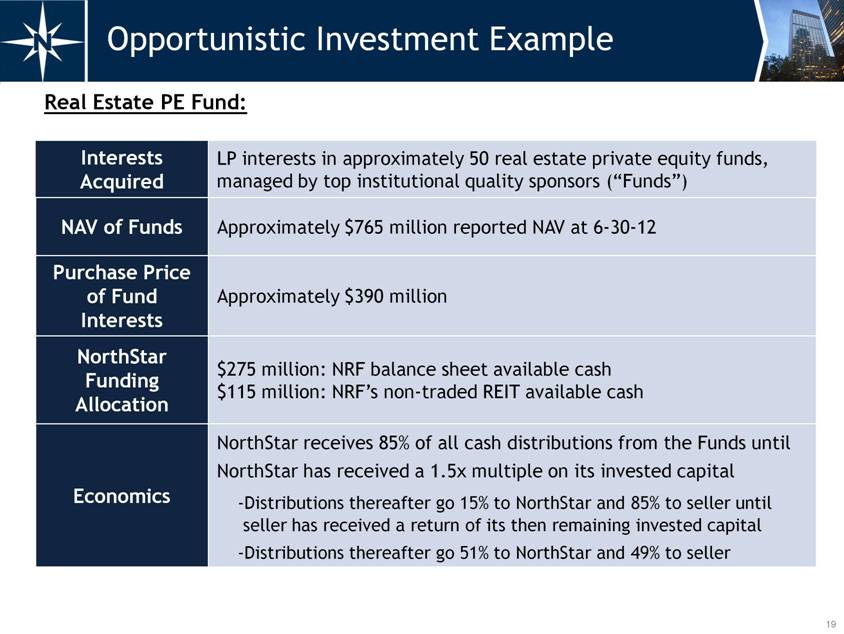
19 Opportunistic Investment Example Interests Acquired LP interests in approximately 50 real estate private equity funds, managed by top institutional quality sponsors (“Funds”) NAV of Funds Approximately $765 million reported NAV at 6-30-12 Purchase Price of Fund Interests Approximately $390 million NorthStar Funding Allocation $275 million: NRF balance sheet available cash $115 million: NRF’s non-traded REIT available cash Economics NorthStar receives 85% of all cash distributions from the Funds until NorthStar has received a 1.5x multiple on its invested capital -Distributions thereafter go 15% to NorthStar and 85% to seller until seller has received a return of its then remaining invested capital -Distributions thereafter go 51% to NorthStar and 49% to seller Real Estate PE Fund: |
|
|
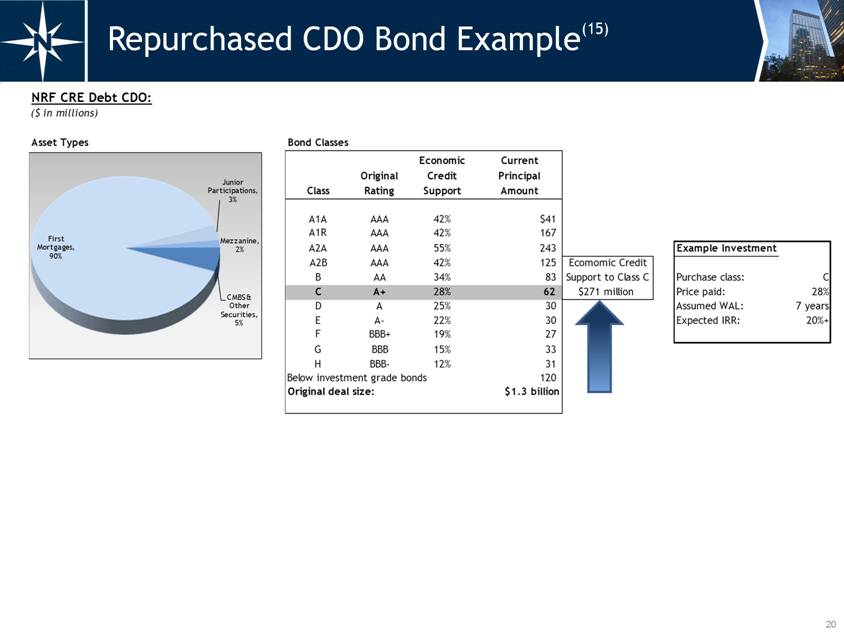
20 Repurchased CDO Bond Example(15) NRF CRE Debt CDO: ($ in millions) Asset Types Bond Classes Class Original Rating Economic Credit Support Current Principal Amount A1A AAA 42% $41 A1R AAA 42% 167 A2A AAA 55% 243 Example Investment A2B AAA 42% 125 Ecomomic Credit B AA 34% 83 Support to Class C Purchase class: C C A+ 28% 62 $271 million Price paid: 28% D A 25% 30 Assumed WAL: 7 years E A- 22% 30 Expected IRR: 20%+ F BBB+ 19% 27 G BBB 15% 33 H BBB- 12% 31 Below investment grade bonds 120 Original deal size: $1.3 billion First Mortgages, 90% Mezzanine, 2% CMBS & Other Securities, 5% Junior Participations, 2% |
|
|
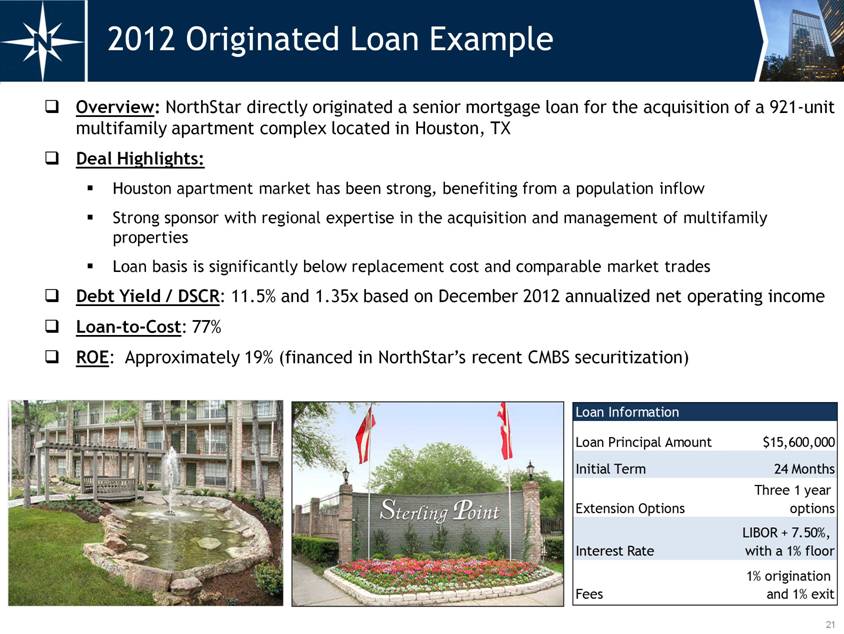
21 2012 Originated Loan Example Overview: NorthStar directly originated a senior mortgage loan for the acquisition of a 921-unit multifamily apartment complex located in Houston, TX Deal Highlights: Houston apartment market has been strong, benefiting from a population inflow Strong sponsor with regional expertise in the acquisition and management of multifamily properties Loan basis is significantly below replacement cost and comparable market trades Debt Yield / DSCR: 11.5% and 1.35x based on December 2012 annualized net operating income Loan-to-Cost: 77% ROE: Approximately 19% (financed in NorthStar’s recent CMBS securitization) Loan Information Loan Principal Amount $15,600,000 Initial Term 24 Months Extension Options Three 1 year options Interest Rate LIBOR + 7.50%, with a 1% floor Fees 1% origination and 1% exit |
|
|
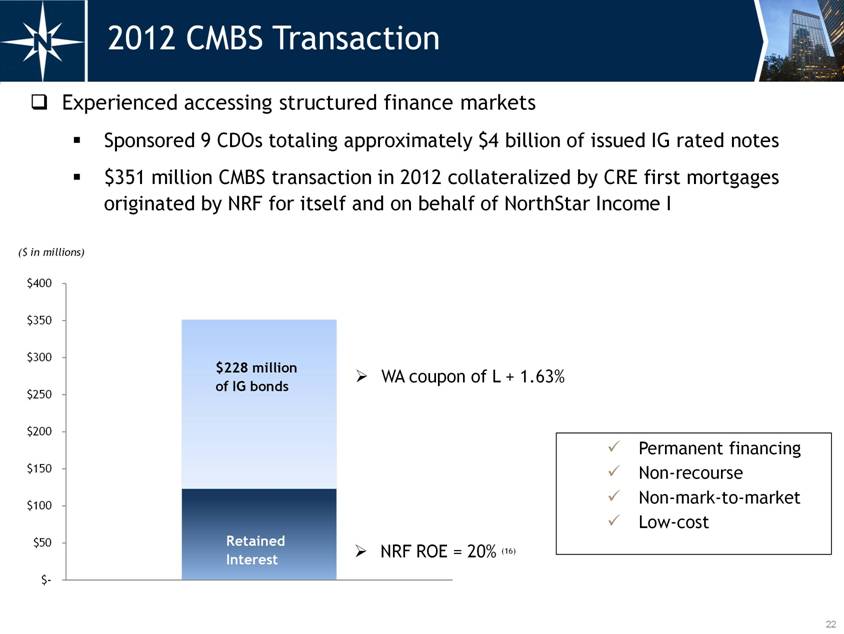
22 2012 CMBS Transaction Experienced accessing structured finance markets Sponsored 9 CDOs totaling approximately $4 billion of issued IG rated notes $351 million CMBS transaction in 2012 collateralized by CRE first mortgages originated by NRF for itself and on behalf of NorthStar Income I $228 million of IG bonds Retained Interest WA coupon of L + 1.63% NRF ROE = 20% (16) Permanent financing Non-recourse Non-mark-to-market Low-cost $- $50 $100 $150 $200 $250 $300 $350 $400 ($ in millions) |
|
|
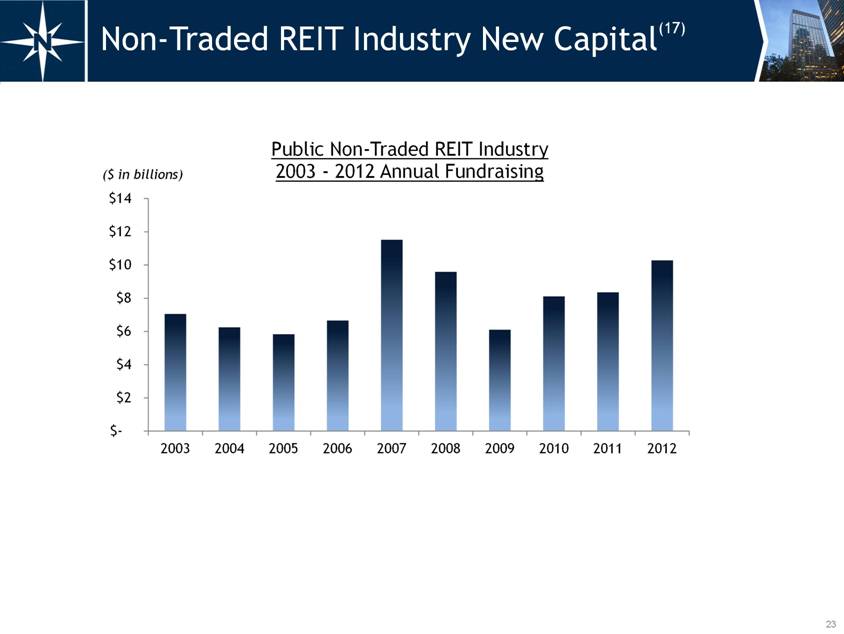
23 Non-Traded REIT Industry New Capital(17) $- $2 $4 $6 $8 $10 $12 $14 2003 2004 2005 2006 2007 2008 2009 2010 2011 2012 Public Non - Traded REIT Industry 2003 - 2012 Annual Fundraising ($ in billions) |
|
|
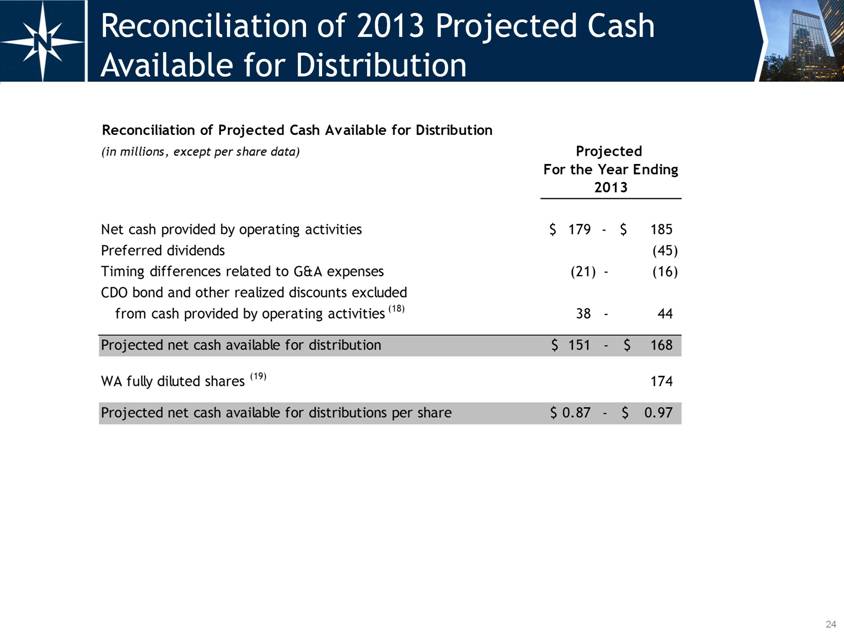
24 Reconciliation of 2013 Projected Cash Available for Distribution Reconciliation of Projected Cash Available for Distribution (in millions, except per share data) Projected For the Year Ending 2013 Net cash provided by operating activities 179 $ - 185 $ Preferred dividends (45) Timing differences related to G&A expenses (21) - (16) CDO bond and other realized discounts excluded from cash provided by operating activities (18) 38 - 44 Projected cash available for distribution 151 $ - 168 $ WA fully diluted shares (19) 174 Projected cash available for distributions per share 0.87 $ - 0.97 $ |
|
|
25 Presentation Footnotes Company Overview Dividend yield: Based on NRF closing price on February 14, 2013 reflecting an annualized dividend of $0.72. Expected return on invested equity (“ROE”): Includes NRF’s $275 million investment in the real estate private equity fund interests (“RE PE fund”) which we have contractually committed to make but has not yet closed. There is no assurance this investment will close on the terms anticipated, if at all. “NorthStar” includes NorthStar Realty Finance Corp. (“NRF”) and NorthStar Real Estate Income Trust, Inc. (“NorthStar Income I”), NRF’s first sponsored non-traded REIT. Based on reaching total expected offering size for three non-traded REITs that NRF has registered or is in the process of registering with the U.S. Securities and Exchange Commission. 2012 Investments Expected ROE: Management provides no assurances that the weighted average life or cash flows of investments will be consistent with management's expectations or that the CDO bond repurchases, CRE loans or other investments, will payoff at par, if at all. Actual results could differ materially from expectations. Opportunistic CRE investments: Includes NRF’S $275 million RE PE fund investment that has not closed. There is no assurance that this transaction will close on the terms expected, or that the entire NRF $275 million will be invested. CRE loans: Equity invested and expected ROE reflects $8 million of credit facility financing obtained in January 2013. 2013 Projected Cash Available for Distribution: Constitutes forward-looking information based on data as of February 14, 2013. Actual full year 2013 cash available for distribution and each individual line item presented herein could vary significantly from the projections presented. 2011-2013 loan investments & other: Represents actual investments primarily made during 2011, 2012 and projected investments for 2013 based on current available liquidity. RE PE fund: Based on full investment of NRF $275 million of committed capital, exclusive of any additional funding. There is no assurance that this transaction will close on the terms expected or that the entire NRF $275 million will be invested. Real estate: Includes office, retail, healthcare and manufactured housing and including projected investments for 2013 based on currently available liquidity. NRF owned loan and security CDO bond realized discounts: Cash available for distribution from loan and securities CDO bond realized discounts assumed to equal annual amortization of total expected cash discount over a 5.7 year weighted average remaining life for the total repurchased CDO bonds. This compares to a realized discount in 2012 of $53 million for total repurchased CDO bonds, including loan and security CDOs. |

|
|
26 Presentation Footnotes (continued) NorthStar Income I, NorthStar Healthcare and NorthStar Income II non-traded REITs: Shaded area represents annual cash potential if $1 billion offering size per REIT is realized. NorthStar Income II is currently in registration and its registration statement has not been declared effective by the SEC. NorthStar Healthcare Income, Inc. (“NorthStar Healthcare”) and NorthStar Real Estate Income II, Inc. (“NorthStar Income II”). Per share data: Based on 2013 weighted average common shares and operating partnership units outstanding through February 14, 2013 and assuming no additional issuances of common stock or other securities. Does not factor any potential reported dilution related to exchangeable notes or warrants. Corporate debt and preferred costs: Expected fixed charges for full year 2013 and assuming no additional corporate borrowings or preferred equity issuances. Cash G&A: Excludes any equity-based compensation and certain non-recurring items. 2012 net cash available for distribution per share: Based on 2012 accrued compensation and other expenses, excluding equity-based and incentive compensation. Hypothetical Dividend Yield Analysis Percentage of 2013 projected cash available for distribution: Based on 2013 projected gross cash available for distribution included on page 5, excluding realized discounts and coupon income on NRF owned loan and security CDO bonds. Includes NRF’s $275 million investment in the RE PE fund which we have contractually committed to make but has not yet closed. There is no assurance this investment will close on the terms anticipated, if at all. Asset management fees: CDO management fees included in asset management fees are at a 8x multiple compared to a public asset manager yield of 4%. Dividend yield of peer group: Based on management’s estimation of historical dividend yields for comparable companies for CRE-finance REITs, legacy CRE-finance REITs, equity REITs and public asset management companies. NRF blended implied yield: Based on dividend yields of peer group weighted by applicable percentage of NRF’s 2013 projected gross cash available for distribution. Asset Overview Real estate: Based on cost basis of owned real estate, net of financing. 2011- 2013 loans and other: CRE loans, securities and equity investments, net of their respective financing. Unrestricted cash: Unrestricted cash as of December 31, 2012 of $445 million pro forma for NRF $275 million purchase price in the RE PE fund, net of $40 million deposit posted in Q4 2012. |
|
|
27 Presentation Footnotes (continued) RE PE fund: Based on NRF committed investment of $275 million and $765 million reported cumulative NAV of Funds at June 30, 2012. Result is based on contractual waterfall / economics and represents the total cash flow NRF would receive upon a liquidation of all of the Funds at the reported NAV at June 30, 2012, although, there is no assurance that this will be the case. Asset management: Based on $1.3 billion of total projected capital raised at the end of 2013 in three NRF sponsored non-traded REITs and a projected run-rate net fee of 3% per annum. Shaded portion represents multiples with a range of 12x on the low end and 18x on the high end. Also included is a multiple of 8x on projected CDO fees of $11 million for 2013. These multiples are management’s estimation of the value of these fee streams and may not be representative of the value ascribed to these fees by investors. Loan CDO bonds: Principal amount that NRF could receive from CDO bonds predominately collateralized by CRE loans and predominately repurchased at discounts. Security CDO bonds: Principal amount that NRF could receive from CDO bonds predominately collateralized by CRE securities and predominately repurchased at discounts. Shaded portion represents a range of potential recovery with the high end representing the maximum amount recoverable. CDO equity: Based on remittance report issued on date nearest to December 31, 2012. Principal amount of assets less principal amount of all liabilities (including CDO bonds owned by NRF) for each CDO. Shaded portion represents a range with principal amounts net of loan loss reserves and impairments on real estate of $229 million on the low end and full principal amount on the high end. Real Estate Weighted average lease coverage based on NorthStar’s healthcare portfolio leased to third-party operators. Implied capitalization rates based on 2013 projected property level net operating income (“NOI”) for retail and office and manufactured housing portfolios as a percentage of NRF’s cost basis in each respective portfolio. Implied capitalization rates based on operator level NOI for healthcare portfolio net leased to third-party operators and based on property level NOI for remaining portfolio as a percentage of NRF’s cost basis in the aggregate portfolio. NRF receives base rent from the properties which could be less than the operator level net operating income. Includes RE PE fund which we have contractually committed to make but has not yet closed. There is no assurance this investment will close on the terms anticipated, if at all. CDO bonds repurchased NRF owned CDO principal amount of $708 million represents maximum principal amount NRF can receive. There is no assurance that NRF will receive that maximum amount. Shaded portions represent a range of potential recovery with the high end representing the maximum principal amount recoverable. |
|
|
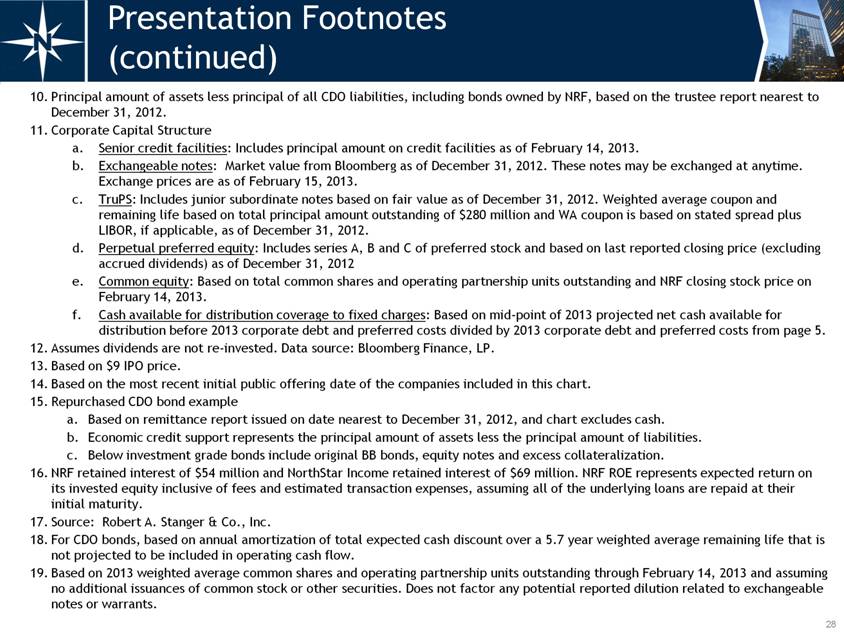
28 Presentation Footnotes (continued) Principal amount of assets less principal of all CDO liabilities, including bonds owned by NRF, based on the trustee report nearest to December 31, 2012. Corporate Capital Structure Senior credit facilities: Includes principal amount on credit facilities as of February 14, 2013. Exchangeable notes: Market value from Bloomberg as of December 31, 2012. These notes may be exchanged at anytime. Exchange prices are as of February 15, 2013. TruPS: Includes junior subordinate notes based on fair value as of December 31, 2012. Weighted average coupon and remaining life based on total principal amount outstanding of $280 million and WA coupon is based on stated spread plus LIBOR, if applicable, as of December 31, 2012. Perpetual preferred equity: Includes series A, B and C of preferred stock and based on last reported closing price (excluding accrued dividends) as of December 31, 2012 Common equity: Based on total common shares and operating partnership units outstanding and NRF closing stock price on February 14, 2013. Cash available for distribution coverage to fixed charges: Based on mid-point of 2013 projected net cash available for distribution before 2013 corporate debt and preferred costs divided by 2013 corporate debt and preferred costs from page 5. Assumes dividends are not re-invested. Data source: Bloomberg Finance, LP. Based on $9 IPO price. Based on the most recent initial public offering date of the companies included in this chart. Repurchased CDO bond example Based on remittance report issued on date nearest to December 31, 2012, and chart excludes cash. Economic credit support represents the principal amount of assets less the principal amount of liabilities. Below investment grade bonds include original BB bonds, equity notes and excess collateralization. NRF retained interest of $54 million and NorthStar Income retained interest of $69 million. NRF ROE represents expected return on its invested equity inclusive of fees and estimated transaction expenses, assuming all of the underlying loans are repaid at their initial maturity. Source: Robert A. Stanger & Co., Inc. For CDO bonds, based on annual amortization of total expected cash discount over a 5.7 year weighted average remaining life that is not projected to be included in operating cash flow. Based on 2013 weighted average common shares and operating partnership units outstanding through February 14, 2013 and assuming no additional issuances of common stock or other securities. Does not factor any potential reported dilution related to exchangeable notes or warrants. |