Attached files
| file | filename |
|---|---|
| 8-K - FORM 8-K - NATIONAL FINANCIAL PARTNERS CORP | d487208d8k.htm |
 4Q12
Earnings Presentation February 15, 2013
Exhibit 99.1 |
 2
Related to Forward-Looking Statements
Certain items in this presentation and in today’s discussion, including matters relating to
revenue, net income, Adjusted EBITDA, cash earnings, cash earnings per diluted share and
percentages or calculations using these measures, acquisitions, capital structure or growth
rates and other financial measurements and non-financial statements in future periods, constitute forward-
looking statements as that term is defined in the Private Securities Litigation Reform Act of
1995. These forward-looking statements are based on management's current views with
respect to future results and are subject to risks and uncertainties. These statements are not
guarantees of future performance. Actual results may differ materially from those contemplated by
forward-looking statements. National Financial Partners Corp. (“NFP” or the
“Company”) refers you to its filings with the SEC, including its Annual Report on
Form 10-K for the year ended December 31, 2011, filed on February 13, 2012, for additional
discussion of these risks and uncertainties as well as a cautionary statement regarding
forward-looking statements. Forward- looking statements made during this
presentation speak only as of today's date. NFP expressly disclaims any obligation to
update or revise any forward-looking statements, whether as a result of new information, future
events or otherwise. |
 Related to Non-GAAP Financial Information
The Company analyzes its performance using historical and forward-looking non-GAAP
financial measures called cash earnings, cash earnings
per diluted share, Adjusted EBITDA, and percentages or calculations using these measures. The
Company believes these non-GAAP financial measures provide additional meaningful methods
of evaluating certain aspects of the Company’s operating performance from
period to period on a basis that may not be otherwise apparent under GAAP. Cash
earnings is defined as net income excluding amortization of intangibles; depreciation; the
after-tax impact of the impairment of goodwill and intangible assets; the
after-tax impact of non-cash interest; the after-tax impact of change in estimated acquisition
earn-out payables recorded in accordance with purchase accounting that have been
subsequently adjusted and recorded in the
consolidated statements of income; the after-tax impact of management contract buyouts and the after-tax impact of certain
non-recurring items. Cash earnings per diluted share is calculated by dividing cash
earnings by the number of weighted average diluted shares outstanding for the period
indicated. Cash earnings and cash earnings per diluted share should not be
viewed as substitutes for net income and net income per diluted share, respectively.
Adjusted EBITDA is defined as net income excluding income tax expense; interest
income; interest expense; gain on early extinguishment of debt; other, net; amortization
of intangibles; depreciation; impairment of goodwill and intangible assets; (gain) loss on
sale of businesses, net; the accelerated vesting of, or
reversal of previously-recognized expenses related to, certain RSUs; any change in estimated
acquisition earn-out payables recorded in accordance with purchase accounting that have
been subsequently adjusted and recorded in the consolidated statements of income and
the expense related to management contract buyouts. Adjusted
EBITDA should not be viewed as a substitute for net income. A reconciliation of these
non-GAAP financial measures to their GAAP counterparts for the periods presented
herein is provided in the Company’s quarterly financial supplement for the period
ended December 31, 2012, which is available on the Investor Relations section of the
Company’s Web site at www.nfp.com. 3 |
 Reconciliation: Net Income to Cash Earnings
(1)
Cash earnings is a non-GAAP financial measure, which the Company defines as net
income excluding amortization of intangibles; depreciation; the after-tax impact of the impairment of goodwill and intangible
assets; the after-tax impact of non-cash interest; the after-tax impact
of change in estimated acquisition earn-out payables recorded in accordance with purchase accounting that have been subsequently adjusted
and recorded in the consolidated statements of income; the after-tax impact of
management contract buyouts and the after-tax impact of certain non-recurring items.
(2)
The
sum
of
the
per-share
components
of
cash
earnings
per
share
-
diluted
may
not
agree
to
cash
earnings
per
share
-
diluted
due
to
rounding.
RECONCILIATION OF NET INCOME TO CASH EARNINGS
(Unaudited-in thousands, except per share amounts)
Three Months Ended
December 31,
2012
2011
GAAP net income
19,403
$
11,245
$
Amortization of intangibles
8,550
8,271
Depreciation
3,107
3,313
Impairment of goodwill and intangible assets
1,821
8,319
Tax benefit of impairment of goodwill and
intangible assets
(692)
(3,390)
Non-cash interest, net of tax
762
670
Accelerated vesting/(reversal) of certain RSUs, net of tax
(2,897)
-
Change in estimated acquisition earn-out payables, net of tax
1,040
(731)
Management contract buyout, net of tax
6,075
-
Cash earnings (1)
37,169
$
27,697
$
GAAP net income per share - diluted
0.45
$
0.27
$
Amortization of intangibles
0.20
0.20
Depreciation
0.07
0.08
Impairment of goodwill and intangible assets
0.04
0.20
Tax benefit of impairment of goodwill and
intangible assets
(0.02)
(0.08)
Non-cash interest, net of tax
0.02
0.02
Accelerated vesting/(reversal) of certain RSUs, net of tax
(0.07)
-
Change in estimated acquisition earn-out payables, net of tax
0.02
(0.02)
Management contract buyout, net of tax
0.14
-
Cash earnings per share - diluted (2)
0.85
$
0.65
$
4 |
 Reconciliation:
Net Income to Adjusted EBITDA
5
Corporate
Individual
Advisor
(in thousands)
Client Group
Client Group
Services Group
Consolidated
For the twelve months ended December 31, 2012
GAAP net income
29,938
$
Income tax expense
5,457
Interest income
(2,253)
Interest expense
16,572
Gain on early extinguishment of debt
-
Other, net
(4,985)
Income from operations
32,035
$
3,457
$
9,237
$
44,729
$
Amortization of intangibles
24,195
8,892
432
33,519
Depreciation
5,618
4,014
2,707
12,339
Impairment of goodwill and intangible assets
7,754
25,261
-
33,015
Loss
(gain)
on
sale
of
businesses,
net
46
(4,809)
-
(4,763)
Accelerated vesting/(reversal) of certain RSUs
(2,484)
(2,098)
(91)
(4,673)
Change in estimated acquisition earn-out payables
9,305
-
180
9,485
Management Buyouts
17,336
-
-
17,336
Adjusted EBITDA
(1)
93,805
$
34,717
$
12,465
$
140,987
$
For the twelve months ended December 31, 2011
GAAP net income
36,932
$
Income tax expense
28,387
Interest income
(3,333)
Interest expense
15,733
Gain on early extinguishment of debt
-
Other, net
(6,386)
Income from operations
48,169
$
14,167
$
8,997
$
71,333
$
Amortization of intangibles
21,553
10,925
-
32,478
Depreciation
6,107
4,275
2,171
12,553
Impairment of goodwill and intangible assets
1,246
10,459
-
11,705
Gain
on
sale
of
businesses,
net
(103)
(1,135)
-
(1,238)
Accelerated vesting/(reversal) of certain RSUs
-
-
-
-
Change in estimated acquisition earn-out payables
(414)
-
-
(414)
Management Buyouts
-
-
-
-
Adjusted EBITDA
(1)
76,558
$
38,691
$
11,168
$
126,417
$
(1) Adjusted EBITDA is a non-GAAP financial measure, which the Company defines as
net income excluding income tax expense; interest income; interest expense; gain on early
extinguishment of debt; other, net; amortization of intangibles; depreciation; impairment of
goodwill and intangible assets; (gain) loss on sale of businesses, net; the accelerated vesting of, or
reversal of previously-recognized expenses related to, certain RSUs; any change in
estimated acquisition earn-out payables recorded in accordance with purchase accounting that have
been subsequently adjusted and recorded in the consolidated statements of income and the
expense related to management contract buyouts. The reconciliation of Adjusted EBITDA per reportable segment does not include the following
items, which are not allocated to any of the Company’s reportable segments: income tax
expense; interest income; interest expense; gain on early extinguishment of debt and other,
net. These items are included in the reconciliation of Adjusted EBITDA to net income on a
consolidated basis.
|
 Jessica Bibliowicz |
 7
(1)
2012 Highlights
Revenue $1.1 billion, up 4.8% yoy
Organic revenue growth +2.5%
–
Corporate Client Group +5.2%
–
Individual Client Group +2.7%
–
Advisor Services Group -2.3%
Adjusted EBITDA $141 million, up 11.5% yoy
Adjusted EBITDA margin 13.3%, up from 12.5% yoy
Cash EPS $2.72
–
2012 effective tax rate of 15.4%
–
Includes approximately $0.20 benefit when compared with 40% expected
effective tax rate for 2013
(1)
NFP expects 2013 effective tax rate of 40%, excluding the impacts of management
contract buyouts, impairments, disposition activity and changes in
unrecognized tax benefits. |
 8
Recurring Revenue
(1)
Quarter-over-Quarter
Recurring Revenue
Year-over-Year
Recurring Revenue
(1)
Recurring revenue includes revenue from corporate and executive benefits, property
& casualty, wealth management and asset-based fees and trails.
62.1%
65.1%
FY11
FY12
60.4%
62.3%
4Q11
4Q12
|
 9
2012 Capital Allocation
2012 strategic acquisitions
$97 million
$80 million of acquisitions
$17 million of management contract buyouts
2012 stock buyback
4Q12
Repurchased 105,000 shares at average price of $17.58 for $2 million
Full year 2012
Repurchased 1,371,043 shares at average price of $14.40 for $20
million (includes shares repurchased under 2011 & 2012
authorizations) $38 million remaining on 2012 authorization as of December
31, 2012 |
 Doug Hammond |
 11
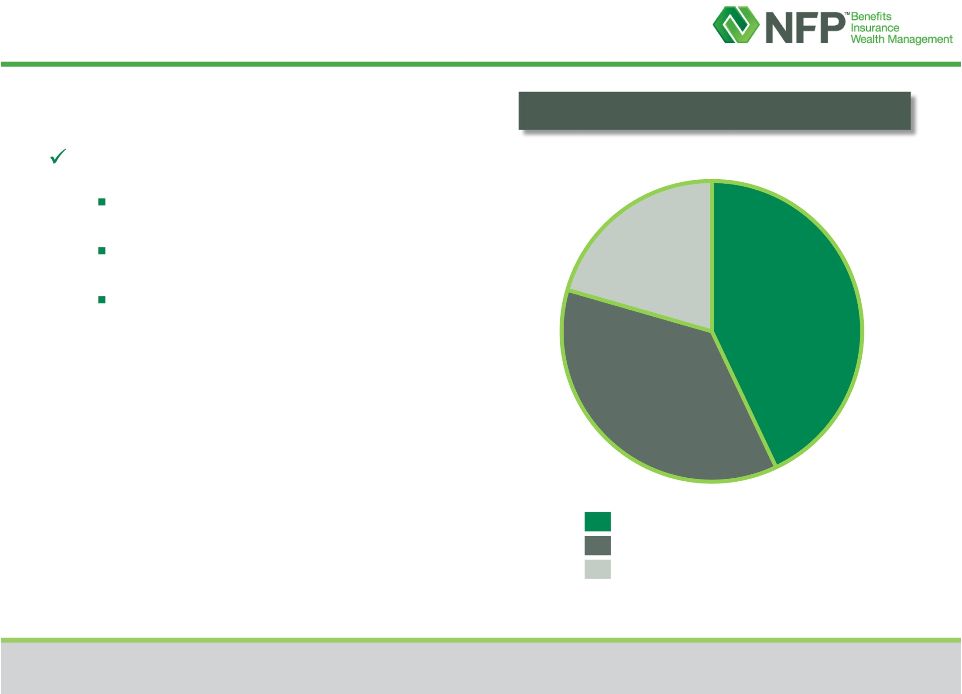
4Q12 Business Segments
4Q12 Revenue $300.1 million
Advisor Services Group
Individual Client Group
Corporate Client Group
($ in millions)
4Q12 organic revenue growth +2.7%
Corporate Client Group +2.7%
Individual Client Group +8.3%
Advisor Services Group -5.9%
$129.0
43.0%
$
109.4
36.4%
$61.7
20.6% |
 12
Corporate Client Group
Individual Client Group
4Q12 Business Segments
Components of Revenue
43.0%
81.0%
10.5%
8.5%
15.9%
34.8%
49.3%
Advisor Services Group
65.7%
34.3%
20.6%
Wealth Management
Retail Life
Marketing Organization & Wholesale
Life Brokerage
Property & Casualty
Executive Benefits
Corporate Benefits
Commissions & Non-Recurring Fees
Asset Based Fees & Trails
AUM $10.8 billion, up 11.2% yoy
36.4% |
 13
2013 Capital Allocation Outlook
Increasingly integrated One NFP
Management contract buyout multi-year plan
Drives integrated operating structure
Acquisition pipeline remains strong
P&C focus
Remain disciplined
New credit facility increases financial flexibility
Supports strategic growth plan
Enhances shareholder value
Plan to operate with Debt-to-EBITDA leverage ratio of approximately
2x Expected 2013 capital deployment
Management
contract
buyouts
and
acquisitions:
$120
-
$130
million
Weighted more toward management contract buyouts
Stock
buyback:
$25
-
$30
million,
anticipated
to
begin
no
sooner
than
2Q13 |
 14
2013 Segment Outlook
Corporate Client Group
Organic
revenue
growth
approximately
3%
-
4%
Adjusted
EBITDA
margins
approximately
20%
–
21%
Individual Client Group
Significant challenges remain in the life insurance market
Low interest rate environment
Remain cautious
Wealth management remains solid
Advisor Services Group
Organic
revenue
growth
approximately
5%
-
7%
Adjusted
EBITDA
margins
approximately
5.75%
-
6%
Includes positive margin impact from Fusion
Weighted more toward 4Q13 |
 Donna Blank |
  16
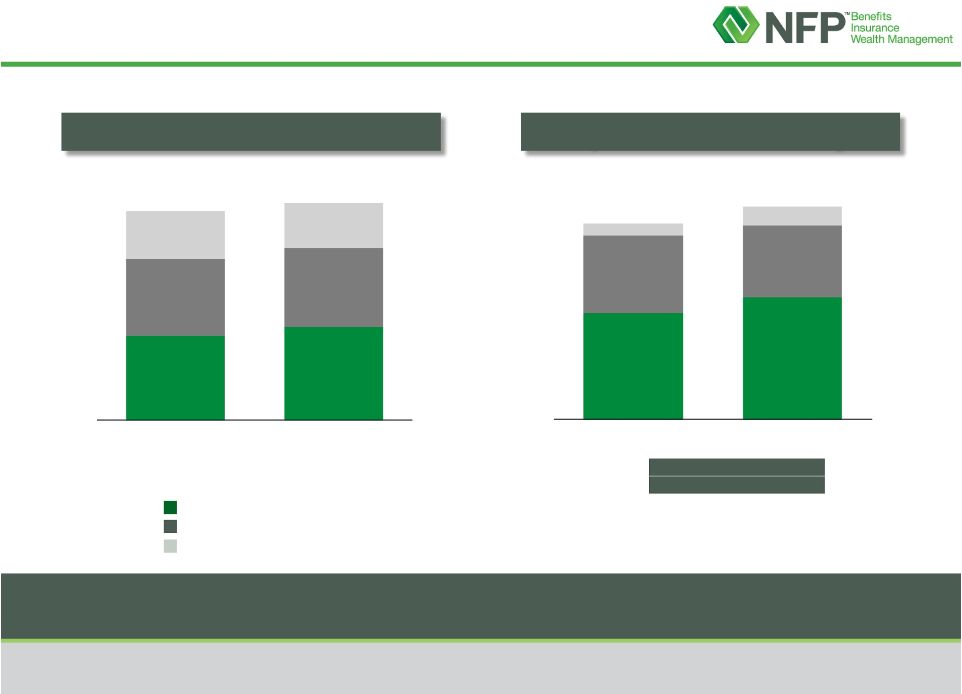
4Q12 Consolidated Financial Highlights
(1)
Growth in revenue, Adjusted EBITDA and margins
(1)
The sum of the components may not agree to total due to rounding.
Adjusted
EBITDA & Margin
Revenue
$289.2
$300.1
Adjusted EBITDA Margin
4Q11
4Q12
Corporate Client Group
18.6%
19.4%
Individual Client Group
14.8%
13.4%
Advisor Services Group
4.0%
6.2%
Consolidated
13.9%
14.5%
60%
62%
Recurring
Revenue
$40.1
$43.5
($ in millions)
Corporate Client Group
Individual Client Group
Advisor Services Group
$65.6
$107.0
$116.6
$129.0
$109.4
$61.7
4Q11
4Q12
4Q11
4Q12
$15.8
$21.7
$25.0
$14.6
$2.6
$3.8 |
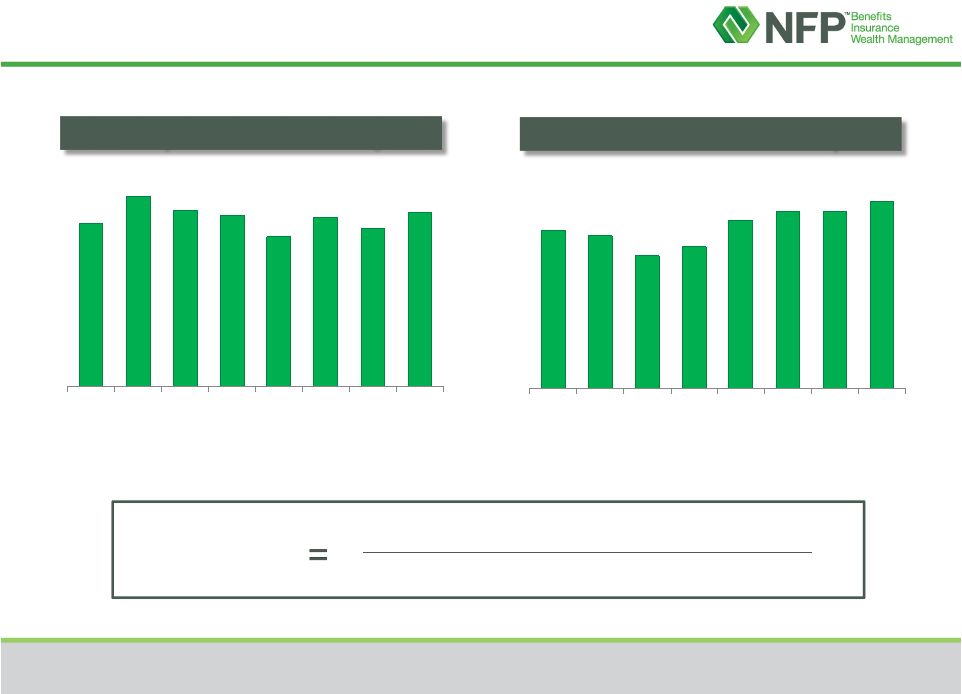 17
Corporate Client Group
Total Compensation Ratio by Segment
Individual Client Group
51%
54%
52%
52%
49%
51%
50%
52%
Q1'11
Q2'11
Q3'11
Q4'11
Q1'12
Q2'12
Q3'12
Q4'12
50%
50%
48%
49%
51%
52%
52%
53%
Q1'11
Q2'11
Q3'11
Q4'11
Q1'12
Q2'12
Q3'12
Q4'12
Total Compensation
Ratio
(1)
(2)
(1)
4Q’12 total compensation ratios exclude the accelerated vesting/reversal of certain RSUs.
Including the accelerated vesting/reversal of certain RSUs, 4Q’12 total compensation ratio is 50%.
(2)
4Q’12 total compensation ratios exclude the accelerated vesting/reversal of certain RSUs.
Including the accelerated vesting/reversal of certain RSUs, 4Q’12 total compensation ratio is 51%.
(Compensation Expense, Employees )+(Fees to Principals)
Revenue |
 18
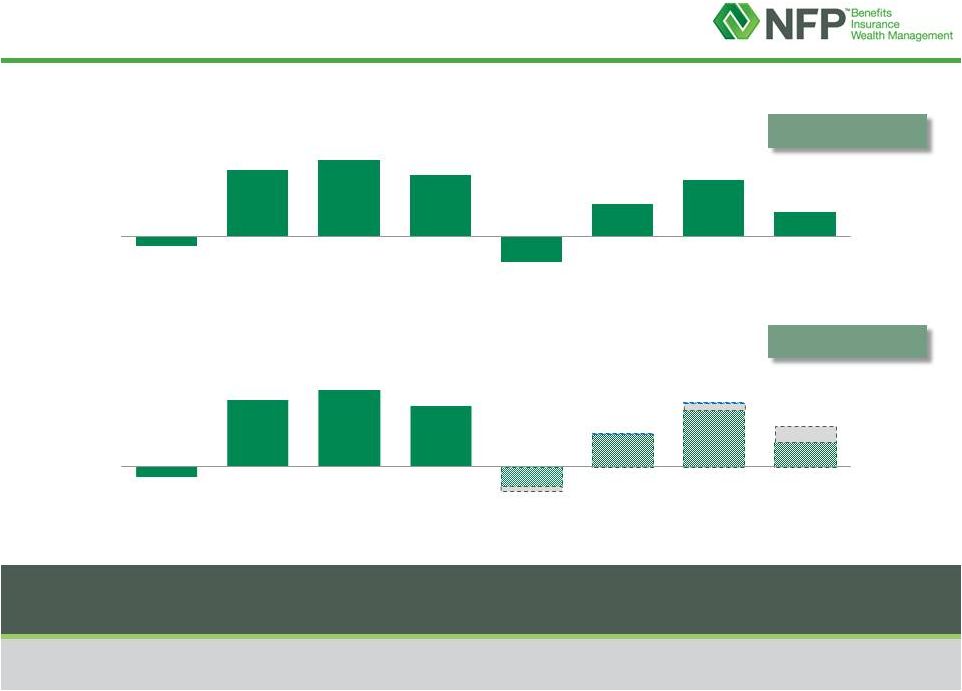
Quarterly Operating Cash Flow
(1)
(1)
The sum of the components may not agree to total due to rounding.
(2)
Cash paid in connection with management contract buy-out.
(3)
Cash paid for acquisition earn-outs that impact a portion of quarterly
operating cash flow. 2012 operating cash flow impacted by management contract buyouts,
earlier payments of fees to principals for above target performance and
increased tax payments ($ in millions)
Actual
38.5
19.5
(11.2)
23.9
(14.6)
19.6
0.1
(3)
(5.9)
39.9
45.8
36.4
(14.6)
19.5
33.6
14.5
1Q'11
2Q'11
3Q'11
4Q'11
1Q'12
2Q'12
3Q'12
4Q'12
(5.9)
39.9
45.8
36.4
33.6
14.5
3.4
(2)
4.2
(2)
9.4
(2)
0.7
(3)
1Q'11
2Q'11
3Q'11
4Q'11
Adjusted
1Q'12
Adjusted
2Q'12
Adjusted
3Q'12
Adjusted
4Q'12
As Adjusted |
 19
Balance
Sheet
Summary
–
New
Credit
Facility
($ in millions)
(1)
Represents
par
value
of
the
convertible
securities.
Book
value
is
$96.7
million.
Pro Forma Capitalization
(1)
Actual Capitalization
As of December 31, 2012
Actual
Adjustments
Pro Forma
Cash
$88.5
$88.5
Previous Revolver due 2014
$30.0
(30.0)
Previous Term Loan due 2014
$93.8
(93.8)
New Revolver ($325mm) due 2018
--
(123.8)
$123.8
Total Senior Secured Debt
$123.8
$123.8
Convertible Senior Notes
due 2017
$125.0
$125.0
Total Debt
$248.8
$248.8
Total Shareholders’
Equity
$412.0
$412.0
Total Capitalization
$660.8
$660.8 |