Attached files
| file | filename |
|---|---|
| 8-K - FORM 8-K - PIONEER NATURAL RESOURCES CO | d485439d8k.htm |
| EX-99.1 - EX-99.1 - PIONEER NATURAL RESOURCES CO | d485439dex991.htm |
 Fourth
Quarter 2012 Earnings February 14, 2013
Exhibit 99.2 |
 2
Forward-Looking Statements
Except for historical information contained herein, the statements, charts and graphs in
this presentation are forward-looking statements that are made pursuant to the
Safe Harbor Provisions of the Private Securities Litigation Reform Act of
1995. Forward-looking statements and the business prospects of Pioneer
are subject to a number of risks and uncertainties that may cause Pioneer's actual
results in future periods to differ materially from the forward-looking statements.
These risks and uncertainties include, among other things, volatility of commodity
prices, product supply and demand, competition, the ability to obtain
environmental and other permits and the timing thereof, other government
regulation or action, the ability to obtain approvals from third parties and
negotiate agreements third parties on mutually acceptable terms, the receipt of
approvals required to consummate the Company’s Southern Wolfcamp joint interest
transaction, litigation, the costs and results of drilling and operations,
availability of equipment, services, resources and personnel required to complete
the Company's operating activities, access to and availability of transportation,
processing, fractionation and refining facilities, Pioneer's ability to replace
reserves, implement its business plans or complete its development activities as scheduled,
access to and cost of capital, the financial strength of counterparties to Pioneer's
credit facility and derivative contracts and the purchasers of Pioneer's oil, NGL
and gas production, uncertainties about estimates of reserves and resource
potential and the ability to add proved reserves in the future,
the
assumptions
underlying
production
forecasts,
quality
of
technical
data,
environmental
and weather risks, including the possible impacts of climate change, the risks associated
with the ownership and operation of an industrial sand mining business and acts of
war or terrorism. These and other risks are described in Pioneer's 10-K
and 10-Q Reports and other filings with the Securities and Exchange
Commission. In addition, Pioneer may be subject to currently unforeseen risks that
may have a materially adverse impact on it. Pioneer undertakes no duty to publicly
update these statements except as required by law.
Please see the supplemental information slides included in this presentation for other
important information. |
 3
Financial and Operating Highlights
Q4 2012 adjusted income
of $107 MM, or $0.83 per adjusted share
Q4 2012 production: 165 MBOEPD (including Barnett Shale production)
Q4 2012 production: 156 MBOEPD excluding Barnett Shale production
, mid-point of Q4 guidance range
(154 MBOEPD –
158 MBOEPD)
FY 2012 production averaged 156 MBOEPD
(including Barnett Shale production), up 29%
vs. FY 2011 (+54% oil growth)
Top end of full-year guidance range
Strong growth primarily related to successful Spraberry vertical, horizontal Wolfcamp
Shale, Eagle Ford Shale and Barnett Shale Combo drilling programs
Delivered 264% drillbit reserve replacement (161 MMBOE) in 2012 at drillbit F&D cost
of $17.72 per BOE
4
Initiating $1 B horizontal drilling appraisal program of Pioneer’s northern
Wolfcamp/Spraberry acreage for 2013 and 2014
$0.4 B included in 2013 drilling budget of $2.75 billion; remainder expected to be
spent in 2014 Forecasting annual production growth of 12% to 16% from 2012 to
2013 Targeting 13% to 18% compound annual production growth for 2013 to 2015
1)
Adjusted income and the adjusted per share amount are non-GAAP financial
measures. See reconciliation in supplemental information slides 2)
Barnett Shale properties were moved to discontinued operations in Q3 in conjunction
with the divestment announcement; however, they were reclassified to continuing
operations in Q4 after electing to retain these properties 3)
Reflects South Africa as discontinued operations
4)
Excludes price revisions
1
1
2
2
3 |
 4
Drilling Highlights
First
PXD
horizontal
Wolfcamp
Shale
well
(B
interval)
in
Midland
County
highly
successful;
demonstrates prospectivity of Pioneer’s northern Wolfcamp/Spraberry acreage
position (>600,000 gross acres)
Announced $1.74 B horizontal Wolfcamp Shale joint interest transaction with
Sinochem Horizontal
Wolfcamp
Shale
results
continuing
to
improve
in
joint
interest
area
—
Includes 1.6 BBOE from southern horizontal Wolfcamp Shale joint interest area and 3.0
BBOE from horizontal drilling in northern Wolfcamp/Spraberry acreage
—
Drilled first ~10,000-foot lateral horizontal Wolfcamp Shale well (Upper B
interval) in Reagan County o
24-hour IP rate of 1,203 BOEPD; peak 20-day average rate of 1,022 BOEPD; oil
content ~80% —
Drilled first horizontal Wolfcamp Shale Lower B interval well and successful horizontal
Wolfcamp Shale A interval well in Reagan County; both currently above 575 MBOE
type curve —
Well performance from existing wells continuing to meet type curve expectations
—
Achieved targeted year-end 2012 horizontal Wolfcamp Shale production exit rate of
~5 MBOEPD Increasing companywide net resource potential from 5.7 BBOE to >8
BBOE —
24-hour
IP
rate
of
1,693
BOEPD;
peak
20-day
average
natural
flow
rate
of
1,510
BOEPD;
oil
content
~75%
—
25 miles
north
of
highly
successful
Giddings
horizontal
Wolfcamp
Shale
wells
—
Equates to ~$21,000 per acre on ~10% of Pioneer’s total Wolfcamp/Spraberry acreage
position |
 –
$425 MM southern Wolfcamp joint interest area
2
–
$575 MM Eagle Ford Shale
–
$185 MM Barnett Shale Combo
–
$190 MM Alaska
–
$150
MM
Other
(includes
land
capital
for
existing assets)
–
$2.0 B operating cash flow
–
$0.6 B joint interest cash proceeds
–
$0.4 B capital markets
NYMEX Oil Price ($/Bbl)
2013 capital program based on
$85/Bbl oil and $3.25/MMBtu gas
Sensitivity to Commodity Prices ($ MM)
5
2013E Capital Spending and Cash Flow
1
1)
Capital spending excludes acquisitions, asset retirement obligations, capitalized
interest and G&G G&A 2)
Pioneer
incurs
100%
of
capital
costs
from
January
1
st
through
estimated
closing
date
of
June
1
st
;
Pioneer
will
be
reimbursed
by
Sinochem
for
40%
of
this amount as an adjustment at closing (not credited to cost incurred); Sinochem pays
40% of capital costs and carries Pioneer for 75% of Pioneer’s 60% of
capital costs post closing 1.00
2.00
3.00
4.00
5.00
6.00
60.00
70.00
80.00
90.00
100.00
110.00
120.00
2
$240 MM Other Capital
Capital program funded from:
Capital program of $3.0 B includes:
Drilling Capital: $2.75 B
–
$1,225 MM northern Wolfcamp/Spraberry area
•
$400 MM for horizontal program
•
$625 MM for vertical program
•
$200 MM for infrastructure & automation
–
$25 MM vertical integration
–
$70 MM sand mine expansion
–
$145 MM buildings, field offices and other |
 High end
of 2013-2015 growth range assumes $100 oil / $3.75 gas; low end assumes $85 oil / $3.25 gas
6
Targeting 13% -
18% Compound
Annual
Production
Growth
for
2013
-
2015
MBOEPD
147
160
165
58%
Liquids
60%
Liquids
175 -
181
156 MBOEPD
(+29% vs. 2011)
1)
Assumes $85/Bbl oil price and $3.25/MMBtu gas price
2)
Excludes production attributable to the 40% joint interest transaction with Sinochem in
the southern Wolfcamp area assuming a June 1, 2013 closing 3)
Assumes
no
ethane
rejected
into
the
gas
stream
due
to
low
ethane
prices
3
Q1
Q2
Q3
Q4
2013E
2014E
2015E
Excludes annualized 4+ MBOEPD
conveyed
to
Sinochem
post
June
1
st
2,3
2012
151
3 |
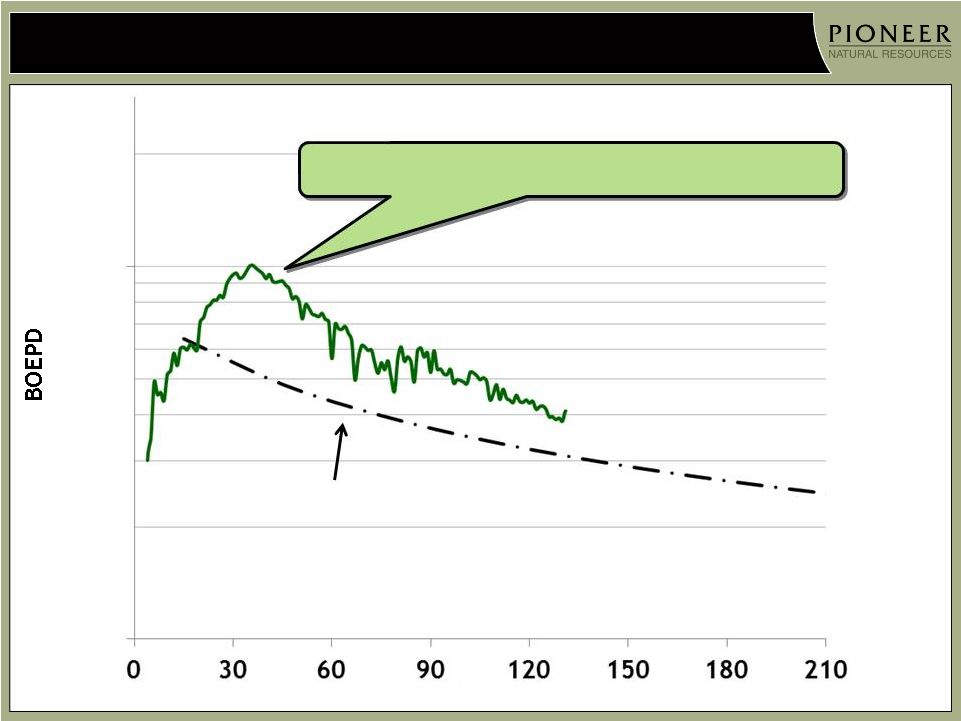
 Horizontal
Wolfcamp Shale Well Results Continue to Improve 7
650 MBOE Type Curve
Giddings Wells Average
(southern joint interest area;
2 wells, 5,300’
laterals)
Days
University 10-1 #4H (southern joint interest area)
First ~10,000’
lateral
24-hr IP of 1,203 BOEPD
Peak 20-day average rate of 1,022 BOEPD; ~80% oil
DL Hutt C #1H (Midland County)
First northern acreage horizontal, 7,380’
lateral
24-hr IP natural flow rate of 1,693 BOEPD
Peak 20-day average natural flow rate of 1,510 BOEPD; ~75% oil
Giddings horizontal Wolfcamp Shale B interval wells drilled late
2011/early 2012 tracking 650 MBOE type curve
First
northern
acreage
well
in
Midland
County
and
first
10,000’
lateral
well in Reagan County both substantially above 650 MBOE type curve
2,000
1,000
100
Artificial lift
commenced
0
30
60
90
120
150
180
210
240
270
300
330
360 |
 Horizontal
Jo Mill Wells Outperforming 650 MBOE Type Curve 8
Days
2,000
1,000
100
650 MBOE Type Curve
Initial 2 horizontal Jo Mill wells drilled in Q4 2012
(average
production
normalized
to
5,000’
lateral) |
 Wolfcamp B
Interval Prospectivity Map 9
Tier 1
Tier 1
Tier 2
Tier 2
Pioneer Land
Pioneer Land
DL Hutt C #1H
24-hr IP: 1,693 BOEPD
Peak 20-day natural flow
rate: 1,510 BOEPD; ~75% oil
7,380’
lateral length
First Martin County B well drilling
7,200’
lateral length
Tier 1 is highest prospectivity
acreage, as determined by several
geologic properties, including:
Original oil in place (OOIP)
Kerogen content
Thermal maturity
Porosity
Brittle mineral fraction (fracability,
low clay content)
Vast majority of Pioneer’s
acreage position is in Tier 1
Reservoir pressure increases with
depth to the north and west
Numerous wells have proven Tier
2 acreage to be productive and
economic
2 Giddings Wells
Avg. 24-hr IP: 845 BOEPD
Avg. peak 20-day natural flow rate:
702 BOEPD: >75% oil
5,300’
avg. lateral length
Third-party well
Peak IP: 892 BOEPD
~3,700’
lateral length
Pioneer Wolfcamp B wells
Pioneer Wolfcamp B wells
Wolfcamp B depth contour
Wolfcamp B depth contour |
 10
12/31/12 Proved Reserves: 1.1 BBOE
Additional Net Resource Potential: >8 BBOE
1)
All drilling locations shown on a gross basis
2)
SEC pricing of $94.84/Bbl for oil and $2.76/MMBtu for gas (NYMEX)
3)
Primarily reflects Alaska, Raton and South Texas
4)
Includes vertical well potential from Wolfcamp and deeper intervals
5)
Assumes average EUR of 500 MBOE per well, >600,000 gross acres, 140-acre
spacing, Wolfcamp A, B & D and Jo Mill intervals (excludes Spraberry Shale
interval potential) and 20% royalty 6)
Assumes average EUR of 575 MBOE per well, 5,600 locations, 207,000 net
acres , 140-acre spacing, laterals in all intervals (A, B, C & D),
25% royalty and Pioneer’s 60% share (reduced by ~1 BBOE associated with
joint interest transaction) Permian >7 BBOE
Significant Proved Reserves and Resource Potential
1
2
Proved Reserves + Estimated Net Resource Potential of >9 BBOE and >40,000
Drilling Locations |
 11
Southern Wolfcamp Joint Interest Area Drilling Program
Currently running 7 rigs; expect to increase
to 10 rigs in 2014 and 13 rigs in 2015
Equates to 86 wells in 2013, 120 wells in 2014 and
165 wells in 2015
2013 drilling program continues to focus on
delineating acreage
Testing multiple Wolfcamp
intervals
(A, Upper B, Lower B and D)
Targeting $7.5 MM -
$8.0 MM gross development
well cost for 7,800’
lateral
o
Testing laterals as long as 10,000’; ~$1.5 MM additional cost
Expect 50% pad drilling
Optimizing completion techniques
o
Testing slickwater fracs; potential savings of ~$1.0 MM/well
Expect gross science costs of ~$20 MM
Drilling program for 2014 and beyond
primarily focused on development drilling
and accelerating production growth
Expect 75% pad drilling
Expect to evaluate downspacing opportunities
Noteworthy 24-hr IP rates in University Area
10-14 #6H –
712 BOEPD; First Lower B well
10-1#4H –
1,203 BOEPD; First 10,000’
lateral well
10-13#6H –
442 BOEPD; Successful A well
Joint Interest Area
(Wolfcamp and deeper intervals) |
 Pioneer’s Highly Prospective Northern Wolfcamp/Spraberry Acreage
12
1 rig currently focused on delineating
northern acreage (>600,000 gross acres)
Drilled first two horizontal Wolfcamp Shale
wells in Midland County
~25 miles north of highly successful Giddings horizontal
Wolfcamp Shale wells
First well completed in B interval (DL Hutt C #1H)
Second well to be completed shortly in the A interval
Rig now drilling first of two Wolfcamp B
interval wells in Martin County
Pioneer’s extensive Midland Basin geologic
analysis, based upon data from thousands of
wells, has identified multiple prospective
horizontal targets with substantial oil in place
throughout Pioneer’s northern acreage
2013 northern Wolfcamp/Spraberry drilling
program accelerates appraisal and delineation
of these targets (Wolfcamp Shales, Jo Mill and
Spraberry Shales) with 4 rigs
Currently drilling first of
two wells in Martin County
Pioneer’s northern
Wolfcamp/Spraberry Acreage
First two Midland
County wells
First two Giddings wells
Joint Interest Area
(Wolfcamp and deeper intervals) |
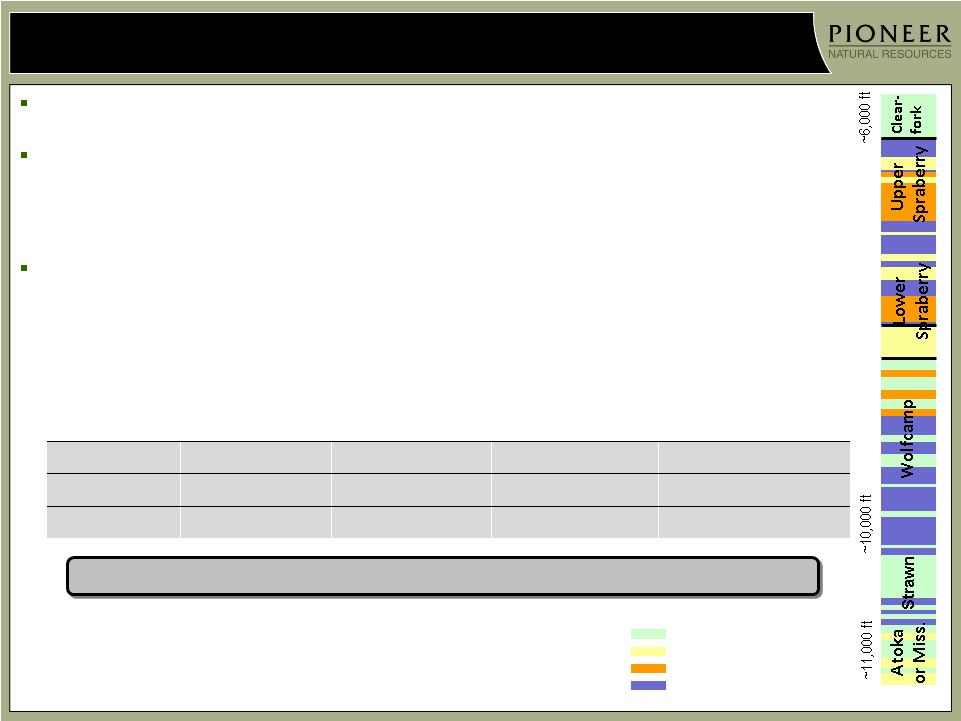
 13
Northern Wolfcamp/Spraberry Acreage –
2013 Drilling Plan
Wolfcamp
A
Wolfcamp
B
Wolfcamp
D
Jo Mill
M. Spraberry
Shale
L. Spraberry
Shale
15 to 20 wells
15 to 20 wells
2013 northern Wolfcamp/Spraberry
acreage horizontal drilling program
Running 1 rig currently; ramping to 4 rigs
in Q2
Plan to drill a total of 30 to 40 wells
targeting 6 different intervals
Targeting $7.5 MM -
$8.5 MM well cost
for 7,000’
laterals depending on depth
Excludes science and facilities capital
of ~$80 MM
U. Spraberry
M. Spraberry
Shale
L. Spraberry
Jo Mill
L. Spraberry
Shale
Dean
Wolfcamp A
Wolfcamp Lower B
Wolfcamp C1
Wolfcamp C2
Wolfcamp D
Strawn
Wolfcamp Upper B
Miss/Atoka |
 14
Northern
Wolfcamp/Spraberry
Acreage
–
Initiating
$1
B
Appraisal
Program
2013 drilling program expected to cost ~$400 MM
Program expected to:
Appraise prospective acreage and confirm additional
resource potential across 6 stacked intervals on >600,000
gross acres; totals >3 MM gross acres
o
Resource potential in Wolfcamp A, B and D intervals and Jo Mill
interval across northern Wolfcamp/Spraberry acreage estimated
to be 3 BBOE
Deliver year-end 2013 horizontal production exit rate of
5 MBOEPD to 7 MBOEPD
Improve capital efficiency compared to vertical drilling
Expect to ramp up to 6 -
8 rigs during 2014 at a
cost of ~$600 MM
Continue appraisal program and commence development
drilling
May also test horizontal drilling in deeper intervals below
the Wolfcamp Shale
Spending $1 B over 2 years to confirm ~3 BBOE
of resource potential and add substantial NAV
2013 Appraisal Areas
Planned 2013 appraisal
areas; 6 intervals |
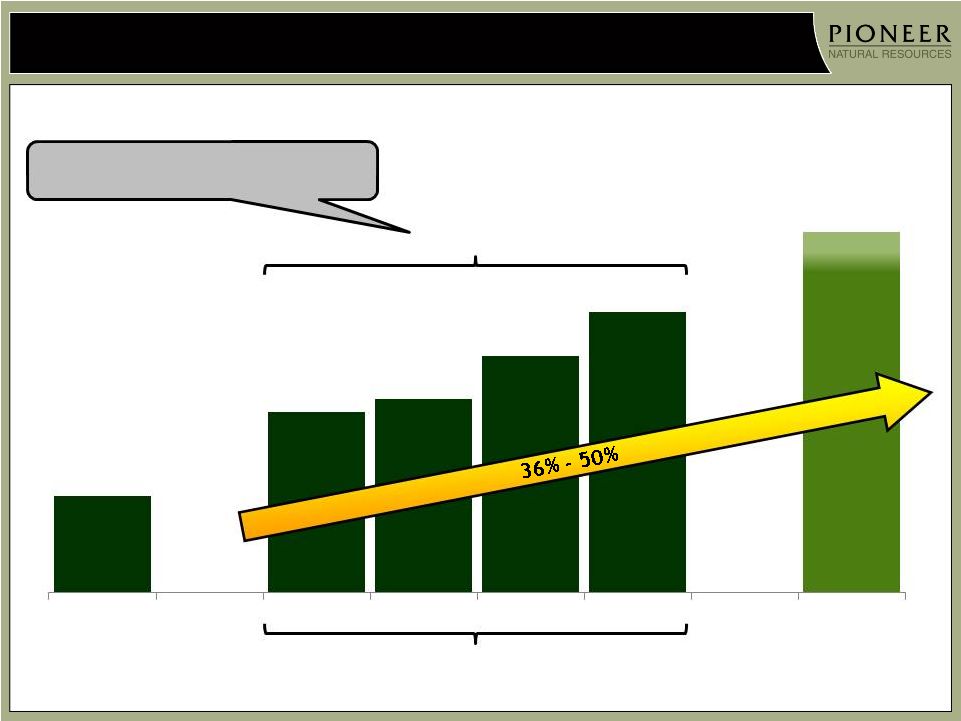
 Spraberry
Vertical Drilling Program 15
Limestone Pay
Sandstone Pay
Non-Organic Shale Non-Pay
Organic Rich Shale Pay
Commingled Wells
Placed on
Production in 2012
2012 Average
24-hour IP (BOEPD)
Potential Incremental
EUR (MBOE)
Prospective PXD Acreage
Strawn
208
145
30
up from ~70% to ~85%
Atoka
134
180
50 –
70
40% -
50%
Mississippian
55
140
15 –
40
~20%
1)
Compares to average vertical well completed through the Lower Wolfcamp with an average
EUR of 140 MBOE and an average 24-hour IP of 90 BOEPD
Deeper drilling accounted for 65% of 2012 vertical drilling program; expected to
increase to 90% in 2013
Vertical rig count reduced during 2012 from 40 rigs in Q1 to 20 rigs at year-end as
horizontal activity increased
–
Drilled 132 vertical wells in Q4 and 631 wells in 2012
–
Built frac bank by 57 vertical wells over 2H 2012
2013 drilling program runs 15 vertical rigs and drills ~300 wells
–
Majority of rigs required to meet continuous drilling obligations
–
15 rigs to 20 rigs required to keep vertical production flat
–
Expect
to
draw
down
frac
bank
by
60
-
70
vertical
wells
during
2013
Dean
Deeper drilling provides potential to add up to 100 MBOE to vertical Wolfcamp well
1
1 |
 Continuing to Successfully Grow Wolfcamp/Spraberry Production
16
Wolfcamp/Spraberry Net Production
1
(MBOEPD)
1) Includes production from Strawn, Atoka and Mississippian intervals in Spraberry
vertical wells and horizontal Wolfcamp Shale and Jo Mill wells 45
62
2012
64
69
69
75-80
66 MBOEPD
Q4 production flat compared to Q3 due to:
~1,700 BOEPD negative impact related to reduced
ethane recoveries resulting from Spraberry gas
processing facilities operating above capacity due
to greater-than-anticipated industry production
growth
Vertical wells awaiting completion increased by 57
wells during 2H
Reduced ethane recoveries expected to
continue into Q2 2013 until new Driver
plant comes online in April providing
additional capacity of 200 MMCFPD
Negative impact to Pioneer’s Q1 production
expected to be 2,000 BOEPD to 3,000 BOEPD
Vertical rig count decreasing from average
of 32 rigs in 2012 to 15 rigs in 2013
Horizontal rig count increasing from
average of 3 rigs in 2012 to 11 rigs in 2013
Expect horizontal production to increase
from an average of 2 MBOEPD in 2012 to
11 MBOEPD to 14 MBOEPD in 2013
2
2,3
Top end of original FY guidance
range (63 MBOEPD –
67 MBOEPD)
Horizontal production
exit rate: ~5 MBOEPD
2) Production
reduced
after
June
1
st
to
reflect
the
divested
volumes
associated
with
the
southern
Wolfcamp
joint
interest
transaction
3) Assumes no ethane rejected into the gas stream due to low ethane prices
|
 Eagle
Ford Shale Operational Update 17
Drilled 30 wells in Q4 2012; 37 wells placed on production
2013 drilling program
Expanding use of white sand proppant to deeper areas to further
define its performance limits (>50% of 2013 program)
~97 wells stimulated using white sand in 2011 and 2012; early well
performance similar to direct offset ceramic-stimulated wells
Reduces frac cost by ~$700 M
Expect to increase lateral length from 5,700’
in 2012 to 6,200’
in
2013; increases cost by $500 M per well
Well cost: $7 MM to $8 MM
11 CGPs on line; adding 12
by end of 2013
th
Expect to drill ~130 wells
Drilling essentially all liquids-rich wells ~80% pad
drilling, up from 45% in 2012; saves $600 M to $700 M per well and allows
130 wells to be drilled with 10 rigs vs. 12 rigs last year |
 Eagle
Ford Shale Continues to Set New Production Records 18
Eagle Ford Shale Net Production
(MBOEPD)
12
1)
Reflects Pioneer’s ~35% share of total gross production
2)
Assumes
no
ethane
rejected
into
the
gas
stream
due
to
low
ethane
prices
28 MBOEPD
2012
Top end of original FY guidance
range (25 MBOEPD –
29 MBOEPD)
2
2011
Q1
Q2
Q3
Q4
2013E
1
38 -
42
35
29
24
23 |
 Continuing to Grow Barnett Shale Combo Production
19
Barnett Shale Net Production
(MBOEPD)
4
6
2012
7
9 -
12
7
9
7 MBOEPD
Drilled 8 wells in Q4; 8 wells placed on
production
Expect to increase rig count from 1 rig to 2
rigs in Q2 2013 to hold high-graded acreage
~20% of 82,000 net acreage position currently HBP
Drilling data and petrophysical and seismic analysis
have identified highest-return areas across Pioneer’s
acreage (reflects ~45,000 net acres of remaining
~65,000 non-HBP net acres)
Increase in drilling efficiencies requires fewer rigs to
hold acreage
2-rig drilling program required to hold the higher-
return acreage over next 3 years
Well cost for 5,000’
lateral: ~$3 MM
Gross EUR: ~400 MBOE (16% oil, 42% NGLs, 42% gas)
1)
Assumes
no
ethane
rejected
into
the
gas
stream
due
to
low
ethane
prices
1 |
 20
Alaska
Q4 net production: ~4 MBOPD
1-rig development program
continues from the Oooguruk island
drill site targeting Nuiqsut and Torok
intervals
Following first successful mechanically
diverted frac on a Nuiqsut well in 2012,
planning similar fracs for 1 Torok and 3
Nuiqsut wells during Q1
2
onshore
Torok
appraisal
well
being drilled
Will be completed with mechanically
diverted frac
Initial onshore Torok well added 50 MMBO
resource potential in 2012; currently
being flow tested and is producing at a
facility-limited rate of 2,800 BOPD gross
Progressing onshore development FEED
study for Torok production
PXD Acreage
Island
Development
Area
Island drill site
(Oooguruk)
Torok Area
1 well to be
frac’d from island
drill site and 1
well to be frac’d
from onshore drill
site
Nuiqsut Area
3 wells to be frac’d
from island drill site
Nuiqsut Wells
Torok Wells
nd
Second onshore
Torok appraisal well
Torok onshore
drill site |
 Net
income attributable to common stockholders 29
0.22
Unrealized mark-to-market (MTM) derivative gains ($22 MM before tax)
(14)
(0.11)
Adjusted income excluding unrealized MTM derivative gains
15
0.11
Unusual items included in adjusted income:
Impairment of Barnett Shale assets previously held for sale ($160 MM before tax)
101
0.78
Alaska Petroleum Production Tax credit income ($14 MM before tax)
(9)
(0.06)
Adjusted income excluding unrealized MTM derivative gains and unusual items
107
0.83
21
Q4 2012 Earnings Summary
$ Per Share
$ Millions
(After Tax)
Guidance
Q4 2012 Results Excluding
Unrealized MTM Derivative
Gains, Unusual Items and
Barnett Shale Activity
Q4 2012 Results from
Continuing Operations
Daily Production
(MBOEPD)
154 –
158
156
165
Production Costs Including Taxes ($/BOE)
$14.50 -
$16.50
$ 14.48
$ 14.62
Exploration & Abandonment
($ MM)
$25 -
$35
$ 16
$ 89
DD&A ($/BOE)
$13.50 -
$15.50
$ 14.63
$ 14.54
G&A
4
($ MM)
$60 -
$65
$ 68
$ 68
Interest Expense ($ MM)
$53 -
$58
$ 54
$ 54
Other Expense ($ MM)
$25 -
$35
$ 27
$ 27
Accretion of Discount on ARO ($ MM)
$2 -
$4
$ 2
$ 3
Noncontrolling Interest ($ MM)
$8 -
$11
$ 8
5
$ 11
Current Income Taxes /(Benefits) ($ MM)
$2 -
$7
-
-
Effective Tax Rate
6
(%)
35% -
40%
34%
24%
Q4 2012 Guidance vs. Results
1)
Non-GAAP financial measure. See reconciliation in supplemental information
slides 2)
3)
Exploration and abandonments in continuing operations included $72 MM of unproved
impairments on Barnett Shale assets (included in unusual items above) 4)
Includes additional performance-related compensation
5)
Excludes unrealized MTM derivative gains attributable to noncontrolling interest of $ 3
MM in Q4 2012 6)
Excludes income attributable to noncontrolling interest of $ 11 MM in Q4 2012
1
1
2
3
Q4 production was negatively impacted by a total of ~1,700 BOEPD due to reduced ethane
recoveries at Spraberry gas processing facilities |
 22
Price Realizations
1
Oil ($/BBL)
NGL ($/BBL)
Gas ($/MCF)
Derivative impact included
in price
1.79
(0.15)
(0.42)
-
-
-
-
-
-
-
-
-
-
-
-
Derivative impact not
included in price
Price
92.74
99.73
87.94
89.77
87.78
44.20
42.57
34.48
32.49
31.48
4.81
4.49
4.43
4.48
4.48
VPP and derivative impact
1.23
0.58
1.07
1.68
3.89
(1.50)
0.76
1.86
1.53
0.79
1.44
1.98
2.43
1.86
1.28
VPPs and Derivatives
Realized Prices (excludes VPPs and derivatives)
Price including VPPs and
all derivatives
VPPs
2.45
1.99
1.87
1.79
1.71
-
-
-
-
-
-
-
-
-
-
1) All periods presented have been restated to exclude discontinued operations
2) Represents cash settlements recorded in net derivative gains or losses excluding
liquidated derivatives 91.51
45.70
3.37
99.15
41.81
2.51
86.87
32.62
2.00
88.09
83.89
30.96
30.69
2.62
3.20
Q4 11
Q1 12
Q2 12
Q3 12
Q4 12
Q4 11
Q1 12
Q2 12
Q3 12
Q4 12
Q4 11
Q1 12
Q2 12
Q3 12
Q4 12
(3.01)
(1.26)
(0.38)
(0.11)
2.18
(1.50)
0.76
1.86
1.53
0.79
1.44
1.98
2.43
1.86
1.28
2 |
 23
Production Costs (per BOE)
1
VPP-Adjusted
Production Cost
1)
2)
See supplemental information slides
$13.16
$12.99
$13.88
$15.27
$14.32
Q4 production cost decrease vs.
Q3 primarily due to the following
LOE items:
–
Lower salt water disposal costs
–
Lower electricity costs
–
Lower repair and maintenance costs
All periods presented have been restated to exclude discontinued operations and
intercompany eliminations Production
&
Ad Valorem Taxes
Workovers
LOE
Third Party
Transportation
Natural Gas
Processing
Q4 ’11
$13.52
Q1 ’12
$0.30
$13.30
$0.24
Q2 ’12
$14.21
$0.64
Q3 ’12
$0.59
Q4 ’12
$0.42
$15.61
$14.62
$0.68
$3.18
$1.36
$8.00
$7.70
$8.08
$9.61
$8.68
$1.24
$1.28
$1.28
$1.40
$3.43
$3.25
$3.38
$3.14
$0.69
$0.96
$0.75
$0.98 |
 24
Q1 2013 Guidance
Daily Production (MBOEPD)
165 –
170
Production Costs ($/BOE)
$14.00 –
$16.00
Exploration & Abandonment ($ MM)
$25 –
$35
Drilling and Acreage
$15
Personnel
and
Seismic
$20
DD&A ($/BOE)
$13.50 –
$15.50
G&A ($ MM)
$60 –
$65
Interest Expense ($ MM)
$53 –
$58
Other Expense ($ MM)
$25 –
$35
Accretion of Discount on ARO ($ MM)
$2 –
$4
Noncontrolling Interest (principally PSE) ($ MM)
$8 –
$11
Current Income Taxes ($ MM)
$2 –
$7
Effective Tax Rate (%)
35% –
40%
Guidance
1
1)
Excludes MTM derivative changes due to increases or decreases in future commodity
prices |
 25
Supplemental Information
Supplemental Information Slides
Slide #
2012 Reserve Additions
26
2012 Drilling Capital
27
Liquidity Position
28
Historic Production
29 -
30
Oil and Gas Revenue
31
Derivative Position
32 -
34
Oil, NGL and Gas Differentials
35 -
37
General & Administrative Costs
38
Interest Costs
39
Exploration and Abandonments
40
Income Taxes
41
Supplemental Non-GAAP Financial Measures
42
Supplemental Earnings Per Share Information
43
Supplemental Non-GAAP Financial Measures
44 -
45
VPP -
Adjusted Production Costs
46
Reserves Audit, F&D Costs and Reserve Replacement
47
Certain Reserve Information
48 |
 Added
161 MMBOE from the drillbit, or 264% of full-year production, at a drillbit
F&D cost of $17.72 per BOE Reflects significant drilling campaigns in
horizontal Wolfcamp Shale, Spraberry vertical, Eagle Ford Shale and
Barnett Shale Combo plays
All-in reserve replacement of 87 MMBOE, or 144% of full-
year production at an all-in F&D cost of $34.46 per BOE,
including:
Negative pricing revisions of 82 MMBOE due to significant
decline in gas prices
Negative technical revisions of 27 MMBOE; performance
improvements of 53 MMBOE offset by 80 MMBOE of vertical
Spraberry PUDs moved to the probable category as the
Company shifts to more horizontal drilling in the Spraberry
field based on successful horizontal Wolfcamp Shale
drilling results
Reserve mix
100% U.S.
45% oil / 21% NGLs / 34% gas
58% PD / 42% PUD
Proved Reserves / Production: ~18 years
PD Reserves / Production: ~10 years
26
Strong 2012 Reserve Additions
1
Year-end ’12
Proved Reserves
(MMBOE)
627
119
116
101
55
44
23
1
1,086
1)
Reflects 2012 SEC pricing (12-month average) of $94.84/Bbl for oil and $2.76/MMBtu
for gas (NYMEX) as compared to 2011 SEC pricing of $96.13/Bbl for oil and
$4.12/MMBtu for gas (NYMEX) Spraberry
Raton
Eagle Ford
Mid-Continent
Barnett Shale
Alaska
South Texas
Other
Total |
 27
2012 Drilling Capital
1
1)
Excludes
acquisitions,
asset
retirement
obligations,
capitalized
interest
and
G&G
G&A
$ Millions
$741
$678
$639
$670
$2,728
Q1 2012
Q2 2012
Q3 2012
Q4 2012
FY 2012 |
 28
Liquidity Position (12/31/12)
1
Net debt (net of cash balance of $229 MM):
$3.4 B
Unsecured credit facility availability:
$1.0 B
Net debt-to-book capitalization:
37%
1)
Excludes $126 MM of borrowings under PSE’s $300 MM credit facility that matures in
March 2017 2)
Excludes net discounts and deferred hedge losses of ~$49 MM
3)
Convertible senior notes due 2038; based on trading value, interest rate reduced to
2.375% from 2.875% effective January 15, 2013; holders of $241 MM in principal
amount exercised their right to convert in Q1
4)
Excludes ~$2 MM of outstanding letters of credit on credit facility; credit facility
balance as of January 31, 2013 was $750 MM Maturities
and
Balances
2
Unsecured credit facility matures in 2017
Investment grade rated
Expect to call convertible senior notes due 2038 for redemption during 2013
2012
2016
$600 MM
3.95%
2017
$455 MM
5.875%
2022
$450 MM
6.875%
$474 MM
4
of
$1.5 B unsecured credit facility
2018
$485 MM
6.65%
2013
$480 MM
3
2.375%
$450 MM
7.50%
2020
$250 MM
7.20%
2028 |
 29
Production (MBOEPD)
1
Q4 ’11
Q1 ’12
Q2 ’12
Q3 ’12
Q4 ’12
Spraberry
53
62
64
2
69
3
69
4
Eagle Ford Shale
20
23
24
29
35
Raton
26
26
25
25
24
South Texas
7
7
6
6
6
Mid-Continent
19
18
18
18
17
Barnett
6
6
7
7
9
Alaska
4
4
5
5
4
Other
2
1
2
1
1
Total
137
147
151
160
165
1)
2)
Q2 ‘12 production negatively impacted by ~4,800 BOEPD due to unplanned third party
fractionation capacity shortfalls at Mont Belvieu 3)
continuing
ethane
rejection
and
3
rd
party
fractionation
capacity
constraints
at
Mont
Belvieu
4)
All periods presented have been restated to exclude discontinued operations Q4 production was negatively impacted by a total of
~1,700 BOEPD due to reduced ethane recoveries at Spraberry gas processing facilities
Q3 ’12 production benefited by ~1,800 BPD from partial NGL inventory drawdown at
Mont Belvieu, but offset by a production loss of ~4,000 BOEPD due to |
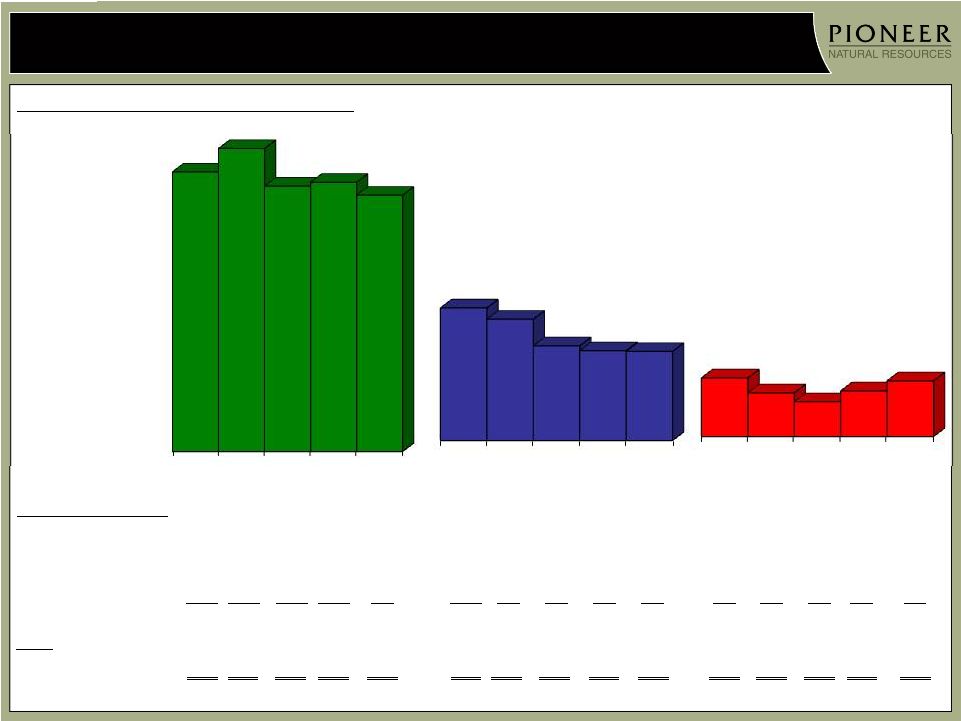
 PXD
Production
By
Commodity
By
Area
1
30
1)
All periods presented have been restated to exclude discontinued operations |
 31
Oil and Gas Revenue
1
$ Millions
VPP Deferred
Revenue
$665
$719
$642
$716
$735
$654
$710
$632
$706
$725
$11
$9
$10
$10
$10
Q4 '11
Q1 '12
Q2 '12
Q3 '12
Q4 '12
1)
All periods presented have been restated to exclude discontinued operations |
 32
Swaps –
WTI (BPD)
3,000
3,000
3,000
3,000
-
-
NYMEX WTI Price ($/BBL)
$ 81.02
$ 81.02
$ 81.02
$ 81.02
-
-
Three
Way
Collars
–
(BPD)
1
66,750
68,750
72,750
75,750
69,000
26,000
NYMEX Call Price ($/BBL)
$ 119.31
$ 119.42
$ 119.74
$ 120.47
$ 114.05
$ 104.45
NYMEX Put Price ($/BBL)
$ 92.30
$ 92.38
$ 92.53
$ 91.90
$ 93.70
$ 95.00
NYMEX Short Put Price ($/BBL)
$ 74.01
$ 74.19
$ 74.51
$ 74.39
$ 77.61
$ 80.00
% Total Oil Production
~95%
~95%
~95%
~95%
~75%
~25%
Three
Way
Collars
–
(BPD)
1
1,064
1,064
1,064
1,064
1,000
-
NYMEX Call Price ($/BBL)
$ 105.28
$ 105.28
$ 105.28
$ 105.28
$ 109.50
-
NYMEX Put Price ($/BBL)
$ 89.30
$ 89.30
$ 89.30
$ 89.30
$ 95.00
-
NYMEX Short Put Price ($/BBL)
$ 75.20
$ 75.20
$ 75.20
$ 75.20
$ 80.00
-
% Total NGL Production
<5%
<5%
<5%
<5%
<5%
-
% Total Liquids
~65%
~65%
~65%
~65%
~55%
~15%
Midland/Cushing Swaps (BPD)
3,278
5,000
-
-
-
-
Price Differential ($/BBL)
$ (5.75)
$ (5.75)
-
-
-
-
Cushing/LLS Swaps (BPD)
-
-
-
1,000
-
-
Price Differential ($/BBL)
-
-
-
$(7.60)
-
-
Spraberry Fixed Differential
2
24,000
26,000
28,000
30,000
33,000
35,000
Price Differential ($/BBL)
$ (1.75)
$ (1.75)
$ (1.75)
$ (1.75)
$ (1.75)
$ (1.75)
Oil Basis Protection
Q1 2013
Q2 2013
Q3 2013
Q4 2013
2014
2015
Natural Gas Liquids
Q1 2013
Q2 2013
Q3 2013
Q4 2013
2014
2015
Q1 2013
Q2 2013
Q3 2013
Q4 2013
2014
2015
Oil
PXD Open Commodity Derivative Positions as of 2/8/2013 (includes
PSE)
1) When NYMEX price is above call price, PXD receives call price. When NYMEX
price is between put price and call price, PXD receives NYMEX price. When NYMEX price is between the put price and the
short put price, PXD receives put price. When NYMEX price is below the short put
price, PXD receives NYMEX price plus the difference between the short put price and put price
2) Market transaction representing Midland/Cushing differential; not a derivative |
 33
Swaps -
(MMBTUPD)
162,500
162,500
162,500
162,500
105,000
-
NYMEX Price ($/MMBTU)
1
$ 5.13
$ 5.13
$ 5.13
$ 5.13
$ 4.03
-
Collars -
(MMBTUPD)
150,000
150,000
150,000
150,000
-
-
NYMEX Call Price ($/MMBTU)
1
$ 6.25
$ 6.25
$ 6.25
$ 6.25
-
-
NYMEX Put Price ($/MMBTU)
1
$ 5.00
$ 5.00
$ 5.00
$ 5.00
-
-
Three
Way
Collars
–
(MMBTUPD)
1,2
-
-
-
-
25,000
225,000
NYMEX Call Price ($/MMBTU)
-
-
-
-
$4.70
$ 5.09
NYMEX Put Price ($/MMBTU)
-
-
-
-
$4.00
$ 4.00
NYMEX Short Put Price ($/MMBTU)
-
-
-
-
$3.00
$ 3.00
% Total Gas Production
~80%
~80%
~80%
~80%
~30%
~55%
Spraberry
(MMBTUPD)
52,500
52,500
52,500
52,500
-
-
Price Differential ($/MMBTU)
$ (0.23)
$ (0.23)
$ (0.23)
$ (0.23)
-
-
Mid-Continent (MMBTUPD)
50,000
50,000
50,000
50,000
10,000
-
Price Differential ($/MMBTU)
$ (0.30)
$ (0.30)
$ (0.30)
$ (0.30)
$ (0.19)
-
Gulf Coast
(MMBTUPD)
60,000
60,000
60,000
60,000
-
-
Price Differential ($/MMBTU)
$ (0.14)
$ (0.14)
$ (0.14)
$ (0.14)
-
-
Gas Basis Swaps
Q1 2013
Q2 2013
Q3 2013
Q4 2013
2014
2015
Q1 2013
Q2 2013
Q3 2013
Q4 2013
2014
2015
Gas
PXD Open Commodity Derivative Positions as of 2/8/2013 (includes
PSE)
1) Represents the NYMEX Henry Hub index price or approximate NYMEX price based on
historical differentials to the index price at the time the derivative was entered into
2) When NYMEX price is above call price, PXD receives call price. When NYMEX
price is between put price and call price, PXD receives NYMEX price. When NYMEX price is
between the put price and the short put price, PXD receives put price. When NYMEX
price is below the short put price, PXD receives NYMEX price plus the difference
between short put price and put price |
 34
1)
When NYMEX price is above call price, PSE receives call price. When NYMEX price
is between put price and call price, PSE receives NYMEX price. When NYMEX price is between the put price and the short put price,
2) Approximate NYMEX price based on differentials to index prices at the date the
derivative was entered into Oil
Q1 2013
Q2 2013
Q3 2013
Q4 2013
2014
2015
Swaps
(BPD)
3,000
3,000
3,000
3,000
-
-
NYMEX Price ($/BBL)
$81.02
$81.02
$81.02
$81.02
-
-
Three-Way
Collars
(BPD)
1,750
1,750
1,750
1,750
5,000
-
NYMEX Call Price ($/BBL)
$116.00
$116.00
$116.00
$116.00
$105.74
-
NYMEX Put Price ($/BBL)
$88.14
$88.14
$88.14
$88.14
$100.00
-
NYMEX Short Put Price ($/BBL)
$73.14
$73.14
$73.14
$73.14
$80.00
-
% Oil Production
~85%
~85%
~85%
~85%
~85%
-
Gas
Swaps
(MMBTUPD)
2,500
2,500
2,500
2,500
5,000
-
NYMEX Price ($/MMBTU)
$6.89
$6.89
$6.89
$6.89
$4.00
-
Three-Way
Collars
(MMBTUPD)
-
-
-
-
-
5,000
NYMEX Call Price ($/MMBTU)
-
-
-
-
-
$5.00
NYMEX Put Price ($/MMBTU)
-
-
-
-
-
$4.00
NYMEX Short Put Price ($/MMBTU)
-
-
-
-
-
$3.00
% Gas Production
~35%
~35%
~35%
~35%
~70%
~65%
% Total Production
~65%
~65%
~65%
~65%
~70%
~10%
Gas Basis Swaps
Q1 2013
Q2 2013
Q3 2013
Q4 2013
2014
2015
Spraberry
(MMBTUPD)
2,500
2,500
2,500
2,500
-
-
Price Differential ($/MMBTU)
(0.31)
(0.31)
(0.31)
(0.31)
-
-
PSE Derivative Position as of 2/8/2013
1,
2
2
1
PSE receives put price. When NYMEX price is below the short put price, PSE
receives NYMEX price plus the difference between the short put price and put price |
 Q4
’11 Q1 ’12
Q2 ’12
Q3 ’12
Q4 ’12
NYMEX calendar month average
$ 94.06
$ 102.93
$ 93.49
$ 92.22
$ 88.18
NYMEX differential
(2.55)
(3.78)
(6.62)
(4.13)
(4.29)
Realized prices excluding
VPPs and derivatives
91.51
99.15
86.87
88.09
83.89
Impact of VPPs and derivatives included in price
VPPs
2.45
1.99
1.87
1.79
1.71
Derivatives included in price
1.79
(0.15)
(0.42)
-
-
Reported prices including
VPPs and derivatives
included in price
95.75
100.99
88.32
89.88
85.60
Derivatives not included in price
(3.01)
(1.26)
(0.38)
(0.11)
2.18
Price including VPPs and all derivatives
$ 92.74
$ 99.73
$ 87.94
$ 89.77
$ 87.78
35
Oil Differentials (per BBL)
2
1
1)
All periods presented have been restated to exclude discontinued operations
2)
Represents cash settlements recorded in net derivative gains or losses excluding
liquidated derivatives |
 36
NGL
Differentials
(per
BBL)
Q4 ’11
Q1 ’12
Q2 ’12
Q3 ’12
Q4 ’12
NYMEX oil calendar month average
$ 94.06
$ 102.93
$ 93.49
$ 92.22
$ 88.18
NYMEX differential
(48.36)
(61.12)
(60.87)
(61.26)
(57.49)
Realized prices excluding derivatives
45.70
41.81
32.62
30.96
30.69
Impact of derivatives included in price
-
-
-
Reported prices including derivatives included in price
45.70
41.81
32.62
30.96
30.69
Derivatives
not
included
in
price
(1.50)
0.76
1.86
1.53
0.79
Price including all derivatives
$ 44.20
$ 42.57
$ 34.48
$ 32.49
$ 31.48
Realized NGL prices excluding derivatives as a
percentage of NYMEX oil calendar month average
49%
41%
35%
34%
35%
1
2
1)
All periods presented have been restated to exclude discontinued operations 2) Represents cash settlements recorded in net derivative
gains or losses excluding liquidated derivatives |
 37
Gas Differentials (per MCF)
1
Q4 ’11
Q1 ’12
Q2 ’12
Q3 ’12
Q4 ’12
NYMEX bid week average
$ 3.55
$ 2.72
$ 2.21
$ 2.80
$ 3.41
NYMEX differential
(0.18)
(0.21)
(0.21)
(0.18)
(0.21)
Realized prices excluding
derivatives
3.37
2.51
2.00
2.62
3.20
Impact of derivatives included in price
-
-
-
-
-
Reported prices including
derivatives included in price
3.37
2.51
2.00
2.62
3.20
Derivatives not included in price
2
1.44
1.98
2.43
1.86
1.28
Price including all derivatives
$ 4.81
$ 4.49
$ 4.43
$ 4.48
$ 4.48
1)
All
periods
presented
have
been
restated
to
exclude
discontinued
operations
2)
Represents cash settlements recorded in net derivative gains or losses excluding
liquidated derivatives |
 38
General & Administrative Costs
1
$ Millions
Noncash
Q4
2011
1) All periods presented have been restated to exclude discontinued operations
Q1
2012
$55
Q2
2012
$63
Q3
2012
$55
Q4
2012
$63
$68
Includes performance-based
compensation awards for 2012 |
 39
Interest Costs
1
$ Millions
Q4
2011
1) All periods presented have been restated to exclude discontinued operations
$46
Q1
2012
Q2
2012
$47
$49
Q3
2012
Q4
2012
$54
Noncash
$54 |
 40
Exploration & Abandonments
Drilling & Acreage
Barnett Shale
$ 72
Acreage & Other
1
73
Geological & Geophysical
Seismic
2
Personnel & Other
14
16
4
th
Quarter 2012 Total
$ 89
$ Millions |
 41
Quarter Ended December 31, 2012
($ Millions)
Current tax benefit
Deferred tax provision
Income Taxes Attributable to Continuing Operations $ -
(9)
$ (9) |
 Net
Income $ 40
Depletion, depreciation and amortization
220
Exploration and abandonments
89
Impairment
88
Accretion of discount on asset retirement obligations
3
Interest expense
54
Income tax provision
9
Gain on disposition of assets, net
(1)
Derivative related activity
(24)
Amortization of stock-based compensation
16
Amortization of deferred revenue
(11)
Other noncash items
(19)
EBITDAX
464
Cash interest expense
(45)
Discretionary cash flow
419
Cash exploration expense
(16)
Changes in operating assets and liabilities
77
Net cash provided by operating activities
$ 480
42
Supplemental Non-GAAP Financial Measures
EBITDAX and discretionary cash flow (“DCF”) are disclosed by Pioneer, and
reconciled to the generally accepted accounting principle (“GAAP”)
measures of net income and net cash provided by operating activities because of their
wide acceptance by the investment community as financial indicators of a
company’s ability to internally fund exploration and development activities and to service or incur
debt.
The
Company
also
views
the
non-GAAP
measures
of
EBITDAX
and
DCF
as
useful
tools
for
comparisons
of
the
Company’s
financial
indicators
with
those
of
peer
companies
that
follow
the
full
cost
method
of
accounting.
EBITDAX
and
DCF
should
not
be
considered
as
alternatives
to
net
income
or
net
cash
provided
by
operating
activities,
as
defined
by
GAAP.
Q4 ’12
($ Millions) |
 Weighted
average basic and diluted common shares outstanding Basic
123,240
Dilutive common stock options
143
Contingently issuable performance unit shares
196
Convertible senior notes dilution
3,366
Diluted
126,945
43
Supplemental Earnings Per Share Information
Q4 2012
Q4 2012
Net income attributable to common stockholders
$ 28,834
Participating share-
and unit-based basic earnings
(516)
Basic net income attributable to common stockholders
Diluted effect of participating securities
24
Diluted net income attributable to common stockholders
$ 28,342
The Company uses the two-class method of calculating basic and diluted earnings per
share. Under the two-class method of calculating earnings per share,
GAAP provides that share- and unit-based awards with guaranteed dividend or distribution participation rights qualify as “participating securities”
during their vesting periods. The Company’s basic net income per share
attributable to common stockholders is computed as (i) net income attributable to
common stockholders, (ii) less participating share- and unit-based basic earnings (iii) divided by weighted average basic shares outstanding. The
Company’s diluted net income per share attributable to common stockholders is
computed as (i) basic net income attributable to common stockholders, (ii) plus
the dilutive effect, if any, of participating securities (iii) divided by weighted average diluted shares outstanding. During periods in which the
Company realizes a loss from continuing operations attributable to common stockholders,
securities or other contracts to issue common stock are dilutive to loss per
share; therefore, conversion into common stock is assumed not to occur.
The following table is a reconciliation of the Company’s net income attributable to
common stockholders to basic net income attributable to common stockholders and to
diluted net income attributable to common stockholders for the three months ended December 31, 2012 (in thousands):
28,318 |
 44
Supplemental Non-GAAP Financial Measures
$ Per Share
$ Millions
(After Tax)
Net income attributable to common stockholders
29
0.22
Unrealized MTM derivative gains ($22 MM before tax)
(14)
(0.11)
Adjusted income excluding unrealized MTM derivative gains
15
0.11
Unusual items included in adjusted income:
Impairment of Barnett Shale assets previously held for sale ($160 MM before tax)
101
0.78
Alaska Petroleum Production Tax credit income ($14 MM before tax)
(9)
(0.06)
Adjusted income excluding unrealized MTM derivative gains and unusual items
Adjusted income excluding unrealized MTM derivative gains and adjusted income
excluding unrealized MTM derivative gains and unusual items, as presented in the Q4 2012
Earnings Summary slide, is presented and reconciled to Pioneer’s net income
attributable to common stockholders and diluted common shares outstanding (determined in
accordance with GAAP) because Pioneer believes that these non-GAAP financial measures
reflect an additional way of viewing aspects of Pioneer’s business that, when viewed
together with its financial results computed in accordance with GAAP, provides a more
complete understanding of factors and trends affecting its historical financial
performance and future operating results, greater transparency of underlying trends and
greater comparability of results across periods. In addition, management believes
that these non-GAAP measures may enhance investors’ ability to assess
Pioneer’s historical and future financial performance. These non-GAAP financial measures are not
intended to be substitutes for the comparable GAAP measures and should be read only in
conjunction with Pioneer’s consolidated financial statements prepared in accordance
with GAAP. Unrealized MTM derivative gains and losses and unusual items will recur in
future periods; however, the amount and frequency can vary significantly from period
to period. The table below reconciles Pioneer’s net income attributable to common
stockholders for the three months ended December 31, 2012, as determined in
accordance with GAAP, to adjusted income excluding unrealized MTM derivative gains and
adjusted income excluding unrealized MTM derivative gains and unusual items for
that quarter.
0.83
107 |
 Supplemental Non-GAAP Financial Measures
Q4 2012 Results from
Continuing Operations
Adjustments to Exclude
Barnett Shale Q4 2012
Operating Results
(1)
Adjustments to Exclude
Unrealized MTM Derivative
Gains and Unusual Items
Q4 2012 Results Excl.
Unrealized MTM Derivative
Gains, Unusual Items and
Barnett Shale Activity
Daily Production (MBOEPD)
165
(9)
156
Production Costs ($/BOE)
14.62
(0.14)
14.48
Exploration & Abandonment ($ MM)
89
(73)
16
DD&A ($/BOE)
14.54
0.09
14.63
G&A ($ MM)
68
68
Interest Expense ($ MM)
54
54
Other Expense ($ MM)
27
27
Accretion of Discount on ARO ($ MM)
3
(1)
2
Noncontrolling Interest
11
(3)
8
Current Tax Provision (Benefit)
-
-
Effective Tax Rate
2
(%)
24%
(10%)
34%
(1)
The Company’s Barnett Shale properties were reclassified to discontinued
operations during the third quarter of 2012 as a result of the Company’s decision to
divest of these properties
(2) The effective tax rates in the adjustment columns represent the
effective tax rates attributable to the results or adjustments applicable to that column
45
Selected Q4 2012 results excluding Barnett Shale activity and excluding unrealized MTM derivative gains
and unusual items, as presented in the Q4 2012 Earnings Summary Slide, are presented and
reconciled to the comparable GAAP results in the table below because Pioneer believes that these
non-GAAP financial measures reflect an additional way of viewing aspects of Pioneer’s
business that, when viewed together with its financial results computed in accordance with GAAP, provide a more
complete understanding of factors and trends affecting its historical financial performance and future
operating results, greater transparency of underlying trends and greater comparability of results
across periods. In addition, management believes that these non-GAAP measures may
enhance investors’ ability to assess Pioneer’s historical and future financial performance. These
non-GAAP financial measures are not intended to be substitutes for the comparable GAAP measure and
should be read only in conjunction with Pioneer’s consolidated financial statements prepared
in accordance with GAAP. |
 46
VPP –
Adjusted Production Costs
Pioneer presents VPP-Adjusted Production Costs (per BOE) to assist
investors in considering the Company’s costs in relation to the total BOEs
(reported sales volumes plus VPP delivered volumes) in connection with
which those costs were incurred. VPP-Production Costs (per BOE) are
calculated as follows:
Q4 ’11
Q1 ’12
Q2 ’12
Q3 ’12
Q4 ‘12
Production costs as reported (thousands)
$ 170,000
$ 177,579
$ 194,574
$ 229,467
$ 221,781
Production (MBOE):
As reported
12,576
13,352
13,696
14,710
15,163
VPP deliveries
345
319
319
322
322
VPP-adjusted production
12,921
13,671
14,015
15,032
15,485
Production costs per BOE:
As reported
$ 13.52
$ 13.30
$ 14.21
$ 15.61
$14.62
VPP-adjusted
$ 13.16
$ 12.99
$ 13.88
$ 15.27
$14.32
1) All periods presented have been restated to exclude discontinued operations and
intercompany eliminations 1 |
 47
An audit of proved reserves follows the general principles set forth in the standards
pertaining to the estimating and auditing of oil and gas reserve information
promulgated by the Society of Petroleum Engineers ("SPE"). A reserve audit
as defined by the SPE is not the same as a financial audit. Please see the Company's Annual Report on Form 10-
K for a general description of the concepts included in the SPE's definition of a reserve
audit. "Finding and development cost per BOE," or “all-in F&D
cost per BOE,” means total costs incurred divided by the
summation of annual proved reserves, on a BOE basis, attributable to revisions of
previous estimates, purchases of minerals-in-place, discoveries and
extensions and improved recovery. Consistent with industry practice, future
capital costs to develop proved undeveloped reserves are not included in costs
incurred. "Drillbit finding and development cost per BOE," or
“drillbit F&D cost per BOE,” means the summation of exploration
and development costs incurred divided by the summation of annual proved reserves,
on a BOE basis, attributable to technical revisions of previous estimates,
discoveries and extensions and improved recovery. Consistent with industry
practice, future capital costs to develop proved undeveloped reserves are not included in
costs incurred. “Reserve replacement”
is the summation of annual proved reserves, on a BOE basis, attributable to revisions of
previous estimates, purchases of minerals-in-place, discoveries and
extensions and improved recovery divided by annual production of oil, NGLs and
gas, on a BOE basis. “Drillbit reserve replacement”
is the summation of annual proved reserves, on a BOE basis, attributable to technical
revisions of previous estimates, discoveries and extensions and improved recovery
divided by annual production of oil, NGLs and gas, on a BOE basis.
Reserves
Audit,
F&D
Costs
and
Reserve
Replacement |
 48
Certain Reserve Information
Cautionary Note to U.S. Investors --The U.S. Securities and Exchange Commission
(the "SEC") prohibits oil and gas companies, in their filings with the
SEC, from disclosing estimates
of
oil
or
gas
resources
other
than
“reserves,”
as
that
term
is
defined
by
the
SEC. In this presentation, Pioneer includes estimates of quantities of oil and gas using
certain
terms,
such
as
“resource,”
“resource
potential,”
“EUR”,
“oil
in
place”
or
other
descriptions of volumes of reserves, which terms include quantities of oil and gas that
may not meet the SEC’s definitions of proved, probable and possible reserves,
and which the
SEC's
guidelines
strictly
prohibit
Pioneer
from
including
in
filings
with
the
SEC.
These
estimates
are
by
their
nature
more
speculative
than
estimates
of
proved
reserves
and
accordingly are subject to substantially greater risk of being recovered by Pioneer. U.S.
investors are urged to consider closely the disclosures in the Company’s
periodic filings with the SEC. Such filings are available from the Company at 5205
N. O'Connor Blvd., Suite 200, Irving, Texas 75039, Attention Investor Relations,
and the Company’s website at www.pxd.com. These filings also can be obtained
from the SEC by calling 1-800-SEC- 0330. |