Attached files
| file | filename |
|---|---|
| EX-3.3 - EX-3.3 - MARIN SOFTWARE INC | d450382dex33.htm |
| EX-4.2 - EX-4.2 - MARIN SOFTWARE INC | d450382dex42.htm |
| EX-3.1 - EX-3.1 - MARIN SOFTWARE INC | d450382dex31.htm |
| EX-10.5 - EX-10.5 - MARIN SOFTWARE INC | d450382dex105.htm |
| EX-23.1 - EX-23.1 - MARIN SOFTWARE INC | d450382dex231.htm |
| EX-10.6 - EX-10.6 - MARIN SOFTWARE INC | d450382dex106.htm |
| EX-10.8 - EX-10.8 - MARIN SOFTWARE INC | d450382dex108.htm |
| EX-10.2 - EX-10.2 - MARIN SOFTWARE INC | d450382dex102.htm |
| EX-10.7 - EX-10.7 - MARIN SOFTWARE INC | d450382dex107.htm |
| EX-21.1 - EX-21.1 - MARIN SOFTWARE INC | d450382dex211.htm |
Table of Contents
As filed with the Securities and Exchange Commission on February 13, 2013
Registration No. 333-
UNITED STATES SECURITIES AND EXCHANGE COMMISSION
Washington, DC 20549
FORM S-1
REGISTRATION STATEMENT UNDER THE SECURITIES ACT OF 1933
MARIN SOFTWARE INCORPORATED
(Exact name of registrant as specified in its charter)
| Delaware | 7372 | 20-4647180 | ||
| (State or other jurisdiction of incorporation or organization) |
(Primary Standard Industrial Classification Code Number) |
(I.R.S. Employer Identification Number) |
123 Mission Street, 25th Floor
San Francisco, California 94105
(415) 399-2580
(Address, including zip code, and telephone number, including area code, of registrant’s principal executive offices)
Christopher A. Lien
Founder, Chief Executive Officer and Director
Marin Software Incorporated
123 Mission Street, 25th Floor
San Francisco, California 94105
(415) 399-2580
(Name, address, including zip code, and telephone number, including area code, of agent for service)
Copies to:
| Gordon K. Davidson, Esq. Jeffrey R. Vetter, Esq. Michael A. Brown, Esq. Fenwick & West LLP 801 California Street Mountain View, CA 94041 (650) 988-8500 |
Rashmi Garde, Esq. General Counsel Marin Software Incorporated 123 Mission Street, 25th Floor San Francisco, California 94105 (415) 399-2580 |
Douglas D. Smith, Esq. Stewart L. McDowell, Esq. Gibson Dunn & Crutcher LLP 555 Mission Street San Francisco, CA 94105 (415) 393-8200 |
Approximate date of commencement of proposed sale to the public: As soon as practicable after the effective date of this registration statement.
If any of the securities being registered on this form are to be offered on a delayed or continuous basis pursuant to Rule 415 under the Securities Act of 1933 check the following box. ¨
If this form is filed to register additional securities for an offering pursuant to Rule 462(b) under the Securities Act, check the following box and list the Securities Act registration statement number of the earlier effective registration statement for the same offering. ¨
If this form is a post-effective amendment filed pursuant to Rule 462(c) under the Securities Act, check the following box and list the Securities Act registration statement number of the earlier effective registration statement for the same offering. ¨
If this form is a post-effective amendment filed pursuant to Rule 462(d) under the Securities Act, check the following box and list the Securities Act registration number of the earlier effective registration statement for the same offering. ¨
Indicate by check mark whether the registrant is a large accelerated filer, an accelerated filer, a non-accelerated filer, or a smaller reporting company. See the definitions of “large accelerated filer,” “accelerated filer” and “smaller reporting company” in Rule 12b-2 of the Exchange Act. (Check one):
| Large accelerated filer ¨ | Accelerated filer ¨ | Non-accelerated filer x | Smaller reporting company ¨ | |||
| (Do not check if a smaller reporting company) | ||||||
CALCULATION OF REGISTRATION FEE
|
| ||||
| Title of each class of securities to be registered |
Proposed maximum price(1)(2) |
Amount of registration fee | ||
| Common Stock, $0.001 par value per share |
$75,000,000 | $10,230 | ||
|
| ||||
|
| ||||
| (1) | Estimated solely for the purpose of calculating the amount of the registration fee in accordance with Rule 457(o) of the Securities Act of 1933, as amended. |
| (2) | Includes the offering price of shares that the underwriters have the option to purchase to cover over-allotments, if any. |
The Registrant hereby amends this Registration Statement on such date or dates as may be necessary to delay its effective date until the Registrant shall file a further amendment which specifically states that this Registration Statement shall thereafter become effective in accordance with Section 8(a) of the Securities Act of 1933, as amended, or until the Registration Statement shall become effective on such date as the Securities and Exchange Commission, acting pursuant to said Section 8(a), may determine.
Table of Contents
The information in this preliminary prospectus is not complete and may be changed. These securities may not be sold until the registration statement filed with the Securities and Exchange Commission is effective. This preliminary prospectus is not an offer to sell nor does it seek an offer to buy these securities in any jurisdiction where the offer or sale is not permitted.
Subject to Completion. Dated February 13, 2013.
Shares

Common Stock
This is an initial public offering of shares of common stock of Marin Software Incorporated.
Marin Software is offering of the shares to be sold in the offering. The selling stockholders identified in this prospectus are offering an additional shares. Marin Software will not receive any of the proceeds from the sale of the shares being sold by the selling stockholders.
Prior to this offering, there has been no public market for the common stock. It is currently estimated that the initial public offering price per share will be between $ and $ . Marin Software intends to list the common stock on the New York Stock Exchange under the symbol “MRIN.”
We are an “emerging growth company” as defined under federal securities laws. See “Risk Factors” on page 11 to read about factors you should consider before buying shares of the common stock.
Neither the Securities and Exchange Commission nor any state securities commission has approved or disapproved of these securities or determined if this prospectus is truthful or complete. Any representation to the contrary is a criminal offense.
| Per Share | Total | |||||||
| Initial public offering price |
$ | $ | ||||||
| Underwriting discounts and commissions |
$ | $ | ||||||
| Proceeds, before expenses, to Marin Software |
$ | $ | ||||||
| Proceeds, before expenses, to the selling stockholders |
$ | $ | ||||||
To the extent that the underwriters sell more than shares of common stock, the underwriters have the option to purchase up to an additional shares from Marin Software and the selling stockholders at the initial public offering price less the underwriting discounts and commissions.
The underwriters expect to deliver the shares against payment in New York, New York on , 2013.
| Goldman, Sachs & Co. | Deutsche Bank Securities | |
| UBS Investment Bank | Stifel | |
| Wells Fargo Securities | ||
Prospectus dated , 2013
Table of Contents
| Page | ||||
| 1 | ||||
| 11 | ||||
| 34 | ||||
| 35 | ||||
| 36 | ||||
| 36 | ||||
| 37 | ||||
| 39 | ||||
| 41 | ||||
| Management’s Discussion and Analysis of Financial Condition and Results of Operations |
43 | |||
| 72 | ||||
| 93 | ||||
| 101 | ||||
| 110 | ||||
| 114 | ||||
| 117 | ||||
| 122 | ||||
| Material U.S. Federal Income Tax Considerations for Non-U.S. Holders of Common Stock |
124 | |||
| 129 | ||||
| 133 | ||||
| 133 | ||||
| 133 | ||||
| F-1 | ||||
We have not authorized anyone to provide any information or to make any representations other than those contained in this prospectus or in any free writing prospectuses we have prepared. We take no responsibility for, and can provide no assurance as to the reliability of, any other information that others may give you. This prospectus is an offer to sell only the shares offered hereby, but only under circumstances and in jurisdictions where it is lawful to do so. The information contained in this prospectus is current only as of its date.
Persons who come into possession of this prospectus and any applicable free writing prospectus in jurisdictions outside the United States are required to inform themselves about and to observe any restrictions as to this offering and the distribution of this prospectus and any such free writing prospectus applicable to that jurisdiction.
i
Table of Contents
This summary highlights information contained elsewhere in this prospectus and does not contain all of the information you should consider in making your investment decision. Before deciding to invest in shares of our common stock, you should read this summary together with the more detailed information, including our consolidated financial statements and the related notes, provided elsewhere in this prospectus. You should carefully consider, among other things, the matters discussed in “Risk Factors,” our consolidated financial statements and the related notes, and “Management’s Discussion and Analysis of Financial Condition and Results of Operations,” in each case included elsewhere in this prospectus.
Marin Software Incorporated
Our Business
We provide a leading cloud-based digital advertising management platform that enables advertisers and agencies to improve financial performance, realize efficiencies and time savings, and make better business decisions. Our Revenue Acquisition Management platform is an analytics, workflow, and optimization solution for marketing professionals, enabling them to effectively manage their digital advertising spend across search, display, social and mobile advertising channels. Our solution is designed to help our customers:
| Ÿ | measure the effectiveness of their advertising campaigns through our proprietary reporting and analytics capabilities; |
| Ÿ | manage and execute campaigns through our intuitive user interface and underlying technology that streamlines and automates key functions, such as ad creation and bidding, across multiple publishers and channels; and |
| Ÿ | optimize campaigns across multiple publishers and channels in real time based on market and business data to achieve desired revenue outcomes using our predictive bid management technology. |
Advertisers are increasingly focused on performance-based marketing and are seeking ways to gather, analyze and leverage data about the effectiveness of digital advertising to run more impactful and targeted campaigns. Our robust and flexible platform integrates with leading publishers, such as Baidu, Bing, Facebook, Google, Yahoo! and Yahoo! Japan, as well as leading web analytics and ad-serving solutions, and key enterprise applications to enable marketers to measure the return on investment of their marketing programs.
Our platform serves as a system-of-record for advertising performance, revenue and conversion data and allows advertisers to correlate advertising spend to subsequent revenue outcomes or business events. Through a single, intuitive interface, designed to meet the daily workflow requirements of online marketers, we enable our customers to simultaneously run large-scale digital advertising campaigns across multiple publishers and channels, making it easy for marketers to create, publish, modify and optimize campaigns in real time. Our predictive bid management and optimization technology also allows advertisers to forecast outcomes and optimize campaigns across multiple publishers and channels to achieve their business goals. Our optimization technology enables advertisers to easily and rapidly increase spend on those campaigns, publishers and channels that are performing while reducing investment in those that are not.
In December 2012, our customers collectively managed $ in annualized advertising spend on our platform and we had active advertisers using our solution globally across a wide
1
Table of Contents
range of industries. We define an active advertiser as an advertiser from whom we recognized revenues in excess of $2,000 in the last month of a quarter. We market and sell our solutions to advertisers directly and through leading advertising agencies. We generate revenues from subscription contracts under which we charge fees generally based upon the amount of advertising spend that our customers manage through our platform. We have achieved 14 consecutive quarters of revenue growth. For 2009, 2010 and 2011, and for the nine months ended September 30, 2012, our revenues were $7.5 million, $19.0 million, $36.1 million and $42.5 million, representing period-over-period growth of 186%, 152%, 90% and 72%, respectively. We had net losses of $9.7 million in 2009, $10.9 million in 2010, $17.4 million in 2011 and $19.2 million for the nine months ended September 30, 2012.
Industry Overview
As audiences have increased their time spent online, the ability to acquire revenue through digital channels has emerged as a strategic priority for marketers. A growing number of consumers and businesses worldwide are relying on the Internet, social media and mobile devices to research products and services and make purchases. These trends are causing an ongoing shift in advertising budgets to digital channels as enterprises increasingly compete to acquire customers and revenues online. This competition for revenue acquisition is driving a need for a new category of enterprise software to help advertisers effectively measure, manage and optimize their digital advertising spend.
Global spend on advertising is expected to grow from $480 billion in 2012 to $619 billion in 2017, according to Magna Global. Rapid growth in online activity and engagement is resulting in a significant and ongoing shift in advertising spend to digital channels with global spend on digital advertising expected to grow from $98 billion in 2012 to $174 billion in 2017, according to Magna Global.
The evolution of a multi-channel and multi-device digital advertising ecosystem creates opportunities for advertisers to more effectively target and reach specific audiences to optimize revenue acquisition and other desired business results. However, as digital advertising becomes increasingly competitive and complex, digital advertisers are faced with several key challenges, such as the need to quickly and efficiently respond to changing market conditions and consistently deliver desired business results across multiple channels, publishers and devices. Existing approaches to digital advertising management are limited in scope and effectiveness. These approaches include: publisher tools, which only manage workflow on a particular publisher platform; spreadsheets, which are not scalable; proprietary internal systems, which are increasingly complex and expensive to build and maintain; and bid management tools, which lack end-to-end workflow and analytics capabilities.
The inadequacy of these existing approaches, coupled with a growing shift in budgets to digital advertising and demand for performance-based marketing, has created the need for a new category of enterprise-class digital advertising management solutions. This category of solutions, which we refer to as Revenue Acquisition Management, enables businesses to intelligently and efficiently measure, manage, and optimize their digital advertising spend to achieve desired business results. We believe there is significant demand for Revenue Acquisition Management solutions among advertisers worldwide.
Our Solution
We believe our Revenue Acquisition Management platform enables advertisers to significantly improve their ability to acquire revenue through digital advertising campaigns.
2
Table of Contents
Business Benefits
Financial lift. As a result of optimization of advertising spend, efficiencies in workflow and better decision making, our customers are able to create and execute successful campaigns that lead to increased revenue and other desired business outcomes. Based on our internal customer surveys, we believe that our customers typically realize financial lift from using our platform through a variety of means such as increased volumes of revenues or leads, higher profits, improved advertising return on investment, and lower costs of customer acquisition.
Efficiencies and time savings. Utilizing our solution, customers are able to automate manual and time-intensive tasks such as reporting, analysis, campaign creation and bidding, allowing advertisers to focus on campaign strategy, expansion and optimization. In June 2012, we conducted an internal survey of employees of our customers that had used our platform at least four times in the last 365 days. Of the 250 responses, representing 149 unique customers, half of the respondents reported time savings of 25% or greater from using our solution.
Better business decision making. Our Revenue Acquisition Management platform enables advertisers to manage campaigns to their business objectives by identifying campaign elements for segmentation and analysis in order to easily categorize, filter and compare data sets that are important to their business. In addition, through our proprietary recommendation engine, we are able to proactively suggest modifications to optimize marketing campaigns.
Key Strengths
Robust and flexible integration. Our platform is architected to enable our customers to aggregate and analyze key data from their digital advertising campaigns and business information systems, creating a system-of-record that marketers can use to attribute revenue to specific marketing spend, gain visibility into the path to purchase, and assess customer lifetime value.
Big data analytics. Our platform provides sophisticated analytics functionality that can parse through massive and growing data sets to enable advertisers to understand their return on advertising investment, easily identify outliers and trends, and take appropriate action.
Real-time, cross-publisher campaign management. Our solution enables customers to simultaneously run large-scale digital advertising campaigns across multiple publishers and channels, making it easy for marketers to create, publish, modify and optimize campaigns in real time using a single interface.
Predictive bid management and optimization. Our bid management technology allows marketers to optimize campaigns across multiple publishers and channels to achieve their business goals, such as increasing revenues or decreasing the cost per lead or cost per customer acquired. Advertisers can also forecast and adjust outcomes using our predictive bidding technology.
Intuitive interface offering visibility and control. Our intuitive interface is designed to simplify the daily workflow requirements of online marketers, including managing multiple campaigns, performing real-time analytics and collaborating with multi-user teams.
Experienced team committed to customer success. We have a global team experienced in the areas of digital advertising and enterprise software, which enables us to provide effective onboarding, best-practice advice and reliable and responsive technology support to our customers.
3
Table of Contents
Highly-scalable and extensible cloud-based architecture. We deliver our cloud-based platform using a purpose-built technology foundation designed to support enterprise-scale data sets and transaction volumes. Our technology allows customers to aggregate, store and process large amounts of data while maintaining high application availability and responsiveness.
Our Growth Strategy
Our goal is to extend our lead in and grow the Revenue Acquisition Management category. Key elements of our growth strategy include:
Enhancing our leadership position by innovating and expanding our platform. We intend to continue to enhance the value of our platform by developing new functionality, optimizing our feature set and platform capabilities, and expanding support for additional publishers and data sources.
Acquiring new advertisers. We intend to continue to make investments to acquire new advertisers. We intend to expand our sales organization by adding sales executives globally and plan to continue to market our platform to new advertisers and agencies.
Expanding within our existing advertiser base. We believe that we can capture additional advertising spend on our platform from our existing advertiser base by expanding our current capabilities as well as offering new features and functionality, providing best practices support and demonstrating our ability to help our advertisers obtain financial lift, time savings and better business results.
Further penetrating display, social and mobile opportunities. We believe that we can increase advertising spend on our platform as mobile, social and display channels grow in scale and complexity. We intend to continue to optimize our solution to handle unique complexities associated with display, social and mobile advertising channels.
Continuing to expand internationally. We plan to continue to grow our international business by supporting additional regional publishers, expanding our global sales team and working with leading agencies and advertisers worldwide.
Growing our partner ecosystem and selectively pursuing acquisitions. We intend to further develop our partner ecosystem with leading publishers, technology partners, advertising agencies, and other sales channel partners. In addition, we intend to selectively pursue acquisitions of complementary businesses and technologies.
Selected Risks Associated with Our Business
Our business is subject to a number of risks and uncertainties, including those highlighted in the section titled “Risk Factors” immediately following this prospectus summary. Some of these risks include:
| Ÿ | We have a history of losses and we may not achieve or sustain profitability in the future. |
| Ÿ | Our limited operating history makes it difficult to evaluate our current business and future prospects. |
| Ÿ | Our usage-based pricing model makes it difficult to accurately forecast revenues. |
| Ÿ | The market for digital advertising management solutions is relatively new and dependent on growth in digital advertising channels. If this market develops more slowly or differently than we expect, our business, growth prospects and financial condition would be adversely affected. |
| Ÿ | If we are unable to maintain our relationships with, and access to, publishers, our business will suffer. |
4
Table of Contents
| Ÿ | Our growth depends in part on the success of our relationships with advertising agencies. |
| Ÿ | We may not be able to compete successfully against current and future competitors. |
| Ÿ | Our business depends on our customers’ continued willingness to manage advertising spend on our platform. |
| Ÿ | We incur upfront costs associated with onboarding advertisers to our platform and may not recoup our investment if we do not maintain the advertiser relationship over time. |
| Ÿ | Our directors, executive officers and principal stockholders will continue to have substantial control over us after this offering and could delay or prevent a change in corporate control. After this offering, our directors, executive officers and holders of more than 5% of our common stock, together with their affiliates, will beneficially own, in the aggregate, % of our outstanding common stock. |
Corporate Information
We were incorporated in the State of Delaware in March 2006. Our principal executive offices are located at 123 Mission Street, 25th Floor, San Francisco, California 94105, and our telephone number is (415) 399-2580. Our website address is www.marinsoftware.com. The information contained on, or that can be accessed through, our website is not a part of this prospectus. Investors should not rely on any such information in deciding whether to purchase our common stock.
Unless the context indicates otherwise, as used in this prospectus, the terms “Company,” “Marin Software,” “we,” “us” and “our” refer to Marin Software Incorporated, a Delaware corporation, and its subsidiaries taken as a whole, unless otherwise noted.
We have registered the trademark “Marin” in the European Union and have a pending trademark application for the trademark “Marin” pending with the United States Patent and Trademark Office. The Marin Software logo and all product names are our common law trademarks. All other service marks, trademarks and tradenames appearing in this prospectus are the property of their respective owners.
5
Table of Contents
THE OFFERING
| Shares of common stock offered by us |
shares | |
| Shares of common stock offered by the selling stockholders |
shares | |
| Total shares of common stock offered |
shares | |
| Over-allotment option to be offered by us |
shares | |
| Over-allotment option to be offered by the selling stockholders |
shares | |
| Shares of common stock to be outstanding immediately after this offering |
shares ( shares if the over-allotment option is exercised in full) | |
| Use of proceeds |
We intend to use the net proceeds to us for working capital and other general corporate purposes. We may use a portion of the proceeds to acquire complementary businesses or technologies. We will not receive any of the proceeds from the shares of common stock to be sold by the selling stockholders. See “Use of Proceeds.” | |
| Risk factors |
You should read the “Risk Factors” section of this prospectus for a discussion of factors to consider carefully before deciding to invest in shares of our common stock. | |
| Proposed New York Stock Exchange symbol |
“MRIN” | |
The number of shares of our common stock to be outstanding following this offering is based on 23,266,995 shares of our common stock outstanding as of September 30, 2012 and excludes:
| Ÿ | 4,273,447 shares of common stock issuable upon the exercise of options outstanding as of September 30, 2012, with a weighted average exercise price of $3.72 per share; |
| Ÿ | 211,000 shares of common stock issuable upon the exercise of options granted between October 1, 2012 and December 10, 2012, with an exercise price of $12.15 per share; |
| Ÿ | 87,692 shares of our common stock issuable upon the exercise of warrants outstanding as of September 30, 2012, with a weighted average exercise price of $2.73 per share; |
| Ÿ | 309,447 shares of our common stock that are issued but were subject to a right of repurchase by us as of September 30, 2012 and therefore are not included in stockholders’ (deficit) equity; and |
| Ÿ | shares of our common stock reserved for future issuance under our equity compensation plans, consisting of (a) 3,263 shares of our common stock reserved for issuance under our 2006 Equity Incentive Plan as of September 30, 2012, (b) shares of our common stock that will be reserved for issuance under our 2013 Equity Incentive Plan, and (c) shares of our common stock reserved for issuance under our 2013 Employee Stock Purchase Plan. On the date of this prospectus, any remaining shares available for issuance under our 2006 Equity Incentive Plan will be added to the shares reserved under our 2013 Equity Incentive Plan and we will cease granting awards under the 2006 Equity Incentive Plan. |
6
Table of Contents
| Our 2013 Equity Incentive Plan and 2013 Employee Stock Purchase Plan also provide for automatic annual increases in the number of shares reserved thereunder, as more fully described in “Executive Compensation—Employee Benefit Plans.” |
Unless otherwise noted, the information in this prospectus reflects and assumes the following:
| Ÿ | the automatic conversion of all outstanding shares of our convertible preferred stock, including shares of our Series F-1 convertible preferred stock issued in November 2012, into an aggregate of 18,752,943 shares of our common stock effective immediately prior to the completion of this offering; |
| Ÿ | the filing of our restated certificate of incorporation and the effectiveness of our restated bylaws, which will occur upon the completion of this offering; |
| Ÿ | no exercise of outstanding options or warrants; and |
| Ÿ | no exercise by the underwriters of their option to purchase up to an additional shares of our common stock from us in this offering. |
7
Table of Contents
SUMMARY CONSOLIDATED FINANCIAL DATA
The following tables present our summary historical financial data. You should read this information in conjunction with “Selected Consolidated Financial Information,” “Management’s Discussion and Analysis of Financial Condition and Results of Operations” and the consolidated financial statements, related notes and other financial information included elsewhere in this prospectus.
We derived the summary consolidated statements of operations data for 2009, 2010 and 2011 from our audited consolidated financial statements included elsewhere in this prospectus. We derived the unaudited consolidated statements of operations data for the nine months ended September 30, 2011 and 2012, and the unaudited consolidated balance sheet data as of September 30, 2012 from our unaudited consolidated financial statements included elsewhere in this prospectus. Our unaudited consolidated financial statements have been prepared on the same basis as our audited consolidated financial statements and, in the opinion of management, reflect all adjustments, which consist only of normal recurring adjustments, necessary for the fair statement of those unaudited consolidated financial statements. Our historical results are not necessarily indicative of the results to be expected in the future, and the results for the nine months ended September 30, 2012 are not necessarily indicative of operating results to be expected for the full year ending December 31, 2012 or any other period.
| Years Ended December 31, | Nine Months Ended September 30, |
|||||||||||||||||||
| 2009 | 2010 | 2011 | 2011 | 2012 | ||||||||||||||||
| (in thousands, except per share data) | ||||||||||||||||||||
| Consolidated Statements of Operations Data: |
||||||||||||||||||||
| Revenues |
$ | 7,527 | $ | 19,005 | $ | 36,121 | $ | 24,711 | $ | 42,507 | ||||||||||
| Cost of revenues(1) |
5,101 | 11,040 | 18,691 | 13,523 | 17,728 | |||||||||||||||
|
|
|
|
|
|
|
|
|
|
|
|||||||||||
| Gross profit |
2,426 | 7,965 | 17,430 | 11,188 | 24,779 | |||||||||||||||
|
|
|
|
|
|
|
|
|
|
|
|||||||||||
| Operating expenses: |
||||||||||||||||||||
| Sales and marketing(1) |
6,146 | 8,884 | 20,357 | 14,474 | 23,615 | |||||||||||||||
| Research and development(1) |
3,410 | 4,568 | 7,071 | 5,027 | 9,651 | |||||||||||||||
| General and administrative(1) |
2,171 | 5,195 | 6,679 | 4,132 | 10,001 | |||||||||||||||
|
|
|
|
|
|
|
|
|
|
|
|||||||||||
| Total operating expenses |
11,727 | 18,647 | 34,107 | 23,633 | 43,267 | |||||||||||||||
|
|
|
|
|
|
|
|
|
|
|
|||||||||||
| Loss from operations |
(9,301 | ) | (10,682 | ) | (16,677 | ) | (12,445 | ) | (18,488 | ) | ||||||||||
| Interest expense, net |
(212 | ) | (230 | ) | (378 | ) | (276 | ) | (349 | ) | ||||||||||
| Other income (expenses), net |
(92 | ) | 78 | (229 | ) | (143 | ) | (222 | ) | |||||||||||
|
|
|
|
|
|
|
|
|
|
|
|||||||||||
| Loss before provision for income taxes |
(9,605 | ) | (10,834 | ) | (17,284 | ) | (12,864 | ) | (19,059 | ) | ||||||||||
| Provision for income taxes |
(103 | ) | (23 | ) | (139 | ) | (96 | ) | (167 | ) | ||||||||||
|
|
|
|
|
|
|
|
|
|
|
|||||||||||
| Net loss |
$ | (9,708 | ) | $ | (10,857 | ) | $ | (17,423 | ) | $ | (12,960 | ) | $ | (19,226 | ) | |||||
| Redemption of preferred stock in connection with the Series D financing and deemed dividend |
— | (1,033 | ) | — | — | — | ||||||||||||||
|
|
|
|
|
|
|
|
|
|
|
|||||||||||
| Net loss available to common stockholders |
$ | (9,708 | ) | $ | (11,890 | ) | $ | (17,423 | ) | $ | (12,960 | ) | $ | (19,226 | ) | |||||
|
|
|
|
|
|
|
|
|
|
|
|||||||||||
| Net loss per share available to common stockholders (basic and diluted)(2) |
$ | (2.74 | ) | $ | (3.27 | ) | $ | (4.29 | ) | $ | (3.26 | ) | $ | (4.46 | ) | |||||
|
|
|
|
|
|
|
|
|
|
|
|||||||||||
| Weighted average shares used to compute net loss per share attributable to common stockholders, basic and diluted(2) |
3,540 | 3,639 | 4,058 | 3,978 | 4,312 | |||||||||||||||
|
|
|
|
|
|
|
|
|
|
|
|||||||||||
| Pro forma net loss per share available to common stockholders, basic and diluted(2) |
$ | (0.96 | ) | $ | (0.84 | ) | ||||||||||||||
|
|
|
|
|
|||||||||||||||||
| Weighted average pro forma shares used to compute pro forma net loss per share attributable to common stockholders, basic and diluted(2) |
18,108 | 22,809 | ||||||||||||||||||
|
|
|
|
|
|||||||||||||||||
| Other Financial Data: |
||||||||||||||||||||
| Adjusted EBITDA(3) |
$ | (9,100 | ) | $ | (8,715 | ) | $ | (15,208 | ) | $ | (11,408 | ) | $ | (13,367 | ) | |||||
(footnotes on next page)
8
Table of Contents
| (1) | Stock-based compensation included in the consolidated statements of operations data above was allocated as follows: |
| Years Ended December 31, | Nine Months Ended September 30, |
|||||||||||||||||||
| 2009 | 2010 | 2011 | 2011 | 2012 | ||||||||||||||||
| (in thousands) | ||||||||||||||||||||
| Cost of revenues |
$ | 66 | $ | 90 | $ | 165 | $ | 119 | $ | 292 | ||||||||||
| Sales and marketing |
81 | 66 | 226 | 162 | 817 | |||||||||||||||
| Research and development |
26 | 58 | 163 | 120 | 648 | |||||||||||||||
| General and administrative |
19 | 1,172 | 143 | 82 | 2,490 | |||||||||||||||
|
|
|
|
|
|
|
|
|
|
|
|||||||||||
| $ | 192 | $ | 1,386 | $ | 697 | $ | 483 | $ | 4,247 | |||||||||||
|
|
|
|
|
|
|
|
|
|
|
|||||||||||
| (2) | See Note 12 of consolidated financial statements included elsewhere in this prospectus for an explanation of the calculations of basic and diluted net loss per share available to common stockholders and pro forma net loss per share available to common stockholders. |
| (3) | We define Adjusted EBITDA as net loss, adjusted for stock-based compensation expense, depreciation and amortization, capitalized internal-use software development costs, interest expense, net, provision for income taxes and other income (expenses), net. Adjusted EBITDA is a financial measure that is not calculated in accordance with U.S. generally accepted accounting principles (GAAP). |
| As of September 30, 2012 | ||||||||||||
| Actual | Pro Forma(1) |
Pro Forma As Adjusted(2) |
||||||||||
| (in thousands) | ||||||||||||
| Consolidated Balance Sheet Data: |
||||||||||||
| Cash and cash equivalents |
$ | 16,990 | $ | 36,890 | $ | |||||||
| Property and equipment, net |
8,479 | 8,479 | ||||||||||
| Total assets |
40,300 | 60,200 | ||||||||||
| Debt, current and long-term |
10,185 | 10,185 | ||||||||||
| Convertible preferred stock, net of issuance costs |
85,808 | — | ||||||||||
| Total stockholders’ (deficit) equity |
(66,760 | ) | 39,272 | |||||||||
| (1) | The pro forma consolidated balance sheet data as of September 30, 2012 reflects (i) the issuance of 1,478,064 shares of Series F-1 preferred stock and receipt of the related net proceeds of $19.9 million, (ii) the automatic conversion of all our outstanding convertible preferred stock into common stock upon the completion of this offering and (iii) the conversion of all outstanding convertible preferred stock warrants into common stock warrants. |
| (2) | The pro forma as adjusted column in the summary consolidated balance sheet data above reflects the effect of our sale of shares of common stock in this offering at an assumed initial public offering price of $ per share, the midpoint of the price range set forth on the front cover of this prospectus, after deducting estimated underwriting discounts and commissions and estimated offering expenses payable by us. The pro forma as adjusted information discussed above is illustrative only and will be adjusted based on the actual public offering price and other terms of this offering determined at pricing. |
Adjusted EBITDA
Adjusted EBITDA should not be considered as an alternative to net loss, operating loss or any other measure of financial performance calculated and presented in accordance with GAAP. We prepare Adjusted EBITDA to eliminate the impact of items that we do not consider indicative of our core operating performance. You are encouraged to evaluate these adjustments and the reason we consider them appropriate.
We believe Adjusted EBITDA is useful to investors in evaluating our operating performance for the following reasons:
| Ÿ | Adjusted EBITDA is widely used by investors and securities analysts to measure a company’s operating performance without regard to items, such as stock-based compensation expense, |
9
Table of Contents
| depreciation and amortization, capitalized internal-use software development costs, interest expense, net, provision for income taxes and other income or expense, net, that can vary substantially from company to company depending upon their financing, capital structures and the method by which assets were acquired; |
| Ÿ | Our management uses Adjusted EBITDA in conjunction with GAAP financial measures for planning purposes, including the preparation of our annual operating budget, as a measure of operating performance and the effectiveness of our business strategies and in communications with our board of directors concerning our financial performance; and |
| Ÿ | Adjusted EBITDA provides consistency and comparability with our past financial performance, facilitates period-to-period comparisons of operations and also facilitates comparisons with other peer companies, many of which use similar non-GAAP financial measures to supplement their GAAP results. |
We understand that, although Adjusted EBITDA is frequently used by investors and securities analysts in their evaluations of companies, Adjusted EBITDA has limitations as an analytical tool, and you should not consider it in isolation or as a substitute for analysis of our results of operations as reported under GAAP. These limitations include:
| Ÿ | Depreciation and amortization are non-cash charges, and the assets being depreciated or amortized will often have to be replaced in the future; Adjusted EBITDA does not reflect any cash requirements for these replacements; |
| Ÿ | Adjusted EBITDA does not reflect changes in, or cash requirements for, our working capital needs or contractual commitments; |
| Ÿ | Adjusted EBITDA does not reflect cash requirements for income taxes and the cash impact of other income or expense; and |
| Ÿ | Other companies may calculate Adjusted EBITDA differently than we do, limiting its usefulness as a comparative measure. |
The following table presents a reconciliation of net loss, the most comparable GAAP measure, to Adjusted EBITDA for each of the periods indicated:
| Years Ended December 31, | Nine Months Ended September 30, |
|||||||||||||||||||
| 2009 | 2010 | 2011 | 2011 | 2012 | ||||||||||||||||
| (in thousands) | ||||||||||||||||||||
| Net loss |
$ | (9,708 | ) | $ | (10,857 | ) | $ | (17,423 | ) | $ | (12,960 | ) | $ | (19,226 | ) | |||||
| Depreciation and amortization |
382 | 1,016 | 1,800 | 1,268 | 2,148 | |||||||||||||||
| Interest expense, net |
212 | 230 | 378 | 276 | 349 | |||||||||||||||
| Provision for income taxes |
103 | 23 | 139 | 96 | 167 | |||||||||||||||
|
|
|
|
|
|
|
|
|
|
|
|||||||||||
| EBITDA |
(9,011 | ) | (9,588 | ) | (15,106 | ) | (11,320 | ) | (16,562 | ) | ||||||||||
| Other (income) expenses, net |
92 | (78 | ) | 229 | 143 | 222 | ||||||||||||||
| Capitalized internal-use software development costs |
(373 | ) | (435 | ) | (1,028 | ) | (714 | ) | (1,274 | ) | ||||||||||
| Stock-based compensation |
192 | 1,386 | 697 | 483 | 4,247 | |||||||||||||||
|
|
|
|
|
|
|
|
|
|
|
|||||||||||
| Adjusted EBITDA |
$ | (9,100 | ) | $ | (8,715 | ) | $ | (15,208 | ) | $ | (11,408 | ) | $ | (13,367 | ) | |||||
|
|
|
|
|
|
|
|
|
|
|
|||||||||||
10
Table of Contents
Investing in our common stock involves a high degree of risk. You should consider carefully the risks and uncertainties described below, together with all of the other information in this prospectus, including the consolidated financial statements and the related notes included elsewhere in this prospectus, before deciding whether to invest in shares of our common stock. The risks and uncertainties described below are not the only ones we face. Additional risks and uncertainties that we are unaware of may also become important factors that adversely affect our business. If any of the following risks actually occur, our business, financial condition, results of operations and future prospects could be materially and adversely affected. In that event, the market price of our stock could decline, and you could lose part or all of your investment.
Risks Related to Our Business
We have a history of losses and we may not achieve or sustain profitability in the future.
We have incurred significant losses in each fiscal year since our incorporation in 2006. We experienced net losses of $17.4 million during 2011 and $19.2 million during the nine months ended September 30, 2012. As of September 30, 2012, we had an accumulated deficit of $70.1 million. The losses and accumulated deficit were due to the substantial investments we made to grow our business and acquire customers. We anticipate that our cost of revenues and operating expenses will increase substantially in the foreseeable future as we continue to invest to grow our business and acquire customers and develop our platform and new functionality. These efforts may prove more expensive than we currently anticipate, and we may not succeed in increasing our revenues sufficiently to offset these higher expenses. Many of our efforts to generate revenues from our business are new and unproven, and any failure to increase our revenues or generate revenues from new solutions could prevent us from attaining or increasing profitability. Furthermore, to the extent we are successful in increasing our customer base, we could also incur increased losses because costs associated with entering into customer contracts are generally incurred up front, while customers are billed over the term of the contract generally through our usage-based pricing model. We do not expect to be profitable in the foreseeable future and we cannot be certain that we will be able to attain profitability on a quarterly or annual basis, or if we do, that we will sustain profitability.
Our limited operating history makes it difficult to evaluate our current business and future prospects.
Although we began our operations in March 2006, we did not begin generating substantial revenues until 2009. Our limited operating history may make it difficult to evaluate our current business and our future prospects. We have encountered and will continue to encounter risks and difficulties frequently experienced by growing companies in rapidly developing and changing industries, including challenges in forecasting accuracy, determining appropriate investments of our limited resources, market acceptance of our existing and future solutions, competition from established companies with greater financial and technical resources, acquiring and retaining customers, managing customer deployments and developing new solutions. Our current operations infrastructure may require changes in order for us to achieve profitability and scale our operations efficiently. For example, we may need to automate portions of our solution to decrease our costs, ensure our marketing infrastructure is designed to drive highly qualified leads cost effectively and implement changes in our sales model to improve the predictability of our sales and reduce our sales cycle. If we fail to implement these changes on a timely basis or are unable to implement them due to factors beyond our control, our business may suffer. We cannot assure you that we will be successful in addressing these and other challenges we may face in the future.
11
Table of Contents
Our usage-based pricing model makes it difficult to evaluate our current business and future prospects.
We have a usage-based pricing model where most of our fees are calculated as a percentage of customers’ advertising spend managed on our platform. This pricing model makes it difficult to accurately forecast revenues because our customers’ advertising spend managed by our platform may vary from month to month based on the variety of industries in which our advertisers operate, the seasonality of those industries and fluctuations in our customers’ advertising budgets or other factors. Our contracts with our direct advertiser customers generally contain a minimum monthly fee, which is generally one-half of our estimated monthly revenues from the customer at the time the contract is signed, and, as a result, the monthly minimum may not be a good indicator of our revenues from that customer. In addition, advertisers that use our platform through our agency customers typically do not have a minimum monthly spend amount or a minimum term during which they must use our platform and, as a result, the ability to forecast revenues from these advertisers is difficult. Additionally, if we overestimate usage, we may incur additional expenses in adding infrastructure, without a commensurate increase in revenues, which would harm our gross margins and other operating results.
The market for digital advertising management solutions is relatively new and dependent on growth in various digital advertising channels. If this market develops more slowly or differently than we expect, our business, growth prospects and financial condition would be adversely affected.
The market for digital advertising management solutions such as ours is relatively new and these solutions may not achieve or sustain high levels of demand and market acceptance. While search and display advertising has been used successfully for several years, marketing via new digital advertising channels such as mobile and social media is not as well established. The future growth of our business could be constrained by both the level of acceptance and expansion of emerging digital advertising channels, as well as the continued use and growth of existing channels, such as search and display advertising. Even if these channels become widely adopted, advertisers and agencies may not make significant investments in solutions such as ours that help them manage their digital advertising spend across publisher platforms and advertising channels. It is difficult to predict customer adoption rates, customer demand for our platform, the future growth rate and size of the digital advertising management solutions market or the entry of competitive solutions. Any expansion of the market for digital advertising management solutions depends on a number of factors, including the growth of the digital advertising market, the growth of social and mobile as advertising channels and the cost, performance and perceived value associated with digital advertising management solutions. If digital advertising management solutions do not achieve widespread adoption, or there is a reduction in demand for digital advertising caused by weakening economic conditions, decreases in corporate spending or otherwise, it could result in reduced usage, which could decrease revenues or otherwise adversely affect our business.
If we are unable to maintain our relationships with, and access to, publishers, our business will suffer.
We currently depend on relationships with various publishers, including Baidu, Bing, Facebook, Google, Yahoo! and Yahoo! Japan. Our subscription services interface with these publishers’ platforms through application programming interfaces (API), such as the Google AdWords API. We are subject to the publishers’ standard API terms and conditions, which govern the use and distribution of data from these publishers’ platforms. Our business significantly depends on having access to these APIs, particularly the Google AdWords API, which the substantial majority of our customers use, on commercially reasonable terms and our business would be harmed if any of these publishers discontinue or limit access to their platforms, modify their terms of use or other policies or place additional restrictions on us as API users, or charge API license fees for API access. Moreover, some
12
Table of Contents
of these publishers, such as Google, market competitive solutions for their platforms. Because the publishers control their APIs, they may develop competitive offerings that are not subject to the limits imposed on us through the API terms and conditions. Currently, restrictions in these API agreements limit our ability to implement certain functionality, require us to implement functionality in a particular manner or require us to implement certain required minimum functionality, causing us to devote development resources to implement certain functionality that we would not otherwise include in our subscription services and to incur costs for personnel to provide services to implement functionality that we are prohibited from automating. Publishers update their API terms of use from time to time and new versions of these terms could impose additional restrictions on us. In addition, publishers continually update their APIs, which requires us to modify our software to accommodate these changes. Any of these outcomes could cause demand for our products to decrease, our research and development costs to increase, and our results of operations and financial condition to be harmed.
Our growth depends in part on the success of our relationships with advertising agencies.
Our future growth will depend, in part, on our ability to enter into successful relationships with advertising agencies. Identifying agencies and negotiating and documenting relationships with them requires significant time and resources. These relationships may not result in additional customers or enable us to generate significant revenues. Our contracts for these relationships are typically non-exclusive and do not prohibit the agency from working with our competitors or from offering competing services. We generally bill agencies for their customers’ use of our platform, but the agency’s customer has no direct contractual commitment to make payment to us. Furthermore, some of these agency contracts include provisions whereby the agency is not liable for making payment to us for our subscription services if the agency does not receive a corresponding payment from its client on whose behalf the subscription services were rendered. These provisions may result in longer collections periods or our inability to collect payment for some of our subscription services. If we are unsuccessful in establishing or maintaining our relationships with these agencies on commercially reasonable terms, or if these relationships are not profitable for us, our ability to compete in the marketplace or to grow our revenues could be impaired and our operating results would suffer.
We may not be able to compete successfully against current and future competitors.
The overall market for digital advertising management solutions is rapidly evolving, highly competitive, complex, fragmented, and subject to changing technology and shifting customer needs. We face significant competition in this market and we expect competition to intensify in the future. We currently compete with large, well-established companies, such as Adobe Systems Incorporated and Google Inc. (through its wholly-owned subsidiary DoubleClick), and privately-held companies, such as Acquisio Inc., which focuses solely on agencies, and Kenshoo Ltd. We also compete with in-house proprietary tools and custom solutions, including spreadsheets. Increased competition may result in reduced pricing for our solutions, longer sales cycles or a decrease of our market share, any of which could negatively affect our revenues and future operating results and our ability to grow our business.
A number of competitive factors could cause us to lose potential sales or to sell our solutions at lower prices or at reduced margins, including, among others:
| Ÿ | potential customers may choose to develop or continue to use internal solutions rather than paying for our solutions; |
| Ÿ | companies may enter our market by expanding their platforms or acquiring a competitor; |
| Ÿ | some of our competitors, such as Adobe and Google, have greater financial, marketing and technical resources than we do, allowing them to leverage a larger installed customer base, |
13
Table of Contents
| adopt more aggressive pricing policies, and devote greater resources to the development, promotion and sale of their products and services than we can; and |
| Ÿ | companies marketing search, social, display, mobile or web analytics services could bundle digital advertising management solutions or offer such products at a lower price as part of a larger product sale. |
We cannot assure you that we will be able to compete successfully against current and future competitors. If we cannot compete successfully, our business, results of operations and financial condition could be negatively impacted.
Our business depends on our customers’ continued willingness to manage advertising spend on our platform.
In order for us to improve our operating results, it is important that our customers continue to manage their advertising spend on our platform, increase their usage and also purchase additional solutions from us. In the case of our direct advertiser customers, we offer our solutions primarily through subscription contracts and generally bill customers over the related subscription period, which is typically in the range of six months to one year. During the term of their contracts, our direct advertiser customers generally have no obligation to maintain or increase their advertising spend on our platform beyond a specified minimum monthly fee, which is typically set at the time the contract is signed and is half of the monthly amount we anticipate the customer will spend. Our direct advertiser customers have no renewal obligation after the initial or then-current renewal subscription period expires, and even if customers renew contracts, they may decrease the level of their digital advertising spend managed through our platform, resulting in lower revenues from that customer. Advertisers that we serve through our arrangements with our advertising agencies generally do not have any contractual commitment to use our platform. Our customers’ usage may decline or fluctuate as a result of a number of factors, including, but not limited to, their satisfaction with our platform and our customer support, the frequency and severity of outages, the pricing of our, or competing, solutions, the effects of global economic conditions, and reductions in spending levels or changes in our customers’ strategies regarding digital advertising. Due to our limited historical experience, we may not be able to accurately predict future usage trends. If our customers renew on less favorable terms or reduce their advertising spend on our platform, our revenues may grow more slowly than expected or decline.
We incur upfront costs associated with onboarding advertisers to our platform and may not recoup our investment if we do not maintain the advertiser relationship over time.
Our operating results may be negatively affected if we are unable to recoup our upfront costs for onboarding new advertisers to our platform. Upfront costs when adding new advertisers generally include sales commissions for our sales force, expenses associated with entering customer data into our platform and other implementation-related costs. Because our customers, including direct advertisers and agencies, are billed over the term of the contract, if new customers sign contracts with short initial subscription periods and do not renew their subscriptions, or otherwise do not continue to use our platform to a level that generates revenues in excess of our upfront expenses, our operating results could be negatively impacted. In cases in which the implementation process is particularly complex, the revenues resulting from the customer under our typical six-month or one-year contract may not cover the upfront investment, so if a significant number of these customers do not renew their contracts, it could negatively affect our operating results.
14
Table of Contents
Because we generally bill our customers over the term of the contract, near term decline in new or renewed subscriptions may not be reflected immediately in our operating results.
Most of our revenues in each quarter are derived from contracts entered into with our customers during previous quarters. Consequently, a decline in new or renewed subscriptions in any one quarter may not be fully reflected in our revenues for that quarter. Such declines, however, would negatively affect our revenues in future periods and the effect of significant downturns in sales and market acceptance of our solutions, and potential changes in our rate of renewals or renewal terms, may not be fully reflected in our results of operations until future periods. In addition, we may be unable to adjust our cost structure rapidly, or at all, to take account of reduced revenues. Our subscription model also makes it difficult for us to rapidly increase our total revenues through additional sales in any period, as revenues from new customers must be earned over the applicable subscription term based on the value of their monthly advertising spend.
We have been dependent on our customers’ use of search advertising. Any decrease in the use of search advertising or our inability to further penetrate mobile, social and display advertising channels would harm our business, growth prospects, operating results and financial condition.
Historically, our customers have primarily used our solutions for managing their search advertising, including mobile search advertising, and the substantial majority of our revenues are derived from advertisers that use our platform to manage their search advertising. We expect that search advertising will continue to be the primary channel used by our customers for the foreseeable future. Should our customers lose confidence in the value or effectiveness of search advertising, the demand for our solutions may decline. In addition, our failure to achieve market acceptance of our solution for the management of mobile, social and display advertising spend would harm our growth prospects, operating results and financial condition.
Our sales cycle can be long and unpredictable and require considerable time and expense, which may cause our operating results to fluctuate.
The sales cycle for our solutions, from initial contact with a potential lead to contract execution and implementation, varies widely by customer, but is typically one to nine months. Some of our customers undertake a significant evaluation process that frequently involves not only our solutions but also those of our competitors, which has in the past resulted in extended sales cycles. Our sales efforts involve educating our customers about the use, technical capabilities and benefits of our platform. In addition, we offer an initial term, typically of a few months in duration, to new customers who may terminate their subscription at any time during this initial period before the fixed term contract commences. We have no assurance that the substantial time and money spent on our sales efforts will produce any sales. If our sales efforts result in a new customer subscription, the customer may terminate its subscription during the initial period, after we have incurred the expenses associated with entering the customer’s data in our platform and related training and support. If sales expected from a customer are not realized in the time period expected or not realized at all, or if a customer terminates during the initial period, our business, operating results and financial condition could be adversely affected.
Material defects or errors in our software platform could harm our reputation, result in significant costs to us and impair our ability to sell our subscription services.
Our customers collectively managed $ in annualized advertising spend on our platform in December 2012. The software applications underlying our subscription services are inherently complex and may contain material defects or errors, which may cause disruptions in availability, misallocation of advertising spend or other performance problems. Any such errors, defects, disruptions in service or other performance problems with our software platform could negatively impact our customers’ businesses or the success of their advertising campaigns and cause harm to our reputation. If we have
15
Table of Contents
any errors, defects, disruptions in service or other performance problems with our software platform, customers could elect not to renew or reduce their usage or delay or withhold payment to us, which could result in an increase in our provision for doubtful accounts or an increase in the length of collection cycles for accounts receivable. Errors, defects, disruptions in service or other performance problems could also result in customers making warranty or other claims against us, our giving credits to our customers toward future advertising spend or costly litigation. As a result, material defects or errors in our platform could have a material adverse impact on our business and financial performance.
The costs incurred in correcting any material defects or errors in our software platform may be substantial and could adversely affect our operating results. After the release of new versions of our software, defects or errors may be identified from time to time by our internal team and by our customers. We implement bug fixes and upgrades as part of our regularly scheduled system maintenance. If we do not complete this maintenance according to schedule or if customers are otherwise dissatisfied with the frequency and/or duration of our maintenance services, customers could elect not to renew, or delay or withhold payment to us, or cause us to issue credits, make refunds or pay penalties.
We derive our revenues from a single software platform and any factor adversely affecting subscriptions to our platform could harm our business and operating results.
We derive our revenues from sales of a single software platform. As such, any factor adversely affecting subscriptions to our platform, including product release cycles, market acceptance, product competition, performance and reliability, reputation, price competition, and economic and market conditions, could harm our business and operating results.
We use a single third-party data center to deliver our services. Any disruption of service at this facility could harm our business.
We manage our services and serve substantially all of our customers from a single third-party data center facility. While we control the actual computer, network and storage systems upon which our platform runs, and deploy them to the data center facility, we do not control the operation of the facility. The owner of the facility has no obligation to renew the agreement with us on commercially reasonable terms, or at all. If we are unable to renew the agreement on commercially reasonable terms, we may be required to transfer to a new facility or facilities, and we may incur significant costs and possible service interruption in connection with doing so.
The facility is vulnerable to damage or service interruption resulting from human error, intentional bad acts, earthquakes, hurricanes, floods, fires, war, terrorist attacks, power losses, hardware failures, systems failures, telecommunications failures and similar events. Moreover, we have not implemented a disaster recovery capability whereby we maintain a back-up copy of our software platform permitting us to immediately switch over to the back-up software platform in the event of damage or service interruption at our data center. The occurrence of a natural disaster or an act of terrorism, any outages or vandalism or other misconduct, or a decision to close the facility without adequate notice or other unanticipated problems could result in lengthy interruptions in our services.
Any changes in service levels at the facility or any errors, defects, disruptions or other performance problems at or related to the facility that affect our services could harm our reputation and may damage our customers’ businesses. Interruptions in our services might reduce our revenues, subject us to potential liability, or result in reduced usage of our platform. In addition, some of our customer contracts require us to issue credits for downtime in excess of certain levels and in some instances give our customers the ability to terminate their subscriptions.
16
Table of Contents
We also depend on third-party Internet-hosting providers and continuous and uninterrupted access to the Internet through third-party bandwidth providers to operate our business. If we lose the services of one or more of our Internet-hosting or bandwidth providers for any reason or if their services are disrupted, for example due to viruses or “denial-of-service” or other attacks on their systems, or due to human error, intentional bad acts, power loss, hardware failures, telecommunications failures, fires, wars, terrorist attacks, floods, earthquakes, hurricanes, tornadoes or similar events, we could experience disruption in our ability to offer our solutions or we could be required to retain the services of replacement providers, which could increase our operating costs and harm our business and reputation.
If we cannot efficiently implement our solutions for customers, we may lose customers.
Our customers have a variety of different data formats, enterprise applications and infrastructure and our platform must support our customers’ data formats and integrate with complex enterprise applications and infrastructures. If our platform does not currently support a customer’s required data format or appropriately integrate with a customer’s applications and infrastructure, then we must configure our platform to do so, which increases our expenses. Additionally, we do not control our customers’ implementation schedules. As a result, as we have experienced in the past, if our customers do not allocate internal resources necessary to meet their implementation responsibilities or if we face unanticipated implementation difficulties, the implementation may be delayed. Further, in the past, our implementation capacity has at times constrained our ability to successfully implement our solutions for our customers in a timely manner, particularly during periods of high demand. If the customer implementation process is not executed successfully or if execution is delayed, we could incur significant costs, customers could become dissatisfied and decide not to increase usage of our platform, not to use our platform beyond an initial period prior to their term commitment or, in some cases, revenue recognition could be delayed. In addition, competitors with more efficient operating models with lower implementation costs could penetrate our customer relationships.
Additionally, large customers may request or require specific features or functions unique to their particular business processes, which increase our upfront investment in sales and deployment efforts and the revenues resulting from the customers under our typical contract length may not cover the upfront investments. If prospective large customers require specific features or functions that we do not offer, then the market for our solution will be more limited and our business could suffer. In addition, supporting large customers could require us to devote significant development services and support personnel and strain our personnel resources and infrastructure. If we are unable to address the needs of these customers in a timely fashion or further develop and enhance our solution, these customers may not renew their subscriptions, seek to terminate their relationship with us, renew on less favorable terms, or reduce their advertising spend on our platform. If any of these were to occur, our revenues may decline and our operating results could be adversely affected.
If we are unable to maintain or expand our sales and marketing capabilities, we may not be able to generate anticipated revenues.
Increasing our customer base and achieving broader market acceptance of our software platform will depend to a significant extent on our ability to expand our sales and marketing operations and activities. We expect to be substantially dependent on our sales force to obtain new customers. We currently plan to expand our sales team in order to increase revenues from new and existing customers and to further penetrate our existing markets and expand into new markets. Our solutions require a sophisticated sales force with specific sales skills and technical knowledge. Competition for qualified sales personnel is intense, and we may not be able to retain our existing sales personnel or attract, integrate or retain sufficient highly qualified sales personnel.
17
Table of Contents
Our ability to achieve revenue growth in the future will depend, in large part, on our success in recruiting, training and retaining sufficient numbers of sales personnel. These new employees require significant training and experience before they achieve full productivity. For internal planning purposes, we assume that it will take approximately three months before a newly hired sales representative is fully trained and productive in selling our solutions. This amount of time may be longer for sales personnel focused on new geographies or specific market segments. As a result, the cost of hiring and carrying new representatives cannot be offset by the revenues they produce for a significant period of time. Our recent hires and planned hires may not become productive as quickly as we would like, and we may not be able to hire or retain sufficient numbers of qualified individuals in the markets where we do business. Our business will be seriously harmed if these expansion efforts do not work as planned or generate a corresponding significant increase in revenues.
Any failure to offer high-quality technical support services may adversely affect our relationships with our customers and harm our financial results.
Our customers depend on our support organization to resolve any technical issues relating to our solutions. In addition, our sales process is highly dependent on the quality of our solutions, our business reputation and on strong recommendations from our existing customers. Any failure to maintain high-quality technical support, or a market perception that we do not maintain high-quality support, could harm our reputation, adversely affect our ability to sell our solutions to existing and prospective customers, and harm our business, operating results and financial condition.
We offer technical support services with our solutions and may be unable to respond quickly enough to accommodate short-term increases in customer demand for support services. We also may be unable to modify the format of our support services to compete with changes in support services provided by competitors. It is difficult to predict customer demand for technical support services and if customer demand increases significantly, we may be unable to provide satisfactory support services to our customers. Additionally, increased customer demand for these services, without corresponding revenues, could increase costs and adversely affect our operating results.
If our security measures are breached or unauthorized access to customer data or our data is otherwise obtained, our solutions may be perceived as not being secure, customers may reduce the use of or stop using our solutions and we may incur significant liabilities.
Security breaches could result in the loss of information, litigation, indemnity obligations and other liability. While we have security measures in place, our systems and networks are subject to ongoing threats and therefore these security measures may be breached as a result of third-party action, including cyber-attacks or other intentional misconduct by computer hackers, employee error, malfeasance or otherwise. This could result in one or more third parties obtaining unauthorized access to our customers’ data or our data, including intellectual property and other confidential business information. Because techniques used to obtain unauthorized access or to sabotage systems change frequently and generally are not recognized until launched against a target, we may be unable to anticipate these techniques or to implement adequate preventative measures. Third parties may also attempt to fraudulently induce employees or customers into disclosing sensitive information such as user names, passwords or other information in order to gain access to our customers’ data or our data, including intellectual property and other confidential business information. If an actual or perceived breach of our security occurs, the market perception of the effectiveness of our security measures could be harmed, we could lose potential sales and existing customers or we could incur other liability.
18
Table of Contents
We must develop and introduce enhancements and new features that achieve market acceptance or that keep pace with technological developments to remain competitive in our evolving industry.
We operate in a dynamic market characterized by rapidly changing technologies and industry and legal standards. The introduction of new Revenue Acquisition Management solutions by our competitors, the market acceptance of solutions based on new or alternative technologies, or the emergence of new industry standards could render our platform obsolete. Our ability to compete successfully, attract new customers and increase revenues from existing customers depends in large part on our ability to enhance and improve our existing Revenue Acquisition Management platform and to continually introduce or acquire new features that are in demand by the market we serve. We also must update our software to reflect changes in publishers’ APIs and terms of use. The success of any enhancement or new solution depends on several factors, including timely completion, adequate quality testing, appropriate introduction and market acceptance. Any new platform or feature that we develop or acquire may not be introduced in a timely or cost-effective manner, may contain defects or may not achieve the broad market acceptance necessary to generate significant revenues. If we are unable to anticipate or timely and successfully develop or acquire new offerings or features or enhance our existing platform to meet customer requirements, our business and operating results will be adversely affected.
Our growth depends in part on the success of our strategic relationships with third parties.
Our future growth will depend on our ability to enter into successful strategic relationships with third parties. For example, we are seeking to establish relationships with third parties to develop integrations with complementary technology and content. These relationships may not result in additional customers or enable us to generate significant revenues. Identifying partners and negotiating and documenting relationships with them require significant time and resources. Our contracts for these relationships are typically non-exclusive and do not prohibit the other party from working with our competitors or from offering competing services. If we are unsuccessful in establishing or maintaining our relationships with these third parties, our ability to compete in the marketplace or to grow our revenues could be impaired and our operating results would suffer.
As a result of our customers’ increased usage of our software platform, we will need to continually improve our hosting infrastructure to avoid service interruptions or slower system performance.
We have experienced significant growth in the number of advertisers, transactions and data that our hosting infrastructure supports. We seek to maintain sufficient excess capacity in our infrastructure to meet the needs of all of our customers. We also seek to maintain excess capacity to facilitate the rapid provision of new customer deployments and the expansion of existing customer deployments. For example, if we secure a large customer or a group of customers which require significant amounts of bandwidth or storage, we may need to increase bandwidth, storage, power or other elements of our application architecture and our infrastructure, and our existing systems may not be able to scale in a manner satisfactory to our existing or prospective customers.
The amount of infrastructure needed to support our customers is based on our estimates of anticipated usage. If we were to experience unforeseen increases in usage, we could be required to increase our infrastructure investments resulting in increased costs or reduced gross margins, and if we do not accurately predict our infrastructure capacity requirements, our customers could experience service outages that may subject us to financial penalties and liabilities and result in customer losses. If our hosting infrastructure capacity fails to keep pace with increased sales, customers may experience service interruptions or slower system performance as we seek to obtain additional capacity, which could harm our reputation and adversely affect our revenue growth. As use of our software platform grows and as customers use it for more complicated tasks, we will need to devote additional resources
19
Table of Contents
to improving our application architecture and our infrastructure in order to maintain the performance of our software platform. We may need to incur additional costs to upgrade or expand our computer systems and architecture in order to accommodate increased demand if our systems cannot handle current or higher volumes of usage. In addition, increasing our systems and infrastructure in advance of new customers would cause us to have increased cost of revenues, which can adversely affect our gross margins until we increase revenues that are spread over the increased costs.
Any failure to protect our intellectual property rights could impair our ability to protect our proprietary technology and our brand.
Our success and ability to compete depend in part upon our intellectual property. We primarily rely on a combination of copyright, trade secret and trademark laws, as well as confidentiality procedures and contractual restrictions with our employees, customers, partners and others to establish and protect our intellectual property rights. However, the steps we take to protect our intellectual property rights may be inadequate or we may be unable to secure intellectual property protection for all of our solutions. In particular, we have one issued U.S. patent and have only recently begun to implement a strategy to expand patent protection for our technology.
If we are unable to protect our intellectual property, our competitors could use our intellectual property to market products and services similar to ours and our ability to compete effectively would be impaired. Moreover, others may independently develop technologies that are competitive to ours or infringe our intellectual property. The enforcement of our intellectual property rights depends on our legal actions against these infringers being successful, but we cannot be sure these actions will be successful, even when our rights have been infringed. In addition, defending our intellectual property rights might entail significant expense and diversion of management resources. Any of our intellectual property rights may be challenged by others or invalidated through administrative processes or litigation. Any patents issued in the future may not provide us with competitive advantages or may be successfully challenged by third parties.
Furthermore, legal standards relating to the validity, enforceability and scope of protection of intellectual property rights are uncertain. Effective protection of our intellectual property may not be available to us in every country in which our solutions are available. The laws of some foreign countries may not be as protective of intellectual property rights as those in the United States, and mechanisms for enforcement of intellectual property rights may be inadequate. Accordingly, despite our efforts, we may be unable to prevent third parties from infringing upon or misappropriating our intellectual property.
We might be required to spend significant resources to monitor and protect our intellectual property rights, and our efforts to enforce our intellectual property rights may be met with defenses, counterclaims and countersuits attacking the validity and enforceability of our intellectual property rights. Litigation to protect and enforce our intellectual property rights could be costly, time-consuming and distracting to management, whether or not it is resolved in our favor, and could ultimately result in the impairment or loss of portions of our intellectual property.
We could incur substantial costs as a result of any claim of infringement of another party’s intellectual property rights.
In recent years, there has been significant litigation in the United States involving patents and other intellectual property rights. Companies in the Internet and technology industries are increasingly bringing and becoming subject to suits alleging infringement of proprietary rights, particularly patent rights, and our competitors may hold patents or have pending patent applications, which could be related to our business. These risks have been amplified by the increase in third parties, which we refer to as non-practicing entities, whose sole primary business is to assert such claims. We have
20
Table of Contents
received in the past, and expect to receive in the future, notices that claim we or our customers using our solutions have misappropriated or misused other parties’ intellectual property rights. If we are sued by a third party that claims that our technology infringes its rights, the litigation could be expensive and could divert our management resources. We do not currently have an extensive patent portfolio of our own, which may limit the defenses available to us in any such litigation.
In addition, in most instances, we have agreed to indemnify our customers against certain claims that our subscription services infringe the intellectual property rights of third parties. Our business could be adversely affected by any significant disputes between us and our customers as to the applicability or scope of our indemnification obligations to them. The results of any intellectual property litigation to which we might become a party, or for which we are required to provide indemnification, may require us to do one or more of the following:
| Ÿ | cease offering or using technologies that incorporate the challenged intellectual property; |
| Ÿ | make substantial payments for legal fees, settlement payments or other costs or damages; |
| Ÿ | obtain a license, which may not be available on reasonable terms, to sell or use the relevant technology; or |
| Ÿ | redesign technology to avoid infringement. |
If we are required to make substantial payments or undertake any of the other actions noted above as a result of any intellectual property infringement claims against us or any obligation to indemnify our customers for such claims, such payments or costs could have a material adverse effect upon our business and financial results.
Our use of open source technology could impose limitations on our ability to commercialize our software platform.
We use open source software in our platform. Some open source software licenses require users who distribute open source software as part of their software to publicly disclose all or part of the source code to such software and/or make available any derivative works of the open source code on unfavorable terms or at no cost. The terms of various open source licenses have not been interpreted by the U.S. courts, and there is a risk that such licenses could be construed in a manner that imposes unanticipated conditions or restrictions on our ability to market our software platform. While we monitor our use of open source software and try to ensure that none is used in a manner that would require us to disclose our source code or that would otherwise breach the terms of an open source agreement, such use could inadvertently occur and we may be required to release our proprietary source code, pay damages for breach of contract, re-engineer our applications, discontinue sales in the event re-engineering cannot be accomplished on a timely basis or take other remedial action that may divert resources away from our development efforts, any of which could cause us to breach customer contracts, harm our reputation, result in customer losses or claims, increase our costs or otherwise adversely affect our business and operating results.
If the market for cloud-based software develops more slowly than we expect or declines, our business could be harmed.
The cloud computing market is not as mature as the market for on-premise software, and it is uncertain whether cloud computing will achieve and sustain high levels of customer demand and market acceptance. If other cloud computing providers experience security incidents, loss of customer data, disruptions in delivery or other problems, the market for cloud computing as a whole, including our solution, may be negatively affected. If cloud computing does not achieve widespread adoption, or there is a reduction in demand for cloud computing caused by a lack of customer acceptance,
21
Table of Contents
technological challenges, weakening economic conditions, security or privacy concerns, competing technologies and products, decreases in corporate spending or otherwise, it could result in decreased revenues or increased expenses from development of alternative on-premise solutions and our business could be adversely affected.
Because our long-term success depends, in part, on our ability to expand our sales to customers outside the United States, our business will be susceptible to risks associated with international operations.
We currently maintain offices and/or have sales personnel in Australia, England, France, Germany, Japan and Singapore, as well as the United States. As we continue to expand our customer base outside the United States, our business will be increasingly susceptible to risks associated with international operations. However, we have a limited operating history outside the United States, and our ability to manage our business and conduct our operations internationally requires considerable management attention and resources and is subject to particular challenges of supporting a rapidly growing business in an environment of diverse cultures, languages, customs, tax laws, legal systems, alternate dispute systems and regulatory systems. The risks and challenges associated with international expansion include:
| Ÿ | the need to support and integrate with local publishers and partners; |
| Ÿ | continued localization of our platform, including translation into foreign languages and associated expenses; |
| Ÿ | competition with companies that have greater experience in the local markets than we do or who have pre-existing relationships with potential customers in those markets; |
| Ÿ | compliance with multiple, potentially conflicting and changing governmental laws and regulations, including employment, tax, privacy and data protection laws and regulations; |
| Ÿ | compliance with anti-bribery laws, including compliance with the Foreign Corrupt Practices Act; |
| Ÿ | difficulties in invoicing and collecting in foreign currencies and associated foreign currency exposure; |
| Ÿ | difficulties in staffing and managing foreign operations and the increased travel, infrastructure and legal compliance costs associated with international operations; |
| Ÿ | different or lesser protection of our intellectual property rights; |
| Ÿ | difficulties in enforcing contracts and collecting accounts receivable, longer payment cycles and other collection difficulties; |
| Ÿ | restrictions on repatriation of earnings; and |
| Ÿ | regional economic and political conditions. |
We have limited experience marketing, selling and supporting our subscription services internationally, which increases the risk that any potential future expansion efforts that we may undertake will not be successful.
Fluctuations in the exchange rate of foreign currencies could result in currency transactions losses.
We currently have foreign sales denominated in Australian Dollars, British Pound Sterling, Chinese Yuan, Euros, Japanese Yen and Singapore Dollars. In addition, we incur a portion of our operating expenses in the currencies of the countries where we have offices. We face exposure to
22
Table of Contents
adverse movements in currency exchange rates, which may cause our revenues and operating results to differ materially from expectations. A decline in the U.S. dollar relative to foreign currencies would increase our non-U.S. revenues when translated into U.S. dollars. Conversely, if the U.S. dollar strengthens relative to foreign currencies, our revenues would be adversely affected. Our operating results could be negatively impacted depending on the amount of expense denominated in foreign currencies. As exchange rates vary, revenues, cost of revenues, operating expenses and other operating results, when translated, may differ materially from expectations. In addition, our revenues and operating results are subject to fluctuation if our mix of U.S. and foreign currency denominated transactions or expenses changes in the future because we do not currently hedge our foreign currency exposure. Even if we were to implement hedging strategies to mitigate foreign currency risk, these strategies might not eliminate our exposure to foreign exchange rate fluctuations and would involve costs and risks of their own, such as ongoing management time and expertise, external costs to implement the strategies and potential accounting implications.
If we fail to develop widespread brand awareness cost-effectively, our business may suffer.
We believe that developing and maintaining widespread awareness of our brand in a cost-effective manner is critical to achieving widespread acceptance of our solution and attracting new customers. We expect sales and marketing expenses to increase as a result of our marketing and brand promotion activities. We may not generate customer awareness or increase revenues enough to offset the increased expenses we incur in building our brand. If we fail to successfully promote and maintain our brand, or incur substantial marketing and sales expenses, which are not offset by increased revenues, we may fail to attract or retain customers necessary to realize a sufficient return on our brand-building efforts, or to achieve the widespread brand awareness that is critical for broad customer adoption of our solution.
Unfavorable conditions in the market for digital advertising or the global economy or reductions in digital advertising spend could limit our ability to grow our business and negatively affect our operating results.
Revenue growth and potential profitability of our business depends on digital advertising spend by advertisers in the markets we serve. Our operating results may vary based on changes in the market for digital advertising or the global economy. To the extent that weak economic conditions cause our customers and potential customers to freeze or reduce their advertising budgets, particularly digital advertising, demand for our solution may be negatively affected.
Historically, economic downturns have resulted in overall reductions in advertising spend. If economic conditions deteriorate or do not materially improve, our customers and potential customers may elect to decrease their advertising budgets or defer or reconsider software and service purchases, which would limit our ability to grow our business and negatively affect our operating results.
Our business and operations have experienced rapid growth in recent periods, which has placed, and may continue to place, significant demands on our management and infrastructure. If we fail to manage our growth effectively, we may be unable to execute our business plan, maintain high levels of service or address competitive challenges adequately.
We increased our number of full-time employees from 285 as of December 31, 2011 to 386 as of September 30, 2012. Our growth has placed, and may continue to place, a significant strain on our managerial, administrative, operational, financial and other resources. We intend to further expand our overall headcount and operations both domestically and internationally, with no assurance that our business or revenues will continue to grow. Creating a global organization and managing a geographically dispersed workforce will require substantial management effort, the allocation of
23
Table of Contents
valuable management resources and significant additional investment in our infrastructure. We will be required to continue to improve our operational, financial and management controls and our reporting procedures and we may not be able to do so effectively. Further, to accommodate our expected growth we must continually improve and maintain our technology, systems and network infrastructure. As such, we may be unable to manage our expenses effectively in the future, which may negatively impact our gross margins or operating expenses in any particular quarter. If we fail to manage our anticipated growth and change in a manner that does not preserve the key aspects of our corporate culture, the quality of our solutions may suffer, which could negatively affect our brand and reputation and harm our ability to retain and attract customers.
Our business depends on retaining and attracting qualified management and technical personnel.
Our success depends upon the continued service of our founders and senior management team and key technical employees, as well as our ability to continue to attract and retain additional highly qualified management and operating personnel. We do not maintain key person life insurance policies on any of our employees. Each of our founders, executive officers, key technical personnel and other employees could terminate his or her relationship with us at any time. Our business also requires skilled technical and sales personnel, who are in high demand and are often subject to competing offers. As we expand into additional geographic markets, we will require personnel with expertise in these new areas. Competition for qualified employees is intense in our industry and particularly in San Francisco, California, where most of our technical employees are based. The loss of our founders or any other member of our senior management team or, even a few qualified employees, or an inability to retain, attract, relocate and motivate additional highly skilled employees required for the planned expansion of our business, could delay or prevent the achievement of our business objectives and could materially harm our business and our customer relationships.
Domestic and foreign government regulation and enforcement of data practices and data tracking technologies is expansive, not clearly defined and rapidly evolving. Such regulation could directly restrict portions of our business or indirectly affect our business by constraining our customers’ use of our platform or limiting the growth of our markets.
Federal, state, municipal and/or foreign governments and agencies have adopted and could in the future adopt, modify, apply or enforce laws, policies, and regulations covering user privacy, data security, technologies such as cookies that are used to collect, store and/or process data, the taxation of products and services, unfair and deceptive practices, and/or the collection, use, processing, transfer, storage and/or disclosure of data associated with a unique individual. The categories of data regulated under these laws vary widely and are often ill-defined and subject to new applications or interpretation by regulators. Our subscription services enable our customers to collect, manage and store data regarding the measurement and valuation of their digital advertising and marketing campaigns, which may include data that is directly or indirectly obtained or derived through the activities of end users online and/or on mobile devices. The uncertainty and inconsistency among these laws, coupled with a lack of guidance as to how these laws will be applied to current and emerging Internet and mobile analytics technologies, creates a risk that regulators, lawmakers or other third parties, such as potential plaintiffs, may assert claims, pursue investigations or audits, or engage in civil or criminal enforcement. These actions could limit the market for our subscription services or impose burdensome requirements on our services and/or customers’ use of our services, thereby rendering our business unprofitable.
Some features of our subscription services use cookies, which trigger the data protection requirements of certain foreign jurisdictions, such as the EU Cookie Directive. In addition, although our subscription services do not involve the collection or use of personally identifiable information from end users, our services collect anonymous data about end users’ interactions with our advertiser clients
24
Table of Contents
that may be subject to regulation under current or future laws or regulations. If our privacy or data security measures fail to comply with these current or future laws and regulations in any of the jurisdictions in which we collect information, we may be subject to litigation, regulatory investigations, civil or criminal enforcement, audits or other liabilities in such jurisdictions, or our advertisers may terminate their relationships with us.
This area of the law is currently under intense government scrutiny and many governments, including the U.S. government, are considering a variety of proposed regulations that would restrict or impact the conditions under which data obtained from or through the activities of end users could be collected, processed or stored. In addition, regulators such as the Federal Trade Commission and the California Attorney General are continually proposing new regulations and interpreting and applying existing regulations in new ways. Changes to existing laws or new laws regulating the solicitation, collection or processing of personal and consumer information, truth-in-advertising and consumer protection could affect our customers’ utilization of digital advertising and marketing, potentially reducing demand for our subscription services, or impose restrictions that make it more difficult or expensive for us to provide our services.
If legislation dampens the growth in web and mobile usage or access to the Internet, our results of operations could be harmed.
Legislation enacted in the future could dampen the growth in web and mobile usage and decrease its acceptance as a medium of communications and commerce or result in increased adoption of new modes of communication and commerce that may not be serviced by our products. In addition, government agencies or private organizations may begin to impose taxes, fees or other charges for accessing the Internet, which could result in slower growth or a decrease in ecommerce, use of social media and/or use of mobile devices. Any of these outcomes could cause demand for our platform to decrease, our costs to increase, and our results of operations and financial condition to be harmed.
If our customers fail to abide by applicable privacy laws or to provide adequate notice and/or obtain consent from end users, we could be subject to litigation or enforcement action or reduced demand for our services. Industry self-regulatory standards may be implemented in the future that could affect demand for our platform and our ability to access data we use to provide our platform.
Our customers utilize our services to support and measure their direct interactions with end users and we must rely on our customers to implement and administer any notice or choice mechanisms required under applicable laws. If customers fail to abide by these laws, it could result in litigation or regulatory or enforcement action against our customers or against us directly.
In addition, self-regulatory organizations (such as the Network Advertising Initiative) to which our customers may belong may impose opt-in or opt-out requirements on our customers, which may in the future require our customers to provide various mechanisms for users to opt-in or opt-out of the collection of any data, including anonymous data, with respect to such users’ web or mobile activities. In addition, the online and/or mobile industries may adopt technical or industry standards, such as the proposed Do Not Track header, that allow users to opt-in or opt-out of data that is necessary to our business. If any of these events were to occur in the future, it could have a material effect on our ability to provide services and for our customers to collect the data that is necessary to use our services.
Our revenues may be adversely affected if we are required to charge sales taxes in additional jurisdictions or other taxes for our solutions.
We collect or have imposed upon us sales or other taxes related to the solutions we sell in certain states and other jurisdictions. Additional states, countries or other jurisdictions may seek to impose
25
Table of Contents
sales or other tax collection obligations on us in the future, or states or jurisdictions in which we already pay tax may increase the amount of taxes we are required to pay. A successful assertion by any state, country or other jurisdiction in which we do business that we should be collecting sales or other taxes on the sale of our products and services could, among other things, create significant administrative burdens for us, result in substantial tax liabilities for past sales, discourage clients from purchasing solutions from us or otherwise substantially harm our business and results of operations.
The forecasts of market growth included in this prospectus may prove to be inaccurate, and even if the markets in which we compete achieve the forecasted growth, we cannot assure you our business will grow at similar rates, if at all.
Growth forecasts are subject to significant uncertainty and are based on assumptions and estimates, which may not prove to be accurate. Forecasts relating to the expected growth in digital advertising and other markets, including the forecasts or projections referenced in this prospectus, may prove to be inaccurate. Even if these markets experience the forecasted growth, we may not grow our business at similar rates, or at all. Our growth is subject to many factors, including our success in implementing our business strategy, which is subject to many risks and uncertainties. Accordingly, the forecasts of market growth included in this prospectus should not be taken as indicative of our future growth.
We may experience quarterly fluctuations in our operating results due to a number of factors which make our future results difficult to predict and could cause our operating results to fall below expectations or our guidance.
Our quarterly operating results may fluctuate due to a variety of factors, many of which are outside of our control. As a result, comparing our operating results on a period-to-period basis may not be meaningful. You should not rely on our past results as indicative of our future performance. If our revenues or operating results fall below the expectations of investors or securities analysts, or below any guidance we may provide to the market, the price of our common stock could decline substantially.
In addition to other risk factors listed in this section, factors that may affect our quarterly operating results include the following:
| Ÿ | the level of advertising spend managed through our platform for a particular quarter; |
| Ÿ | customer renewal rates, and the pricing and usage of our platform in any renewal term; |
| Ÿ | demand for our platform and the size and timing of our sales; |
| Ÿ | customers delaying purchasing decisions in anticipation of new releases by us or of new products by our competitors; |
| Ÿ | network outages or security breaches and any associated expenses; |
| Ÿ | changes in the competitive dynamics of our industry, including consolidation among competitors or customers; |
| Ÿ | market acceptance of our current and future solutions; |
| Ÿ | changes in spending on digital advertising or information technology and software by our current and/or prospective customers; |
| Ÿ | budgeting cycles of our customers; |
| Ÿ | our potentially lengthy sales cycle; |
| Ÿ | our ability to control costs, including our operating expenses; |
26
Table of Contents
| Ÿ | the amount and timing of infrastructure costs and operating expenses related to the maintenance and expansion of our business, operations and infrastructure; |
| Ÿ | foreign currency exchange rate fluctuations; and |
| Ÿ | general economic and political conditions in our domestic and international markets. |
Based upon all of the factors described above, we have a limited ability to forecast our future revenues, costs and expenses, and as a result, our operating results may from time to time fall below our estimates or the expectations of public market analysts and investors.
We might require additional capital to support business growth, and this capital might not be available on acceptable terms, if at all.
We intend to continue to make investments to support our business growth and may require additional funds to respond to business challenges, including the need to develop new features or enhance our existing platform, improve our operating infrastructure or acquire complementary businesses and technologies. Accordingly, we may need to engage in equity or debt financings to secure additional funds. If we raise additional funds through further issuances of equity or convertible debt securities, our existing stockholders could suffer significant dilution, and any new equity securities we issue could have rights, preferences and privileges superior to those of holders of our common stock. Any debt financing secured by us in the future could involve restrictive covenants relating to our capital raising activities and other financial and operational matters, which may make it more difficult for us to obtain additional capital and to pursue business opportunities, including potential acquisitions. In addition, we may not be able to obtain additional financing on terms favorable to us, if at all. If we are unable to obtain adequate financing or financing on terms satisfactory to us, when we require it, our ability to continue to support our business growth and to respond to business challenges could be significantly impaired.
We will selectively pursue acquisitions of complementary businesses and technologies, which could divert our management’s attention, result in additional dilution to our stockholders and otherwise disrupt our operations and adversely affect our operating results.
We will selectively pursue acquisitions of complementary businesses and technologies that we believe could complement or expand our applications, enhance our technical capabilities or otherwise offer growth opportunities. The pursuit of potential acquisitions may divert the attention of management and cause us to incur various expenses in identifying, investigating and pursuing suitable acquisitions, whether or not they are consummated.
In addition, we have never acquired another business. If we acquire businesses or technologies, we may not be able to integrate the acquired personnel, operations and technologies successfully, or effectively manage the combined business following the acquisition. We also may not achieve the anticipated benefits from the acquired business due to a number of factors, including:
| Ÿ | inability to integrate or benefit from acquired technologies or services in a profitable manner; |
| Ÿ | unanticipated costs or liabilities associated with the acquisition; |
| Ÿ | incurrence of acquisition-related costs; |
| Ÿ | difficulty integrating the accounting systems, operations and personnel of the acquired business; |
| Ÿ | difficulties and additional expenses associated with supporting legacy products and hosting infrastructure of the acquired business; |
| Ÿ | difficulty converting the customers of the acquired business onto our applications and contract terms, including disparities in the revenues, licensing, support or professional services model of the acquired company; |
27
Table of Contents
| Ÿ | diversion of management’s attention from other business concerns; |
| Ÿ | adverse effects to our existing business relationships with business partners and customers as a result of the acquisition; |
| Ÿ | the potential loss of key employees; |
| Ÿ | use of resources that are needed in other parts of our business; and |
| Ÿ | use of substantial portions of our available cash to consummate the acquisition. |
In addition, a significant portion of the purchase price of companies we acquire may be allocated to acquired goodwill and other intangible assets, which must be assessed for impairment at least annually. In the future, if our acquisitions do not yield expected returns, we may be required to take charges to our operating results based on this impairment assessment process, which could adversely affect our results of operations.
Acquisitions could also result in dilutive issuances of equity securities or the incurrence of debt, which could adversely affect our operating results. In addition, if an acquired business fails to meet our expectations, our operating results, business and financial position may suffer.
If we are unable to implement and maintain effective internal control over financial reporting in the future, investors may lose confidence in the accuracy and completeness of our financial reports and the market price of our common stock may be negatively affected.
As a public company, we will be required to maintain internal control over financial reporting and to report any material weaknesses in such internal control. Section 404 of the Sarbanes-Oxley Act of 2002 (the Sarbanes-Oxley Act) requires that we evaluate and determine the effectiveness of our internal control over financial reporting and, beginning with our annual report for the fiscal year ending December 31, 2014, provide a management report on the internal control over financial reporting, which must be attested to by our independent registered public accounting firm to the extent we decide not to avail ourself of the exemption provided to an emerging growth company, as defined by The Jumpstart Our Businesses Act of 2012 (the JOBS Act). If we have a material weakness in our internal control over financial reporting, we may not detect errors on a timely basis and our financial statements may be materially misstated. We are in the process of designing and implementing the internal control over financial reporting required to comply with this obligation, which process will be time consuming, costly, and complicated. If we identify material weaknesses in our internal control over financial reporting, if we are unable to comply with the requirements of Section 404 in a timely manner, if we are unable to assert that our internal control over financial reporting are effective, or if our independent registered public accounting firm is unable to express an opinion as to the effectiveness of our internal control over financial reporting, investors may lose confidence in the accuracy and completeness of our financial reports and the market price of our common stock could be negatively affected, and we could become subject to investigations by the stock exchange on which our securities are listed, the SEC, or other regulatory authorities, which could require additional financial and management resources.
We will incur significantly increased costs and devote substantial management time as a result of operating as a public company.
As a public company, we will incur significant legal, accounting and other expenses that we did not incur as a private company. For example, we will be subject to the reporting requirements of the Securities Exchange Act of 1934, as amended (the Exchange Act), and will be required to comply with the applicable requirements of the Sarbanes-Oxley Act and the Dodd-Frank Wall Street Reform and Consumer Protection Act, as well as rules and regulations subsequently implemented by the SEC and the New York Stock Exchange, including the establishment and maintenance of effective disclosure
28
Table of Contents
and financial controls and changes in corporate governance practices. We expect that compliance with these requirements will increase our legal and financial compliance costs and will make some activities more time consuming and costly. In addition, we expect that our management and other personnel will need to divert attention from operational and other business matters to devote substantial time to these public company requirements. In particular, we expect to incur significant expenses and devote substantial management effort toward ensuring compliance with the requirements of Section 404 of the Sarbanes-Oxley Act, which will increase when we are no longer an emerging growth company, as defined by the JOBS Act. We will need to hire additional accounting and financial staff with appropriate public company experience and technical accounting knowledge and may need to establish an internal audit function. We cannot predict or estimate the amount of additional costs we may incur as a result of becoming a public company or the timing of such costs.
We also expect that operating as a public company will make it more expensive for us to obtain director and officer liability insurance on the terms that we would like. As a public company, it may be more difficult for us to attract and retain qualified people to serve on our board of directors, our board committees or as executive officers.
We are an emerging growth company and we cannot be certain if the reduced disclosure requirements applicable to emerging growth companies will make our common stock less attractive to investors.
We are an emerging growth company. Under the JOBS Act, emerging growth companies can delay adopting new or revised accounting standards until such time as those standards apply to private companies. We have irrevocably elected not to avail ourselves of this exemption from new or revised accounting standards and, therefore, we will be subject to the same new or revised accounting standards as other public companies that are not emerging growth companies.
For as long as we continue to be an emerging growth company, we intend to take advantage of certain exemptions from various reporting requirements that are applicable to other public companies including, but not limited to, reduced disclosure obligations regarding executive compensation in our periodic reports and proxy statements, and exemptions from the requirements of holding a nonbinding advisory vote on executive compensation and stockholder approval of any golden parachute payments not previously approved. We cannot predict if investors will find our common stock less attractive because we will rely on these exemptions. If some investors find our common stock less attractive as a result, there may be a less active trading market for our common stock and our stock price may be more volatile.
We will remain an emerging growth company until the earliest of (i) the end of the fiscal year in which the market value of our common stock that is held by non-affiliates exceeds $700 million as of June 30, (ii) the end of the fiscal year in which we have total annual gross revenues of $1 billion or more during such fiscal year, (iii) the date on which we issue more than $1 billion in non-convertible debt in a three-year period or (iv) five years from the date of this prospectus.
We may not be able to utilize a significant portion of our net operating loss or research tax credit carryforwards, which could adversely affect our profitability.
As of December 31, 2011, we had federal and state net operating loss carryforwards due to prior period losses, which if not utilized will begin to expire in 2026 and 2016 for federal and state purposes, respectively. We also have federal research tax credit carryforwards, which if not utilized will begin to expire in 2026. These net operating loss and research tax credit carryforwards could expire unused and be unavailable to offset future income tax liabilities, which could adversely affect our profitability.
In addition, under Section 382 of the Internal Revenue Code of 1986, as amended (the Code), our ability to utilize net operating loss carryforwards or other tax attributes, such as research tax
29
Table of Contents
credits, in any taxable year may be limited if we experience an “ownership change.” A Section 382 “ownership change” generally occurs if one or more stockholders or groups of stockholders who own at least 5% of our stock increase their ownership by more than 50 percentage points over their lowest ownership percentage within a rolling three-year period. Similar rules may apply under state tax laws. This offering or future issuances of our stock could cause an “ownership change.” It is possible that any future ownership change could have a material effect on the use of our net operating loss carryforwards or other tax attributes, which could adversely affect our profitability.
Our reported financial results may be adversely affected by changes in accounting principles generally accepted in the United States.
Generally accepted accounting principles in the United States are subject to interpretation by the Financial Accounting Standards Board (FASB), the SEC, and various bodies formed to promulgate and interpret appropriate accounting principles. A change in these principles or interpretations could have a significant effect on our reported financial results, and could affect the reporting of transactions completed before the announcement of a change.
Risks Related to Our Initial Public Offering
and Ownership of Our Common Stock
There has been no prior public market for our common stock, the stock price of our common stock may be volatile or may decline regardless of our operating performance, and you may not be able to resell your shares at or above the initial public offering price.
There has been no public market for our common stock prior to our initial public offering. The initial public offering price for our common stock will be determined through negotiations between the underwriters and us and may vary from the market price of our common stock following our initial public offering. If you purchase shares of our common stock in our initial public offering, you may not be able to resell those shares at or above the initial public offering price. An active or liquid market in our common stock may not develop upon closing of our initial public offering or, if it does develop, it may not be sustainable. The market price of our common stock may fluctuate significantly in response to numerous factors, many of which are beyond our control, including:
| Ÿ | overall performance of the equity markets; |
| Ÿ | our operating performance and the performance of other similar companies; |
| Ÿ | changes in the estimates of our operating results that we provide to the public, our failure to meet these projections or changes in recommendations by securities analysts that elect to follow our common stock; |
| Ÿ | announcements of technological innovations, new applications or enhancements to services, acquisitions, strategic alliances or significant agreements by us or by our competitors; |
| Ÿ | disruptions in our services due to computer hardware, software or network problems; |
| Ÿ | announcements of customer additions and customer cancellations or delays in customer purchases; |
| Ÿ | recruitment or departure of key personnel; |
| Ÿ | the economy as a whole, market conditions in our industry, and the industries of our customers; |
| Ÿ | the expiration of market standoff or contractual lock-up agreements; |
| Ÿ | the size of our market float; and |
| Ÿ | any other factors discussed in this prospectus. |
30
Table of Contents
In addition, the stock markets have experienced extreme price and volume fluctuations that have affected and continue to affect the market prices of equity securities of many technology companies. Stock prices of many technology companies have fluctuated in a manner unrelated or disproportionate to the operating performance of those companies. In the past, stockholders have filed securities class action litigation following periods of market volatility. If we were to become involved in securities litigation, it could subject us to substantial costs, divert resources and the attention of management from our business, and adversely affect our business.
Substantial blocks of our total outstanding shares may be sold into the market when “lock-up” or “market standoff” periods end. If there are substantial sales of shares of our common stock, the price of our common stock could decline.
The price of our common stock could decline if there are substantial sales of our common stock, particularly sales by our directors, executive officers, and significant stockholders, or if there is a large number of shares of our common stock available for sale. All of the shares of common stock sold in this offering will be available for sale in the public market. Substantially all of our outstanding shares of common stock are currently restricted from resale as a result of market standoff and “lock-up” agreements, as more fully described in “Shares Eligible for Future Sale.” These shares will become available to be sold 181 days after the date of this prospectus. Shares held by directors, executive officers and other affiliates will be subject to volume limitations under Rule 144 under the Securities Act of 1933, as amended (Securities Act) and various vesting agreements.
After our initial public offering, certain of our stockholders will have rights, subject to some conditions, to require us to file registration statements covering their shares to include their shares in registration statements that we may file for ourselves or our stockholders. All of these shares are subject to market standoff or lock-up agreements restricting their sale until 181 days after the date of this prospectus. We also intend to register shares of common stock that we have issued and may issue under our employee equity incentive plans. Once we register these shares, they will be able to be sold freely in the public market upon issuance, subject to existing market standoff or lock-up agreements.
Goldman, Sachs & Co. and Deutsche Bank Securities Inc. may, at their discretion, permit our stockholders to sell shares prior to the expiration of the restrictive provisions contained in those lock-up agreements.
The market price of the shares of our common stock could decline as a result of the sale of a substantial number of our shares of common stock in the public market or the perception in the market that the holders of a large number of shares intend to sell their shares.
Because the initial public offering price of our common stock will be substantially higher than the pro forma net tangible book value per share of our outstanding common stock following this offering, new investors will experience immediate and substantial dilution.
The initial public offering price is substantially higher than the pro forma net tangible book value per share of our common stock immediately following this offering based on the total value of our tangible assets less our total liabilities. Therefore if you purchase shares of our common stock in this offering, based on the midpoint of the price range set forth on the cover of this prospectus, you will experience immediate dilution of $ per share, the difference between the price per share you pay for our common stock and its pro forma net tangible book value per share as of December 31, 2012, after giving effect to the issuance of shares of our common stock in this offering.
31
Table of Contents
If securities or industry analysts do not publish research or publish inaccurate or unfavorable research about our business, our stock price and trading volume could decline.
The trading market for our common stock will depend in part on the research and reports that securities or industry analysts publish about us or our business. If few securities analysts commence coverage of us, or if industry analysts cease coverage of us, the trading price for our common stock would be negatively affected. If one or more of the analysts who cover us downgrade our common stock or publish inaccurate or unfavorable research about our business, our common stock price would likely decline. If one or more of these analysts cease coverage of us or fail to publish reports on us regularly, demand for our common stock could decrease, which might cause our common stock price and trading volume to decline.
We have broad discretion in the use of the net proceeds from our initial public offering and may not use them effectively.
We cannot specify with any certainty the particular uses of the net proceeds that we will receive from our initial public offering. We will have broad discretion in the application of the net proceeds, including working capital, possible acquisitions, and other general corporate purposes, and we may spend or invest these proceeds in a way with which our stockholders disagree. The failure by our management to apply these funds effectively could adversely affect our business and financial condition. Pending their use, we may invest the net proceeds from our initial public offering in a manner that does not produce income or that loses value. These investments may not yield a favorable return to our investors.
Our directors, executive officers and principal stockholders will continue to have substantial control over us after this offering and could delay or prevent a change in corporate control.
After this offering, our directors, executive officers and holders of more than 5% of our common stock, together with their affiliates, will beneficially own, in the aggregate, % of our outstanding common stock, based on the midpoint of the price range set forth on the cover of this prospectus. As a result, these stockholders, acting together, would have the ability to control the outcome of matters submitted to our stockholders for approval, including the election of directors and any merger, consolidation or sale of all or substantially all of our assets. In addition, these stockholders, acting together, would have the ability to control the management and affairs of our company. Accordingly, this concentration of ownership might harm the market price of our common stock by:
| Ÿ | delaying, deferring or preventing a change in control of us; |
| Ÿ | impeding a merger, consolidation, takeover or other business combination involving us; or |
| Ÿ | discouraging a potential acquiror from making a tender offer or otherwise attempting to obtain control of us. |
See “Principal and Selling Stockholders” below for more information regarding the ownership of our outstanding stock by our executive officers and directors, together with their affiliates.
We do not intend to pay dividends for the foreseeable future.
We have never declared nor paid cash dividends on our capital stock. We currently intend to retain any future earnings to finance the operation and expansion of our business, and we do not expect to declare or pay any dividends in the foreseeable future. Consequently, stockholders must rely on sales of their common stock after price appreciation, which may never occur, as the only way to realize any future gains on their investment.
32
Table of Contents
Delaware law and provisions in our restated certificate of incorporation and restated bylaws that will be in effect at the closing of our initial public offering could make a merger, tender offer, or proxy contest difficult, thereby depressing the trading price of our common stock.
Following the closing of our initial public offering, our status as a Delaware corporation and the anti-takeover provisions of the Delaware General Corporation Law may discourage, delay, or prevent a change in control by prohibiting us from engaging in a business combination with an interested stockholder for a period of three years after the person becomes an interested stockholder, even if a change of control would be beneficial to our existing stockholders. In addition, our restated certificate of incorporation and restated bylaws that will be in effect at the closing of our initial public offering will contain provisions that may make the acquisition of our company more difficult, including the following:
| Ÿ | our board of directors will be classified into three classes of directors with staggered three-year terms and directors will only be able to be removed from office for cause; |
| Ÿ | only our board of directors will have the right to fill a vacancy created by the expansion of our board of directors or the resignation, death or removal of a director, which prevents stockholders from being able to fill vacancies on our board of directors; |
| Ÿ | only our chairman of the board, our chief executive officer, our president, or a majority of our board of directors will be authorized to call a special meeting of stockholders; |
| Ÿ | certain litigation against us can only be brought in Delaware; |
| Ÿ | our restated certificate of incorporation will authorize undesignated preferred stock, the terms of which may be established, and shares of which may be issued, without the approval of the holders of common stock; and |
| Ÿ | advance notice procedures will apply for stockholders to nominate candidates for election as directors or to bring matters before an annual meeting of stockholders. |
For information regarding these and other provisions, see “Description of Capital Stock.”
33
Table of Contents
SPECIAL NOTE REGARDING FORWARD-LOOKING STATEMENTS
This prospectus contains forward-looking statements. All statements contained in this prospectus other than statements of historical fact, including statements regarding our future results of operations and financial position, our business strategy and plans, market growth, and our objectives for future operations, are forward-looking statements. The words “believe,” “may,” “will,” “estimate,” “continue,” “anticipate,” “intend,” “expect,” and similar expressions are intended to identify forward-looking statements. We have based these forward-looking statements largely on our current expectations and projections about future events and trends that we believe may affect our financial condition, results of operations, business strategy, short-term and long-term business operations and objectives, and financial needs. These forward-looking statements are subject to a number of risks, uncertainties and assumptions, including those described in the “Risk Factors” section. Moreover, we operate in a very competitive and rapidly changing environment. New risks emerge from time to time. It is not possible for our management to predict all risks, nor can we assess the impact of all factors on our business or the extent to which any factor, or combination of factors, may cause actual results to differ materially from those contained in any forward-looking statements we may make. In light of these risks, uncertainties and assumptions, the future events and trends discussed in this prospectus may not occur and actual results could differ materially and adversely from those anticipated or implied in the forward-looking statements.
You should not rely upon forward-looking statements as predictions of future events. The events and circumstances reflected in the forward-looking statements may not be achieved or occur. Although we believe that the expectations reflected in the forward-looking statements are reasonable, we cannot guarantee future results, levels of activity, performance, or achievements. We are under no duty to update any of these forward-looking statements after the date of this prospectus or to conform these statements to actual results or revised expectations.
34
Table of Contents
Unless otherwise indicated, information contained in this prospectus concerning our industry and the market in which we operate, including our general expectations and market position, market opportunity and market size, is based on information from various sources, including independent industry publications by Forrester Research, Inc. (Forrester), Gartner, Inc. (Gartner), International Data Corporation (IDC) and Magna Global USA, Inc. (Magna Global). In presenting this information, we have also made assumptions based on such data and other similar sources, and on our knowledge of, and in our experience to date in, the markets for our products and services. This information involves a number of assumptions and limitations, and you are cautioned not to give undue weight to such estimates. Although neither we nor the underwriters have independently verified the accuracy or completeness of any third-party information, we believe the information from these industry publications that is included in this prospectus is reliable. The industry in which we operate is subject to a high degree of uncertainty and risk due to a variety of factors, including those described in “Risk Factors.” These and other factors could cause results to differ materially from those expressed in the estimates made by the independent parties and by us.
The Gartner report described below, (the “Gartner Report”) represents data, research opinion or viewpoints published, as part of a syndicated subscription service, by Gartner, and are not representations of fact. The Gartner Report speaks as of its original publication date (and not as of the date of this prospectus) and the opinions expressed in the Gartner Report are subject to change without notice.
Certain information in the text of the prospectus is contained in independent industry publications. This information is identified with a superscript number. The source of, and selected additional information contained in, these independent industry publications are provided below:
| (1) | Forrester, US Cross-Channel Retail Forecast, 2011 To 2016, June 12, 2012, as updated July 23, 2012. |
| (2) | Gartner, Webinar: By 2017 the CMO Will Spend More on IT Than the CIO, Laura McLellan, January 3, 2012. |
| (3) | IDC, Worldwide New Media Market Model IH-2012: Worldwide and U.S. Data, September 2012. |
| (4) | Magna Global, Digital Media Forecasts, December 2012. The digital advertising channels cited by Magna Global include search, display, social and mobile. Revenues from these four digital advertising channels, as reported by Magna Global, are mutually exclusive. |
35
Table of Contents
We estimate that the net proceeds from the sale of shares of our common stock that we are selling in this offering will be approximately $ million, based on an assumed initial public offering price of $ per share, which is the midpoint of the estimated offering price range set forth on the cover page of this prospectus, and after deducting estimated underwriting discounts and commissions and estimated offering expenses payable by us. If the underwriters’ option to purchase additional shares from us is exercised in full, we estimate that we will receive additional net proceeds of $ million. A $1.00 increase or decrease in the assumed initial public offering price of $ per share would increase or decrease the net proceeds that we receive from this offering by approximately $ million, assuming the number of shares offered by us remains the same and after deducting the estimated underwriting discounts and commissions payable by us.
We will not receive any proceeds from the sale of shares of common stock by the selling stockholders, including any shares of common stock sold by the selling stockholders in connection with the underwriters’ exercise of their option to purchase additional shares of common stock, although we will bear the costs, other than underwriting discounts and commissions, associated with the sale of these shares.
The principal purposes of this offering are to create a public market for our common stock, obtain additional capital, facilitate our future access to the public equity markets, increase awareness of our company among advertisers and improve our competitive position. Our management will have broad discretion in the application of the net proceeds to us from this offering, and investors will be relying on the judgment of our management regarding the application of the proceeds. Pending their use, we plan to invest our net proceeds from this offering in short-term, interest-bearing obligations, investment-grade instruments, certificates of deposit or direct or guaranteed obligations of the U.S. government.
As of the date of this prospectus, except as described above, we cannot specify with certainty all of the other particular uses for the net proceeds from this offering. We expect to use the remaining net proceeds from this offering for working capital and other general corporate purposes. Additionally, we may choose to expand our current business through acquisitions of, or investments in, complementary businesses or technologies, using cash or shares of our common stock. However, we have no commitments with respect to any such acquisitions or investments at this time.
We have never declared or paid dividends on our capital stock. We do not expect to pay dividends on our common stock for the foreseeable future. Instead, we anticipate that all of our earnings will be used for the operation and growth of our business. Any future determination to declare cash dividends would be subject to the discretion of our board of directors and would depend upon various factors, including our results of operations, financial condition and liquidity requirements, restrictions that may be imposed by applicable law and our contracts and other factors deemed relevant by our board of directors. In addition, the terms of our credit facility currently restrict our ability to pay dividends.
36
Table of Contents
The following table sets forth our consolidated cash and cash equivalents and capitalization as of September 30, 2012 on:
| Ÿ | an actual basis; |
| Ÿ | a pro forma basis to give effect to the issuance of 1,478,064 shares of Series F-1 preferred stock and receipt of the related net proceeds of $19.9 million, the automatic conversion of all outstanding shares of our convertible preferred stock into an aggregate of 18,752,943 shares of our common stock immediately upon the completion of this offering, including the shares of our Series F-1 preferred stock issued in November 2012, and the conversion of outstanding warrants to purchase 50,792 of our Series B preferred stock into warrants to purchase 50,792 shares of common stock; and |
| Ÿ | a pro forma as adjusted basis, giving effect to (i) the pro forma adjustments described above, (ii) the sale by us of shares of our common stock in this offering, at our initial public offering price of $ per share, after deducting the estimated underwriting discounts and commissions and estimated offering expenses payable by us and (iii) the filing of our restated certificate of incorporation upon the completion of this offering. |
You should read this table together with “Management’s Discussion and Analysis of Financial Condition and Results of Operations,” “Description of Capital Stock,” and our consolidated financial statements and related notes included elsewhere in this prospectus.
| Actual | Pro Forma | Pro Forma As Adjusted(1) |
||||||||||
| (in thousands, except shares) | ||||||||||||
| Cash and cash equivalents |
$ | 16,990 | $ | 36,890 | $ | |||||||
|
|
|
|
|
|
|
|||||||
| Total debt, current and long-term |
10,185 | 10,185 | ||||||||||
|
|
|
|
|
|
|
|||||||
| Convertible preferred stock, net of issuance costs $0.001 par value: 17,456,943 shares authorized, 17,274,879 shares issued and outstanding, actual; no shares authorized, issued or outstanding, pro forma or pro forma as adjusted |
85,808 | — | ||||||||||
|
|
|
|
|
|
|
|||||||
| Stockholders’ (deficit) equity |
||||||||||||
| Preferred stock, $0.001 par value: no shares authorized, issued and outstanding, actual and pro forma; shares authorized and no shares issued or outstanding, pro forma as adjusted |
— | — | ||||||||||
| Common stock, $0.001 par value: 34,000,000 shares authorized, 4,823,499 shares issued and 4,514,052 outstanding, actual; authorized, 23,266,995 shares issued and outstanding, pro forma; shares authorized and shares issued and outstanding, pro forma as adjusted |
5 | 24 | ||||||||||
| Additional paid-in capital |
3,328 | 109,341 | ||||||||||
| Accumulated deficit |
(70,093 | ) | (70,093 | ) | ||||||||
|
|
|
|
|
|
|
|||||||
| Stockholders’ (deficit) equity |
(66,760 | ) | 39,272 | |||||||||
|
|
|
|
|
|
|
|||||||
| Total capitalization |
$ | 46,223 | $ | 86,347 | $ | |||||||
|
|
|
|
|
|
|
|||||||
| (1) | A $1.00 increase or decrease in the assumed initial public offering price of $ per share of our common stock, the midpoint of the price range set forth on the cover of this prospectus, would increase or decrease each of cash and cash equivalents, additional paid-in capital, total stockholders’ (deficit) equity and total capitalization by $ million, assuming that the number of shares offered by us, as set forth on the cover page of this prospectus, remains the same, and after deducting the estimated underwriting discounts and commissions. |
37
Table of Contents
The number of shares of our common stock to be outstanding following this offering is based on 23,266,995 shares of our common stock outstanding as of September 30, 2012 and excludes:
| Ÿ | 4,273,447 shares of common stock issuable upon the exercise of options outstanding as of September 30, 2012, with a weighted average exercise price of $3.72 per share; |
| Ÿ | 211,000 shares of common stock issuable upon the exercise of options granted between October 1, 2012 and December 10, 2012, with an exercise price of $12.15 per share; |
| Ÿ | 87,692 shares of our common stock issuable upon the exercise of warrants outstanding as of September 30, 2012, with a weighted average exercise price of $2.73 per share; |
| Ÿ | 309,447 shares of our common stock that are issued but were subject to a right of repurchase by us as of September 30, 2012 and therefore are not included in stockholders’ (deficit) equity; and |
| Ÿ | shares of our common stock reserved and available for future issuance under our equity compensation plans, consisting of (a) 3,263 shares of our common stock reserved for issuance under our 2006 Equity Incentive Plan as of September 30, 2012, (b) shares of our common stock that will be reserved for issuance under our 2013 Equity Incentive Plan, and (c) shares of our common stock reserved for issuance under our 2013 Employee Stock Purchase Plan. On the date of this prospectus, any remaining shares available for issuance under our 2006 Equity Incentive Plan will be added to the shares reserved under our 2013 Equity Incentive Plan and we will cease granting awards under the 2006 Equity Incentive Plan. Our 2013 Equity Incentive Plan and 2013 Employee Stock Purchase Plan also provide for automatic annual increases in the number of shares reserved thereunder, as more fully described in “Executive Compensation—Employee Benefit Plans.” |
38
Table of Contents
If you invest in our common stock, your interest will be diluted to the extent of the difference between the initial public offering price per share of our common stock and the pro forma as adjusted net tangible book value per share of our common stock immediately after our initial public offering.
As of September 30, 2012, our pro forma net tangible book value was $39.3 million, or $1.70 per share of common stock. Pro forma net tangible book value per share represents the amount of our tangible assets less our liabilities divided by the total number of shares of our common stock outstanding, after giving effect to the conversion of our convertible preferred stock, including the shares of our Series F-1 convertible preferred stock issued in November 2012, into an aggregate of 18,752,943 shares of our common stock upon the closing of this offering.
Our pro forma as adjusted net tangible book value as of September 30, 2012 was $ million, or $ per share of common stock. Pro forma as adjusted net tangible book value per share reflects the pro forma adjustments described above and further reflects the sale of shares of common stock by us in this offering at the initial public offering price of $ per share, after deducting underwriting discounts and commissions and estimated offering expenses payable by us. This represents an immediate increase in pro forma as adjusted net tangible book value of $ per share to existing stockholders and immediate dilution of $ per share to new investors purchasing shares in the offering.
The following table illustrates this per share dilution:
| Assumed initial public offering price per share |
$ | |||||||
| Pro forma net tangible book value per share as of September 30, 2012 |
$ | 1.70 | ||||||
| Increase in pro forma net tangible book value per share attributable to new investors |
||||||||
|
|
|
|||||||
| Pro forma as adjusted net tangible book value per share after this offering |
||||||||
|
|
|
|||||||
| Dilution per share to investors in this offering |
$ | |||||||
|
|
|
A $1.00 increase or decrease in the assumed initial public offering price of $ per share of our common stock, the midpoint of the price range set forth on the cover of this prospectus, would increase or decrease our pro forma as adjusted net tangible book value per share after this offering by $ , assuming that the number of shares offered by us, as set forth on the cover of this prospectus, remains the same, and after deducting estimated underwriting discounts and commissions.
If the underwriters exercise their over-allotment option in full, the pro forma as adjusted net tangible book value per share after this offering would be $ per share, and the dilution in pro forma net tangible book value per share to new investors in this offering would be $ per share of common stock.
The following table summarizes, on a pro forma as adjusted basis as of September 30, 2012, the differences between the number of shares of common stock purchased from us, the total cash consideration and the average price per share paid to us by existing stockholders and by new investors purchasing shares in this offering, at the initial public offering price of $ per share, before deducting estimated underwriting discounts and commissions and estimated offering expenses payable by us:
| Shares Purchased | Total Consideration | Average Price Per Share |
||||||||||||||||
| Number | Percent | Amount | Percent | |||||||||||||||
| Existing stockholders |
23,266,995 | $ | 109,007,013 | $ | 4.69 | |||||||||||||
| New public investors |
||||||||||||||||||
|
|
|
|
|
|
|
|
||||||||||||
| Total |
100 | % | $ | 100 | % | |||||||||||||
|
|
|
|
|
|
|
|
||||||||||||
39
Table of Contents
A $1.00 increase or decrease in the assumed initial public offering price of $ per share of our common stock, the midpoint of the price range set forth on the cover of this prospectus, would increase or decrease the total consideration paid by new investors by $ million, assuming that the number of shares offered by us, as set forth on the cover of this prospectus, remains the same, and after before deducting estimated underwriting discounts and commissions.
If the underwriters’ over-allotment option is exercised in full, the number of shares of common stock held by existing stockholders will be reduced to % of the total number of shares of common stock to be outstanding after this offering, and the number of shares of common stock held by investors participating in this offering will be further increased to , or % of the total number of shares of common stock to be outstanding after this offering.
Sales of shares of common stock by the selling stockholders in this offering will reduce the number of shares of common stock held by existing stockholders to , or approximately % of the total shares of common stock outstanding after this offering, and will increase the number of shares held by new investors to , or approximately % of the total shares of common stock outstanding after this offering.
The table and discussion above are based on 23,266,995 shares of our common stock outstanding as of September 30, 2012 and exclude:
| Ÿ | 4,273,447 shares of common stock issuable upon the exercise of options outstanding as of September 30, 2012, with a weighted average exercise price of $3.72 per share; |
| Ÿ | 211,000 shares of common stock issuable upon the exercise of options granted between October 1, 2012 and December 10, 2012, with an exercise price of $12.15 per share; |
| Ÿ | 87,692 shares of our common stock issuable upon the exercise of warrants outstanding as of September 30, 2012, with a weighted average exercise price of $2.73 per share; |
| Ÿ | 309,447 shares of our common stock that are issued but were subject to a right of repurchase by us as of September 30, 2012 and therefore are not included in stockholders’ (deficit) equity; and |
| Ÿ | shares of our common stock reserved and available for future issuance under our equity compensation plans, consisting of (a) 3,263 shares of our common stock reserved for issuance under our 2006 Equity Incentive Plan as of September 30, 2012, (b) shares of our common stock that will be reserved for issuance under our 2013 Equity Incentive Plan, and (c) shares of our common stock reserved for issuance under our 2013 Employee Stock Purchase Plan. On the date of this prospectus, any remaining shares available for issuance under our 2006 Equity Incentive Plan will be added to the shares reserved under our 2013 Equity Incentive Plan and we will cease granting awards under the 2006 Equity Incentive Plan. Our 2013 Equity Incentive Plan and 2013 Employee Stock Purchase Plan also provide for automatic annual increases in the number of shares reserved thereunder, as more fully described in “Executive Compensation—Employee Benefit Plans.” |
40
Table of Contents
SELECTED CONSOLIDATED FINANCIAL DATA
The following tables present our selected historical consolidated financial data. You should read this information together with “Management’s Discussion and Analysis of Financial Condition and Results of Operations” and the consolidated financial statements, related notes and other financial information included elsewhere in this prospectus. The selected consolidated financial data in this section are not intended to replace the consolidated financial statements and are qualified in their entirety by the consolidated financial statements and related notes included elsewhere in this prospectus.
We derived the consolidated statements of operations data for 2009, 2010 and 2011, and the consolidated balance sheet data as of December 31, 2010 and 2011 from our audited consolidated financial statements included elsewhere in this prospectus. We derived the consolidated statements of operations data for 2008 and the consolidated balance sheet data as of December 31, 2008 and 2009 from our audited financial statements not included in this prospectus. The unaudited consolidated statements of operations data for the nine months ended September 30, 2011 and 2012, and the unaudited consolidated balance sheet data as of September 30, 2012, are derived from our unaudited consolidated financial statements included elsewhere in this prospectus. Our unaudited consolidated financial statements have been prepared on the same basis as our audited consolidated financial statements and, in the opinion of management, reflect all adjustments, which consist only of normal recurring adjustments, necessary for the fair statement of those unaudited consolidated financial statements. Our historical results are not necessarily indicative of the results to be expected in the future, and the results for the nine months ended September 30, 2012 are not necessarily indicative of operating results to be expected for the full year ending December 31, 2012 or any other period.
| Years Ended December 31, | Nine Months Ended September 30, |
|||||||||||||||||||||||
| 2008 | 2009 | 2010 | 2011 | 2011 | 2012 | |||||||||||||||||||
| (in thousands, except per share data) | ||||||||||||||||||||||||
| Consolidated Statements of Operations Data: |
||||||||||||||||||||||||
| Revenues |
$ | 2,629 | $ | 7,527 | $ | 19,005 | $ | 36,121 | $ | 24,711 | $ | 42,507 | ||||||||||||
| Cost of revenues(1) |
2,416 | 5,101 | 11,040 | 18,691 | 13,523 | 17,728 | ||||||||||||||||||
|
|
|
|
|
|
|
|
|
|
|
|
|
|||||||||||||
| Gross profit |
213 | 2,426 | 7,965 | 17,430 | 11,188 | 24,779 | ||||||||||||||||||
|
|
|
|
|
|
|
|
|
|
|
|
|
|||||||||||||
| Operating expenses: |
||||||||||||||||||||||||
| Sales and marketing(1) |
4,299 | 6,146 | 8,884 | 20,357 | 14,474 | 23,615 | ||||||||||||||||||
| Research and development(1) |
2,263 | 3,410 | 4,568 | 7,071 | 5,027 | 9,651 | ||||||||||||||||||
| General and administrative(1) |
1,060 | 2,171 | 5,195 | 6,679 | 4,132 | 10,001 | ||||||||||||||||||
|
|
|
|
|
|
|
|
|
|
|
|
|
|||||||||||||
| Total operating expenses |
7,622 | 11,727 | 18,647 | 34,107 | 23,633 | 43,267 | ||||||||||||||||||
|
|
|
|
|
|
|
|
|
|
|
|
|
|||||||||||||
| Loss from operations |
(7,409 | ) | (9,301 | ) | (10,682 | ) | (16,677 | ) | (12,445 | ) | (18,488 | ) | ||||||||||||
| Interest income (expense), net |
45 | (212 | ) | (230 | ) | (378 | ) | (276 | ) | (349 | ) | |||||||||||||
| Other income (expenses), net |
6 | (92 | ) | 78 | (229 | ) | (143 | ) | (222 | ) | ||||||||||||||
|
|
|
|
|
|
|
|
|
|
|
|
|
|||||||||||||
| Loss before provision for income taxes |
(7,358 | ) | (9,605 | ) | (10,834 | ) | (17,284 | ) | (12,864 | ) | (19,059 | ) | ||||||||||||
| Provision for income taxes |
(1 | ) | (103 | ) | (23 | ) | (139 | ) | (96 | ) | (167 | ) | ||||||||||||
|
|
|
|
|
|
|
|
|
|
|
|
|
|||||||||||||
| Net loss |
$ | (7,359 | ) | $ | (9,708 | ) | $ | (10,857 | ) | $ | (17,423 | ) | $ | (12,960 | ) | $ | (19,226 | ) | ||||||
| Redemption of preferred stock in connection with the Series D financing and deemed dividend |
— | — | (1,033 | ) | — | — | — | |||||||||||||||||
|
|
|
|
|
|
|
|
|
|
|
|
|
|||||||||||||
| Net loss available to common stockholders |
$ | (7,359 | ) | $ | (9,708 | ) | $ | (11,890 | ) | $ | (17,423 | ) | $ | (12,960 | ) | (19,226 | ) | |||||||
|
|
|
|
|
|
|
|
|
|
|
|
|
|||||||||||||
| Net loss per share available to common stockholders (basic and diluted)(2) |
$ | (2.13 | ) | $ | (2.74 | ) | $ | (3.27 | ) | $ | (4.29 | ) | $ | (3.26 | ) | $ | (4.46 | ) | ||||||
|
|
|
|
|
|
|
|
|
|
|
|
|
|||||||||||||
| Weighted average shares used to compute net loss per share attributable to common stockholders, basic and diluted(2) |
3,459 | 3,540 | 3,639 | 4,058 | 3,978 | 4,312 | ||||||||||||||||||
|
|
|
|
|
|
|
|
|
|
|
|
|
|||||||||||||
| Pro forma net loss per share available to common stockholders, basic and diluted(2) |
$ | (0.96 | ) | $ | (0.84 | ) | ||||||||||||||||||
|
|
|
|
|
|||||||||||||||||||||
| Weighted average pro forma shares used to compute pro forma net loss per share attributable to common stockholders, basic and diluted(2) |
18,108 | 22,809 | ||||||||||||||||||||||
|
|
|
|
|
|||||||||||||||||||||
| Other financial data |
||||||||||||||||||||||||
| Adjusted EBITDA(3) |
$ | (7,364 | ) | $ | (9,100 | ) | $ | (8,715 | ) | $ | (15,208 | ) | $ | (11,408 | ) | $ | (13,367 | ) | ||||||
(footnotes on next page)
41
Table of Contents
| (1) | Stock-based compensation included in the consolidated statements of operations data above was allocated as follows: |
| Years Ended December 31, | Nine Months Ended September 30, |
|||||||||||||||||||||||
| 2008 | 2009 | 2010 | 2011 | 2011 | 2012 | |||||||||||||||||||
| (in thousands) | ||||||||||||||||||||||||
| Cost of revenues |
$ | 15 | $ | 66 | $ | 90 | $ | 165 | $ | 119 | $ | 292 | ||||||||||||
| Sales and marketing |
33 | 81 | 66 | 226 | 162 | 817 | ||||||||||||||||||
| Research and development |
11 | 26 | 58 | 163 | 120 | 648 | ||||||||||||||||||
| General and administrative |
26 | 19 | 1,172 | 143 | 82 | 2,490 | ||||||||||||||||||
|
|
|
|
|
|
|
|
|
|
|
|
|
|||||||||||||
| Total stock-based compensation |
$ | 85 | $ | 192 | $ | 1,386 | $ | 697 | $ | 483 | $ | 4,247 | ||||||||||||
|
|
|
|
|
|
|
|
|
|
|
|
|
|||||||||||||
| (2) | See Note 12 of the consolidated financial statements included elsewhere in this prospectus for an explanation of the calculations of basic and diluted net loss per share available to common stockholders and pro forma net loss per share available to common stockholders. |
| (3) | We define Adjusted EBITDA as net loss, adjusted for stock-based compensation expense, depreciation and amortization, capitalized internal-use software development costs, interest expense, net, provision for income taxes and other income (expenses), net. Adjusted EBITDA is a financial measure that is not calculated in accordance with GAAP. See “Summary Consolidated Financial Data—Adjusted EBITDA” for more information regarding Adjusted EBITDA, including its limitations as an analytical tool. The following table presents a reconciliation of net loss, the most comparable GAAP measure, to Adjusted EBITDA for each of the periods indicated: |
| Years Ended December 31, | Nine Months Ended September 30, |
|||||||||||||||||||||||
| 2008 | 2009 | 2010 | 2011 | 2011 | 2012 | |||||||||||||||||||
| (in thousands) | ||||||||||||||||||||||||
| Net loss |
$ | (7,359 | ) | $ | (9,708 | ) | $ | (10,857 | ) | $ | (17,423 | ) | $ | (12,960 | ) | $ | (19,226 | ) | ||||||
| Depreciation and amortization |
126 | 382 | 1,016 | 1,800 | 1,268 | 2,148 | ||||||||||||||||||
| Interest (income) expense, net |
(45 | ) | 212 | 230 | 378 | 276 | 349 | |||||||||||||||||
| Provision for income taxes |
1 | 103 | 23 | 139 | 96 | 167 | ||||||||||||||||||
|
|
|
|
|
|
|
|
|
|
|
|
|
|||||||||||||
| EBITDA |
(7,277 | ) | (9,011 | ) | (9,588 | ) | (15,106 | ) | (11,320 | ) | (16,562 | ) | ||||||||||||
| Other (income) expenses, net |
(6 | ) | 92 | (78 | ) | 229 | 143 | 222 | ||||||||||||||||
| Capitalization of internally developed software |
(166 | ) | (373 | ) | (435 | ) | (1,028 | ) | (714 | ) | (1,274 | ) | ||||||||||||
| Stock-based compensation |
85 | 192 | 1,386 | 697 | 483 | 4,247 | ||||||||||||||||||
|
|
|
|
|
|
|
|
|
|
|
|
|
|||||||||||||
| Adjusted EBITDA |
$ | (7,364 | ) | $ | (9,100 | ) | $ | (8,715 | ) | $ | (15,208 | ) | $ | (11,408 | ) | $ | (13,367 | ) | ||||||
|
|
|
|
|
|
|
|
|
|
|
|
|
|||||||||||||
The following table sets forth our consolidated balance sheet data as of the dates presented:
| As of December 31, | As of September 30, |
|||||||||||||||||||
| 2008 | 2009 | 2010 | 2011 | 2012 | ||||||||||||||||
| (in thousands) | ||||||||||||||||||||
| Consolidated Balance Sheet Data: |
||||||||||||||||||||
| Cash and cash equivalents |
$ | 3,584 | $ | 5,132 | $ | 1,172 | $ | 1,719 | $ | 16,990 | ||||||||||
| Property and equipment, net |
516 | 1,271 | 3,113 | 4,909 | 8,479 | |||||||||||||||
| Total assets |
5,376 | 9,144 | 10,653 | 18,297 | 40,300 | |||||||||||||||
| Debt, current and long-term |
3,409 | 2,805 | 3,195 | 6,629 | 10,185 | |||||||||||||||
| Convertible preferred stock, net of issuance costs |
12,059 | 24,974 | 35,580 | 51,514 | 85,808 | |||||||||||||||
| Total stockholders’ deficit |
(11,131 | ) | (20,605 | ) | (32,578 | ) | (48,408 | ) | (66,760 | ) | ||||||||||
42
Table of Contents
MANAGEMENT’S DISCUSSION AND ANALYSIS OF FINANCIAL CONDITION AND RESULTS OF OPERATIONS
The following discussion and analysis of our financial condition and results of operations should be read in conjunction with our “Selected Consolidated Financial Data” and our consolidated financial statements and related notes included elsewhere in this prospectus. This discussion contains forward-looking statements that involve risks and uncertainties. Our actual results could differ materially from those forward-looking statements below. Factors that could cause or contribute to those differences include, but are not limited to, those identified below and those discussed in the section entitled “Risk Factors” included elsewhere in this prospectus.
Overview
We provide a leading cloud-based digital advertising management platform that enables advertisers and agencies to improve financial performance, realize efficiencies and time savings, and make better business decisions. Our Revenue Acquisition Management platform is an analytics, workflow, and optimization solution for marketing professionals, enabling them to effectively manage their digital advertising spend across search, display, social and mobile advertising channels. Our solution is designed to help our customers:
| Ÿ | measure the effectiveness of their advertising campaigns through our proprietary reporting and analytics capabilities; |
| Ÿ | manage and execute campaigns through our intuitive user interface and underlying technology that streamlines and automates key functions, such as ad creation and bidding, across multiple publishers and channels; and |
| Ÿ | optimize campaigns across multiple publishers and channels in real time based on market and business data to achieve desired revenue outcomes using our predictive bid management technology. |
In December 2012, our customers collectively managed $ in annualized advertising spend on our platform and we had active advertisers using our solution globally across a wide range of industries. We market and sell our solutions to advertisers directly and through leading advertising agencies. We generate revenues from subscription contracts under which we charge fees generally based upon the amount of advertising spend that our customers manage through our platform. We have achieved 14 consecutive quarters of revenue growth. For 2009, 2010 and 2011, and for the nine months ended September 30, 2012, our revenues were $7.5 million, $19.0 million, $36.1 million and $42.5 million, representing period-over-period growth of 186%, 152%, 90% and 72%, respectively. We had net losses of $9.7 million in 2009, $10.9 million in 2010, $17.4 million in 2011 and $19.2 million for the nine months ended September 30, 2012. In order for us to begin to generate net income, we will need to grow revenues at a rate faster than our cost of revenues and operating expenses. For example, in 2010, 2011 and 2012, we had revenues of $19.0 million, $36.1 million and $ million, respectively, but had total cost of revenues of $11.1 million, $18.7 million and $ million, respectively, and operating expenses of $18.6 million, $34.1 million and $ million, respectively. We must continue to increase revenues at a higher rate than our cost of revenues and operating expenses increase, or we will need to make additional efforts to decrease cost of revenues and operating expenses as a percentage of revenues in order to begin to generate net income.
We generate revenues principally from subscription contracts under which we provide advertisers with access to our platform, either directly or through the advertiser’s relationship with an agency that has a contract with us. Our contracts are generally six months to one year in length for our direct advertisers and up to two years in length for our advertising agencies. Under our subscription contracts with most of our direct advertisers and some of our agency customers, customers are contractually committed to a monthly minimum fee, which is payable on a monthly basis over the duration of the contract and is generally one-half of our estimated monthly revenues from these customers, at the time
43
Table of Contents
the contract is signed. However, most of our subscription contracts with our advertising agency customers do not include a committed monthly minimum fee. Our contractual arrangement is with the advertising agency and the advertiser is not a party to the terms of the contract. Accordingly, most advertisers through our agency customers do not have a commitment to use our services and the advertisers may be added or removed from our platform at the discretion of the respective agency. We invoice the advertising agency the amounts due under the contract. Historically, approximately half of our revenues have been generated from advertising agency customers. Our subscription fee under most contracts is variable based upon the value of advertising spend that our customers manage through our platform. Our deferred revenues consist of the unearned portion of billed subscription fees. As we invoice our customers on a monthly basis in arrears, we currently have limited deferred revenue and, as a result, our deferred revenue balance is not an indicator of our future subscription revenues.
Our subscription contracts indicate the date at which we begin invoicing our customers, which is generally the first day of the month following the execution of the contract. We generally invoice the greater of the minimum fee or the percentage of advertising spend on our platform. The implementation process for new advertisers is typically four to six weeks; however, we do not charge a separate implementation fee under our subscription contracts.
Our implementation and customer support personnel, as well as costs associated with our cloud infrastructure, are included in our cost of revenues. Our cost of revenues and operating expenses have increased in absolute dollars over the past four years due to our need to increase our headcount to grow our business and to increase data center capacity to support customer revenue growth on our platform. We expect that our cost of revenues and operating expenses will continue to increase in absolute dollars as we continue to invest in our growth and incur additional costs as a public company.
In order to grow revenues, we will invest in sales and marketing activities by adding sales executives globally to target new advertisers and agencies. We will also invest in research and development to further expand our platform and support for additional publishers. All of these activities will require us to make investments, particularly in research and development and sales and marketing, and if these investments do not generate additional customers or additional advertising spend managed by our platform, our future operating results could be harmed.
The majority of our revenues are derived from our advertisers in the United States. We believe the markets outside of the United States offer an opportunity for growth and we intend to make additional investments in sales and marketing to expand in these markets. Advertisers from outside of the United States represented 26% of total revenues for the nine months ended September 30, 2012 and, 7%, 20% and 26% for 2009, 2010 and 2011, respectively.
We were incorporated in 2006 and initially focused on building the core elements of our cloud-based platform, which we currently use to service our customers. In September 2007, we launched Marin Enterprise, which targets large advertisers and agencies. We released Marin Professional Edition in March 2011, which targets mid-market advertisers and agencies. We have an iterative release cycle and we typically release new features every one to two months. Additionally, we have continued to expand internationally, opening our London office in 2009, our offices in Paris, Hamburg, Singapore and Sydney in 2011 and our Tokyo office in 2012.
Key Metrics
We regularly review a number of metrics to evaluate growth trends, measure our performance, establish budgets and make strategic decisions. Our selected key metrics include revenue, gross margin, operating expenses, active advertisers, annualized advertising spend on our platform and revenue retention rate. We discuss revenue, gross margin and operating expenses below under “—Components of Our Results of Operations.” We monitor our key metrics to measure our success. Our revenues are generally based on the amount of advertising spend our customers manage on our platform in a period.
44
Table of Contents
As a result, revenues are an important metric to understanding the overall health of our business, and we use revenue trends to formulate financial projections and make strategic business decisions.
Number of Active Advertisers
We define an active advertiser as an advertiser from whom we recognized revenues in excess of $2,000 in at least one month in a period. We believe the $2,000 threshold best identifies advertisers who are actively using our platform. We focus on revenue in at least one month in a period to account for seasonality in advertising spend by our customers, some of whom may not run digital advertising campaigns in every month of a year but still represent an active advertiser on our platform. We count organizations within the same corporate structure as one advertiser, even if they have signed separate contracts with us for different brands or divisions, whether they are a direct advertiser or an advertiser through an agency. When our subscription contract is with an advertising agency, we include each advertiser whose advertising spend is managed by the agency through our platform as a different advertiser. Advertisers who have advertising spend managed by multiple agencies on our platform are counted as one advertiser. We believe that our ability to increase the number of active advertisers using our platform is a leading indicator of our ability to grow revenues. While our active advertiser count has increased over time, this metric can fluctuate from quarter to quarter given the seasonal trends in advertising spend of our customers. We had 223, 390 and active advertisers in the quarters ending December 31, 2010, 2011 and 2012, respectively, and 436, 487 and 502 active advertisers in the quarters ending March 31, 2012, June 30, 2012 and September 30, 2012, respectively.
Annualized Advertising Spend on our Platform
We calculate annualized advertising spend as advertising spend in the last month of a period multiplied by 12. We believe that increases in annualized advertising spend on our platform have a strong correlation to our ability to increase revenues. Our customers collectively managed $1.7 billion, $3.2 billion and $ billion, in annualized advertising spend on our platform in December 2010, 2011 and 2012, respectively. Additionally, annualized advertising spend managed on our platform increased sequentially for the three months ended March 31, 2012, June 30, 2012 and September 30, 2012.
Revenue Retention Rate
We believe our ability to retain and grow revenues from our existing advertisers is an indicator of the stability of our revenue base and the long-term value of our advertiser relationships. We assess our ability to retain and grow subscription revenues using a metric we refer to as revenue retention rate. We calculate our revenue retention rate metric by dividing retained revenues by retention base revenues. We define retention base revenues as revenues from all advertisers in the corresponding prior period, and we define retained revenues as revenues from all advertisers from the prior period that remain advertisers in the current period. This metric is calculated on a quarterly basis, and for annual periods, we use an average of the quarterly metrics. Although we have lost individual advertisers over time, advertisers who have remained on our platform have generally, in the aggregate, increased their advertising spend on our platform. At the same time, advertising spend on our platform may vary quarter to quarter, and as a result, quarterly revenue retention rates may fluctuate quarter to quarter. Our annual revenue retention rates were 123%, 109% and % in 2010, 2011 and 2012, respectively.
Components of Our Results of Operations
Revenues
We generate revenues principally from subscription contracts under which we provide advertisers with access to our platform, either directly or through the advertiser’s relationship with an agency with whom we have a contract. Under our subscription contracts with most direct advertisers and some of
45
Table of Contents
our agency customers, customers contractually commit to a monthly minimum fee, which is generally one-half of our estimated monthly revenues from these customers, at the time the contract is signed. However, most of our subscription contracts with our advertising agency customers do not include a committed monthly minimum fee. Additionally, advertisers we serve through our arrangements with our advertising agencies generally do not have a minimum commitment to continue using our services. Our subscription fee under most contracts is variable based upon the value of advertising spend that our customers manage through our platform, although some customers pay a flat monthly rate over the term of their subscription contract. We invoice our customers for the fees that we have earned based upon their monthly usage of our platform and, as a result, we currently have limited deferred revenue. Our deferred revenues consist of the unearned portion of billed subscription fees.
Cost of Revenues
Cost of revenues primarily includes personnel costs, consisting of salaries, benefits, bonuses and stock-based compensation, for employees associated with our cloud infrastructure and global services for implementation and ongoing customer service organizations. Other costs of revenues include fees paid to contractors who supplement our support and data center personnel, expenses related to the use of a third-party data center, depreciation of data center equipment, amortization of capitalized research and development costs and allocated overhead.
We intend to continue to invest additional resources in our global services teams and in the capacity of our hosting service infrastructure. As we continue to invest in technology innovation through our research and development organization, we expect to have increased amortization of capitalized research and development costs. We expect that this investment in technology should not only expand the breadth and depth of our Revenue Acquisition Management platform but also increase the efficiency of how we deliver these solutions, enabling us to improve our gross margin over time. The level and timing of investment in these areas could affect our cost of revenues in the future.
Sales and Marketing Expenses
Sales and marketing expenses include personnel costs, sales commissions and other costs including travel and entertainment, marketing and promotional events, public relations, marketing activities, professional fees and allocated overhead. All of these costs are expensed as incurred, including sales commissions. Our commission plans provide that payment of commissions to our sales representatives are paid based on the actual amounts we invoice customers over a period that is generally between five to seven months following the execution of the applicable customer contract, contingent on their continued employment with us.
We plan to continue investing in sales and marketing by increasing the number of sales and account management employees, expanding our domestic and international sales and marketing activities, building brand awareness and sponsoring additional marketing events, which we believe will enable us to add new customers and increase penetration within our existing customer base. We expect that, in the future, sales and marketing expenses will increase in absolute dollars and continue to be our largest operating expense category.
Research and Development Expenses
Research and development expenses consist primarily of personnel costs for our product development and engineering employees and executives, including salaries, benefits, stock-based compensation expense and bonuses. Also included are non-personnel costs such as professional fees payable to third-party development resources and allocated overhead.
46
Table of Contents
Our research and development efforts are focused on enhancing our software architecture, adding new features and functionality to our platform and improving the efficiency with which we deliver these services to our customers. We expect that, in the future, research and development expenses will increase in absolute dollars, partially offset by the amount of capitalized internal-use software development costs. We believe that these investments are necessary to maintain and improve our competitive position.
General and Administrative Expenses
General and administrative expenses consist primarily of personnel costs, including salaries, benefits, stock-based compensation expense and bonuses, for our administrative, legal, human resources, finance and accounting employees and executives. Also included are non-personnel costs, such as travel-related expenses, audit fees, tax services and legal fees, as well as professional fees, insurance and other corporate expenses, along with allocated overhead.
We expect to incur incremental costs associated with supporting the growth of our business, both in terms of size and geographic expansion, and to meet the increased compliance requirements associated with our transition to and operation as a public company. Such costs include increases in our accounting and legal personnel, additional consulting, legal and audit fees, insurance costs, board of directors’ compensation and the costs of achieving and maintaining compliance with Section 404 of the Sarbanes-Oxley Act. As a result, we expect our general and administrative expenses to increase in absolute dollars in future periods but to decrease as a percentage of revenues over time.
Results of Operations
The following table is a summary of our consolidated statements of operations. The period-to-period comparisons of results are not necessarily indicative of results for future periods.
| Years Ended December 31, | Nine Months Ended September 30, |
|||||||||||||||||||
| 2009 | 2010 | 2011 | 2011 | 2012 | ||||||||||||||||
| (in thousands) | ||||||||||||||||||||
| Consolidated Statement of Operations Data: |
||||||||||||||||||||
| Revenues |
$ | 7,527 | $ | 19,005 | $ | 36,121 | $ | 24,711 | $ | 42,507 | ||||||||||
| Cost of revenues(1) |
5,101 | 11,040 | 18,691 | 13,523 | 17,728 | |||||||||||||||
|
|
|
|
|
|
|
|
|
|
|
|||||||||||
| Gross profit |
2,426 | 7,965 | 17,430 | 11,188 | 24,779 | |||||||||||||||
|
|
|
|
|
|
|
|
|
|
|
|||||||||||
| Operating expenses: |
||||||||||||||||||||
| Sales and marketing(1) |
6,146 | 8,884 | 20,357 | 14,474 | 23,615 | |||||||||||||||
| Research and development(1) |
3,410 | 4,568 | 7,071 | 5,027 | 9,651 | |||||||||||||||
| General and administrative(1) |
2,171 | 5,195 | 6,679 | 4,132 | 10,001 | |||||||||||||||
|
|
|
|
|
|
|
|
|
|
|
|||||||||||
| Total operating expenses |
11,727 | 18,647 | 34,107 | 23,633 | 43,267 | |||||||||||||||
|
|
|
|
|
|
|
|
|
|
|
|||||||||||
| Loss from operations |
(9,301 | ) | (10,682 | ) | (16,677 | ) | (12,445 | ) | (18,488 | ) | ||||||||||
| Interest expense, net |
(212 | ) | (230 | ) | (378 | ) | (276 | ) | (349 | ) | ||||||||||
| Other income (expenses), net |
(92 | ) | 78 | (229 | ) | (143 | ) | (222 | ) | |||||||||||
|
|
|
|
|
|
|
|
|
|
|
|||||||||||
| Loss before provision for income taxes |
(9,605 | ) | (10,834 | ) | (17,284 | ) | (12,864 | ) | (19,059 | ) | ||||||||||
| Provision for income taxes |
(103 | ) | (23 | ) | (139 | ) | (96 | ) | (167 | ) | ||||||||||
|
|
|
|
|
|
|
|
|
|
|
|||||||||||
| Net loss |
$ | (9,708 | ) | $ | (10,857 | ) | $ | (17,423 | ) | $ | (12,960 | ) | $ | (19,226 | ) | |||||
|
|
|
|
|
|
|
|
|
|
|
|||||||||||
| Other financial data: |
||||||||||||||||||||
| Adjusted EBITDA(2) |
$ | (9,100 | ) | $ | (8,715 | ) | $ | (15,208 | ) | $ | (11,408 | ) | $ | (13,367 | ) | |||||
(footnotes on next page)
47
Table of Contents
| (1) | Stock-based compensation included in the consolidated statements of operations data above was as follows: |
| Years Ended December 31, | Nine Months Ended September 30, |
|||||||||||||||||||
| 2009 | 2010 | 2011 | 2011 | 2012 | ||||||||||||||||
| (in thousands) | ||||||||||||||||||||
| Cost of revenues |
$ | 66 | $ | 90 | $ | 165 | $ | 119 | $ | 292 | ||||||||||
| Sales and marketing |
81 | 66 | 226 | 162 | 817 | |||||||||||||||
| Research and development |
26 | 58 | 163 | 120 | 648 | |||||||||||||||
| General and administrative |
19 | 1,172 | 143 | 82 | 2,490 | |||||||||||||||
|
|
|
|
|
|
|
|
|
|
|
|||||||||||
| $ | 192 | $ | 1,386 | $ | 697 | $ | 483 | $ | 4,247 | |||||||||||
|
|
|
|
|
|
|
|
|
|
|
|||||||||||
| (2) | We define Adjusted EBITDA as net loss, adjusted for stock-based compensation expense, interest expense, depreciation and amortization, capitalized internal-use software development costs, income expense, net, provision for income taxes and other income (expenses), net. See footnote 3 on page 41 to the table in the section of this prospectus titled “Selected Consolidated Financial Data” for a reconciliation of Adjusted EBITDA to net loss. |
The following table sets forth our consolidated results of operations for the specified periods as a percentage of our revenues for those periods.
| Years Ended December 31, | Nine Months Ended September 30, |
|||||||||||||||||||
| 2009 | 2010 | 2011 | 2011 | 2012 | ||||||||||||||||
| Revenues |
100 | % | 100 | % | 100 | % | 100 | % | 100 | % | ||||||||||
| Cost of revenues |
68 | 58 | 52 | 55 | 42 | |||||||||||||||
|
|
|
|
|
|
|
|
|
|
|
|||||||||||
| Gross margin |
32 | 42 | 48 | 45 | 58 | |||||||||||||||
|
|
|
|
|
|
|
|
|
|
|
|||||||||||
| Operating expenses: |
||||||||||||||||||||
| Sales and marketing |
82 | 47 | 56 | 59 | 56 | |||||||||||||||
| Research and development |
45 | 24 | 20 | 20 | 23 | |||||||||||||||
| General and administrative |
29 | 27 | 18 | 17 | 24 | |||||||||||||||
|
|
|
|
|
|
|
|
|
|
|
|||||||||||
| Total operating expenses |
156 | 98 | 94 | 96 | 102 | |||||||||||||||
|
|
|
|
|
|
|
|
|
|
|
|||||||||||
| Loss from operations |
(124 | ) | (56 | ) | (46 | ) | (50 | ) | (43 | ) | ||||||||||
| Interest expense, net |
(3 | ) | (1 | ) | (1 | ) | (1 | ) | (1 | ) | ||||||||||
| Other income (expenses), net |
(1 | ) | — | (1 | ) | (1 | ) | (1 | ) | |||||||||||
|
|
|
|
|
|
|
|
|
|
|
|||||||||||
| Loss before provision for income taxes |
(128 | ) | (57 | ) | (48 | ) | (52 | ) | (45 | ) | ||||||||||
| Provision for income taxes |
(1 | ) | — | — | — | — | ||||||||||||||
|
|
|
|
|
|
|
|
|
|
|
|||||||||||
| Net loss |
(129 | )% | (57 | )% | (48 | )% | (52 | )% | (45 | )% | ||||||||||
|
|
|
|
|
|
|
|
|
|
|
|||||||||||
The following table sets forth our consolidated revenues by geographic area:
| Years Ended December 31, | Nine Months Ended September 30, |
|||||||||||||||||||
| 2009 | 2010 | 2011 | 2011 | 2012 | ||||||||||||||||
| (in thousands) | ||||||||||||||||||||
| United States |
$ | 6,966 | $ | 15,246 | $ | 26,673 | $ | 18,573 | $ | 31,360 | ||||||||||
| International |
561 | 3,759 | 9,448 | 6,138 | 11,147 | |||||||||||||||
|
|
|
|
|
|
|
|
|
|
|
|||||||||||
| $ | 7,527 | $ | 19,005 | $ | 36,121 | $ | 24,711 | $ | 42,507 | |||||||||||
|
|
|
|
|
|
|
|
|
|
|
|||||||||||
48
Table of Contents
Comparison of the Nine Months Ended September 30, 2011 and 2012
Revenues
| Nine Months Ended September 30, |
Change | |||||||||||||||
| 2011 | 2012 | $ | % | |||||||||||||
| (dollars in thousands) | ||||||||||||||||
| Revenues |
$ | 24,711 | $ | 42,507 | $ | 17,796 | 72 | % | ||||||||
Revenues increased $17.8 million, or 72%, for the nine months ended September 30, 2012 as compared to the same period in 2011. This increase was driven by growth in revenues from both new and existing advertisers in all geographies as our ongoing investment in sales and marketing resources resulted in increased demand for our platform worldwide. During the nine months ended September 30, 2012, we generated $6.3 million of revenue from new advertisers and $11.5 million of additional revenue from our existing advertisers. There were no customers that accounted for greater than 10% of our revenues for the nine months ended September 30, 2011 or 2012.
Revenues for the nine months ended September 30, 2012 from the United States and international locations represented 74% and 26%, respectively, of revenues, and for the nine months ended September 30, 2011, revenues from the United States and international locations represented 75% and 25%, respectively, of revenues.
Cost of Revenues and Gross Margin
| Nine Months Ended September 30, |
Change | |||||||||||||||
| 2011 | 2012 | $ | % | |||||||||||||
| (dollars in thousands) | ||||||||||||||||
| Cost of revenues |
$ | 13,523 | $ | 17,728 | $ | 4,205 | 31 | % | ||||||||
| Gross profit |
11,188 | 24,779 | 13,591 | 121 | ||||||||||||
| Gross margin |
45 | % | 58 | % | ||||||||||||
Cost of revenues increased $4.2 million, or 31%, for the nine months ended September 30, 2012 as compared to the same period in 2011. This reflected an increase in the number of global services personnel from 107 employees as of September 30, 2011 to 124 employees as of September 30, 2012, resulting in a $2.2 million increase in compensation expenses and a $1.2 million increase in allocated overhead due to opening of new offices in Europe and Asia. We also experienced increases of $0.7 million in hosting costs and $0.6 million of depreciation and amortization expense, partially offset by a $0.2 million decrease in professional fees.
Our gross margin increased to 58% for the nine months ended September 30, 2012 from 45% for the same period in 2011. This increase was due to the achievement of greater operational efficiency from personnel dedicated to our cloud infrastructure and global services precipitated by upgraded functionality and capabilities delivered by our engineering team. Compensation for these personnel was 26% of revenues during the nine months ended September 30, 2012, as compared to 35% during the same period in 2011. Additional costs related to recruiting, travel and equipment expenses represented 2% of our revenues during the nine months ended September 30, 2012, as compared to 5% during the same period in 2011.
49
Table of Contents
Sales and Marketing
| Nine Months Ended September 30, |
Change | |||||||||||||||
| 2011 | 2012 | $ | % | |||||||||||||
| (dollars in thousands) | ||||||||||||||||
| Sales and marketing |
$ | 14,474 | $ | 23,615 | $ | 9,141 | 63 | % | ||||||||
| Percent of revenues |
59 | % | 56 | % | ||||||||||||
Sales and marketing expenses increased $9.1 million, or 63%, for the nine months ended September 30, 2012 as compared to the same period in 2011. The increase was primarily due to an increase in global sales and marketing headcount from 84 employees as of September 30, 2011 to 127 employees as of September 30, 2012, contributing to a $7.3 million increase in personnel-related costs, consisting primarily of increased employee compensation, benefits and travel costs associated with our sales force and including $0.4 million in stock-based compensation directly attributable to the redemption of common shares from an employee for an amount above the fair value at the time of the redemption. Allocated overhead increased $1.4 million due to opening of new offices in Europe and Asia. Marketing and event costs increased $0.3 million due to our continued efforts to generate sales leads and build brand awareness.
Research and Development
| Nine Months Ended September 30, |
Change | |||||||||||||||
| 2011 | 2012 | $ | % | |||||||||||||
| (dollars in thousands) | ||||||||||||||||
| Research and development |
$ | 5,027 | $ | 9,651 | $ | 4,624 | 92 | % | ||||||||
| Percent of revenues |
20 | % | 23 | % | ||||||||||||
Research and development expenses increased $4.6 million, or 92%, for the nine months ended September 30, 2012 as compared to the same period in 2011. This reflected an increase in the number of research and development personnel from 49 employees as of September 30, 2011 to 95 employees as of September 30, 2012, resulting in a $3.9 million increase in compensation expense. Included in this amount was $0.3 million in stock-based compensation directly attributable to the redemption of common shares from two employees for an amount above the fair value at the time of the redemption. Allocated overhead increased $0.8 million due to the increase in headcount. These increases were partially offset by a $0.2 million decrease in outside consulting services.
General and Administrative
| Nine Months Ended September 30, |
Change | |||||||||||||||
| 2011 | 2012 | $ | % | |||||||||||||
| (dollars in thousands) | ||||||||||||||||
| General and administrative |
$ | 4,132 | $ | 10,001 | $ | 5,869 | 142 | % | ||||||||
| Percent of revenues |
17 | % | 24 | % | ||||||||||||
General and administrative expenses increased $5.9 million, or 142%, for the nine months ended September 30, 2012, as compared to the same period in 2011. Our general and administrative headcount increased from 22 employees as of September 30, 2011 to 40 employees as of September 30, 2012. As a result, compensation expenses increased by $4.2 million as we added employees to support the growth of our business and as we prepared to become a public company. Included in this amount is $1.9 million in stock-based compensation directly attributable to the
50
Table of Contents
redemption of common shares from two employees for an amount above the fair value at the time of the redemption. Professional fees increased $1.4 million to support our global expansion and as we took certain steps to prepare ourselves to be a public company. Allocated overhead increased by $0.4 million due to the increase in headcount.
Other Expenses, Net
| Nine Months Ended September 30, |
Change | |||||||||||||||
| 2011 | 2012 | $ | % | |||||||||||||
| (dollars in thousands) | ||||||||||||||||
| Other expenses, net |
$ | (419 | ) | $ | (571 | ) | $ | (152 | ) | 36 | % | |||||
Other expenses, net primarily consists of foreign currency transaction gains and losses and interest expense. There were no significant changes in these expenses during the periods presented.
Provision for Income Taxes
| Nine Months Ended | ||||||||||||||||
| September 30, | Change | |||||||||||||||
| 2011 | 2012 | $ | % | |||||||||||||
| (dollars in thousands) | ||||||||||||||||
| Provision for income taxes |
$ | 96 | $ | 167 | $ | 71 | 74 | % | ||||||||
Provision for income taxes increased by approximately $0.1 million for the nine months ended September 30, 2012 as compared to the same period in 2011 as a result of increased profits generated in foreign jurisdictions by our wholly-owned subsidiaries.
Comparison of Years Ended December 31, 2010 and 2011
Revenues
| Years Ended December 31, |
Change | |||||||||||||||
| 2010 | 2011 | $ | % | |||||||||||||
| (dollars in thousands) | ||||||||||||||||
| Revenues |
$ | 19,005 | $ | 36,121 | $ | 17,116 | 90 | % | ||||||||
Revenues increased $17.1 million, or 90%, for 2011 as compared to 2010. During 2011, revenues increased due to new customers in all geographies and increased usage of our platform by existing customers. During 2011, we generated $8.1 million of revenue from new advertisers and $9.0 million of additional revenue from our existing advertisers. There were no customers that accounted for greater than 10% of our revenues in 2010 or 2011.
Revenues in 2011 from the United States and international locations represented 74% and 26%, respectively, of revenues, and in 2010, revenues from the United States and international locations represented 80% and 20%, respectively, of revenues.
51
Table of Contents
Cost of Revenues
| Years Ended December 31, |
Change | |||||||||||||||
| 2010 | 2011 | $ | % | |||||||||||||
| (dollars in thousands) | ||||||||||||||||
| Cost of revenues |
$ | 11,040 | $ | 18,691 | $ | 7,651 | 69 | % | ||||||||
| Gross profit |
7,965 | 17,430 | 9,465 | 119 | ||||||||||||
| Gross margin |
42 | % | 48 | % | ||||||||||||
Cost of revenues increased $7.7 million, or 69%, for 2011 as compared to 2010. This reflected an increase in the number of customer service personnel from 67 employees as of December 31, 2010 to 112 employees as of December 31, 2011, resulting in a $5.0 million increase in compensation expense, a $1.0 million increase in allocated overhead and a $0.2 million increase in travel costs. We also experienced increases of $0.7 million of depreciation and amortization expense, $0.3 million in hosting costs and $0.2 million in professional fees, primarily as a result of the overall increase in the size of the support operations.
Our gross margin increased to 48% during 2011 from 42% during 2010. This increase was primarily due to greater operational efficiency from personnel dedicated to our cloud infrastructure and global services. Compensation for these personnel was 33% of revenues during 2011, as compared to 37% during 2010. We also realized greater efficiency from our hosting costs and related equipment, the associated costs of which were 8% of revenues during 2011 as compared to 10% during 2010.
Sales and Marketing
| Years Ended December 31, |
Change | |||||||||||||||
| 2010 | 2011 | $ | % | |||||||||||||
| (dollars in thousands) | ||||||||||||||||
| Sales and marketing |
$ | 8,884 | $ | 20,357 | $ | 11,473 | 129 | % | ||||||||
| Percent of revenues |
47 | % | 56 | % | ||||||||||||
Sales and marketing expenses increased $11.5 million, or 129%, for 2011 as compared to 2010. This reflected the expansion of our sales force and increases in marketing programs to address additional opportunities in new and existing markets. The increase was primarily due to an increase in headcount from 47 employees as of December 31, 2010 to 93 employees as of December 31, 2011, contributing to an $8.7 million increase in personnel-related costs, consisting primarily of increased employee compensation, benefits and travel costs associated with our sales force. Marketing and event costs increased $1.5 million due to our continued efforts to generate sales leads and build brand awareness. Allocated overhead costs increased $0.9 million and recruiting costs increased $0.5 million as a result of increased headcount.
Research and Development
| Years Ended December 31, |
Change | |||||||||||||||
| 2010 | 2011 | $ | % | |||||||||||||
| (dollars in thousands) | ||||||||||||||||
| Research and development |
$ | 4,568 | $ | 7,071 | $ | 2,503 | 55 | % | ||||||||
| Percent of revenues |
24 | % | 20 | % | ||||||||||||
52
Table of Contents
Research and development expenses increased $2.5 million, or 55%, for 2011 as compared to 2010. This reflected an increase in the number of research and development personnel from 38 employees as of December 31, 2010 to 52 employees as of December 31, 2011, resulting in a $1.2 million increase in compensation, a $0.5 million increase in outside consulting services related to contract research and development services and a $0.1 million increase in recruiting fees. Allocated overhead costs increased $0.5 million as a result of our increased headcount. The increase was a result of our continued investment in expanding and enhancing our platform.
General and Administrative
| Years Ended December 31, |
Change | |||||||||||||||
| 2010 | 2011 | $ | % | |||||||||||||
| (dollars in thousands) | ||||||||||||||||
| General and administrative |
$ | 5,195 | $ | 6,679 | $ | 1,484 | 29 | % | ||||||||
| Percent of revenues |
27 | % | 18 | % | ||||||||||||
General and administrative expenses increased $1.5 million, or 29%, for 2011 as compared to 2010. General and administrative headcount increased from 14 employees as of December 31, 2010 to 28 employees as of December 31, 2011. As a result, compensation expenses increased by $0.6 million. Additionally, professional fees increased $1.1 million due to the establishment of several international wholly-owned subsidiaries.
Other Expenses, Net
| Years Ended December 31, |
Change | |||||||||||||||
| 2010 | 2011 | $ | % | |||||||||||||
| (in thousands) | ||||||||||||||||
| Other expenses, net |
$ | (152 | ) | $ | (607 | ) | $ | (455 | ) | * | ||||||
| * | Percentage is not meaningful. |
Other expenses, net primarily consisted of adjustments to the fair value of preferred stock warrants, foreign currency transaction gains and losses and interest expense. The increase of $0.5 million was primarily due to a $0.2 million increase in the loss from the adjustment of the fair value of an outstanding preferred stock warrant and a $0.2 million increase in interest expense as a result of additional borrowings under our credit facility.
Provision for Income Taxes
| Years Ended December 31, |
Change | |||||||||||||||
| 2010 | 2011 | $ | % | |||||||||||||
| (in thousands) | ||||||||||||||||
| Provision for income taxes |
$ | 23 | $ | 139 | $ | 116 | * | |||||||||
| * | Percentage is not meaningful. |
Provision for income taxes increased by $0.1 million for 2011 as compared to 2010 as a result of increased profits generated in foreign jurisdictions by our wholly-owned subsidiaries.
53
Table of Contents
Comparison of Years Ended December 31, 2010 and 2009
Revenues
| Years Ended December 31, |
Change | |||||||||||||||
| 2009 | 2010 | $ | % | |||||||||||||
| (dollars in thousands) | ||||||||||||||||
| Revenues |
$ | 7,527 | $ | 19,005 | $ | 11,478 | 152 | % | ||||||||
Revenues increased $11.5 million, or 152%, for 2010 as compared to 2009. During 2010, revenues increased due an increase in revenues from new and existing advertisers, resulting from their increase in advertising spend managed through the platform. During 2010, we generated $5.7 million of revenue from new advertisers and $5.8 million of additional revenue from our existing advertisers.
Revenues in 2010 from the United States and international locations represented 80% and 20%, respectively, of revenues, and in 2009, revenues from the United States and international locations represented 93% and 7%, respectively, of revenues.
Cost of Revenues
| Years Ended December 31, |
Change | |||||||||||||||
| 2009 | 2010 | $ | % | |||||||||||||
| (dollars in thousands) | ||||||||||||||||
| Cost of revenues |
$ | 5,101 | $ | 11,040 | $ | 5,939 | 116 | % | ||||||||
| Gross profit |
2,426 | 7,965 | 5,539 | 228 | ||||||||||||
| Gross margin |
32 | % | 42 | % | ||||||||||||
Cost of revenues increased $5.9 million, or 116%, for 2010 as compared to 2009. This reflected an increase in the number of customer service personnel from 25 employees as of December 31, 2009 to 67 employees as of December 31, 2010, resulting in a $4.0 million increase in compensation and travel expenses. We also experienced increases of $0.7 million of depreciation and amortization expense, $0.4 million in allocated overhead, primarily as a result of the overall increase in the size of the support operations, and $0.2 million in hosting costs.
Our gross margin increased to 42% during 2010 from 32% during 2009. This increase was primarily due to the achievement of greater operational efficiency from personnel dedicated to our cloud infrastructure and global services. Compensation for these personnel was 37% of revenues during 2010, as compared to 43% during 2009. We also realized greater efficiency from our hosting costs and related equipment, the associated costs of which were 10% of revenues during 2010 as compared to 12% during 2009. Additionally, professional fees incurred to support our infrastructure were 2% of revenue during 2010 as compared to 3% during 2009.
Sales and Marketing
| Years Ended December 31, |
Change | |||||||||||||||
| 2009 | 2010 | $ | % | |||||||||||||
| (dollars in thousands) | ||||||||||||||||
| Sales and marketing |
$ | 6,146 | $ | 8,884 | $ | 2,738 | 45 | % | ||||||||
| Percent of revenues |
82 | % | 47 | % | ||||||||||||
54
Table of Contents
Sales and marketing expenses increased $2.7 million, or 45%, for 2010 as compared to 2009. This reflected the expansion of our sales force and increases in marketing programs to address additional opportunities in new and existing markets. The increase was primarily due to an increase in headcount from 19 employees as of December 31, 2009 to 47 employees as of December 31, 2010, contributing to a $2.1 million increase in personnel-related costs, consisting primarily of increased employee compensation and travel costs associated with our sales force. Marketing and event costs increased $0.3 million due to our continued efforts to generate sales leads and build brand awareness. Allocated overhead increased $0.1 million due to our increase in headcount.
Research and Development
| Years Ended December 31, |
Change | |||||||||||||||
| 2009 | 2010 | $ | % | |||||||||||||
| (dollars in thousands) | ||||||||||||||||
| Research and development |
$ | 3,410 | $ | 4,568 | $ | 1,158 | 34 | % | ||||||||
| Percent of revenues |
45 | % | 24 | % | ||||||||||||
Research and development expenses increased $1.2 million, or 34%, for 2010 as compared to 2009. This reflected an increase in the number of research and development personnel from 26 employees as of December 31, 2009 to 38 employees as of December 31, 2010, resulting in a $1.5 million increase in compensation expenses. This increase was partially offset by a $0.1 million decrease in outside consulting services related to contract research and development services and in recruiting fees.
General and Administrative
| Years Ended December 31, |
Change | |||||||||||||||
| 2009 | 2010 | $ | % | |||||||||||||
| (dollars in thousands) | ||||||||||||||||
| General and administrative |
$ | 2,171 | $ | 5,195 | $ | 3,024 | 139 | % | ||||||||
| Percent of revenues |
29 | % | 27 | % | ||||||||||||
General and administrative expenses increased $3.0 million, or 139%, for 2010 as compared to 2009. Our general and administrative headcount increased from six employees as of December 31, 2009 to 14 employees as of December 31, 2010. As a result, personnel-related expenses increased by $1.9 million, consisting of increased employee compensation and travel costs, as we added employees to support the growth of our business. The 2010 amount includes $0.8 in stock-based compensation resulting from the repurchase of shares of common stock from one executive for an amount above the fair value at the time of the repurchase. Allocated overhead expenses increased $0.4 million and professional fees increased $0.1 million due to the establishment of the wholly-owned subsidiary in the United Kingdom. Additionally, a provision of $0.4 million was recorded in 2010 for unremitted and uncollected sales taxes from several U.S. state taxing authorities.
Other Expenses, Net
| Years Ended December 31, |
Change | |||||||||||||||
| 2009 | 2010 | $ | % | |||||||||||||
| (dollars in thousands) | ||||||||||||||||
| Other expenses, net |
$ | (304 | ) | $ | (152 | ) | $ | 152 | (50 | )% | ||||||
55
Table of Contents
Other expenses, net primarily consisted of adjustments to the fair value of preferred stock warrants, foreign currency transaction gains and losses and interest expense. The decrease of $0.2 million was primarily due to the adjustment of the fair value of an outstanding preferred stock warrant.
Provision for Income Taxes
| Years Ended December 31, |
Change | |||||||||||||||
| 2009 | 2010 | $ | % | |||||||||||||
| (dollars in thousands) | ||||||||||||||||
| Provision for income taxes |
$ | 103 | $ | 23 | $ | (80 | ) | (78 | )% | |||||||
Provision for income taxes decreased by $0.1 million for 2010 as compared to 2009 as a result of decreased profits generated by our wholly-owned subsidiary in the United Kingdom.
Liquidity and Capital Resources
Since our incorporation in March 2006, we have relied primarily on sales of our preferred stock to fund our operating activities. To date, we have raised $105.7 million, net of related issuance costs, in funding through private placements of our preferred stock and $2.8 million in proceeds from the exercise of options to purchase common stock. As of September 30, 2012, our principal sources of liquidity were our cash of $17.0 million and $1.2 million available under our revolving credit facility. In November 2012, we raised $19.9 million in proceeds, net of related issuance costs, from the sale of our Series F-1 preferred stock. Our primary operating cash requirements include the payment of compensation and related costs, as well as costs for our facilities and information technology infrastructure.
In January 2010, we entered into a loan and security agreement, which provided for a revolving line of credit and other term loans (the “Revolving Credit Facility”). In January 2011, we amended our Revolving Credit Facility to include an equipment advance facility of $2.0 million. In December 2011, we further amended our Revolving Credit Facility, which increased the revolving line of credit to the lesser of $10.0 million or 80% of our eligible accounts receivable and to provide us with an additional equipment advance facility of $2.0 million. With respect to the revolving line of credit, the expiration date was extended to July 10, 2013 and the annual interest rate was amended to 0.75% over the prime rate payable on a monthly basis. The equipment advance facilities may only be used to finance the purchase of eligible equipment. The equipment advance facilities accrue interest at a fixed per annum rate of 5.5% and are repayable in 36 consecutive monthly installments of principal and interest, with final payments due at various dates between December 2014 and August 2015.
The Revolving Credit Facility is collateralized with all of our assets, excluding shares of controlled foreign subsidiaries, patents and copyrights. The Revolving Credit Facility also contains various covenants, including covenants related to the delivery of financial and other information, the maintenance of monthly financial covenants, as well as limitations on dispositions, change in business or management, mergers or consolidations, dividends and other corporate activities. As of September 30, 2012, we were in compliance with all loan covenants.
As of September 30, 2012, we had $3.0 million and $7.2 million outstanding under our equipment advance facilities and revolving line of credit, respectively, and had $0 available for withdrawal under the equipment advance facilities. Additionally, as of September 30, 2012 we had a $0.5 million letter of credit outstanding relating to our office lease in New York.
In December 2012, we entered into another amendment to the Revolving Credit Facility pursuant to which amounts available for borrowing under the revolving line of credit increased to the lesser of
56
Table of Contents
$15.0 million or 80% of our eligible accounts receivable and to extend the expiration date to July 31, 2014. We also entered into an additional equipment advance facility of $3.0 million (the “Supplemental Equipment Advance”). The Supplemental Equipment Advance accrues interest at a fixed per annum rate of 3.0% and will be repayable in 33 consecutive monthly installments of principal and interest. The Supplemental Equipment Advance expires March 1, 2016. In connection with this amendment, we issued a warrant to purchase 26,513 shares of common stock at $12.15 per share to the lender. This warrant expires in November 2022.
To the extent existing cash and cash from operations are not sufficient to fund our future activities, we may need to raise additional funds. Although we are not currently a party to any agreement or letter of intent with respect to potential investments in, or acquisitions of, complementary businesses, services or technologies, we may enter into these types of arrangements in the future, which could also require us to seek additional equity financing or use our cash resources. We have no present understandings, commitments or agreements to enter into any such acquisitions.
Based on our current level of operations and anticipated growth, we believe that our existing sources of liquidity will be sufficient to fund our operations for at least the next 12 months. Our future capital requirements will depend on many factors, including our rate of revenue growth, the expansion of our sales and marketing activities, and the timing and extent of spending to support product development efforts and expansion into new territories, and the timing of introductions of new features and enhancements to our platform. To the extent that existing cash and cash equivalents and cash from operations are insufficient to fund our future activities, we may need to raise additional funds through public or private equity or debt financing.
Summary Cash Flows
The following table sets forth a summary of our cash flows for the periods indicated:
| Years Ended December 31, | Nine Months Ended September 30, |
|||||||||||||||||||
| 2009 | 2010 | 2011 | 2011 | 2012 | ||||||||||||||||
| (in thousands) | ||||||||||||||||||||
| Net cash used in operating activities |
$ | (9,622 | ) | $ | (9,775 | ) | $ | (16,490 | ) | $ | (13,328 | ) | $ | (13,778 | ) | |||||
| Net cash used in investing activities |
(1,150 | ) | (2,882 | ) | (3,360 | ) | (2,020 | ) | (5,971 | ) | ||||||||||
| Net cash provided by financing activities |
12,320 | 8,697 | 20,397 | 19,053 | 35,020 | |||||||||||||||
|
|
|
|
|
|
|
|
|
|
|
|||||||||||
| Net increase (decrease) in cash |
$ | 1,548 | $ | (3,960 | ) | $ | 547 | $ | 3,705 | $ | 15,271 | |||||||||
|
|
|
|
|
|
|
|
|
|
|
|||||||||||
Operating Activities
Cash used in operating activities is primarily influenced by the amount of cash we invest in personnel and infrastructure to support the anticipated growth of our business and the increase in the number of advertisers using our platform. Cash used in operating activities has typically been generated from net losses and further increased by changes in our operating assets and liabilities, particularly in the areas of accounts receivable and accrued liabilities, adjusted for non-cash expense items such as depreciation, amortization and stock-based compensation.
Cash used in operating activities for the nine months ended September 30, 2012 of $13.8 million was the result of a net loss of $19.2 million, offset by non-cash expenses of $7.3 million, which included depreciation, amortization and stock-based compensation expense. These non-cash expenses increased due to capital expenses and headcount growth, primarily related to continued investment in our business. The remaining use of funds of $1.9 million was from the net change in working capital items, most notably an increase in accounts receivable of $2.9 million resulting from
57
Table of Contents
our revenue growth and an increase in prepaid expenses and other current assets of $0.8 million primarily related to the timing of payments for insurance premiums and software subscriptions. These were partially offset by an increase in accounts payable and accrued liabilities of $1.5 million and $0.4 million, respectively, related to the growth of our operations and timing of compensation and other general expenses.
Cash used in operating activities for the nine months ended September 30, 2011 of $13.3 million was the result of a net loss of $13.0 million, offset by non-cash expenses of $2.0 million, which included depreciation, amortization and stock-based compensation expense. These non-cash expenses increased due to capital expenses and headcount growth, primarily related to continued investment in our business. The remaining use of funds of $2.3 million was from the net change in working capital items, most notably an increase in accounts receivable of $3.7 million resulting from our revenue growth, partially offset by an increase in accrued liabilities of $1.8 million related to the growth of our operations and timing of compensation and other general expenses.
Cash used in operating activities in 2011 of $16.5 million was the result of a net loss of $17.4 million, offset by non-cash expenses of $3.2 million, which included depreciation, amortization and stock-based compensation expense. These non-cash expenses increased due to capital expenses and headcount growth, primarily related to continued investment in our business. The remaining use of funds of $2.3 million was from the net change in working capital items, most notably an increase in accounts receivable of $5.5 million resulting from our revenue growth, partially offset by an increase in accrued liabilities of $3.5 million related to the growth of our operations and the timing of compensation and other general expenses.
Cash used in operating activities in 2010 of $9.8 million was the result of a net loss of $10.9 million, offset by non-cash expenses of $2.7 million which included depreciation, amortization and stock-based compensation expense. These non-cash expenses increased due to capital expenses and headcount growth, primarily related to continued investment in our business. The remaining use of funds of $1.6 million was from the net change in working capital items, most notably an increase in accounts receivable of $3.3 million resulting from our revenue growth and an increase in prepaid expenses and other current assets of $0.5 million primarily related to software subscription purchases. These items were partially offset by an increase in accrued liabilities and accounts payable of $1.5 million and $0.6 million, respectively, related to the growth of our operations and the timing of compensation and other general expenses.
Cash used in operating activities in 2009 of $9.6 million was the result of a net loss of $9.7 million, offset by non-cash expenses of $0.8 million which included depreciation, amortization and stock-based compensation expense. These non-cash expenses increased due to capital expenses and headcount growth, primarily related to continued investment in our business. The remaining use of funds of $0.7 million was from the net change in working capital items, most notably an increase in accounts receivable of $1.2 million resulting from our revenue growth, partially offset by an increase in accrued liabilities of $0.7 million related to the growth of our operations and timing of compensation and other general expenses.
Investing Activities
During 2009, 2010 and 2011 and the nine months ended September 30, 2011 and 2012, investing activities consisted of purchases of property and equipment, including technology hardware and software to support our growth as well as capitalized internal-use software development costs. Purchases of property and equipment may vary from period-to-period due to the timing of the expansion of our operations and the development cycles of our internal-use hosted software platform. We expect to continue to invest in property and equipment and developing our software platform for the foreseeable future.
58
Table of Contents
Financing Activities
Our financing activities have consisted primarily of the issuance of preferred stock purchases of common stock, and borrowings and repayments under our credit facility.
Cash provided by financing activities for the nine months ended September 30, 2012 was $35.0 million. This consisted of $34.3 million of net proceeds from the issuance of our Series F preferred stock, $1.9 million of proceeds from the exercise of stock options and issuance of common stock, and net borrowings under our credit facility of $3.3 million during this period. These inflows were partially offset by $4.5 million paid to redeem common stock during the period.
Cash provided by financing activities for the nine months ended September 30, 2011 was $19.1 million. This consisted of $15.9 million of net proceeds from the issuance of our Series E preferred stock, $0.5 million of proceeds from the exercise of stock options and net borrowings under our credit facility of $2.6 million during this period.
Cash provided by financing activities in 2011 was $20.4 million. This consisted of $15.9 million of net proceeds from the issuance of our Series E preferred stock, $3.5 of net proceeds from activity under our credit facility and $0.9 million from the exercise of employee stock options and common stock warrants.
Cash provided by financing activities in 2010 was $8.7 million. This consisted of $7.8 million of net proceeds from the issuance of our Series D preferred stock, $0.4 of net proceeds from activity under our credit facility and $0.5 million from the exercise of employee stock options.
Cash provided by financing activities in 2009 was $12.3 million. This consisted of proceeds from the sales of our Series C preferred stock of $12.9 million, partially offset by repayment of credit facility borrowings of $0.6 million.
In November 2012, we issued 1,478,064 shares of Series F-1 preferred stock at a price of $13.5312 per share for net proceeds of approximately $19.9 million through a private placement with existing stockholders.
Contractual Obligations and Commitments
Our principal commitments consist of obligations under operating leases for office space and our data center. As of December 31, 2011, the future minimum payments under these commitments, as well as obligations under our credit facility, were as follows:
| Payments Due By Period | ||||||||||||||||||||
| Total | Less Than 1 Year |
1 - 3 Years |
3 - 5 Years |
More Than 5 Years |
||||||||||||||||
| (in thousands) | ||||||||||||||||||||
| Debt obligations |
$ | 6,882 | $ | 1,447 | $ | 5,331 | $ | 104 | $ | — | ||||||||||
| Interest expense payments |
241 | 138 | 102 | 1 | — | |||||||||||||||
| Operating leases |
3,524 | 1,645 | 1,879 | — | — | |||||||||||||||
|
|
|
|
|
|
|
|
|
|
|
|||||||||||
| Total |
$ | 10,647 | $ | 3,230 | $ | 7,312 | $ | 105 | $ | — | ||||||||||
|
|
|
|
|
|
|
|
|
|
|
|||||||||||
The amounts in the table above are associated with agreements that are enforceable and legally binding, which specify significant terms including payment terms, related services and the approximate timing of the transaction. Obligations under contracts that we can cancel without a significant penalty are not included in the table.
59
Table of Contents
In 2012, we entered into new office leases in Portland, San Francisco, Chicago and New York. The lease arrangements are noncancelable and expire in December 2014, March 2015, October 2015, and July 2017, respectively.
During the ordinary course of business, we include indemnification provisions within certain of our contracts. Pursuant to these arrangements, we may be obligated to indemnify, hold harmless and agree to reimburse the indemnified party for losses suffered or incurred by the indemnified party, generally parties with which we have commercial relations, in connection with certain intellectual property infringement claims by any third party with respect to our software. To date, there have not been any costs incurred in connection with such indemnification arrangements and therefore, there is no accrual for such amounts as of December 31, 2011 and September 30, 2012.
Off-Balance Sheet Arrangements
During the periods presented, we did not have, nor do we currently have, any relationships with unconsolidated entities or financial partnerships, such as entities often referred to as structured finance or special purpose entities, which would have been established for the purpose of facilitating off-balance sheet arrangements or other contractually narrow or limited purposes. We are therefore not exposed to any financing, liquidity, market or credit risk that could arise if we had engaged in those types of relationships.
Critical Accounting Policies and Significant Judgments and Estimates
Our management’s discussion and analysis of financial condition and results of operations is based on our consolidated financial statements, which have been prepared in accordance with accounting principles generally accepted in the United States. The preparation of these consolidated financial statements requires us to make estimates and assumptions that affect the reported amounts of assets and liabilities and the disclosure of contingent assets and liabilities at the date of the consolidated financial statements, as well as the reported revenues and expenses during the reporting periods. These items are monitored and analyzed by us for changes in facts and circumstances, and material changes in these estimates could occur in the future.
We base our estimates on historical experience and on various other assumptions that we believe to be reasonable under the circumstances, the results of which form the basis for making judgments about the carrying values of assets and liabilities. If actual results or events differ materially from those contemplated by us in making these estimates, our reported financial condition and results of operations for future periods could be materially affected. See “Risk Factors” for certain matters that may affect these estimates or our future financial condition or results of operations. An accounting policy is deemed to be critical if it requires an accounting estimate to be made based on assumptions about matters that are uncertain at the time the estimate is made, if different estimates reasonably could have been used, or if the changes in estimate that are reasonably likely to occur could materially impact the financial statements.
Our significant accounting policies are described in Note 2 to the consolidated financial statements included in this prospectus, and we believe that the accounting policies discussed below involve the greatest degree of complexity and exercise of judgment by our management. The methods, estimates and judgments that we use in applying our accounting policies have a significant impact on our results of operations and, accordingly, we believe the policies described below are the most critical for understanding and evaluating our financial condition and results of operations.
60
Table of Contents
Revenue Recognition
We generate revenues principally from subscriptions to our platform pursuant to our contracts that are generally six months to one year in length. Our subscription fee under most contracts is variable based on the value of the advertising spend that our advertisers manage through the platform. Some of our contracts also include a minimum monthly fee that is payable over the duration of the contract. Our customer does not have the right to take possession of the software supporting the application service at any time, nor do the arrangements contain general rights of return. We commence revenue recognition when all of the following conditions are met:
| Ÿ | persuasive evidence of an arrangement exists; |
| Ÿ | our platform is made available to the customer; |
| Ÿ | the fee is fixed or determinable, and; |
| Ÿ | collection is reasonably assured. |
We account for these arrangements by recognizing the total monthly minimum fee, where applicable, over the duration of the contract, commencing on the date that our service is made available to the customer, provided revenues recognized do not exceed amounts that are invoiced and due. The variable fee, which is based on a percentage of the value of the advertising spend managed through our platform, is recognized once the amount is fixed or determinable, which is generally on a monthly basis concurrent with the issuance of the customer invoice. Signed contracts are used as evidence of an arrangement. We assess collectability based on a number of factors such as past collection history with the customer and creditworthiness of the customer. If we determine collectability is not reasonably assured, we defer the revenue recognition until collectability becomes reasonably assured.
In October 2009, the Financial Accounting Standards Board, or FASB, ratified authoritative accounting guidance regarding revenue recognition for arrangements with multiple deliverables effective for fiscal periods beginning on or after June 15, 2010. We adopted the new guidance on a prospective basis for fiscal 2011. Professional services and training, when sold with our platform subscription services, are accounted for separately when those services have standalone value. In determining whether professional services and training services can be accounted for separately from subscription services, we consider the following factors: availability of the services from other vendors, the nature of the services; the dependence of the subscription services on the customer’s decision to buy the professional services; and whether we sell our subscription services without professional services. If the deliverables have stand-alone value, we account for each deliverable separately and revenues are recognized for the respective deliverables as they are delivered. If one or more of the deliverables do not have stand-alone value, the deliverables that do not have stand-alone value are combined with the final deliverables within the arrangement and treated as a single unit of accounting. Revenues for arrangements treated as a single unit of accounting are recognized over the period of the contract commencing upon delivery of the final deliverable. As of September 30, 2012, we did not have stand-alone value for the professional services and training services. This is because we include professional services and training services with our subscription services and those services are not available from other vendors.
Stock-Based Compensation
We measure and recognize expense for stock-based compensation based on the grant date fair value of the award and generally recognize the expense, net of estimated forfeitures, on a straight-line basis over the requisite service period.
Because our stock is not publicly traded, we must estimate the fair value of our common stock for purposes of determining the fair value of our option awards, as discussed in “—Valuations of Common
61
Table of Contents
Stock” below. Determining the fair value of stock-based awards at the grant date requires judgment. We use the Black-Scholes option pricing model to determine the fair value of our stock option awards. The determination of the grant date fair value of our stock option awards using an option pricing model is affected by the estimated fair value per share of the common stock underlying those options as well as assumptions regarding a number of other complex and subjective variables. These variables include our expected stock price volatility over the expected term of the options, stock option exercise and cancellation behaviors, risk-free interest rates and expected dividends, which are estimated as follows:
| Ÿ | Expected Volatility. Because we do not have a trading history for our common stock, we have estimated the expected stock price volatility for our common stock by taking the average historic price volatility for industry peers based on daily price observations over a period equivalent to the expected term of the stock option grants. Industry peers consist of public companies in the technology industry, primarily in the subscription software business. We intend to continue to consistently apply this process using the same or similar public companies until a sufficient amount of historical information regarding the volatility of our own common stock share price becomes available, or unless circumstances change such that the identified companies are no longer similar to us, in which case, more suitable companies whose share prices are publicly available would be utilized in the calculation. |
| Ÿ | Risk-Free Interest Rate. The risk-free interest rate assumption used is based on observed market interest rates appropriate for the term of employee options. |
| Ÿ | Expected Term. We estimated the expected term for a “plain vanilla” option using the simplified method allowed under current guidance, which uses the midpoint between the graded vesting period and the contractual termination date since we do not have sufficient historical exercise data to provide a reasonable basis upon which to estimate the expected term. |
| Ÿ | Dividend Yield. We have never declared or paid any cash dividends and do not presently plan to pay cash dividends in the foreseeable future. Consequently, we used an expected dividend yield of zero. |
We used the following assumptions in our application of the Black-Scholes option pricing model for the periods presented in the table below:
| Years Ended December 31, | Nine Months Ended September 30, |
|||||||||||||||||||
| 2009 | 2010 | 2011 | 2011 | 2012 | ||||||||||||||||
| Dividend yield |
0 | % | 0 | % | 0 | % | 0 | % | 0 | % | ||||||||||
| Expected volatility |
52 | % | 49 | % | 57 | % | 57 | % | 57 | % | ||||||||||
| Risk-free interest rate |
2.52 | % | 1.83 | % | 2.02 | % | 2.02 | % | 0.97 | % | ||||||||||
| Expected term (in years) |
5.96 | 5.92 | 6.25 | 6.25 | 6.25 | |||||||||||||||
In addition, ASC 718 requires forfeitures to be estimated at the time of grant and revised, if necessary, in subsequent periods if actual forfeitures differ from those estimates. We apply an estimated forfeiture rate based on our historical forfeiture experience.
Future expense amounts for any particular period could be affected by changes in our assumptions or changes in market conditions.
62
Table of Contents
Stock-based compensation expense included in the consolidated financial statement line items is as follows:
| Years Ended December 31, | Nine Months Ended September 30, |
|||||||||||||||||||
| 2009 | 2010 | 2011 | 2011 | 2012 | ||||||||||||||||
| (in thousands) | ||||||||||||||||||||
| Cost of revenues |
$ | 66 | $ | 90 | $ | 165 | $ | 119 | $ | 292 | ||||||||||
| Sales and marketing |
81 | 66 | 226 | 162 | 817 | |||||||||||||||
| Research and development |
26 | 58 | 163 | 120 | 648 | |||||||||||||||
| General and administrative |
19 | 1,172 | 143 | 82 | 2,490 | |||||||||||||||
|
|
|
|
|
|
|
|
|
|
|
|||||||||||
| $ | 192 | $ | 1,386 | $ | 697 | $ | 483 | $ | 4,247 | |||||||||||
|
|
|
|
|
|
|
|
|
|
|
|||||||||||
Costs for equity instruments issued in exchange for the receipt of goods or services from non-employees are measured at the fair market value of the consideration received or the fair value of the equity instruments issued, whichever is more reliably measurable. The value of equity instruments issued for consideration other than employee services is determined on the earlier of the date on which there first exists a firm commitment for performance by the provider of goods or services or on the date performance is complete, using the Black-Scholes option pricing model.
Valuations of Common Stock
We are required to estimate the fair value of the common stock underlying our share-based awards when performing the fair value calculations with the Black-Scholes option-pricing model. The fair value of the common stock underlying our share-based awards was determined by our board of directors, with input from management and contemporaneous third-party valuations. We believe that our board of directors has the relevant experience and expertise to determine the fair value of our common stock. Our board of directors determined the fair value of our common stock on the date of grant based on a number of factors including:
| Ÿ | our performance, growth rate and financial condition at the approximate time of the option grant; |
| Ÿ | the value of companies that we consider peers based on a number of factors including, but not limited to, similarity to us with respect to industry, business model, stage of growth, financial risk or other factors; |
| Ÿ | changes in our business and our prospects since the last time the board approved option grants and made a determination of fair value; |
| Ÿ | amounts recently paid by investors for our convertible preferred stock in arm’s-length transactions; |
| Ÿ | the rights, preferences and privileges of preferred stock relative to those of our common stock; |
| Ÿ | future financial projections; and |
| Ÿ | valuation analyses. |
For the periods presented, valuations of our common stock were determined in accordance with the guidelines outlined in the American Institute of Certified Public Accountants Practice Aid, Valuation of Privately-Held-Company Equity Securities Issued as Compensation. In valuing our common stock, our board of directors determined the equity value of our business generally using the income approach and market comparable approach valuation methods. When applicable, due to a recent preferred stock offering, the prior sale of company stock method was also utilized. The income approach estimates value based on the expectation of future cash flows that a company will generate, such as cash earnings, cost savings, tax deductions and the proceeds from a disposition. These future cash flows are discounted to their present values using a discount rate derived from an analysis of the cost of capital of comparable
63
Table of Contents
publicly traded companies in our industry or similar lines of business as of each valuation date and is adjusted to reflect the risks inherent in our cash flows. In addition, we also considered an appropriate discount adjustment to recognize the lack of marketability due to being a closely held entity.
The market comparable approach estimates value based on a comparison of the subject company to comparable public companies in a similar line of business. From the comparable companies, a representative market value multiple is determined and then applied to the subject company’s operating results to estimate the value of the subject company. In our valuations, the multiple of the comparable companies was determined using a ratio of the market value of invested capital less cash to each of the last twelve month revenues and the forecasted future twelve month revenues. The estimated value was then discounted by a non-marketability factor due to the fact that stockholders of private companies do not have access to trading markets similar to those enjoyed by stockholders of public companies which impacts liquidity. To determine our peer group of companies, we considered public enterprise cloud-based application providers and selected those that are similar to us in size, stage of life cycle and financial leverage.
The prior sales of company stock method estimates value by considering any prior arm’s length sales of the subject company’s equity. When considering prior sales of the company’s equity, the valuation considers the size of the equity sale, the relationship of the parties involved in the transaction, the timing of the equity sale, and the financial condition of the company at the time of the sale.
In some cases, we considered the amount of time between the valuation date and the grant date to determine whether to use the latest common stock valuation determined pursuant to one of the methods described above or a straight-line calculation between the two valuation dates. This determination included an evaluation of whether the subsequent valuation indicated that any significant change in the valuation had occurred between the previous valuation and the grant date.
Once we determined an equity value, we used the option pricing method, or OPM, to allocate the equity value to each of our classes of stock. OPM values each equity class by creating a series of call options on our equity value, with exercise prices based on the liquidation preferences, participation rights, and strike prices of the derivatives. This method is generally preferred when future outcomes are difficult to predict and dissolution or liquidation is not imminent. Starting in December 2011, due to greater clarity on potential exit scenarios, we generally began using the Probability Weighted Expected Return Method, or PWERM, to allocate our equity value among the various outcomes.
Using the PWERM, the value of our common stock is estimated based upon an analysis of varying values for our common stock assuming the following possible future events for our company:
| Ÿ | Initial public offering, or IPO; |
| Ÿ | Sale or merger; |
| Ÿ | Continuing as a private company; or |
| Ÿ | Bankruptcy or liquidation. |
For these possible events, a range of equity values is estimated based on a number of factors, which include market and income valuation approaches that factor in revenue multiples based on the performance of our public company comparables, along with estimates by, and expectations of, our board of directors and management. For each equity value scenario, we determined the appropriate aggregate value to be allocated to holders of our shares of common stock based on the rights and preferences of each class and series of our stock at that time. Next, we estimated the timing of possible future event dates and applied a discount rate, based on our estimated weighted average cost of capital, to the future equity values in the initial public offering and sale or merger scenarios to
64
Table of Contents
account for the time-value of money. We then multiplied the discounted value of common stock under each scenario by an estimated probability for each of the possible events, resulting in a probability-weighted value per share of common stock. Finally, we applied a discount for lack of marketability to the weighted value per share to determine a value per common share. As noted, application of this approach involves the use of estimates, judgment and assumptions, such as future cash flows and selection of comparable companies. Changes in our assumptions or the interrelationship of those assumptions impacted the valuations as of each valuation date.
Upon adoption of the PWERM in December 2011, we assigned an increasing probability to the initial public offering scenario at each valuation date than the other scenarios, assuming a 35% probability beginning December 31, 2011 and increasing substantially to 70% in September 2012 and 75% in December 2012. We have assumed a higher probability of an initial public offering because of our belief that consummating an initial public offering will increase awareness of our company among potential customers and improve our competitive position, thereby facilitating growth.
When considering comparable public companies for the purposes of valuing our common stock, from January 28, 2011 through September 30, 2012, we utilized comparable company sets, adjusted to remove companies sold or merged during the periods and add comparable companies that had completed initial public offerings. This set was primarily composed of technology companies that operated a subscription-based business. We believed these companies had cost structures generally similar to our own and we therefore believed these companies were comparable to us for the purposes of valuing our common stock. We evaluated our set of comparable companies as of each valuation date, particularly with respect to valuation in the initial public offering scenario. All the material factors considered as of each option grant date are explained below.
The following table summarizes, by grant date, information regarding stock options granted from January 1, 2011:
| Option Grant Dates |
Number of Shares Subject to Options Granted |
Exercise Price Per Share |
Common Stock Fair Value Per Share on Grant Date |
|||||||||
| January 28, 2011 |
767,718 | $ | 2.39 | $ | 2.39 | |||||||
| May 26, 2011 |
348,389 | 2.70 | 2.70 | |||||||||
| August 26, 2011 |
282,556 | 2.70 | 3.98 | |||||||||
| February 8, 2012 |
161,486 | 5.20 | 5.20 | |||||||||
| March 11, 2012 |
34,000 | 5.20 | 5.20 | |||||||||
| May 8, 2012 |
1,208,388 | 7.05 | 7.05 | |||||||||
| June 1, 2012 |
117,500 | 7.05 | 7.55 | |||||||||
| September 14, 2012 |
293,887 | 7.55 | 10.20 | |||||||||
| September 25, 2012 |
20,000 | 7.55 | 10.20 | |||||||||
| December 10, 2012 |
211,000 | 12.15 | 12.15 | |||||||||
| January 31, 2013 |
963,089 | 12.15 | 12.15 | |||||||||
Based on an assumed initial public price of $ per share, the midpoint of the price range set forth on the cover page of this prospectus, the aggregate intrinsic value of stock options outstanding as of September 30, 2012 was $ million, of which $ million related to vested options.
65
Table of Contents
Valuation inputs
January 28, 2011. In estimating the fair value of our common stock to set the exercise price of such options, our board of directors considered a contemporaneous valuation analysis for our common stock. The valuation analysis reflected a fair value for our common stock of $2.39. The primary valuation considerations were:
| Ÿ | an enterprise value determined from a weighted average of the market-based approach (50% weighting), income approach (25% weighting) and the implied enterprise value based upon the Series D preferred stock issuance which closed in May 2010 (25% weighting); |
| Ÿ | the market-based approach utilized a mean peer group multiple of 2.2x trailing 12 months’ revenues; |
| Ÿ | the income approach utilized a terminal value earnings multiple of 10.5x; |
| Ÿ | a discount rate of 38%, based on our estimated weighted average cost of capital; and |
| Ÿ | a lack of marketability discount of 37%. |
May 26, 2011. In estimating the fair value of our common stock to set the exercise price of such options, our board of directors reviewed and considered a contemporaneous valuation analysis for our common stock. The valuation analysis reflected a fair value for our common stock of $2.70. The primary valuation consideration was an enterprise value derived from the arm’s length Series E preferred stock financing completed at $9.19 per share in March 2011. Our indicated enterprise value was allocated to the shares of preferred stock, common stock, warrants and options using an option pricing method, or OPM. The OPM utilized the following assumptions: a time to liquidity event of two years; a risk free rate of 0.71%; and volatility of 60% over the time to a liquidity event. Estimates of the volatility of our common stock were based on available information on the volatility of common stock of comparable, publicly traded companies.
August 26, 2011. At the time our board of directors approved the option grants, our most recent valuation analysis indicated a fair value of $2.70 per share. Our board of directors set the exercise price per share at $2.70, consistent with the indicated fair value reflected in the valuation analysis. Subsequently, a valuation analysis was completed in early 2012 that indicated a fair value per share of common stock of $5.20. We considered that both valuation analyses had similar proximity relative to the August 26, 2011 grant date and that the latter report estimated a significant change in value during the interim time period. Therefore, in connection with the preparation of our 2011 financial statements, we reassessed, for financial reporting purposes, the estimate of fair value per share for the August 26, 2011 grants. We applied a straight-line calculation using the valuation of $2.70 per share as of May 26, 2011 and $5.20 as of February 8, 2012, the date at which our next valuation was used for granting new options.
February 8, 2012. In estimating the fair value of our common stock to set the exercise price of such options as of February 8, 2012, our board of directors reviewed and considered a contemporaneous valuation analysis for our common stock. The valuation analysis reflected a fair value for our common stock of $5.20. The primary valuation consideration was an enterprise value derived from the arm’s length Series F preferred stock financing completed at $12.30 per share in January 2012. Our indicated enterprise value was allocated to the shares of preferred stock, common stock, warrants and options using the OPM. The OPM utilized the following assumptions: a time to liquidity event of 1.5 years; a risk free rate of 0.19%; and volatility of 60% over the time to a liquidity event. Estimates of the volatility of our common stock were based on available information on the volatility of common stock of comparable, publicly traded companies. Additionally, we considered the potential outcome under an IPO scenario. For an IPO scenario, the value was estimated based on a multiple of our forecasted 2013 revenues. The value was discounted to the present value using a 20% rate of return over a 1.5 year holding period. This value was then adjusted downward by 28.5% to reflect a lack of marketability of our common stock. The final valuation assigned a 65% weighting to the OPM value and a 35% weighting to the IPO value.
66
Table of Contents
In conjunction with our Series F preferred stock financing closed in January 2012, we sold 2,804,788 shares of our Series F preferred stock at $12.30 per share for gross proceeds of $34.5 million. Concurrently with the issuance of the preferred stock, we repurchased 365,008 shares of common stock from a group of employees including our Chief Executive Officer for aggregate consideration of $4.5 million. We determined that the per share repurchase price of the common stock of $12.30 was above the fair value for shares of our common stock of $5.20 per share at the time of the repurchase. Therefore, we recognized $2.6 million of stock-based compensation expense from this transaction during the first quarter of 2012.
March 11, 2012. Given that the option grant made on March 11, 2012 occurred approximately 30 days after the option grant made on February 8, 2012 and that there were no significant changes to the business or our prospects during this period, we used the same analysis in assessing the fair value of our common stock as of March 11, 2012 that we did for our assessment as of February 8, 2012.
May 8, 2012. In estimating the fair value of our common stock to set the exercise price of such options, our board of directors reviewed and considered a contemporaneous valuation analysis for our common stock. The valuation analysis reflected a fair value for our common stock of $7.05, an increase from the fair value of our common stock on March 11, 2012 resulting, in part, from the continued growth and financial performance of our business. During the three months ended March 31, 2012, our revenues grew 14% and our gross profit increased 24% sequentially. Additionally, we continued to rapidly expand our employee base, increasing headcount to 302 as of March 31, 2012, a 6% increase compared to December 31, 2011. The primary valuation considerations were:
| Ÿ | the valuation reflected a 40% probability of an IPO, 30% probability of remaining a private company, 25% probability of a strategic merger or sale, and 5% probability of dissolution; |
| Ÿ | a fourteen month time to liquidity in the IPO scenario and a two year holding period in the strategic merger or sale scenario; |
| Ÿ | the market-based approach utilized mean peer group multiples of 4.5x trailing twelve months’ revenue and 3.2x projected twelve months’ revenue; |
| Ÿ | the income approach utilized a terminal value earnings multiple of 18.0x; |
| Ÿ | a discount rate of 25%, based on our estimated weighted average cost of capital; and |
| Ÿ | a lack of marketability discount of 24%. |
June 1, 2012. At the time our board of directors approved the option grants, our most recent valuation analysis indicated a fair value of $7.05 per share. Our board of directors set the exercise price per share at $7.05, consistent with the indicated fair value reflected in the valuation analysis. However, shortly thereafter, another contemporaneous valuation analysis was finalized and reflected a fair value for our common stock of $7.55. Therefore, for financial reporting purposes, we utilized the latter analysis as it better reflected our valuation considerations as of the grant date. The primary valuation considerations were:
| Ÿ | the valuation reflected a 60% probability of an IPO, 20% probability of remaining a private company, 15% probability of a strategic merger or sale, and 5% probability of dissolution; |
| Ÿ | a fifteen month holding period in the IPO scenario and a 1.5 year holding period in the strategic merger or sale scenario; |
| Ÿ | the market-based approach utilized mean peer group multiples of 4.0x trailing twelve months’ revenue and 2.8x projected twelve months’ revenue. This decrease as compared to the previous valuation was representative of the general decrease in valuations of the peer group companies during this period; |
67
Table of Contents
| Ÿ | the income approach utilized a terminal value earnings multiple of 18.0x; |
| Ÿ | a discount rate of 20%, based on our estimated weighted average cost of capital; |
| Ÿ | a lack of marketability discount of 24%; and |
| Ÿ | while our financial forecast reflected a longer time period until achieving sustained profitability relative to the forecast used to value the May 8, 2012 grants, the increase in the fair value of our common stock as compared to the prior valuation resulted principally from the increased probability of an initial public offering as we undertook activities in this area. |
September 14, 2012 and September 25, 2012. At the time our board of directors approved the option grants, our most recent valuation analysis indicated a fair value of $7.55 per share. Our board of directors set the exercise price per share at $7.55, consistent with the indicated fair value reflected in the valuation analysis. However, shortly thereafter, another contemporaneous valuation analysis was finalized and reflected a fair value for our common stock of $10.20. Therefore, for financial reporting purposes, we utilized the latter analysis as it better reflected our valuation considerations as of the grant date. Given that the September 14, 2012 and September 25, 2012 grants occurred within a span of eleven days and there were no material changes to the business during that time, we used the same sets of assumptions in assessing the valuation for both dates. The increase from the fair value of our common stock on June 1, 2012 resulted, in part, from the continued growth and financial performance of our business, our progress made towards a potential IPO and an increase in the probability of an IPO relative to other exit alternatives. During the three months ended September 30, 2012, our revenues grew 10% and our gross profit increased 12% sequentially. Additionally, we continued to rapidly expand our employee base, increasing headcount to 386 as of September 30, 2012, an 8% increase compared to June 30, 2012. The primary valuation considerations were:
| Ÿ | the valuation reflected a 70% probability of an IPO, 15% probability of remaining a private company, 10% probability of a strategic merger or sale and 5% probability of dissolution; |
| Ÿ | a twelve month holding period in the IPO scenario and a 1.5 year holding period in the strategic merger or sale scenario; |
| Ÿ | a discount rate of 20%, based on our estimated weighted average cost of capital; |
| Ÿ | the market-based approach utilized mean peer group multiples of 4.3x trailing twelve months’ revenue and 3.4x projected twelve months’ revenue; |
| Ÿ | the income approach utilized a terminal value earnings multiple of 14.0x. This terminal value is lower than that reflected in the previous valuation due to higher growth and profit margins over the projection period; and |
| Ÿ | a lack of marketability discount of 24%. |
December 10, 2012 and January 31, 2013. In estimating the fair value of our common stock to set the exercise price of such options, our board of directors reviewed and considered a contemporaneous valuation analysis for our common stock. Given that the December 10, 2012 and January 31, 2013 grants occurred in close proximity and there were no material changes to the business during that time, we used the same sets of assumptions in assessing the valuation for both dates. The valuation analysis reflected a fair value for our common stock of $12.15, an increase from the fair value of our common stock on September 25, 2012 resulting, in part, from the continued growth and financial performance of our business, our progress made towards a potential IPO and the closing of our Series F-1 preferred stock financing. Our revenues continued to increase month over month consistent with management’s expectations and we achieved our highest monthly revenues to date during the month of November 2012. We continued to rapidly expand our employee base, increasing
68
Table of Contents
headcount to 424 as of November 30, 2012, a 10% increase compared to September 30, 2012. Additionally, in November 2012, we closed our Series F-1 preferred stock financing. The primary valuation considerations were:
| Ÿ | the valuation reflected a 75% probability of an IPO, 15% probability of remaining a private company and 10% probability of a strategic merger or sale; |
| Ÿ | the value under the IPO scenario was estimated by applying a 10% premium above the enterprise value implied from the Series F-1 preferred stock financing completed in November 2012; |
| Ÿ | a ten month holding period in the IPO scenario and a one year holding period in the strategic merger or sale scenario; |
| Ÿ | a discount rate of 20%, based on our estimated weighted average cost of capital; |
| Ÿ | the market-based approach utilized mean peer group multiples of 4.5x trailing twelve months’ revenue and 3.4x projected twelve months’ revenue; |
| Ÿ | the income approach utilized a terminal value earnings multiple of 14.0x; and |
| Ÿ | a lack of marketability discount of 20%, which was lower than the rate utilized in the previous valuation as we decreased the expected time to liquidity. |
Provision for Income Taxes
As a result of our current net operating loss position in the United States, income tax expense consists primarily of corporate income taxes resulting from profits generated in foreign jurisdictions by wholly-owned subsidiaries, along with state income taxes payable in the United States. As we have incurred operating losses in all periods to date and recorded a full valuation allowance against our deferred tax assets, we have not historically recorded a provision for federal income taxes. Realization of any of our deferred tax assets depends upon future earnings, the timing and amount of which are uncertain. We consider all available evidence, both positive and negative, in assessing the extent to which a valuation allowance should be applied against our deferred tax assets.
Utilization of our net operating losses may be subject to substantial annual limitation due to the ownership change limitations provided by the Code and similar state provisions. An analysis was conducted through 2011 to determine whether an ownership change had occurred since inception. The analysis indicated that although ownership changes occurred in prior years, the net operating losses would not expire before estimated utilization. In the event we have subsequent changes in ownership or profitability is delayed, net operating losses and research and development credit carryovers could be limited and may expire unutilized.
Allowance for Doubtful Accounts
We assess collectability based on a number of factors, including credit worthiness of the customer along with past transaction history; in addition, we perform periodic evaluations of our customers’ financial condition. Certain contracts with advertising agencies contain sequential liability provisions, where the agency does not have an obligation to pay until payment is received from the agency’s customers. In these circumstances, we evaluate the credit worthiness of the agency’s customers, in addition to the agency itself. Credit losses historically have not been material, which is directly attributable to our subscription-based services model, enabling us to immediately discontinue the availability of the services in question in the event of non-payment. Through September 30, 2012, we have not experienced any significant credit losses.
69
Table of Contents
Capitalized Software Costs
We capitalize certain development costs incurred in connection with our internal-use software platform in accordance with ASC 350-40, Internal-Use Software. These capitalized costs are mostly related to our hosted platform, which is accessed by our customers on a subscription basis. Costs incurred in the preliminary stages of development are expensed as incurred. Once an application has reached the development stage, we capitalize direct internal and external costs until the software is substantially complete and ready for its intended use. We cease capitalizing these costs upon completion of all substantial testing. We also capitalize costs related to specific upgrades and enhancements when it is probable the expenditures will result in additional functionality. We expense maintenance and training costs as they are incurred. We amortize capitalized internal-use software development costs on a straight-line basis over its estimated useful life, which is generally two to three years, into cost of revenues. Through September 30, 2012, we had capitalized costs of approximately $3.3 million in aggregate under ASC 350-40. Based on our current plans, we expect to continue to capitalize a portion of our development costs in the future.
Recent Accounting Pronouncements
In June 2011, the FASB issued Accounting Standards Update (“ASU”) 2011-05, Comprehensive Income. This guidance requires entities to have more detailed reporting of comprehensive income. The guidance is effective for fiscal years and interim periods within those years beginning after December 15, 2011. Early adoption is permitted. The guidance should be applied retrospectively. The adoption of this guidance on January 1, 2012 did not have a material impact on our consolidated financial statements.
In May 2011, the FASB issued ASU 2011-04, Fair Value Measurement. This guidance requires entities to change certain measurements and disclosures about fair value measurements. The guidance is effective during interim and annual periods beginning after December 15, 2011. We adopted this new guidance on January 1, 2012.
Quantitative and Qualitative Disclosures about Market Risk
We have operations both within the United States and internationally, and we are exposed to market risks in the ordinary course of our business. These risks primarily include interest rate, foreign exchange and inflation risks, as well as risks relating to changes in the general economic conditions in the countries where we conduct business. To reduce certain of these risks, we monitor the financial condition of our large customers and limit credit exposure by setting credit limits as we deem appropriate. In addition, our investment strategy has been to invest in financial instruments that are highly liquid and readily convertible into cash, with maturity dates within three months from the date of purchase. To date, we have not used derivative instruments to mitigate the impact of our market risk exposures. We have also not used, nor do we intend to use, derivatives for trading or speculative purposes.
Interest Rate Risk
We are exposed to market risk related to changes in interest rates. Our investments are considered cash equivalents and primarily consist of money market funds, corporate debt securities and a certificate of deposit. As of September 30, 2012, we had cash and cash equivalents of $17.0 million. In November 2012, we raised $19.9 million in proceeds, net of related issuance costs, from the sale of our Series F-1 preferred stock. The carrying amount of our cash and cash equivalents reasonably approximates fair value, due to the short maturities of these investments. The primary objectives of our investment activities are the preservation of capital, the fulfillment of liquidity needs and the fiduciary control of cash and investments. We do not enter into investments for trading or speculative purposes. Our investments are exposed to market risk due to a fluctuation in interest rates,
70
Table of Contents
which may affect our interest income and the fair market value of our investments. Due to the short-term nature of our investment portfolio, we believe only dramatic fluctuations in interest rates would have a material effect on our investments. As such we do not expect our operating results or cash flows to be materially affected by a sudden change in market interest rates.
As of September 30, 2012 we had borrowings outstanding in the aggregate of $10.2 million. Our outstanding long-term borrowings consist of fixed and variable interest rate financial instruments. The interest rates of our borrowings range from 4.0% to 5.5%. A hypothetical 10% increase or decrease in interest rates relative to our current interest rates would not have a material impact on the fair values of all of our outstanding borrowings. Changes in interest rates would, however, affect operating results and cash flows, because of the variable rate nature of our borrowings. A hypothetical 10% increase or decrease in interest rates relative to interest rates as of December 31, 2011 would result in an insignificant impact to interest expense for 2012.
Foreign Currency Exchange Risk
We have foreign currency risks related to our revenues and operating expenses denominated in currencies other than the U.S. Dollar, primarily the Euro, British Pound Sterling, Singapore Dollar, Japanese Yen, Chinese Yuan, and Australian Dollar. Revenues outside of the United States as a percentage of consolidated revenues was 7%, 20%, and 26% in fiscal 2009, 2010 and 2011, respectively, and 26% during the nine month period ended September 30, 2012. Changes in exchange rates may negatively affect our revenues and other operating results as expressed in U.S. Dollars.
The functional currency for our wholly-owned foreign subsidiaries is the U.S. Dollar. Accordingly, the subsidiaries remeasure monetary assets and liabilities at period-end exchange rates, while nonmonetary items are remeasured at historical rates. Income and expense accounts are remeasured at the average exchange rates in effect during the year. Remeasurement adjustments are recognized in the statement of operations as foreign currency transaction gains or losses in the year of occurrence. Aggregate foreign currency transaction losses included in determining net loss were not significant in 2009, 2010, 2011, or for the nine months ended September 30, 2011 and 2012. Transaction gains and losses are included in other income (expenses), net.
As our international operations grow, our risks associated with fluctuation in currency rates will become greater, and we will continue to reassess our approach to managing this risk. In addition, currency fluctuations or a weakening U.S. Dollar can increase the costs of our international expansion. To date, we have not entered into any foreign currency hedging contracts, since exchange rate fluctuations have not had a material impact on our operating results and cash flows. Based on our current international structure, we do not plan on engaging in hedging activities in the near future.
Inflation Risk
We do not believe that inflation has had a material effect on our business, financial condition or results of operations. Nonetheless, if our costs were to become subject to significant inflationary pressures, we may not be able to fully offset such higher costs through price increases. Our inability or failure to do so could harm our business, financial condition and results of operations.
71
Table of Contents
Company Overview
We provide a leading cloud-based digital advertising management platform that enables advertisers and agencies to improve financial performance, realize efficiencies and time savings, and make better business decisions. Our Revenue Acquisition Management platform is an analytics, workflow, and optimization solution for marketing professionals, enabling them to effectively manage their digital advertising spend across search, display, social and mobile advertising channels. Our solution is designed to help our customers:
| Ÿ | measure the effectiveness of their advertising campaigns through our proprietary reporting and analytics capabilities; |
| Ÿ | manage and execute campaigns through our intuitive user interface and underlying technology that streamlines and automates key functions, such as ad creation and bidding, across multiple publishers and channels; and |
| Ÿ | optimize campaigns across multiple publishers and channels in real time based on market and business data to achieve desired revenue outcomes using our predictive bid management technology. |
Advertisers are increasingly focused on performance-based marketing and are seeking ways to gather, analyze and leverage data about the effectiveness of digital advertising to run more impactful and targeted campaigns. Our robust and flexible platform integrates with leading publishers, such as Baidu, Bing, Facebook, Google, Yahoo! and Yahoo! Japan, as well as leading web analytics and ad-serving solutions, and key enterprise applications to enable marketers to measure the return on investment of their marketing programs.
Our platform serves as a system-of-record for advertising performance, revenue and conversion data and allows advertisers to correlate advertising spend to subsequent revenue outcomes or business events. Through a single, intuitive interface, designed to meet the daily workflow requirements of online marketers, we enable our customers to simultaneously run large-scale digital advertising campaigns across multiple publishers and channels, making it easy for marketers to create, publish, modify and optimize campaigns in real time. Our predictive bid management and optimization technology also allows advertisers to forecast outcomes and optimize campaigns across multiple publishers and channels to achieve their business goals. Our optimization technology enables advertisers to easily and rapidly increase spend on those campaigns, publishers and channels that are performing while reducing investment in those that are not.
In December 2012, our customers collectively managed $ in annualized advertising spend on our platform and we had active advertisers using our solution globally across a wide range of industries. We define an active advertiser as an advertiser from whom we recognized revenues in excess of $2,000 in the last month of a quarter. We market and sell our solutions to advertisers directly and through leading advertising agencies. We generate revenues from subscription contracts under which we charge fees generally based upon the amount of advertising spend that our customers manage through our platform. We have achieved 14 consecutive quarters of revenue growth. For 2009, 2010 and 2011, and for the nine months ended September 30, 2012, our revenues were $7.5 million, $19.0 million, $36.1 million and $42.5 million, representing period-over-period growth of 186%, 152%, 90% and 72%, respectively. We had net losses of $9.7 million in 2009, $10.9 million in 2010, $17.4 million in 2011 and $19.2 million for the nine months ended September 30, 2012.
72
Table of Contents
Industry Overview
Revenue Acquisition Management: The Competition for Revenue is Moving Online as Marketers Seek to Engage with the Growing Number of Digitally-Connected Consumers and Business Prospects
As audiences have increased their time spent online, the ability to acquire revenue through digital channels has emerged as a strategic priority for marketers. A growing number of consumers and businesses worldwide are relying on the Internet, social media and mobile devices to research products and services and make purchases. IDC estimates that, in 2012, 2.4 billion people and 3.3 billion devices will be connected to the Internet. As a result of this shift from offline to online engagement, the competition for revenue acquisition is moving to digital channels. Advertisers are shifting an ever larger portion of their marketing budgets to digital channels as they seek more effective and measurable ways to reach their target audiences, influence purchase decisions and acquire revenue. Forrester reported that U.S. web-influenced retail sales exceeded $1 trillion in 2011 and that by 2016 an estimated 52% of total online and offline retail sales will start with online research. These trends are causing an ongoing shift in advertising budgets to digital channels as enterprises increasingly compete to acquire customers and revenues online.
Digital advertising enables advertisers to measure and understand which channels and advertisements produce the best marketing results. Online advertisements can be tracked to assess consumer response, including behaviors such as purchase of products or services. As marketers gain more knowledge about which publishers, channels and ads are most effective for selling their products and services, they are seeking ways to adjust strategies dynamically to improve their financial returns from their digital advertising investments. They are also seeking solutions that improve their understanding of where, when and how much to invest to best achieve their desired revenue outcomes. This competition for revenue online is driving a need for a new category of enterprise software to help advertisers effectively measure, manage and optimize their digital advertising spend, which we refer to as Revenue Acquisition Management.
Significant Growth and Innovation in Digital Advertising
According to Magna Global, global spend on advertising is expected to grow from $480 billion in 2012 to $619 billion in 2017. Rapid growth in online activity and engagement is resulting in a significant ongoing shift in advertising spend to digital channels with global spend on digital advertising expected to grow from $98 billion in 2012 to $174 billion in 2017, according to Magna Global. As marketers increase spend on digital advertising, they are also increasing their investments in software, which allows them to measure, manage and optimize the effectiveness of that spend. Gartner, Inc. predicts that by 2017, the chief marketing officer will spend more on IT than the chief information officer.
As advertisers increasingly focus on performance-based marketing, they are seeking ways to gather, analyze and leverage data about the effectiveness of digital advertising to run more impactful and targeted campaigns, ultimately delivering higher rates of revenue acquisition. Furthermore, digital advertising provides advertisers with the ability to reach their audience across multiple channels, such as search, display and social, and multiple devices, including smartphones, tablets, personal computers, TVs and other connected devices. Each channel and device has unique characteristics and advertiser benefits, requiring advertisers to dynamically adapt their strategies and campaigns.
Digital advertising channels include:
Search. Search advertising is the largest digital advertising channel today. According to Magna Global, search-based advertising is expected to grow from $45 billion in 2012 to $83 billion in 2017, representing a 13% compound annual growth rate, or CAGR. In 2012, spend on search advertising is expected to represent approximately 46% of all digital advertising spend, according to Magna Global.
73
Table of Contents
Search has become a critical digital advertising channel because it delivers relevant results to users actively searching for specific information and enables advertisers to efficiently track the success of their marketing campaigns based on click-through rates and conversion rates. Multiple search-driven publisher platforms exist today, including Baidu, Bing, Google, Naver, Yahoo! Japan, Yahoo! Search and Yandex, and additional publishers will develop search capabilities over time. These publishers continue to innovate by enhancing their advertising offerings. For example, search advertising is growing on mobile devices and publishers are optimizing their advertising offerings to address this demand.
Display. Online display advertising has expanded over the years to include banner, rich media, video and text formats. According to Magna Global, display advertising is expected to grow from $41 billion in 2012 to $52 billion in 2017. The characteristics of measurability and relevance that have fueled the growth of the paid search market are being successfully introduced to the display advertising market. For example, dynamic and personalized targeting, rules-based placement, location-based awareness, and auction-based ad inventory purchasing are some of the innovations being used by publishers for display advertising. In turn, these innovations have increased complexity and the ability of advertisers to dynamically manage and maximize the impact of their display advertising spend.
Social. Social media networks, such as Facebook, LinkedIn, Renren and Twitter, are rapidly emerging as an important new channel for digital advertisers. IDC projects that 75% of all Internet users will be active on social networks by 2014. According to Magna Global, advertising spend on social networks is expected to increase from $6 billion in 2012 to $23 billion in 2017, representing a 29% CAGR. Social networks offer advertisers the unique ability to target consumers based on their social graph, including relationships among network members and attributes of users.
Mobile. Smartphones, tablets and other mobile devices are rapidly transforming how and where people consume media, conduct business, interact with brands and make purchase decisions. Adoption of mobile devices is also providing advertisers with the unique ability to target users based on real-time location data. As a result, digital advertisers are adapting their advertising strategies across search, display and social channels to mobile devices. According to Magna Global, the mobile advertising market is expected to grow from $6 billion in 2012 to $16 billion in 2017, representing a 23% CAGR.
Challenges Faced by Digital Advertisers
The evolution of a multi-channel and multi-device digital advertising ecosystem creates opportunities for advertisers to more effectively target and reach specific audiences to optimize revenue acquisition and other desired business results. However, as digital advertising becomes increasingly competitive and complex, digital advertisers are faced with several key challenges, including:
Fragmentation. Advertisers have the opportunity to engage their target audiences online across a variety of digital channels, content publishers and delivery devices. Each channel, publisher and device has unique consumer engagement characteristics, targeting options, ad inventory, pricing, ad types, and buying interfaces. This fragmentation makes it significantly more challenging for advertisers to manage digital campaigns, measure their impact on revenue acquisition, and optimize them to achieve desired business results.
Scale. As advertisers move more of their revenue acquisition activities online, increase advertising budgets, run more sophisticated online campaigns and significantly expand the number and types of ad units in use, they face significant scale challenges. Consumers are targeted through ad units, which may include keywords, ad types, ad placements, demographics, audience attributes and interests. Advertisers face increasing difficulty in tracking, analyzing and taking action across data sets
74
Table of Contents
that include thousands and often millions of ad units. Additional complexities include creating and orchestrating programs that span hundreds of accounts and thousands of campaigns, and managing diverse creative content across ad units. Advertisers are also challenged to frequently calculate and update bids across each of these ad units in response to fluctuations in advertising performance.
Innovation in Digital Advertising. Publishers are constantly innovating by offering new ad formats and enhanced targeting options, adjusting ad inventory bidding mechanisms, as well as evolving their ad buying workflow and APIs. For example, recent innovations in digital technology offer the opportunity to retarget consumers who clicked on a search term, presenting them with relevant reminders of products or services they searched for as they continue to browse the Internet. While expanding the market for digital advertising, these innovations also make it much more complex and challenging for advertisers to efficiently and effectively manage and measure the revenue acquisition outcomes of their advertising campaigns across channels and publishers.
Dynamic Environment. Digital advertisers operate in an intensely dynamic and fast moving environment. Auction-based bidding for ad inventory has become significantly more complex due to the proliferation of ad units and an expanding list of metrics and revenue acquisition outcomes which advertisers strive to optimize towards. Advertisers have varying business objectives ranging from increasing revenue to lowering cost per customer acquisition to increasing brand awareness with a certain customer profile, each requiring different strategies for bidding on ad inventory on various publisher platforms. Given the 24x7 nature of digital media and e-commerce, advertisers need to frequently refine their campaigns to react in real-time to availability of advertising inventory, auction-based pricing, user behavior, product inventory and competition.
Lack of Visibility. Advertisers are focused on connecting advertising spend to revenue acquisition outcomes to quantify the return on their marketing investments. Digital advertising offers the opportunity to increase attribution and accountability for revenue acquisition outcomes. By effectively tying specific advertising campaigns to downstream online and offline revenue or other desired audience actions, advertisers can better manage and optimize to desired business results. Despite this potential, the lack of integration between data from publisher systems and data from web analytics, e-commerce, inventory, customer relationship management, call center, customer data warehouse and other enterprise applications makes it challenging for businesses to gain insights, make decisions and obtain better results from digital advertising. In order to measure success and maximize return on investments, advertisers need to access, correlate and analyze massive amounts of data across enterprise applications and publisher advertising platforms in real-time.
Impact of Social. Increasing social engagement by consumers online provides advertisers with the unique opportunity to target prospects using a combination of the social graph, user interests and demographics. As a result, advertisers face additional complexity in effectively leveraging social networks to build awareness and engage prospective customers. Advertisers focused on social engagement also need to refresh and change their content more often to maintain relevance and drive response. In addition, advertisers are looking for more measurable and dynamic ways to track and manage the impact of social advertising.
Growth in Mobile. The growth of mobile advertising is presenting new challenges for online advertisers, including screen and ad size limitations, differences in user context and location, and ad targeting options and formats that differ from traditional desktop campaigns. In order to successfully manage and optimize mobile campaigns, advertisers need to tailor ads to the needs of smartphone and tablet users and their context. In doing so, advertisers must manage the added complexity associated with location targeting, device targeting and mobile ad formats, as well as the difficulty of correlating mobile interactions with other online and offline interactions to appropriately attribute results to mobile advertising spend.
75
Table of Contents
Limitations of Existing Approaches
Existing digital advertising management approaches have a number of limitations, including:
Publisher Tools. Publishers provide an online interface for purchasing their ad inventory. While effective in managing tasks on a particular publisher platform, these tools lack the capabilities to provide complete and accurate data on a marketer’s advertising performance across all publishers and channels.
Spreadsheets. Many advertisers continue to use spreadsheets to manually manage ad units and bidding. Spreadsheets limit the ability to analyze the effectiveness of advertising campaigns due to difficulties in integrating data from publisher and revenue reporting systems. Moreover, this approach becomes unsustainable as the number of ad units managed proliferates, resulting in time consuming and error-prone workflows for advertisers as they attempt to make changes across publishers in bulk.
Proprietary Internal Systems. Developing and maintaining proprietary systems requires ongoing investments in resources with specialized expertise in software architecture and development, data warehousing and analytics, integration with publisher APIs and algorithmic bid optimization. Advertisers who use this approach are forced to continually adjust their systems to the constantly shifting industry landscape with new ad formats and publishers, making these systems difficult to scale and expensive to maintain. Due to internal competition for development resources, over time proprietary systems often fail to keep pace with the needs of advertisers.
Bid Management Tools. Bid management tools offer approaches to automate the process of calculating bids for online media and optimize the outcomes based on statistical analysis. These tools lack the end-to-end workflow capabilities advertisers require to maximize results through campaign management and optimization. Additionally, these tools do not address advertiser needs for data integration to understand the business impact of their campaigns, and generally have limited reporting and analytics functionalities.
The inadequacy of these existing approaches, coupled with a growing shift in budgets to digital advertising and demand for performance-based marketing, has created the need for Revenue Acquisition Management solutions. This category of solutions enables businesses to intelligently and efficiently measure, manage, and optimize their digital advertising spend for desired business results. We believe there is significant demand for Revenue Acquisition Management solutions among advertisers worldwide.
Our Solution
We provide a leading cloud-based digital advertising management platform that enables advertisers and agencies to improve financial performance, realize efficiencies and time savings, and make better business decisions. Our Revenue Acquisition Management platform is an analytics, workflow, and optimization solution for marketing professionals, enabling them to effectively manage their digital advertising spend across search, display, social and mobile advertising channels. Our solution is designed to help our customers:
| Ÿ | measure the effectiveness of their advertising campaigns through our proprietary reporting and analytics capabilities; |
| Ÿ | manage and execute campaigns through our intuitive user interface and underlying technology that streamlines and automates key functions, such as ad creation and bidding, across multiple publishers and advertising channels; and |
| Ÿ | optimize campaigns across multiple publishers and channels in real time based on market and business data to achieve desired revenue outcomes using our predictive bid management technology. |
76
Table of Contents
Marin Revenue Acquisition Management Platform
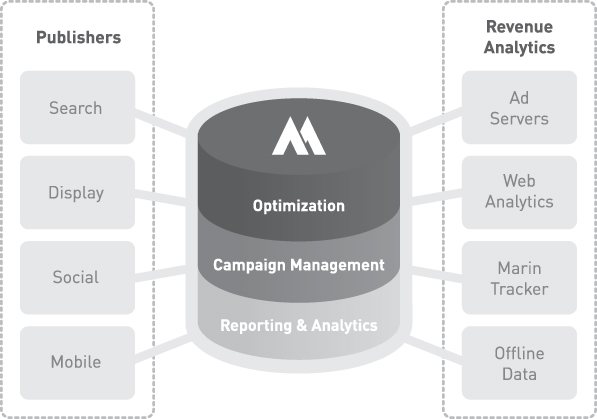
We believe our Revenue Acquisition Management platform enables advertisers to significantly improve their ability to acquire revenue through digital advertising campaigns.
Business Benefits
Financial lift. As a result of optimization of advertising spend, efficiencies in workflow and better decision making, our customers are able to create and execute successful campaigns that lead to increased revenue and other desired business outcomes. Based on our internal customer surveys, we believe that our customers typically realize financial lift from using our platform through a variety of means such as increased volumes of revenues or leads, higher profits, improved advertising return on investment, and lower costs of customer acquisition.
To understand the performance lift that our clients experience, we studied data from 39 active advertisers with consistent spend and revenue tracking that archived data for over a year. While this is a small number of customers compared to our overall customer base, we believe that the customers included provide a representative sample of our customer base and the sample size was sufficiently large to draw conclusions regarding the effectiveness of our platform. For purposes of the study, we compared data from these advertisers’ first full month of using our platform with the data for the same month in the next calendar year. Year-over-year, we measured that advertisers increased their average return on investment (ROI) by 39%, and increased their average revenue per click by 8%. These increases coincided with an average decrease in cost-per-click and cost-per-acquisition by 16% and 14%, respectively. However, the metrics above are averages of the active advertisers included in
77
Table of Contents
the study and the performance lift that a particular customer may experience using our platform could be less than the average results. There are other limitations and uncertainties inherent in any study. As a result, you should not give undue weight to the results of this customer data study.
Efficiencies and time savings. Utilizing our solution, customers are able to automate manual tasks such as reporting, analysis, campaign creation and bidding. Many of our customers previously relied upon publisher tools and spreadsheets to accomplish basic workflow, which limited productivity and resulted in errors. Our solution streamlines many of these time-intensive tasks to allow advertisers to focus on campaign strategy, expansion and optimization. In June 2012, we conducted an internal survey of employees of our customers that had used our platform at least four times in the last 365 days. Of the 250 responses, representing 149 unique customers, half of respondents reported time savings of 25% or greater from using our solution. However, as a result of the voluntary nature of the data gathering process, including that customers that recognized significant time savings may have been more favorably inclined to respond to the survey, and other limitations and uncertainties inherent in any statistical survey, we caution you not to give undue weight to the results of this survey.
Better business decision making. Our Revenue Acquisition Management platform enables advertisers to manage campaigns to their business objectives. Using our platform, they can identify campaign elements for segmentation and analysis in order to easily categorize and compare data sets that are important to their business. In addition, through our proprietary recommendation engine, we are able to proactively suggest modifications to optimize marketing campaigns. By integrating with advertisers’ enterprise applications, we allow advertisers to correlate digital advertising spend to a subsequent business event, such as a purchase, a completed lead form, or a measure of advertising influence. Leveraging these insights, advertisers can adjust campaigns to meet their individual business goals and deliver measurable business results.
Key Strengths
Robust and flexible integration. Our platform is architected to enable our customers to aggregate key data from internal or third-party sources. Our platform integrates with leading publishers such as Baidu, Bing, Facebook, Google, Yahoo! Japan and Yahoo! Search. We also integrate with leading web analytics and ad-serving providers, and key enterprise applications, such as revenue and inventory systems, customer relationship management systems and call center solutions. This integration framework enables our platform to be the system-of-record for our customers’ marketing, revenue and conversion data. Using the integration capabilities of our platform, advertisers can attribute revenue to specific marketing spend, gain visibility into the path to purchase, and assess customer lifetime value.
Big data analytics. Our platform provides sophisticated analytics functionality that can parse through massive and constantly-expanding publisher and enterprise applications data sets to offer critical insight to advertisers. We offer visualization tools and dashboards, automated reporting, trend analysis, and forecasting tools for better decision making. Advertisers can aggregate and analyze data by dimensions such as business unit, product, or geography, providing insight into business-level revenue outcomes. Our alerting and comparative analysis capabilities allow advertisers to easily identify outliers and trends in order to take appropriate action. Our platform enables our customers to understand the return on investment on their advertising spend and to quickly act on analytical insights to adjust campaign targeting, bids and budget allocation across various channels, geographies and publisher platforms.
Real-time, cross-publisher campaign management. Our solution enables customers to simultaneously run large-scale digital advertising campaigns across multiple publishers and channels, making it easy for marketers to create, publish, modify and optimize campaigns in real time using a
78
Table of Contents
single interface. We provide automated campaign generation, management and tracking tools as well as a testing suite that can automatically identify the best performing strategies. Our solution also provides tools for campaign targeting by publisher, geography, device, and audience to increase relevance and effectiveness of campaigns.
Predictive bid management and optimization. Our bid management technology allows advertisers to optimize campaigns by dynamically managing bids on any number of ad units across multiple publishers and channels. Users can organize campaigns into and set bid goals based on defined groupings, providing complete visibility and control over business outcomes. We enable advertisers to automatically transmit changes to bids in bulk to the relevant publishers. Our algorithms help advertisers to determine and continuously recalculate the optimum bids for each ad unit. We also offer advertisers the ability to forecast and adjust bidding outcomes using our predictive bidding technology. Our optimization technology enables advertisers to easily and rapidly increase spend on those campaigns, publishers and channels that are performing while reducing investment in those that are not.
Intuitive interface offering visibility and control. Our intuitive interface is designed to simplify the daily workflow requirements of digital advertisers allowing them to rapidly analyze campaign data and act on it. Users can easily filter data in real time to perform iterative analysis and manage across data sets. The search, replace, and multi-edit capabilities of our platform simplify the management of large scale campaigns. The interface also enables advertisers to save and share views with team members, providing a unified workflow for multi-user teams.
Experienced team committed to customer success. We have assembled a global team experienced in the areas of digital advertising and enterprise software. Our customer-oriented corporate culture is defined by a commitment to customer success and characterized by an emphasis on transparency, collaboration and candor. Our customer-facing teams possess hands-on experience in managing large-scale digital advertising programs, enabling us to provide best-practice advice as well as reliable and responsive technology support to our customers.
Highly-scalable and extensible cloud-based architecture. We deliver our cloud-based platform using a purpose-built technology foundation that leverages recent advances in cloud computing and data management. Our infrastructure is designed to support enterprise-scale data sets and transaction volumes and allows our customers to aggregate, store and process large amounts of data while maintaining high application availability and responsiveness. This flexible and extensible architecture enables us to serve organizations of all sizes from a single platform.
Our Growth Strategy
Our goal is to extend our lead in and grow the Revenue Acquisition Management category. Key elements of our growth strategy include:
Enhancing our leadership position by innovating and expanding our platform. We intend to continue innovating and enhancing the value of our Revenue Acquisition Management platform. This includes developing new functionality and add-on modules, optimizing our feature set and platform capabilities, and expanding support for additional publishers and data sources.
Acquiring new advertisers. We intend to continue to make investments to acquire new advertisers. In order to expand our customer base, we intend to expand our sales organization by adding sales executives globally and plan to continue to market our platform to new advertisers and agencies.
79
Table of Contents
Expanding within our existing advertiser base. As our advertisers experience success on our platform, we often see increases in the advertising spend they manage on our platform. In order to expand within our existing advertising base, we intend to expand our current capabilities as well as offer new features and functionality, provide best practices support and demonstrate our ability to help our advertisers to obtain financial lift, time savings and better business results. We believe there is a significant opportunity for us to capture additional advertising spend on our platform from our existing advertiser base as they grow spend on existing channels, adopt new channels and expand to additional publishers.
Further penetrating display, social and mobile opportunities. We believe that we have a significant opportunity to expand our customer relationships to include additional advertising spend on mobile, social and display campaigns. As these channels grow in scale and continue to become more complex, we believe our customers will require a sophisticated solution to manage advertising campaigns and revenue acquisition across all available digital channels. We intend to continue to optimize our solution to handle unique complexities associated with display, social and mobile advertising channels.
Continuing to expand internationally. We operate internationally with offices in Australia, France, Germany, Japan, Singapore and the United Kingdom. In our quarter ended September 30, 2012, approximately 26% of our revenues were generated outside of the United States and we believe there is potential for additional growth internationally. IDC estimates that, in 2012, approximately 58% of global digital advertising spend will occur outside of the United States. We plan to grow the contribution of our international business by supporting additional regional publishers, expanding our global sales team and working with leading agencies and advertisers worldwide.
Growing our partner ecosystem and selectively pursuing acquisitions. We intend to further develop our partner ecosystem to expand the breadth of our platform and acquire additional customers. We plan to establish additional relationships with leading publishers, technology partners, advertising agencies and other sales channel partners. In addition, we intend to selectively pursue acquisitions of complementary businesses and technologies that we believe will strengthen our competitive advantage in the Revenue Acquisition Management category, expand our platform and accelerate our customer and revenue growth.
Our Revenue Acquisition Management Platform
Our cloud-based Revenue Acquisition Management platform enables our customers to measure, manage and optimize their digital marketing campaigns to improve financial performance, realize efficiencies and time savings, and make better business decisions. We currently offer two editions of our platform that leverage the same underlying technology.
| Ÿ | Enterprise Edition. Targeting large advertisers and agencies, Marin Enterprise is designed to provide digital advertisers with the power, scale and flexibility required to manage large-scale advertising campaigns. |
| Ÿ | Professional Edition. Targeting mid-market advertisers and agencies, Marin Professional is designed for rapid deployment and offers customers a complete workflow, analysis and optimization solution for managing digital advertising. |
80
Table of Contents
Marin Revenue Acquisition Management Platform
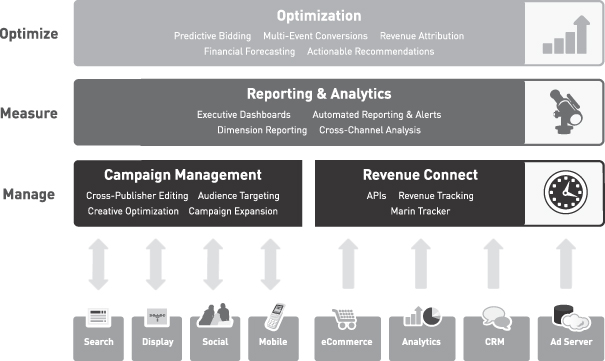
Our platform is comprised of the following modules:
Revenue Connect. Our Revenue Connect module helps advertisers automate and streamline their ability to capture revenue data from a range of sources such as ad servers, analytics systems, CRM platforms, and third party databases. Through proprietary integration methods deployed across multiple data sources, our Revenue Connect module simplifies revenue tracking, leading to better bidding outcomes and significant time savings. Key capabilities of our Revenue Connect module include:
| Ÿ | APIs. Advertisers often use proprietary or third party tracking methods to correlate ad clicks with revenue reporting. Our Revenue Connect module synchronizes with existing customer tracking methods, allowing users to deploy our platform without modification to existing processes or systems, and resulting in minimal disruption. |
| Ÿ | Revenue Tracking. We have optimized our software for robust integration of revenue data from a variety of third-party systems such as Adobe Site Catalyst, BrightTag, ClearSaleing, Demandware, DoubleClick, Google Analytics, IBM Coremetrics, Microsoft Atlas, Mongoose Metrics, RevTrax, salesforce.com and TagMan, allowing our customers to obtain accurate revenue reporting related to their advertising campaigns. |
| Ÿ | Marin Tracker. We provide advertisers with a proprietary tracking mechanism that can be leveraged either independently to track revenue outcomes, or in conjunction with a customer’s existing tracking mechanisms. |
81
Table of Contents
Campaign Management. Our Campaign Management module provides the digital advertiser with a unified interface to create, manage and optimize campaigns across a broad range of publishers, leading to greater efficiencies and increased flexibility. Key capabilities of our Campaign Management module include:
| Ÿ | Cross-Publisher Editing. Allows advertisers to create and edit campaigns, creative, bids, and budgets in bulk across publishers and accounts. |
| Ÿ | Audience Targeting. Allows advertisers to target specific audiences across a variety of dimensions such as age, gender, region, interests, device and the social graph. |
| Ÿ | Creative Optimization. Enables advertisers to test ad copy, images, and landing pages to identify combinations that maximize revenue outcomes. |
| Ÿ | Campaign Expansion. Provides users with unique insights to rapidly grow marketing programs through ad unit expansion workflow and automated generation of new campaigns based on client defined rules. |
Reporting and Analytics. Our Reporting and Analytics module enables advertisers to report results at a business level and analyze cross-channel performance trends, leading to improved visibility and significant time savings. Key capabilities of our Reporting and Analytics module include:
| Ÿ | Executive Dashboards. Our dashboards provide an at-a-glance view of digital campaign performance with key performance indicators (KPIs), such as conversions, revenue or profits, as well as performance and budget trends. |
| Ÿ | Automated Reporting and Alerts. Users can set up automated reports to simplify reporting and analysis workflows, including triggers that notify advertisers when key metrics vary outside of optimal ranges. |
| Ÿ | Dimension Reporting. Advertisers can tie digital campaigns to higher-level constructs such as business lines, product categories and geographic regions, resulting in clear visibility into business level metrics and KPIs, such as the profitability of a product category. |
| Ÿ | Cross-Channel Analysis. Our cross-channel analysis capabilities enable advertisers to understand the consumer path to purchase, leading to better insights into channel performance and the value of cross-channel advertising. |
Optimization. Our Optimization module helps advertisers manage bids across publishers to meet revenue goals and identify opportunities for campaign improvements leading to improved financial performance and efficiencies. Key capabilities of our Optimization module include:
| Ÿ | Predictive Bidding. Our predictive bid management solution allows advertisers to calculate bids across any number of ad units, including ads with little or no data, using statistical methods. Users can set business level goals, such as meeting a given return on advertising investment, and bids can be optimized down to a granular ad unit level. |
| Ÿ | Multi-Event Conversion. Many online advertisers have multi-step purchase funnels where an online user might first fill out a lead form and then make a purchase. We provide advertisers the flexibility to measure multiple conversion events, and calculate discrete bids based on the value of each event in the conversion funnel. |
| Ÿ | Revenue Attribution. A customer purchasing a product online may have been exposed to digital ads across search, social, display and mobile, making revenue attribution difficult. Our Optimization module enables advertisers to accurately attribute revenue across multiple channels, leading to deeper insights and better bidding outcomes. |
82
Table of Contents
| Ÿ | Financial Forecasting. Our Optimization module enables advertisers to run what-if scenarios so they can change their bidding strategies or budget allocations, and understand the impact on the overall program. |
| Ÿ | Actionable Recommendations. Our algorithms automatically filter through an advertiser’s account and surface unique insights and recommendations to improve campaign performance and deliver efficiencies. |
Our Technology
Our platform provides both an analytical and a transactional application. Our analytical application includes the capability to interactively browse and analyze large amounts of aggregated, read-only data. Our transactional application includes the ability to process large volumes of changes on individual ad units. These two capabilities are provided as a unified platform to our customers.
Analytical Application
Our platform integrates with APIs from leading publishers, allowing our application to retrieve advertising performance data, including click, cost, and impression information, combine it with revenue information from customers, and map the combined result to business structures as determined by each customer. Our “Active Object Prioritization” technology helps marketers find important details more quickly, even if they manage millions of ad units. Marketers running large-scale campaigns need to identify outliers in performance across thousands or millions of ad units. These outliers include, for example, campaigns that witnessed an increase in cost but a decrease in conversions. Our technology allows customers to identify outliers rapidly through the ability to compare performance over time and filter data using Boolean operators such as “>” or “<”. These capabilities are typically not part of publisher systems, that were designed for ad buying and not for analytics.
Our advertisers can either use revenue data from their own sources or utilize Marin Tracker, which aggregates visitor activity and order data from customers’ websites. Marin Tracker uses a globally distributed network of collection nodes for sub-second response time and high availability. We process the collected data using our proprietary programming model and applied big data technology.
Transactional Application
Our transactional application supports the creation and management of billions of publisher ad units, such as visual or text ads or keywords. Customers can initiate many types of target, budget, and bid adjustments from our platform. Our “Bi-directional Sync” technology also allows our customers to make changes within our platform or the publisher platform, and have those changes automatically synchronized between systems.
Our optimization algorithms combine historical performance patterns and current market adjustments to build a mathematical model for each advertising unit in order to discover a combination of inputs to those models across a group of similar ad units to maximize a financial metric such as revenue or profit. We test algorithmic changes against both hypothetical and real-world data.
Supporting Platform
We designed our cloud-based platform to support large global advertisers. The majority of our software is written in Java. Our hardware consists of industry-standard servers and network infrastructure. Our standard operating system is Linux. Our platform is character-set, language, currency, and time-zone independent. Our technology platform has the following key benefits:
83
Table of Contents
Scalability. Our platform is designed to handle billions of ad units across thousands of advertisers, while delivering a responsive browsing and editing experience. As the number of advertisers and resulting computing and storage requirements grow, we can add hardware to the platform to accommodate growing demand. We believe the hardware we use is available from multiple sources and hence we do not expect to have any temporal delays, or sourcing challenges. Further, we do not expect any liquidity or capital limitations that would materially impact our ability to scale our platform.
Availability. Our customers are highly dependent on the availability of our platform, which is designed to be available 24x7, 365 days a year. We operate our own hardware and use a third-party data center that offers server redundancy, back-up communications and power and physical security.
Security. Our platform manages a large quantity of customer data. We employ technologies, policies and procedures to protect customer data. Our third-party data center has SSAE 16 attestations.
Customers
In December 2012, our customers collectively managed $ in annualized advertising spend on our platform and for the quarter ended December 31, 2012, we had active advertisers using our solution globally across a wide range of industries. We define an active advertiser as an advertiser from whom we recognized revenues in excess of $2,000 in at least one month in a period. We market and sell our solutions to advertisers directly and through advertising agencies that use our platform on behalf of their customers. Advertisers that we serve through our relationships with agencies have historically represented approximately half of our revenues.
The following is a representative list of the largest direct advertisers on our platform calculated based on revenues from each advertiser for the twelve months ended December 31, 2012, and from whom we have consent to name them in this prospectus:
| Ÿ | Apollo Group, Inc. / University of Phoenix |
| Ÿ | Bankrate, Inc. |
| Ÿ | Capella Education Company |
| Ÿ | The Charles Schwab Corporation |
| Ÿ | Expedia, Inc. / Hotels.com |
| Ÿ | Experian plc |
| Ÿ | Macy’s, Inc. |
| Ÿ | Reply.com |
| Ÿ | Sabre Holdings Corporation / Last Minute Network Limited |
| Ÿ | Symantec Corporation |
| Ÿ | trivago GmbH |
| Ÿ | Vistaprint N.V. |
84
Table of Contents
Marin maintains active relationships with the following leading agency holding companies that own multiple advertising agencies. The following is a list of key advertising agency holding companies with whom we maintain active relationships:
| Ÿ | Aegis Group plc |
| Ÿ | Havas SA |
| Ÿ | Interpublic Group of Companies, Inc. |
| Ÿ | Omnicom Group Inc. |
| Ÿ | Publicis Groupe S.A. |
| Ÿ | WPP plc |
The following is a representative list of the largest agencies on our platform based on revenues from each agency for the twelve months ended December 31, 2012, and from whom we have consent to name them in this prospectus:
| Ÿ | Acquirgy, Inc. |
| Ÿ | iProspect, a brand of Aegis Media Group plc |
| Ÿ | IREP Co., Ltd. |
| Ÿ | Mediaedge: CIA, LLC (MEC), a subsidiary of WPP plc |
| Ÿ | MediaCom Holdings Ltd., a subsidiary of WPP plc |
| Ÿ | Omnicom Media Group, a subsidiary of Omnicom Group Inc. |
| Ÿ | Performics, a subsidiary of Publicis Groupe S.A. |
| Ÿ | Razorfish, LLC, a subsidiary of Publicis Groupe S.A. |
| Ÿ | Rosetta, a subsidiary of Publicis Groupe S.A. |
| Ÿ | transcosmos inc. |
| Ÿ | Webtrends Inc. |
| Ÿ | ZenithOptimedia Group, a subsidiary of Publicis Groupe S.A. |
Selected Customer Case Studies
The following are representative examples of how some of our customers have benefited from use of our platform. Information regarding these customers and the results of these case studies was provided by the applicable customer. These examples may not be representative of the typical results that customers see due to differences in business model or implementation.
iProspect
Challenge. iProspect (a brand of Aegis Media Group plc) is a leading global digital marketing agency with over 800 employees in 29 countries worldwide. In order to meet the workflow, analytics, and optimization needs of the agency’s campaign managers, iProspect needed a solution to support media buying across search, display, social, mobile and video.
Solution and benefits. Our solution has been deployed by iProspect across the globe in 26 different currencies and in a variety of verticals including retail, travel, finance, insurance, and automotive. In addition to realizing efficiencies from our solution, iProspect customers also have
85
Table of Contents
realized material financial lift. In a study of the 2011 holiday shopping season compared to the same period in 2010, iProspect evaluated the performance of retail clients running on our platform. During the period studied, advertisers using our solution were able to more than double revenues generated from search advertising on a year-over-year basis, with the incremental revenues significantly exceeding the incremental search advertising investment.
ModCloth
Challenge. ModCloth, Inc., or ModCloth, a leading online retailer of independently designed fashion and décor, relies on a large-scale search advertising program to grow brand awareness and drive online revenues. ModCloth wanted to expand revenues from its search advertising by adding campaigns based on seasonal inventory. Given the size and scope of its existing programs, however, the ModCloth team was challenged to effectively expand campaigns because it was spending too much time using spreadsheets in performing basic campaign management and reporting tasks.
Solution and benefits. ModCloth implemented our solution in order to gain efficiencies and expand its digital advertising program. Features in our solution, such as automated alerting and reporting and the ability to edit bids directly from within the reporting interface, saved the ModCloth team considerable time, enabling it to spend more time on expansion initiatives. Using our campaign copy and keyword suggestion tools, the ModCloth team was able to aggressively add keywords while maintaining traffic quality. ModCloth reported the following benefits during the period between November 2010 and February 2012:
| Ÿ | increased search advertising driven revenues by 23%; |
| Ÿ | decreased costs-per-click by 14%; and |
| Ÿ | reduced time spent on reporting and bidding by more than 30%. |
PriceGrabber
Challenge. PriceGrabber.com, Inc., or PriceGrabber, is an online price comparison service that provides free and unbiased information on millions of products. PriceGrabber’s search advertising program spans more than 16 million keywords across over 100 different search engine accounts. As PriceGrabber continued to expand its offerings, the search advertising team found themselves struggling to manage the size and complexity of the program. PriceGrabber also has a large number of keywords that do not receive clicks. Given the scarcity of available data, the PriceGrabber team struggled to accurately predict bids for these “long tail” terms.
Solution and benefits. PriceGrabber deployed our solution to help scale and optimize its digital advertising program. As a result of leveraging our solution, PriceGrabber has significantly streamlined its digital advertising operations, achieving both time savings and increased profit. By automating keyword level bidding according to unique margin goals, our solution enabled the PriceGrabber team to increase revenue while spending less time managing search advertising. Our automated creative testing also helped PriceGrabber identify the most profitable ad-copy and make adjustments that helped further improve conversion rates across campaigns. PriceGrabber reported the following benefits during the period between January 2010 and August 2011:
| Ÿ | 121% increase in profit; |
| Ÿ | 173% increase in margin; and |
| Ÿ | 50% less time spent managing programs. |
86
Table of Contents
Razorfish
Challenge. Razorfish LLC, or Razorfish, counsels clients on how to leverage digital channels such as the Internet, mobile devices, in-store technologies, and other emerging media. Razorfish’s search marketing team is comprised of over 100 experts spread out across the United States managing hundreds of accounts for over 50 large brands including Starwood, Weight Watchers, Disney and Carnival Cruise Lines. Given the complexity of managing at scale, Razorfish needed to standardize search advertising management onto a next-generation platform in order to drive greater efficiency and higher return on investment for their diverse client roster.
Solution and Benefits. Razorfish undertook a comprehensive review of all Revenue Acquisition Management solutions on the market and chose us for our ability to accurately measure and improve search advertising return on investment, quickly onboard new clients, and streamline the process of bid and campaign optimization. According to Razorfish, it achieved significant improvement in business results for the period starting when it began working with us in April 2008 and through March 2010, including:
| Ÿ | reduced time spent on daily bidding, reporting, and campaign management by up to 50%; |
| Ÿ | reduced time spent on-boarding new clients by two-thirds; |
| Ÿ | repurposed team resources to better serve clients and optimize campaigns for higher performance and return on investment; |
| Ÿ | more accurate budget forecasting; |
| Ÿ | more accurate daily, weekly, and monthly reporting; and |
| Ÿ | improved overall campaign performance and boosted return on investment for clients. |
Red Bricks Media
Challenge. Since 2010, digital marketing agency Red Bricks Media has managed Facebook marketing efforts for one of the largest art and design universities in the United States. As the client’s campaigns grew, the Red Bricks Media team found the process of manually managing campaigns to be increasingly time consuming and error prone. Additionally, the Red Bricks Media team struggled to measure downstream effectiveness for Facebook ads as prospective students progressed from leads generated online all the way through to enrollees captured in the university’s CRM system. As a result, analysts found themselves unable to effectively manage tests and respond to change.
Solution and benefits. Red Bricks Media implemented our platform to improve the efficiency of Facebook marketing efforts for the university. As a result, the Red Bricks Media team is now able to spend less time managing campaigns and more time optimizing to granular target audiences. Through the ability to automatically rotate ads on Facebook multiple times a week, the Red Bricks Media team is able to reduce ad-fatigue and improve consumer response. Finally, the flexibility and openness of our platform allows Red Bricks Media to integrate the university’s CRM data with Facebook campaign results. Consequently, Red Bricks Media has gained better visibility into which campaigns and advertisements produce the most leads, allowing for improved testing and optimization. Leveraging the Facebook tools on our platform to promote the university, between September 2009 and November 2011 Red Bricks Media was able to deliver significant financial lift for its client, including a 30% increase in new leads and a 20% decrease in cost per acquisition.
Symantec
Challenge. Symantec Corporation, or Symantec, relies heavily on search, display and remarketing to drive online revenue acquisition across a variety of publishers, including Bing, Criteo,
87
Table of Contents
Google Display, Google Search and Yahoo! Each publisher account represented its own silo of data for Symantec, which had to then be loaded into a spreadsheet for manual, time-consuming analysis. The Symantec marketing team also lacked the visibility necessary to calculate bids across hundreds of thousands of ad units. In order to bid effectively, Symantec needed a system that could optimize bidding to appropriately account for revenues at every step of Symantec’s conversion funnel, from trial download to purchase.
Solution and benefits. Symantec used our solution to integrate the data from all utilized channels and publishers in one place, enabling the Symantec marketing team to quickly analyze and optimize revenue performance on a daily basis, identify the outliers and trends, and apply this information to inform strategy. Despite the complexity of multiple publishers, multiple conversion types and campaigns that span not only search but also display and retargeting, our automated bidding capability enables Symantec to optimize its campaigns for revenue maximization, the one financial metric that means the most to their business. Using our solution, between June 2010 and October 2012 Symantec achieved a 67% increase in its return on advertising spend. Symantec also reported that productivity has also improved dramatically since deploying our solution, reducing the time spent on reporting by more than 50%.
Vistaprint
Challenge. Vistaprint N.V., or Vistaprint, operates over 25 localized websites and ships to more than 130 countries. It uses multiple channels, including search advertising, to market a broad selection of customized printed products to small businesses and consumers. Due to the large-scale nature of Vistaprint’s search advertising program, the Vistaprint marketing team found it challenging to add new keywords, test creatives, and analyze and roll up data across more than 100 products that Vistaprint offers. Furthermore, the Vistaprint marketing team found that with existing tools, it was difficult to allocate budgets and optimize bids to product line goals.
Solution and benefits. Vistaprint deployed our platform to streamline workflows, improve visibility into product performance, and optimize bids more effectively. Using our keyword expansion tools, Vistaprint was able to save time by automating many of the steps associated with identifying and adding new terms. The use of alerts and filters, and the ability to roll up data by various product dimensions, provided Vistaprint with the insights needed to adjust their marketing strategies based on their business goals and optimize by product line. In addition, the use of bid automation and forecasting tools allowed the Vistaprint team to increase revenues and improve return on investment. According to Vistaprint, it also derived other benefits during the period between March 2012 and August 2012, including:
| Ÿ | increased click volumes of 8% while maintaining margin targets by using automated bidding and forecasting; |
| Ÿ | decreased time spent on reporting and campaign management by 40%; and |
| Ÿ | increased time spent testing and optimizing new campaigns by 50% due to the time savings from using our platform. |
Partners
As a core part of our growth strategy, we have developed an ecosystem of partners that includes the leading media and technology companies.
We work with leading media partners to access their publisher APIs that allow us to programmatically obtain media performance data and manage campaigns for our customers. Our
88
Table of Contents
relationships with these partners involve coordination on technical specifications and upgrades to newer APIs, compliance with API terms, and joint marketing through case studies and blogs.
We work with leading technology partners to access revenue and conversion data to help correlate ad spending with performance for our customers. Our relationships with these partners involve documentation and validation of technical integrations, creation of joint press releases and other collateral, and coordination of sales efforts.
We typically work with our partners to mutually coordinate changes in technology. When our partners update their technology, they may inform us in advance to allow us to make any necessary corresponding changes to our platform concurrently, such that our platform performs as expected when our partners’ technology update is released.
None of these partnership relationships involve any revenue commitments or obligations by us or the partner and they typically do not involve any definitive agreement that cannot be terminated on short notice.
Research and Development
Innovation is key to our success. Our research and development team is responsible for the design, development, maintenance and operation of our platform. Our research and development process emphasizes frequent, iterative and incremental development cycles, and we typically release new features every one to two months. Within the research and development team, we have several highly aligned, independent sub-teams comprised of six to 12 team members that focus on particular feature sets of our solutions. Each of these sub-teams includes engineers, quality assurance specialists and product developers responsible for the initial and ongoing development of each sub-team’s feature. In addition, the research and development team includes our production operations team, which is responsible for managing risk, protocol and platform uptime.
Research and development expenses were $3.4 million, $4.6 million, $7.1 million and $9.7 million for 2009, 2010, 2011 and the nine months ended September 30, 2012, respectively.
Sales and Marketing
We sell our solutions directly to advertisers and to agencies in a wide range of industries through our global sales team. Our sales cycle can vary substantially by advertiser and agency, but typically is one to nine months. We have a number of account executive sales teams organized by geography and the following market segments:
| Ÿ | Direct Advertisers and Independent Agencies. Our account executives cover broad geographic territories, responding to sales leads generated by our marketing department. |
| Ÿ | Network Agencies. Our agency account executives establish global agency relationships and work with agencies to increase adoption of our platform across their clients. |
| Ÿ | Strategic Accounts. Our strategic account executives directly target large advertisers. |
| Ÿ | Telesales. Our inside sales team targets organizations which purchase our solutions over the phone. |
Each customer is assigned an account manager who is responsible for long-term customer satisfaction and retention, renewal, and driving the expansion of the use of our platform.
89
Table of Contents
Our marketing team is focused on driving awareness and demand generation across major markets. This team provides thought leadership in the form of white papers, benchmarking reports, bylines, presenting at industry conferences and speaking to the press. In addition, they are responsible for the creation of field enablement assets such as case studies, blog posts and corporate collateral. They also provide customer- and industry-based input on product roadmap and platform innovation to ensure our industry leadership.
Global Services
Our global services organization includes both professional services and support services.
Professional Services. Our professional services team is responsible for customer onboarding, as well as publisher and revenue data integration. We have a team-based approach to project management with a focus on areas of specialization. Typical implementations take four to six weeks and follow our project management methodology. Our professional services team certifies third party platform providers for customer revenue data integration. The certification program benefits customers by minimizing data discrepancies, allowing for faster onboarding, and shortening time to improve business results. As of September 30, 2012, we had certified 12 third-party platforms.
Support Services and Customer Services. Our support and customer services team is responsible for providing training and delivering day-to-day platform support. Our team is staffed by digital advertising personnel with deep experience in our platform. Our professionals focus on customer satisfaction and value realization and offer training and support in English, French, German, Mandarin and Japanese. In addition, we offer online ticketing capabilities to manage customer support requests, email and phone support via a tiered support structure, an eLearning Curriculum and Community Portal, and an adaptive training module.
Competition
The overall market for digital advertising management solutions is rapidly evolving, highly competitive, complex, fragmented, and subject to changing technology and shifting customer needs. We face significant competition in this market and we expect competition to intensify in the future. To maintain and improve our competitive position, we must keep pace with the evolving needs of our customers and continue to develop and introduce new modules, features and services in a timely and efficient manner.
We currently compete with large, well-established companies, such as Adobe Systems Incorporated and Google Inc. (through its wholly-owned subsidiary DoubleClick), and privately-held companies, such as Acquisio Inc., which focuses solely on agencies, and Kenshoo Ltd. We also compete with in-house proprietary tools and custom solutions, including spreadsheets.
We believe the principal competitive factors in our market include the following:
| Ÿ | solution quality, breadth, flexibility and functionality; |
| Ÿ | tangible platform benefits; |
| Ÿ | level of customer satisfaction and our ability to respond to customer needs rapidly; |
| Ÿ | breadth and quality of advertiser and agency relationships; |
| Ÿ | ability to innovate and develop new or improved products and modules; |
| Ÿ | ability to respond to changes in publishers’ APIs; |
90
Table of Contents
| Ÿ | brand awareness and reputation; and |
| Ÿ | size of customer base. |
We believe that we compete favorably with respect to the factors described above. Our ability to remain competitive will largely depend on our ongoing performance in the areas of our solution breadth and customer support.
Employees and Culture
Since our founding, we have regarded our team and culture as key differentiators and competitive strengths. Our culture guides how we treat our team members, customers and partners. Although we are a technology company, everything that we do begins with our team members as they are the ones who create our technology and deliver it to our customers.
We believe that by making Marin Software a company at which we all want to work, we can recruit team members and partners to enable us to best innovate and deliver results for our customers. We do this by providing competitive compensation and benefits as well as opportunities for professional growth, advancement and enjoyment in the workplace. We also actively solicit feedback from our team members.
Our culture is focused on customer success with a belief that each team member has a customer, either internal or external. We also seek to promote an environment of candor, mutual respect, teamwork, ownership, innovation, humility and giving back.
We also believe we have an obligation to help the communities in which we have employees, customers and partners. We do this principally by encouraging employee volunteerism, employee donation matching and other charitable activities.
As of September 30, 2012, we had a total of 386 regular full-time employees, including 98 employees located outside the United States. None of our employees is represented by a labor union or covered by a collective bargaining agreement. We have not experienced any work stoppages, and we consider our relations with our employees to be good.
Intellectual Property
Our intellectual property rights are a key component of our success. We rely on a combination of patent, trademark, copyright, unfair competition and trade secret laws, as well as confidentiality procedures and contractual restrictions, to establish, maintain and protect our proprietary rights. These laws, procedures and restrictions provide only limited protection and any of our intellectual property rights may be challenged, invalidated, circumvented, infringed or misappropriated. Further, the laws of certain countries do not protect proprietary rights to the same extent as the laws of the United States and, therefore, in certain jurisdictions, we may be unable to protect our proprietary technology. We generally require employees, consultants, utility customers, suppliers and partners to execute confidentiality agreements with us that restrict the disclosure of our intellectual property. We also generally require our employees and consultants to execute invention assignment agreements with us that protect our intellectual property rights.
As of September 30, 2012, we had one issued patent and one patent application pending in the United States. Historically, despite substantial investment in research and development activities, we have not focused on patents and patent applications, although this may change in the future.
91
Table of Contents
We own and use trademarks on or in connection with our products and services, including one trademark registered with the European Union and unregistered common law marks and pending trademark applications in the United States, Australia, China, Japan and Singapore. We have also registered numerous Internet domain names.
Facilities
Our corporate headquarters are located in San Francisco, California, where we occupy facilities totaling approximately 43,000 square feet under a lease which expires in January 2015. We use these facilities for administration, sales and marketing, research and development, engineering, customer support and professional services. We also lease office space in Austin, Texas, Chicago, Illinois, Mountain View, California and New York, New York in the United States, and Australia, England, France, Germany, Japan and Singapore, which we use principally for sales and marketing, administration, customer support and to deliver professional services locally. We also lease office space in Portland, Oregon, which we use principally for engineering.
We intend to procure additional space as we add employees and expand geographically. We believe that our facilities are adequate to meet our needs for the immediate future, and that, should it be needed, suitable additional space will be available to accommodate any such expansion of our operations.
Legal Proceedings
From time to time, we may become involved in legal proceedings arising in the ordinary course of our business. We are not presently a party to any legal proceedings that, if determined adversely to us, would individually or taken together have a material adverse effect on our business, operating results, financial condition or cash flows.
92
Table of Contents
Executive Officers and Directors
The following table provides information regarding our executive officers and directors as of December 31, 2012:
| Name |
Age | Position | ||||
| Executive Officers: |
||||||
| Christopher A. Lien |
46 | Founder, Chief Executive Officer and Director | ||||
| Joseph Chang |
37 | Co-Founder and Chief Technical Officer | ||||
| Rashmi Garde |
47 | General Counsel | ||||
| John A. Kaelle |
43 | EVP and Chief Financial Officer | ||||
| Nancy A. Kato |
58 | Chief People Officer | ||||
| Wister Walcott |
46 | Co-Founder and EVP, Products and Platform | ||||
| Peter Wooster |
43 | Chief Revenue Officer | ||||
| Non-Employee Directors: |
||||||
| Paul R. Auvil III(1) |
49 | Director | ||||
| L. Gordon Crovitz(1)(3) |
54 | Director | ||||
| Bruce W. Dunlevie(1)(2)(3) |
56 | Director | ||||
| Donald P. Hutchison(2) |
56 | Director | ||||
| (1) | Member of the Audit Committee. |
| (2) | Member of the Compensation Committee. |
| (3) | Member of the Nominating and Governance Committee. |
Executive Officers
Christopher A. Lien founded our company in 2006 and has served as our Chief Executive Officer and a director since that time. Shortly after founding our company, he invited Wister Walcott and Joseph Chang to join him as co-founders. Prior to that, Mr. Lien served as Chief Operating Officer of Adteractive, Inc., an online performance marketing company, from 2004 to 2005. In 2001, Mr. Lien co-founded and served as Chairman and Chief Financial Officer of Sugar Media, a broadband services platform, until its acquisition in 2003 by 2Wire, Inc., a leading supplier of DSL equipment and services, which was subsequently acquired by Pace plc in 2010. Prior to that, Mr. Lien served in various capacities at BlueLight.com, Kmart’s e-commerce and Internet service provider subsidiary from 2000 to 2001, including as Chief Financial Officer and acting Chief Executive Officer. Prior to Bluelight.com, Mr. Lien spent 10 years at various investment banks, including Morgan Stanley and Evercore Partners, with his last role as Managing Director. Mr. Lien holds an A.B. from Dartmouth College, where he was elected as a member of Phi Beta Kappa, and an M.B.A. from the Stanford Graduate School of Business. As our Chief Executive Officer, Mr. Lien is the general manager of our entire business, directing our management team to achieve our strategic, financial and operating goals. His presence as a member of our board of directors brings his thorough knowledge of our company into our board of directors’ strategic and policy-making discussions. He brings his extensive experience in finance, digital marketing and executive roles in the information technology industry into deliberations regarding our strategy and operations.
Joseph Chang co-founded our company in 2006 and has served as our Chief Technical Officer since that time. Mr. Chang served as Vice President of Information Systems at W.P. Carey, a publicly-traded real estate investment firm, from April 2004 to June 2006. From November 2001 to April 2004, Mr. Chang served as technical architect at Mercer Consulting, a consulting firm. Prior to working at Mercer Consulting, Mr. Chang held a number of positions at Bluelight.com, jcrew.com and Trilogy Software. Mr. Chang holds a B.S. in Industrial Engineering with a minor in Computer Science from Stanford University.
93
Table of Contents
Rashmi Garde has served as our General Counsel since July 2011. Prior to joining us, Ms. Garde worked as an independent legal consultant from September 2010 until June 2011. From October 2009 until August 2010, Ms. Garde was not employed. Prior to that, Ms. Garde worked at VMware, Inc., an enterprise software company, since 2001, most recently serving as Vice President and General Counsel of VMware, Inc. from September 2005 to September 2009. Prior to joining VMware, Ms. Garde was a senior attorney at Electronics for Imaging (EFI), a printing technology company, and was a corporate associate at Graham and James and at Fenwick & West. Ms. Garde holds a B.A. in Computer Science from University of California, Berkeley, and a J.D. from University of California, Berkeley, School of Law.
John A. Kaelle has served as our Executive Vice President and Chief Financial Officer since March 2011. Prior to joining our company, Mr. Kaelle spent six years as Vice President of Finance and Investor Relations at Shutterfly, Inc., an Internet-based personal publishing service, from October 2004 to March 2011. From August 2000 to July 2004, Mr. Kaelle served as a Vice President in the mergers and acquisitions group at Thomas Weisel Partners, an investment bank. From 1997 to 1998, Mr. Kaelle served as an Assistant Vice President and Assistant Controller at TriNet Corporate Realty Trust, a publicly traded real estate investment trust, and prior to that, from 1992 until 1997, Mr. Kaelle served as a manager at Cooper and Lybrand’s audit and advisory practice. Mr. Kaelle holds a B.A. in Economics from the University of Michigan, a Master’s Degree in Taxation from Golden Gate University and an M.B.A. in Finance from the Wharton School at the University of Pennsylvania. Mr. Kaelle is also a certified public accountant (inactive) in the state of California.
Nancy A. Kato has served as our Chief People Officer since September 2012. From April 2006 to September 2012, Ms. Kato served as Senior Vice President of Human Resources at TiVo, Inc., a provider of on-demand television services, and previously served as TiVo’s Vice President, Human Resources from January 2005 to April 2006. From January 2003 to January 2005, Ms. Kato was Vice President of Global Compensation at Hewlett-Packard Company, an IT equipment and services company. From December 2000 to October 2002, Ms. Kato was Senior Vice President of Human Resources for Ariba, Inc., a cloud-based provider of procurement software. She has also held senior roles at Compaq and Tandem. Ms. Kato holds a B.A. in Health Sciences and M.A. in Counselor Education and Counseling from California State University, San Jose.
Wister Walcott co-founded our company in 2006 and served as Vice President of Products and Platform until March 2012 when he was promoted to Executive Vice President of Products and Platform. From 2004 to 2005, Mr. Walcott was the Vice President of Marketing at Composite Software, an enterprise data integration software provider. Prior to that, Mr. Walcott served as Senior Director of Product Management at Siebel Systems, a CRM software provider, from 1999 to 2004, when it was acquired by Oracle Corporation, an enterprise software company. Prior to Siebel, from 1996 to 1999, Mr. Walcott was the Vice President of Marketing at Pilot Network Services, Inc., an Internet security provider. From 1993 to 1995, and from 1988 to 1991, Mr. Walcott worked at Oracle Corporation, where he held a variety of technical and management positions. Mr. Walcott holds a B.S. in Computer Science (with honors) and an M.B.A. from Harvard University.
Peter Wooster has served as our Chief Revenue Officer since September 2012 after previously serving as our Vice President and Executive Vice President of Sales since March 2007. From October 2004 to December 2006, Mr. Wooster served as Vice President of Sales for Angel Points Inc., a workforce management application provider. Prior to that, Mr. Wooster served as a Strategic Account Executive at salesforce.com, a provider of cloud-based CRM solutions, from October 1999 to February 2004. Mr. Wooster served as an Account Executive for Major Markets at Paychex Corporation, an HR and payroll process software company, from January 1994 to September 1999. Mr. Wooster holds a B.A. in Specialized Studies from Ohio University.
94
Table of Contents
Non-Employee Directors
Paul R. Auvil III has served as a director since October 2009. Since March 2007, Mr. Auvil has served as the Chief Financial Officer of Proofpoint, Inc., a provider of security-as-a-service solutions. From September 2006 to March 2007, Mr. Auvil was with Benchmark Capital, a venture capital firm, as an entrepreneur-in-residence. Prior to that, from 2002 to July 2006, he served as the Chief Financial Officer at VMware, Inc., a virtualization company. Previously, he served as the Chief Financial Officer for Vitria Technology, Inc., an eBusiness platform company and held various executive positions at VLSI Technology, Inc., a semiconductor and circuit manufacturing company, including Vice President of the Internet and Secure Products Division. Since 2007, Mr. Auvil has served on the board of directors for Quantum Corporation. From 2009 to 2010, Mr. Auvil served on the board of directors of OpenTV Corp. Mr. Auvil holds an A.B. in Engineering Sciences and a Bachelor of Engineering degree from Dartmouth College and a Master of Management degree in Finance and Marketing from the J.L. Kellogg Graduate School of Management, Northwestern University. Mr. Auvil is an experienced financial leader with the skills necessary to lead our audit committee. His current service as Chief Financial Officer at Proofpoint, a software as a service business, and service as a member of the audit committee of Quantum, as well as previously serving as Chief Financial Officer at VMware and chairman of the audit committee of OpenTV, have provided him with extensive financial and accounting experience, particularly in the areas of accounting principles, financial reporting rules and regulations, as well as in evaluating financial results and generally overseeing the financial reporting process at a public company.
L. Gordon Crovitz has served as a director since May 2012. Mr. Crovitz co-founded Journalism Online, LLC, a provider of e-commerce solutions for publishers, in April 2009. From 2008 until April 2009, Mr. Crovitz was an active angel investor in, and advisor to, privately-held media and technology companies. Prior to that, Mr. Crovitz worked at Dow Jones from 1980 until December 2007 in a variety of positions, most recently as a publisher of The Wall Street Journal and executive vice president. Mr. Crovitz is a member of the boards of directors of American Association of Rhodes Scholars, Blurb, Business Insider, Houghton Mifflin Harcourt, ProQuest and Star Tribune Media, each of which is a privately-held entity. Mr. Crovitz holds an A.B. in Politics, Economics, Rhetoric and Law from the University of Chicago, a B.A. in Jurisprudence from the University of Oxford and a J.D. from Yale Law School. Mr. Crovitz brings to our board of directors a diversity of distinguished experiences and seasoned business acumen, particularly extensive experience in the media and publishing industries. His service on a number of company boards provides an important perspective on corporate governance matters, including best practices established at other companies.
Bruce W. Dunlevie has served as a director since March 2008. Since May 1995, Mr. Dunlevie has been a General Partner of Benchmark Capital, a venture capital firm. He has served as a member of the board of directors of ServiceSource International, Inc., a service support provider, since December 2004. Mr. Dunlevie previously served as a member of the board of directors of Rambus Inc., a technology licensing company, from March 1990 to June 2011, and as a member of the board of directors of Palm, Inc., a provider of mobile products, from October 2003 to October 2007. Mr. Dunlevie holds a B.A. in History and English from Rice University and an M.B.A. from the Stanford Graduate School of Business. Mr. Dunlevie is a longstanding member of our board of directors with a deep understanding of our business and our customer base, and he has extensive experience as an investor in technology companies on behalf of Benchmark Capital. Mr. Dunlevie brings the experience of having served on the board of several other technology companies.
Donald P. Hutchison has served as a director since April 2006. Since 2002, Mr. Hutchison’s principal employment has been as an angel investor in start-up technology companies. From June 2006 to July 2008, Mr. Hutchison was the Co-Founder and Chairman of the Board of Directors of Recurrent Energy, a solar energy provider. Prior to that, Mr. Hutchison served as the Chief Executive Officer and Chairman of the Board of work.com, a joint venture established by Dow Jones and
95
Table of Contents
Excite@Home. Mr. Hutchison previously served in senior positions at Excite@Home and Netcom Communications. Mr. Hutchison previously served as a member of the board of directors of many privately-held companies, including, W&W Communications, Inc., a fabless semiconductor company, which was acquired by Cavium, Inc. Mr. Hutchison holds a B.A. in Economics from University of California, Santa Barbara, and an M.B.A. in Finance and Organizational Development from Loyola Marymount University. Mr. Hutchison brings to our board of directors significant experience analyzing and investing in other technology companies, as well as management and leadership experience as a former founder and executive of technology companies.
Election of Officers
Our executive officers are elected by, and serve at the discretion of, our board of directors. There are no family relationships among any of our directors or executive officers.
Board of Directors
Our board of directors may establish the authorized number of directors from time to time by resolution. Our board of directors currently consists of five members. Our current certificate of incorporation and voting agreement among certain investors provide for one director to be designated by holders of our common stock, one director to be designated by holders of our Series B preferred stock and three directors to be designated mutually by holders of our common stock and Series B preferred stock. Mr. Lien is the designee of our common stock, Mr. Dunlevie is the designee of our Series B preferred stock and Messrs. Auvil, Crovitz, and Hutchison are the mutual designees of our common stock and Series B preferred stock.
The voting agreement and the provisions of our certificate of incorporation by which Messrs. Lien, Auvil, Crovitz, Dunlevie and Hutchison were elected will terminate in connection with our initial public offering and there will be no contractual obligations regarding the election of our directors. Each of our current directors will continue to serve until the election and qualification of his or her successor, or his or her earlier death, resignation or removal.
Classified Board of Directors
Our restated certificate of incorporation and restated bylaws that will be in effect upon the completion of this offering provide for a classified board of directors consisting of three classes of directors, each serving staggered three-year terms. Our directors will be divided among the three classes as follows:
| Ÿ | Class I directors, whose initial term will expire at the annual meeting of stockholders to be held in 2014, will consist of Messrs. Auvil and Crovitz; |
| Ÿ | Class II directors, whose initial term will expire at the annual meeting of stockholders to be held in 2015, will consist of Messrs. Dunlevie and Hutchison; and |
| Ÿ | Class III directors, whose initial term will expire at the annual meeting of stockholders to be held in 2016, will consist of Mr. Lien. |
Directors in a particular class will be elected for three-year terms at the annual meeting of stockholders in the year in which their terms expire. As a result, only one class of directors will be elected at each annual meeting of our stockholders, with the other classes continuing for the remainder of their respective three-year terms. Each director’s term continues until the election and qualification of his or her successor, or his or her earlier death, resignation or removal.
96
Table of Contents
Our restated certificate of incorporation and restated bylaws that will be in effect upon the completion of this offering authorize only our board of directors to fill vacancies on our board of directors. Any additional directorships resulting from an increase in the authorized number of directors would be distributed among the three classes so that, as nearly as possible, each class would consist of one-third of the authorized number of directors.
The classification of our board of directors may have the effect of delaying or preventing changes in our control or management. See “Description of Capital Stock—Anti-Takeover Provisions—Restated Certificate of Incorporation and Restated Bylaw Provisions.”
Director Independence
Our common stock will be listed on the New York Stock Exchange. The listing rules of this stock exchange generally require that a majority of the members of a listed company’s board of directors be independent within specified periods following the closing of an initial public offering. Our board of directors has determined that none of our non-employee directors has a relationship that would interfere with the exercise of independent judgment in carrying out the responsibilities of a director and that each of these directors is “independent” as that term is defined under the rules of the New York Stock Exchange.
Audit committee members must also satisfy the independence criteria set forth in Rule 10A-3 under the Securities and Exchange Act of 1934, as amended (Exchange Act). In order to be considered independent for purposes of Rule 10A-3, a member of an audit committee of a listed company may not, other than in his or her capacity as a member of the audit committee, the board of directors, or any other board committee: accept, directly or indirectly, any consulting, advisory, or other compensatory fee from the listed company or any of its subsidiaries; or be an affiliated person of the listed company or any of its subsidiaries. We intend to satisfy the audit committee independence requirements of Rule 10A-3 as of the closing of our initial public offering.
Board Committees
Our board of directors has established an audit committee, a compensation committee, and a nominating and governance committee. Each of these committees will have the composition and responsibilities described below as of the closing of our initial public offering. Members serve on these committees until their resignations or until otherwise determined by our board of directors.
Audit Committee
Our audit committee is comprised of Messrs. Auvil, Crovitz and Dunlevie. Mr. Auvil is the chairman of our audit committee. The composition of our audit committee meets the requirements for independence under the current New York Stock Exchange and SEC rules and regulations. Each member of our audit committee is financially literate. In addition, our board of directors has determined that Mr. Auvil is an “audit committee financial expert” as defined in Item 407(d)(5)(ii) of Regulation S-K promulgated under the Securities Act. This designation does not impose on him any duties, obligations or liabilities that are greater than are generally imposed on members of our audit committee and our board of directors. Our audit committee is directly responsible for, among other things:
| Ÿ | selecting a firm to serve as the independent registered public accounting firm to audit our financial statements; |
| Ÿ | monitoring the independence of the independent registered public accounting firm; |
| Ÿ | discussing the scope and results of the audit with the independent registered public accounting firm, and reviewing, with management and that firm, our interim and year-end operating results; |
97
Table of Contents
| Ÿ | establishing procedures for employees to submit anonymously concerns about questionable accounting or audit matters; |
| Ÿ | considering the adequacy of our internal controls; |
| Ÿ | reviewing material related party transactions or those that require disclosure; and |
| Ÿ | approving or, as permitted, pre-approving all audit and non-audit services to be performed by the independent registered public accounting firm. |
Compensation Committee
Our compensation committee is comprised of Messrs. Dunlevie and Hutchison. Mr. Hutchison is the chairman of our compensation committee. Each member of this committee is an outside director, as defined pursuant to Section 162(m) of the Code, as amended, or the Code. Our compensation committee is responsible for, among other things:
| Ÿ | reviewing and approving, or recommending that our board of directors approve, the compensation of our executive officers; |
| Ÿ | reviewing and recommending to our board of directors the compensation of our directors; |
| Ÿ | reviewing and recommending to our board of directors the terms of any compensatory agreements with our executive officers; |
| Ÿ | administering our stock and equity incentive plans; |
| Ÿ | reviewing and approving, or making recommendations to our board of directors with respect to, incentive compensation and equity plans; and |
| Ÿ | reviewing our overall compensation philosophy. |
Nominating and Governance Committee
Our nominating and governance committee is comprised of Messrs. Crovitz and Dunlevie. Mr. Crovitz is the chairman of our nominating and governance committee. Our nominating and governance committee is responsible for, among other things:
| Ÿ | identifying and recommending candidates for membership on our board of directors; |
| Ÿ | reviewing and recommending our corporate governance guidelines and policies; |
| Ÿ | reviewing proposed waivers of the code of conduct for directors and executive officers; |
| Ÿ | overseeing the process of evaluating the performance of our board of directors; and |
| Ÿ | assisting our board of directors on corporate governance matters. |
Compensation Committee Interlocks and Insider Participation
None of our executive officers has served as a member of the board of directors, or as a member of the compensation or similar committee, of any entity that has one or more executive officers who served on our board of directors or compensation committee during the year ended December 31, 2012.
Code of Conduct
Our board of directors has adopted a code of conduct that will apply to all of our employees, officers, and directors. The full text of our code of conduct will be posted on the Investor Relations section of our website. The reference to our website address in this prospectus does not include or
98
Table of Contents
incorporate by reference the information on our website into this prospectus. We intend to disclose future amendments to certain provisions of our code of conduct, or waivers of these provisions, on our website or in public filings.
Director Compensation
The following table presents the total compensation paid in 2012 for each member of our board of directors. Other than as set forth in the table and described more fully below, in 2012 we did not pay any fees to, reimburse any expense of (other than customary expenses in connection with the attendance of meetings of our board of directors), make any equity awards or non-equity awards to, or pay any other compensation to any of the other non-employee members of our board of directors. Mr. Lien, who is our Chief Executive Officer, receives no compensation for his service as a director, and is not included in this table. The compensation received by Mr. Lien as an employee is presented in “Executive Compensation—2012 Summary Compensation Table.”
| Director Name |
Option Awards ($)(1)(2) |
Total ($) |
||||||
| Paul Auvil |
$ | 123,028 | $ | 123,028 | ||||
| Gordon Crovitz |
201,389 | 201,389 | ||||||
| Bruce Dunlevie |
— | — | ||||||
| Donald Hutchison |
123,028 | 123,028 | ||||||
| (1) | The amounts reported in the Option Awards column represent the grant date fair value of the stock options granted to the non-employee directors during 2012, computed in accordance with ASC 718. The amounts reported in this column reflect the accounting cost for these stock-based awards, and do not correspond to the actual economic value that may be received by the non-employee directors from the awards. |
| (2) | The following table sets forth information on stock options granted to non-employee directors in 2012, the aggregate number of shares of our common stock subject to outstanding stock options held by our non-employee directors as of December 31, 2012 and the aggregate number of unvested shares of common stock held by our non-employees directors as of December 31, 2012: |
| Director |
Number of Shares Underlying Stock Options Granted in 2012(a) |
Number of Shares Underlying Stock Options Held at Fiscal Year-End |
Number of Shares Underlying Unvested Stock Awards Held at Fiscal Year-End |
|||||||||
| Paul Auvil |
20,000 | 20,000 | 9,183 | |||||||||
| Gordon Crovitz |
53,007 | — | 70,398 | (b) | ||||||||
| Bruce Dunlevie |
— | — | — | |||||||||
| Donald Hutchison |
20,000 | 20,000 | — | |||||||||
| (a) | As of the date of grant, these stock options were immediately exercisable in full. Any shares subject to an option that have been exercised but have not yet vested are subject to a right of repurchase in our favor at the option exercise price. These stock options vest over a four-year period at the rate of 1/48th of the shares of common stock underlying this stock option each month following the vesting commencement date and expire 10 years after the date of grant. These stock options also provide that, in the event of a “change of control,” all of the shares of our common stock subject to such option will immediately vest, and the right of repurchase with respect to any unvested shares shall lapse, in full as of the effectiveness of the change of control. |
| (b) | Includes 45,279 shares of common stock acquired upon the exercise of a stock option that are subject to a right of repurchase in our favor at the option exercise price, expiring monthly over a 48-month period from the vesting commencement date. Also includes |
99
Table of Contents
| 25,122 shares of unvested common stock acquired through the purchase of shares at the then-fair market value that are subject to a right of repurchase in our favor in the event that he resigns from the Board of Directors without good reason or he is asked to resign from our board of directors for cause at the original purchase price, expiring monthly over a 24-month period from the vesting commencement date. |
For purposes of option grants and shares of unvested common stock granted to our directors as set forth above, a “change of control” means a:
| Ÿ | consolidation, reorganization, or merger with or into any other entity or entities in which the holders of our outstanding shares immediately before such transaction do not, immediately after such transaction, retain stock or other ownership interests representing a majority of the voting power of the surviving entity or entities; or |
| Ÿ | a sale or all or substantially all of our assets that is followed by a distribution of the proceeds to our stockholders. |
100
Table of Contents
Overview
The following tables and accompanying narrative disclosure set forth information about the compensation provided to certain of our senior executive officers during 2012. These executive officers, who include our principal executive officer and the two most highly-compensated executive officers (other than our principal executive officer) who were serving as executive officers at the end of 2012, were:
| Ÿ | Christopher Lien, our founder and Chief Executive Officer; |
| Ÿ | Joseph Chang, our co-founder and Chief Technical Officer; and |
| Ÿ | Wister Walcott, our co-founder and Executive Vice President, Products and Platform. |
We refer to these individuals as our “Named Executive Officers.”
2012 Summary Compensation Table
The following table presents summary information regarding the total compensation for services rendered in all capacities that was awarded to, earned by, and paid to our Chief Executive Officer and the two most highly-compensated executive officers who were serving as executive officers as of December 31, 2012, the end of the last completed fiscal year.
| Name and Principal Position |
Year | Salary ($) |
Bonus ($) |
Option Awards ($)(1) |
Non-Equity Incentive Plan Compensation ($) |
All Other Compensation ($)(2) |
Total ($) |
|||||||||||||||||||
| Christopher Lien, |
2012 | $ | 275,000 | $ | 978,020 | $ | $ | 1,757,688 | $ | |||||||||||||||||
| Chief Executive Officer |
||||||||||||||||||||||||||
| Joseph Chang, |
2012 | 275,000 | 244,504 | 144,280 | ||||||||||||||||||||||
| Chief Technical Officer |
||||||||||||||||||||||||||
| Wister Walcott, |
2012 | 275,000 | 244,504 | 173,133 | ||||||||||||||||||||||
| Executive Vice President, Products and Platform |
||||||||||||||||||||||||||
| (1) | The amounts reported in the Option Awards column represent the grant date fair value of the stock options granted to the Named Executive Officers during 2011 and 2012 as computed in accordance with Financial Accounting Standards Board Accounting Standards Codification Topic 718, or ASC 718. The assumptions used in calculating the grant date fair value of the stock options reported in the Option Awards column are set forth in Note 9 to the audited consolidated financial statements included in this prospectus. Note that the amounts reported in this column reflect the accounting cost for these stock options, and do not correspond to the actual economic value that may be received by the Named Executive Officers from the options. |
| (2) | In January 2012, we redeemed shares of common stock held by Messrs. Lien, Chang and Walcott at a price per share equal to the issuance price per share of the Series F preferred stock, a price greater than the estimated fair market value of the underlying common stock on the date of the redemption. The difference in the price we paid in redeeming the shares of common stock from Messrs. Lien, Chang and Walcott and the then-fair market value of the common stock was deemed to be treated as taxable income for these individuals. As a result, Messrs. Lien, Chang and Walcott received compensation in the amounts of $1,731,312, $144,280 and $173,133, |
101
Table of Contents
| respectively, for 2012. In addition, with respect to Mr. Lien, the amount included in this column includes $26,376 in medical insurance coverage premiums that we pay for him. |
The following is a description of the employment agreements with, and the equity awards granted to, the Named Executive Officers.
Employment Agreements
With the exception of Mr. Chang, we have not entered into employment offer letters with the Named Executive Officers in connection with their commencement of employment with us. Mr. Chang’s offer letter was negotiated on our behalf by our Chief Executive Officer, with the oversight and approval of our board of directors.
Mr. Chang’s Employment Offer Letter
On June 15, 2006, we extended an employment offer letter to Mr. Chang in connection with his appointment as our then-Vice President of Engineering. Mr. Chang accepted the terms and conditions of this employment offer on June 15, 2006. The terms and conditions of his employment agreement provided for an annual base salary of $150,000, subject to adjustment from time to time and participation in our regular bonus, health insurance, and other employee benefit plans as we established for our employees from time to time. In addition, he was granted an option to purchase shares of our common stock, with an exercise price equal to the fair market value of our common stock on the date of grant.
Mr. Chang’s employment is “at-will,” meaning that his employment may be terminated for any reason at any time, with or without prior notice and with or without cause. Further, the employment offer was subject to his execution of our standard Employee Invention Assignment and Confidentiality Agreement.
Post-Employment Compensation and Change in Control Payments and Benefits
The Named Executive Officers are not eligible to receive any severance payments or benefits in connection with a termination of employment, including following a change in control, except as follows.
The stock options granted to each of the Named Executive Officers provide that, in the event that, within 12 months following the closing of a “change of control,” his employment is “terminated without cause” or his employment is “constructively terminated,” 50% of the shares of our common stock subject to his options will immediately vest as of the effectiveness of such termination of employment.
For purposes of this provision, a “change of control” means a:
| Ÿ | consolidation, reorganization, or merger with or into any other entity or entities in which the holders of our outstanding shares immediately before such transaction do not, immediately after such transaction, retain stock or other ownership interests representing a majority of the voting power of the surviving entity or entities; or |
| Ÿ | a sale or all or substantially all of our assets that is followed by a distribution of the proceeds to our stockholders. |
For purposes of this provision, a Named Executive Officer’s employment will be deemed to have been “terminated without cause” in the event that his employment is terminated other than by him for any reason other than any one or more of the following reasons:
| Ÿ | his continued refusal or material failure to perform his material duties reasonably expected of him in connection with his arrangement to provide services to us after he is given notice and a reasonable opportunity to cure; |
102
Table of Contents
| Ÿ | unprofessional, unethical, or fraudulent conduct or conduct that materially discredits our company or is materially detrimental to the reputation, character, or standing of our company; |
| Ÿ | dishonest conduct with respect to a material matter, or a deliberate attempt to do an injury to our company; |
| Ÿ | his material breach of any material term of his stock option agreement or any other agreement with us; |
| Ÿ | a criminal act which would reflect badly on our company; or |
| Ÿ | his death or total disability. |
For purposes of this provision, a Named Executive Officer’s employment will be deemed to have been “constructively terminated” in the event that his employment is terminated by him within 30 days and for any one or more of the following reasons:
| Ÿ | a reduction of 30% or more in his minimum annual salary, unless he consents thereto in his discretion, or the minimum annual salaries of all of our executive officers are similarly reduced; |
| Ÿ | a material reduction in his responsibilities not agreed to by him; |
| Ÿ | the failure by us to comply in any material respect with any material term of his stock option agreement; or |
| Ÿ | a requirement that he relocate his primary workplace to an office more than 45 miles from our current headquarters. |
In addition to the arrangements described above, upon a termination of employment each Named Executive Officer is eligible to receive any benefits accrued under our broad-based benefit plans, such as accrued vacation pay, in accordance with those plans and policies.
2012 Outstanding Equity Awards at Fiscal Year-End Table
The following table presents, for each of the Named Executive Officers, information regarding outstanding stock options and other equity awards held as of December 31, 2012. The market value of the shares of our common stock reflected in the table is based upon the midpoint of the price range set forth on the cover of this prospectus.
| Name |
Option Awards—Number of Securities Underlying Unexercised Options (#) Exercisable(1) |
Option Awards— Option Exercise Price ($) |
Option Awards— Option Expiration Date |
|||||||||
| Christopher Lien, Chief Executive Officer |
257,421 | (2) | $ | 7.05 | 05/07/2022 | |||||||
| Joseph Chang, Chief Technical Officer |
100,000 | 0.14 | 07/08/2017 | |||||||||
| 105,490 | (3) | 0.82 | 02/09/2020 | |||||||||
| 68,500 | (4) | 2.39 | 01/27/2021 | |||||||||
| 64,355 | (5) | 7.05 | 05/07/2022 | |||||||||
| Wister Walcott, Executive Vice President, Products and Platform |
26,659 | (6) | 2.39 | 01/27/2021 | ||||||||
| (1) | These stock options are immediately exercisable in full as of the date of grant. Any shares subject to an option that have been exercised but have not yet vested are subject to a right of repurchase in our favor at the option exercise price. This vesting schedule with respect to each stock option is described in the notes below. |
103
Table of Contents
| (2) | This stock option vests over a four-year period at the rate of 1/48th of the shares of common stock underlying this stock option each month following the vesting commencement date. As of December 31, 2012, 214,525 shares of common stock remained unvested. |
| (3) | These stock options vest over a four-year period at the rate of 1/48th of the shares of common stock underlying these stock options each month following the vesting commencement date. As of December 31, 2012, 30,792 shares of common stock remained unvested. |
| (4) | These stock options vest over a four-year period at the rate of 1/48th of the shares of common stock underlying these stock options each month following the vesting commencement date. As of December 31, 2012, 35,678 shares of common stock remained unvested. |
| (5) | These stock options vest over a four-year period at the rate of 1/48th of the shares of common stock underlying these stock options each month following the vesting commencement date. As of December 31, 2012, 53,635 shares of common stock remained unvested. |
| (6) | These stock options vest over a four-year period at the rate of 1/48th of the shares of common stock underlying these stock options each month following the vesting commencement date. As of December 31, 2012, 13,894 shares of common stock remained unvested. |
Employee Benefit Plans
2006 Equity Incentive Plan
Our board of directors adopted our 2006 Equity Incentive Plan in April 2006. Our 2006 Equity Incentive Plan was also approved by our stockholders in April 2006. The 2006 Equity Incentive Plan provides for the grant of both incentive stock options, which qualify for favorable tax treatment to their recipients under Section 422 of the Code, and nonstatutory stock options, as well as for the issuance of shares of restricted stock. We may grant incentive stock options only to our employees. We may grant nonstatutory stock options to our employees, directors and consultants. The exercise price of each stock option must be at least equal to the fair market value of our common stock on the date of grant. The exercise price of incentive stock options granted to 10% stockholders must be at least equal to 110% of the fair market value of our common stock on the date of grant. The maximum permitted term of options granted under our 2006 Equity Incentive Plan is 10 years, except that the maximum permitted term of incentive stock options granted to 10% stockholders is five years. In the event of our merger or consolidation, the 2006 Equity Incentive Plan provides that, unless the applicable option agreement provides otherwise, options held by current employees, directors and consultants will vest in full if they are not assumed or substituted and all unexercised options shall expire on the consummation of the merger or consolidation.
As of September 30, 2012, we had reserved 6,332,980 shares of our common stock for issuance under our 2006 Equity Incentive Plan. As of September 30, 2012, options to purchase 2,098,293 of these shares had been exercised (of which 42,023 shares have been repurchased and returned to the pool of shares reserved for issuance under the 2006 Equity Incentive Plan), options to purchase 4,273,447 of these shares remained outstanding and 3,263 of these shares remained available for future grant. The options outstanding as of September 30, 2012 had a weighted-average exercise price of $3.72 per share. We will cease issuing awards under our 2006 Equity Incentive Plan upon the implementation of our 2013 Equity Incentive Plan. Our 2013 Equity Incentive Plan will be effective upon the date of this prospectus. As a result, we will not grant any additional options under the 2006 Equity Incentive Plan following that date, and the 2006 Equity Incentive Plan will terminate at that time. However, any outstanding options granted under the 2006 Equity Incentive Plan will remain outstanding, subject to the terms of our 2006 Equity Incentive Plan and stock option agreements, until such outstanding options are exercised or until they terminate or expire by their terms. Options granted under the 2006 Equity Incentive Plan have terms similar to those described below with respect to options to be granted under our 2013 Equity Incentive Plan.
104
Table of Contents
2013 Equity Incentive Plan
We have adopted a 2013 Equity Incentive Plan that will become effective on the date immediately prior to the date of this prospectus and will serve as the successor to our 2006 Equity Incentive Plan. We reserved shares of our common stock to be issued under our 2013 Equity Incentive Plan. The number of shares reserved for issuance under our 2013 Equity Incentive Plan will increase automatically on of each of through by the number of shares equal to % of the total outstanding shares of our common stock as of the immediately preceding December 31. However, our board of directors or compensation committee may reduce the amount of the increase in any particular year. In addition, the following shares will again be available for grant and issuance under our 2013 Equity Incentive Plan:
| Ÿ | shares subject to options or stock appreciation rights granted under our 2013 Equity Incentive Plan that cease to be subject to the option or stock appreciation right for any reason other than exercise of the option or stock appreciation right; |
| Ÿ | shares subject to awards granted under our 2013 Equity Incentive Plan that are subsequently forfeited or repurchased by us at the original issue price; |
| Ÿ | shares subject to awards granted under our 2013 Equity Incentive Plan that otherwise terminate without shares being issued; |
| Ÿ | shares surrendered, cancelled, or exchanged for cash or a different award (or combination thereof); |
| Ÿ | shares reserved but not issued or subject to outstanding grants under our 2006 Equity Incentive Plan on the date of this prospectus; |
| Ÿ | shares issuable upon the exercise of options or subject to other awards under our 2006 Equity Incentive Plan prior to the date of this prospectus that cease to be subject to such options or other awards by forfeiture or otherwise after the date of this prospectus; |
| Ÿ | shares issued under our 2006 Equity Incentive Plan that are forfeited or repurchased by us after the date of this prospectus; and |
| Ÿ | shares subject to awards under our 2006 Equity Incentive Plan that are used to pay the exercise price of an option or withheld to satisfy the tax withholding obligations related to any award. |
Our 2013 Equity Incentive Plan authorizes the award of stock options, restricted stock awards (RSAs), stock appreciation rights (SARs), restricted stock units (RSUs), performance awards and stock bonuses. No person will be eligible to receive more than shares in any calendar year under our 2013 Equity Incentive Plan other than a new employee of ours, who will be eligible to receive no more than shares under the plan in the calendar year in which the employee commences employment.
Our 2013 Equity Incentive Plan will be administered by our compensation committee, all of the members of which are outside directors as defined under applicable federal tax laws, or by our board of directors acting in place of our compensation committee. The compensation committee will have the authority to construe and interpret our 2013 Equity Incentive Plan, grant awards and make all other determinations necessary or advisable for the administration of the plan.
Our 2013 Equity Incentive Plan will provide for the grant of awards to our employees, directors, consultants, independent contractors and advisors, provided the consultants, independent contractors, directors and advisors render services not in connection with the offer and sale of securities in a capital-raising transaction. The exercise price of stock options must be at least equal to the fair market value of our common stock on the date of grant.
We anticipate that in general, options will vest over a four-year period. Options may vest based on time or achievement of performance conditions. Our compensation committee may provide for
105
Table of Contents
options to be exercised only as they vest or to be immediately exercisable with any shares issued on exercise being subject to our right of repurchase that lapses as the shares vest. The maximum term of options granted under our 2013 Equity Incentive Plan is ten years.
An RSA is an offer by us to sell shares of our common stock subject to restrictions, which may vest based on time or achievement of performance conditions. The price (if any) of an RSA will be determined by the compensation committee. Unless otherwise determined by the compensation committee at the time of award, vesting will cease on the date the participant no longer provides services to us and unvested shares will be forfeited to or repurchased by us.
Stock appreciation rights provide for a payment, or payments, in cash or shares of our common stock, to the holder based upon the difference between the fair market value of our common stock on the date of exercise and the stated exercise price up to a maximum amount of cash or number of shares. SARs may vest based on time or achievement of performance conditions.
Restricted stock units represent the right to receive shares of our common stock at a specified date in the future, subject to forfeiture of that right because of termination of employment or failure to achieve certain performance conditions. If an RSU has not been forfeited, then on the date specified in the RSU agreement, we will deliver to the holder of the restricted stock unit whole shares of our common stock (which may be subject to additional restrictions), cash or a combination of our common stock and cash.
Performance shares are performance awards that cover a number of shares of our common stock that may be settled upon achievement of the pre-established performance conditions in cash or by issuance of the underlying shares. These awards are subject to forfeiture prior to settlement because of termination of employment or failure to achieve the performance conditions.
Stock bonuses may be granted as additional compensation for service or performance, and therefore, not be issued in exchange for cash.
In the event there is a specified type of change in our capital structure without our receipt of consideration, such as a stock split, appropriate adjustments will be made to the number of shares reserved under our 2013 Equity Incentive Plan, the maximum number of shares that can be granted in a calendar year, and the number of shares and exercise price, if applicable, of all outstanding awards under our 2013 Equity Incentive Plan.
Awards granted under our 2013 Equity Incentive Plan may not be transferred in any manner other than by will or by the laws of descent and distribution or as determined by our compensation committee. Unless otherwise permitted by our compensation committee, stock options may be exercised during the lifetime of the optionee only by the optionee or the optionee’s guardian or legal representative. Options granted under our 2013 Equity Incentive Plan generally may be exercised for a period of three months after the termination of the optionee’s service to us, for a period of 12 months in the case of death or for a period of six months in the case of disability, or such longer period as our compensation committee may provide. Options generally terminate immediately upon termination of employment for cause.
If we are party to a merger or consolidation, outstanding awards, including any vesting provisions, may be assumed or substituted by the successor company. In the alternative, outstanding awards may be cancelled in connection with a cash payment. Outstanding awards that are not assumed, substituted or cashed out will accelerate in full and expire upon the merger or consolidation. In the event of specified change in control transactions, our compensation committee may accelerate the vesting of awards (a) immediately upon the occurrence of the transaction, whether or not the award is continued, assumed or substituted by a surviving corporation or its parent in the transaction, or (b) in connection with a termination of a participant’s service following such a transaction.
106
Table of Contents
Our 2013 Equity Incentive Plan will terminate ten years from the date our board of directors approves the plan, unless it is terminated earlier by our board of directors. Our board of directors may amend or terminate our 2013 Equity Incentive Plan at any time. If our board of directors amends our 2013 Equity Incentive Plan, it does not need to ask for stockholder approval of the amendment unless required by applicable law.
2013 Employee Stock Purchase Plan
We have adopted a 2013 Employee Stock Purchase Plan in order to enable eligible employees to purchase shares of our common stock at a discount following the date of this offering. Purchases will be accomplished through participation in discrete offering periods. Our 2013 Employee Stock Purchase Plan is intended to qualify as an employee stock purchase plan under Section 423 of the Code. We initially reserved shares of our common stock for issuance under our 2013 Employee Stock Purchase Plan. The number of shares reserved for issuance under our 2013 Employee Stock Purchase Plan will increase automatically on the day of of each of the first calendar years following the first offering date by the number of shares equal to the greater of % of the total outstanding shares of our common stock as of the immediately preceding December 31st (rounded to the nearest whole share) or the actual number of shares purchased under the 2013 Employee Stock Purchase Plan in the immediately preceding fiscal year. However, our board of directors or compensation committee may reduce the amount of the increase in any particular year. The aggregate number of shares issued over the term of our 2012 Employee Stock Purchase Plan will not exceed shares of our common stock.
Our compensation committee will administer our 2013 Employee Stock Purchase Plan. Our U.S.- and European-based employees generally are eligible to participate in our 2013 Employee Stock Purchase Plan if they are employed by us for at least 20 hours per week and more than five months in a calendar year. Employees who are 5% stockholders, or would become 5% stockholders as a result of their participation in our 2013 Employee Stock Purchase Plan, are ineligible to participate in our 2012 Employee Stock Purchase Plan. We may impose additional restrictions on eligibility. Under our 2013 Employee Stock Purchase Plan, eligible employees will be able to acquire shares of our common stock by accumulating funds through payroll deductions. Our eligible employees will be able to select a rate of payroll deduction between % and % of their base cash compensation. We will also have the right to amend or terminate our 2013 Employee Stock Purchase Plan at any time. Our 2013 Employee Stock Purchase Plan will terminate on the tenth anniversary of the last day of the first purchase period, unless it is terminated earlier by our board of directors.
When an initial purchase period commences, our employees who meet the eligibility requirements for participation in that purchase period will automatically be granted a nontransferable option to purchase shares in that purchase period. For subsequent purchase periods, new participants will be required to enroll in a timely manner. Once an employee is enrolled, participation will be automatic in subsequent purchase periods. Each purchase period will run for no more than six months. An employee’s participation automatically ends upon termination of employment for any reason.
Except for the first purchase period, each purchase period will be for six months (commencing each and ). The first purchase period will begin upon the effective date of this offering and will end on 2013.
No participant will have the right to purchase our shares in an amount, when aggregated with purchase rights under all our employee stock purchase plans that are also in effect in the same calendar year(s), that has a fair market value of more than $ , determined as of the first day of the applicable purchase period, for each calendar year in which that right is outstanding. In addition, no participant will be permitted to purchase more than shares during any one purchase period or
107
Table of Contents
such lesser amount determined by our compensation committee. The purchase price for shares of our common stock purchased under our 2013 Employee Stock Purchase Plan will be % of the lesser of the fair market value of our common stock on (i) the first trading day of the applicable offering period and (ii) the last trading day of each purchase period in the applicable offering period.
If we experience a change in control transaction, each outstanding right to purchase shares under our 2013 Employee Stock Purchase Plan may be assumed or an equivalent option substituted by the successor corporation. In the event that the successor corporation refuses to assume or substitute the outstanding purchase rights, any offering period that commenced prior to the closing of the proposed change in control transaction will be shortened and terminated on a new purchase date. The new purchase date will occur prior to the closing of the proposed change in control transaction and our 2013 Employee Stock Purchase Plan will then terminate on the closing of the proposed change in control.
401(k) Plan
We sponsor a retirement plan intended to qualify for favorable tax treatment under Section 401(a) of the Code, containing a cash or deferred feature that is intended to meet the requirements of Section 401(k) of the Code. U.S. employees who have attained at least 21 years of age are generally eligible to participate in the plan on the first day of the calendar month following the employees’ date of hire, subject to certain eligibility requirements. Participants may make pre-tax contributions to the plan from their eligible earnings up to the statutorily prescribed annual limit on pre-tax contributions under the Code. Participants who are 50 years of age or older may contribute additional amounts based on the statutory limits for catch-up contributions. Pre-tax contributions by participants and the income earned on those contributions are generally not taxable to participants until withdrawn. Participant contributions are held in trust as required by law. No minimum benefit is provided under the plan. An employee’s interest in his or her pre-tax deferrals is 100% vested when contributed. Although the plan provides for a discretionary employer matching contribution, to date we have not made such a contribution on behalf of employees. The Plan permits all eligible Plan participants to contribute between 1% and 100% of eligible compensation, on a pre-tax basis, into their accounts.
Limitations on Liability and Indemnification Matters
Our restated certificate of incorporation that will become effective upon the closing of this offering contains provisions that limit the liability of our directors for monetary damages to the fullest extent permitted by the Delaware General Corporation Law. Consequently, our directors will not be personally liable to us or our stockholders for monetary damages for any breach of fiduciary duties as directors, except liability for:
| Ÿ | any breach of the director’s duty of loyalty to us or our stockholders; |
| Ÿ | any act or omission not in good faith or that involves intentional misconduct or a knowing violation of law; |
| Ÿ | unlawful payments of dividends or unlawful stock repurchases or redemptions as provided in Section 174 of the Delaware General Corporation Law; or |
| Ÿ | any transaction from which the director derived an improper personal benefit. |
Our restated certificate of incorporation and our restated bylaws that will become effective upon the closing of this offering require us to indemnify our directors and officers to the maximum extent not prohibited by the Delaware General Corporation Law and allow us to indemnify other employees and agents as set forth in the Delaware General Corporation Law. Subject to certain limitations, our restated bylaws also require us to advance expenses incurred by our directors and officers for the defense of any action for which indemnification is required or permitted.
108
Table of Contents
We have entered, and intend to continue to enter, into separate indemnification agreements with our directors, officers and certain of our key employees, in addition to the indemnification provided for in our restated bylaws. These agreements, among other things, require us to indemnify our directors, officers and key employees for certain expenses, including attorneys’ fees, judgments, penalties fines and settlement amounts actually and reasonably incurred by such director, officer or key employee in any action or proceeding arising out of their service to us or any of our subsidiaries or any other company or enterprise to which the person provides services at our request. Subject to certain limitations, our indemnification agreements also require us to advance expenses incurred by our directors, officers and key employees for the defense of any action for which indemnification is required or permitted.
We believe that these charter provisions and indemnification agreements are necessary to attract and retain qualified persons such as directors, officers and key employees. We also maintain directors’ and officers’ liability insurance.
The limitation of liability and indemnification provisions in our restated certificate of incorporation and restated bylaws may discourage stockholders from bringing a lawsuit against our directors and officers for breach of their fiduciary duty. They may also reduce the likelihood of derivative litigation against our directors and officers, even though an action, if successful, might benefit us and other stockholders. Further, a stockholder’s investment may be adversely affected to the extent that we pay the costs of settlement and damage awards against directors and officers as required by these indemnification provisions.
At present, there is no pending litigation or proceeding involving any of our directors or executive officers as to which indemnification is required or permitted, and we are not aware of any threatened litigation or proceeding that may result in a claim for indemnification.
Insofar as indemnification for liabilities arising under the Securities Act may be permitted to directors, executive officers or persons controlling us, we have been informed that in the opinion of the SEC such indemnification is against public policy as expressed in the Securities Act and is therefore unenforceable.
109
Table of Contents
CERTAIN RELATIONSHIPS AND RELATED PARTY TRANSACTIONS
In addition to the executive officer and director compensation arrangements discussed above under “Executive Compensation,” below we describe transactions since January 1, 2010 to which we have been a participant, in which the amount involved in the transaction exceeds or will exceed $120,000 and in which any of our directors, executive officers or holders of more than 5% of our capital stock, or any immediate family member of, or person sharing the household with, any of these individuals, had or will have a direct or indirect material interest.
Series F-1 Preferred Stock Financing
In November 2012, we sold an aggregate of 1,478,064 shares of our Series F-1 preferred stock at a purchase price of $13.5312 per share for an aggregate purchase price of approximately $20.0 million. Each share of our Series F-1 preferred stock will convert automatically into one share of our common stock upon the completion of this offering.
The purchasers of our Series F-1 Preferred Stock are entitled to specified registration rights. For additional information, see “Description of Capital Stock—Registration Rights.” The following table summarizes the Series F-1 preferred stock purchased by members of our board of directors and persons who hold more than 5% of our outstanding capital stock.
| Name of Stockholder |
Shares of Series F-1 Preferred Stock |
Total Purchase Price | ||||||
| Entity affiliated with Temasek Capital (1) |
739,032 | $ | 9,999,990 | |||||
| Benchmark Capital Partners VI, L.P.(2) |
221,709 | 2,999,989 | ||||||
| Entities affiliated with DAG Ventures(3) |
181,743 | 2,459,201 | ||||||
| Entities affiliated with Focus Ventures(4) |
72,723 | 984,029 | ||||||
| Entities affiliated with Crosslink Ventures(5) |
65,762 | 889,839 | ||||||
| (1) | The shares were purchased by Sennett Investments (Mauritius) Pte Ltd, a direct wholly-owned subsidiary of Temasek Capital (Private) Limited. |
| (2) | Bruce Dunlevie, a member of our board of directors, is a General Partner of Benchmark Capital Partners, which has voting and dispositive power with regard to shares held by Benchmark Capital Partners VI, L.P. The terms of the purchase by Benchmark Capital Partners VI, L.P. purchases were the same as those made available to unaffiliated purchasers. |
| (3) | Consists of shares purchased by DAG Ventures IV-QP, L.P. and DAG Ventures IV, L.P. |
| (4) | Consists of shares purchased by Focus Ventures III, L.P. and FV Investors III, L.P. |
| (5) | Consists of shares purchased by Crosslink Ventures VI, L.P., Crosslink Ventures VI-B, L.P., Offshore Crosslink Ventures VI Unit Trust, Crosslink Bayview VI, L.L.C., Crosslink Crossover Fund V, L.P. and Crosslink Crossover Fund VI, L.P. |
Series F Preferred Stock Financing
In January 2012, we sold an aggregate of 2,804,788 shares of our Series F preferred stock at a purchase price of $12.2962 per share for an aggregate purchase price of approximately $34.5 million. Each share of our Series F preferred stock will convert automatically into one share of our common stock upon the completion of this offering.
The purchasers of our Series F Preferred Stock are entitled to specified registration rights. For additional information, see “Description of Capital Stock—Registration Rights.” The following table summarizes the Series F preferred stock purchased by members of our board of directors and persons who hold more than 5% of our outstanding capital stock.
110
Table of Contents
| Name of Stockholder |
Shares of Series F Preferred Stock |
Total Purchase Price | ||||||
| Entity affiliated with Temasek Capital(1) |
1,789,173 | $ | 21,999,997 | |||||
| Entities affiliated with DAG Ventures(2) |
203,315 | 2,499,998 | ||||||
| Benchmark Capital Partners VI, L.P.(3) |
121,989 | 1,499,999 | ||||||
| Entities affiliated with Crosslink Ventures(4) |
113,305 | 1,393,221 | ||||||
| (1) | The shares were purchased by Sennett Investments (Mauritius) Pte Ltd, a direct wholly-owned subsidiary of Temasek Capital (Private) Limited |
| (2) | Consists of shares purchased by DAG Ventures IV-QP, L.P. and DAG Ventures IV, L.P. |
| (3) | Benchmark Capital Partners VI, L.P. is a holder of more than 5% of our voting securities. Bruce Dunlevie, a member of our board of directors, is a General Partner of Benchmark Capital Partners, which has voting and dispositive power with regard to shares held by Benchmark Capital Partners VI, L.P. The terms of the purchase by Benchmark Capital Partners VI, L.P. purchases were the same as those made available to unaffiliated purchasers. |
| (4) | Consists of shares purchased by Crosslink Ventures VI, L.P., Crosslink Ventures VI-B, L.P., Offshore Crosslink Ventures VI Unit Trust, Crosslink Bayview VI, L.L.C., Crosslink Crossover Fund V, L.P. and Crosslink Crossover Fund VI, L.P. |
Series F Preferred Stock Redemption Agreement
Concurrent with the Series F preferred stock financing, we redeemed shares of common stock held by several executives at a price per share equal to the issuance price per share of the Series F preferred stock, a price greater than the estimated fair value of the underlying common stock on the date of the redemption. The following table summarizes the shares of common stock redeemed under the agreement:
| Name of Stockholder |
Shares of Common Stock Redeemed |
Total Redemption Price | ||||||
| Christopher Lien |
243,978 | $ | 2,999,998 | |||||
| Peter Wooster |
51,300 | 630,794 | ||||||
| Wister Walcott |
24,398 | 300,002 | ||||||
| Joseph Chang |
20,332 | 250,006 | ||||||
Series E Preferred Stock Financing
In March 2011, we sold an aggregate of 1,743,940 shares of our Series E preferred stock at a purchase price of $9.1949 per share for an aggregate purchase price of approximately $16.0 million. Each share of our Series E preferred stock will convert automatically into one share of our common stock upon the completion of this offering.
The purchasers of our Series E Preferred Stock are entitled to specified registration rights. For additional information, see “Description of Capital Stock—Registration Rights.” The following table summarizes the Series E preferred stock purchased by members of our board of directors and persons who hold more than 5% of our outstanding capital stock.
| Name of Stockholder |
Shares of Series E Preferred Stock |
Total Purchase Price | ||||||
| Entities affiliated with Crosslink Ventures(1) |
1,196,315 | $ | 10,999,997 | |||||
| Benchmark Capital Partners VI, L.P.(2) |
182,946 | 1,682,170 | ||||||
| Entities affiliated with DAG Ventures(3) |
177,004 | 1,627,534 | ||||||
| Entities affiliated with Focus Ventures(4) |
75,042 | 690,003 | ||||||
| (1) | Consists of shares purchased by Crosslink Ventures VI, L.P., Crosslink Ventures VI-B, L.P., Offshore Crosslink Ventures VI Unit Trust, Crosslink Bayview VI, L.L.C. and Crosslink Crossover Fund V, L.P. |
111
Table of Contents
| (2) | Bruce Dunlevie, a member of our board of directors, is a General Partner of Benchmark Capital Partners, which has voting and dispositive power with regard to shares held by Benchmark Capital Partners VI, L.P. The terms of the purchase by Benchmark Capital Partners VI, L.P. purchases were the same as those made available to unaffiliated purchasers. |
| (3) | Consists of shares purchased by DAG Ventures IV-QP, L.P. and DAG Ventures IV, L.P. |
| (4) | Consists of shares purchased by Focus Ventures III, L.P. and FV Investors III, L.P. |
Series D Preferred Stock Financing
In May 2010, we sold an aggregate of 2,022,239 shares of our Series D preferred stock at a purchase price of $5.5351 per share for an aggregate purchase price of approximately $11.2 million. Each share of our Series D preferred stock will convert automatically into one share of our common stock upon the completion of this offering.
The purchasers of our Series D Preferred Stock are entitled to specified registration rights. For additional information, see “Description of Capital Stock—Registration Rights.” The following table summarizes the Series D preferred stock purchased by members of our board of directors and persons who hold more than 5% of our outstanding capital stock.
| Name of Stockholder |
Shares of Series D Preferred Stock |
Total Purchase Price | ||||||
| Entities affiliated with DAG Ventures(1) |
722,660 | $ | 3,999,995 | |||||
| Benchmark Capital Partners VI, L.P.(2) |
361,331 | 2,000,003 | ||||||
| Entities affiliated with Focus Ventures(3) |
294,762 | 1,631,537 | ||||||
| (1) | Consists of shares purchased by DAG Ventures IV-QP, L.P. and DAG Ventures IV, L.P. |
| (2) | Bruce Dunlevie, a member of our board of directors, is a General Partner of Benchmark Capital Partners, which has voting and dispositive power with regard to shares held by Benchmark Capital Partners VI, L.P. The terms of the purchase by Benchmark Capital Partners VI, L.P. purchases were the same as those made available to unaffiliated purchasers. |
| (3) | Consists of shares purchased by Focus Ventures III, L.P. and FV Investors III, L.P. |
Common Stock Purchase Agreement
We entered into a common stock purchase agreement with Gordon Crovitz, a member of our board of directors, in May 2012. Under the terms of the agreement, Mr. Crovitz purchased 35,461 shares of our common stock. The purchase price under the agreement was $250,000, equal to the cumulative estimated fair value of the common stock at the date of purchase. Under the terms of the agreement, the shares vest ratably over a twenty-four month period from the commencement date of Mr. Crovitz’s service on our board of directors, and we have the right to repurchase any unvested shares should Mr. Crovitz stop serving as a member of our board of directors before the completion of the vesting period.
Amended and Restated Investors’ Rights Agreement
We have entered into an investors’ rights agreement with certain holders of our preferred stock, including entities with which certain of our directors are affiliated. These stockholders are entitled to rights with respect to the registration of their shares following our initial public offering under the Securities Act. For a description of these registration rights, see “Description of Capital Stock—Registration Rights.”
112
Table of Contents
Indemnification Agreements
We have entered into indemnification agreements with each of our directors and executive officers. The indemnification agreements and our restated bylaws will require us to indemnify our directors to the fullest extent not prohibited by Delaware law. Subject to certain limitations, our restated bylaws also require us to advance expenses incurred by our directors and officers. For more information regarding these agreements, see “Executive Compensation—Limitations on Liability and Indemnification Matters.”
Review, Approval or Ratification of Transactions with Related Parties
Our policy and the charters of our audit committee and our nominating and governance committee to be effective upon the closing of this offering, require that any transaction with a related party that must be reported under applicable rules of the SEC (other than compensation-related matters) must be reviewed and approved or ratified by the audit committee, unless the related party is, or is associated with, a member of that committee, in which event the transaction must be reviewed and approved by the nominating and governance committee. These committees have not adopted policies or procedures for review of, or standards for approval of, related party transactions but intend to do so in the future.
113
Table of Contents
PRINCIPAL AND SELLING STOCKHOLDERS
The following table sets forth certain information with respect to the beneficial ownership of our common stock as of September 30, 2012, and as adjusted to reflect the sale of common stock offered by us in our initial public offering, for:
| Ÿ | each stockholder known by us to be the beneficial owner of more than 5% of our outstanding shares of common stock; |
| Ÿ | each of our directors; |
| Ÿ | each of our named executive officers; |
| Ÿ | all of our directors and executive officers as a group; and |
| Ÿ | each selling stockholder. |
We have determined beneficial ownership in accordance with the rules of the SEC. Except as indicated by the footnotes below, we believe, based on the information furnished to us, that the persons and entities named in the table below have sole voting and investment power with respect to all shares of common stock that they beneficially own, subject to applicable community property laws.
Applicable percentage ownership is based on 23,576,442 shares of common stock issued as of September 30, 2012, including 1,478,064 shares of common stock issuable upon conversion of our outstanding Series F-1 preferred stock issued in November 2012, and assumes the conversion of all outstanding shares of preferred stock, including the Series F-1 preferred stock, into an aggregate of 18,752,943 shares of our common stock. For purposes of the table below, we have assumed that shares of common stock will be issued by us in our initial public offering. In computing the number of shares of common stock beneficially owned by a person and the percentage ownership of that person, we deemed to be outstanding all shares of common stock subject to options held by that person or entity that are currently exercisable or that will become exercisable within 60 days of September 30, 2012. We did not deem these shares outstanding, however, for the purpose of computing the percentage ownership of any other person. Unless otherwise indicated, the address of each beneficial owner listed in the table below is c/o Marin Software Incorporated, 123 Mission Street, 25th Floor, San Francisco, California 94105.
| Shares Beneficially Owned Prior to Offering |
Shares Offered |
Shares Beneficially Owned After Offering |
||||||||||||||
| Name of Beneficial Owner |
Number | Percentage | Number | Percentage | ||||||||||||
| 5% Stockholders |
||||||||||||||||
| Benchmark Capital Partners VI, L.P.(1) |
3,874,492 | 16.4 | % | |||||||||||||
| Entities affiliated with DAG Ventures(2) |
3,801,169 | 16.1 | ||||||||||||||
| Entity affiliated with Temasek Capital(3) |
2,528,205 | 10.7 | ||||||||||||||
| Entities affiliated with Focus Ventures(4) |
1,521,004 | 6.5 | ||||||||||||||
| Entities affiliated with Crosslink Ventures(5) |
1,375,382 | 5.8 | ||||||||||||||
| Named Executive Officers and Directors |
||||||||||||||||
| Christopher Lien(6) |
2,063,818 | 8.8 | ||||||||||||||
| Joseph Chang(7) |
651,346 | 2.8 | ||||||||||||||
| Wister Walcott(8) |
713,947 | 3.0 | * | |||||||||||||
| Paul Auvil(9) |
85,703 | * | * | |||||||||||||
| Gordon Crovitz(10) |
88,468 | * | * | |||||||||||||
| Bruce Dunlevie(1) |
3,874,492 | 16.4 | * | |||||||||||||
| Donald Hutchison(11) |
328,287 | 1.4 | ||||||||||||||
| All executive officers and directors as a group |
8,535,478 | 36.3 | ||||||||||||||
(footnotes on next page)
114
Table of Contents
| * | Represents beneficial ownership of less than 1% of our outstanding common stock. |
| (1) | Includes 221,709 shares of our Series F-1 preferred stock issued in November 2012. Benchmark Capital Management Co. VI, L.L.C. (“BCMC VI”) is the general partner of Benchmark Capital Partners VI, L.P. (“BCP VI”). BCMC VI’s managing members of the general partner are Alexandre Balkanski, Bruce W. Dunlevie, J. William Gurley, Kevin R. Harvey, Robert C. Kagle, Steven M. Spurlock, Peter H. Fenton and Mitchell H. Lasky. These individuals may be deemed to have shared voting and investment power over the shares held by BCP VI. The address for BCP VI and BCMC VI is 2480 Sand Hill Road, Suite 200, Menlo Park, CA 94025. |
| (2) | Consists of (a) 3,112,719 shares held by DAG Ventures IV-QP, L.P. (“DAVG IV-QP”), (b) 328,958 shares held by DAG Ventures IV, L.P. (“DAG IV”) and (c) 359,492 shares held by DAG Ventures IV-A, LLC (“DAG IV-A”), which numbers include shares of our Series F-1 preferred stock issued in November 2012. DAG Ventures Management IV, LLC (“DAG IV LLC”) serves as the general partner of DAG IV-QP and DAG IV. As such, DAG IV LLC possesses power to direct the voting and disposition of the shares owned by DAG IV-QP and DAG IV and may be deemed to have indirect beneficial ownership of the shares held by DAG IV-QP and DAG IV. DAG IV LLC does not own any of our securities directly. R. Thomas Goodrich, John J. Cadeddu, Greg Williams, Young J. Chung and Nick Pianim are managing directors of DAG IV LLC and DAG IV-A and possess power to direct the voting and disposition of the shares owned by DAG IV-QP, DAG IV and DAG IV-A and may be deemed to have indirect beneficial ownership of the shares held by DAG IV-QP, DAG IV and DAG IV-A. The address for DAG IV-QP, DAG IV, DAG IV-A and DAG IV LLC is 251 Lytton Avenue, Suite 200, Palo Alto, CA 94301. |
| (3) | Includes 739,032 shares of our Series F-1 preferred stock issued in November 2012. Sennett Investments (Mauritius) Pte Ltd (“Sennett”) is indirectly wholly-owned by Temasek Capital (Private) Limited (“Temasek Capital”), which is directly wholly-owned by Temasek Holdings (Private) Limited (“Temasek”). Sennett, Temasek Capital and Temasek are private limited companies organized under the laws of Singapore. Voting and investment decisions related to these securities are made by the board of directors of Sennett, which is currently comprised of Poy Weng Chuen, Chua Eu Jin, Ashraf Ramtoola and Rooksana Shahabally. Temasek, through its ultimate ownership of Sennett, may be deemed to have voting and dispositive power over these shares. The address for Sennett, Temasek Capital and Temasek is 60B Orchard Road, #06-18, Tower 2, The Atrium@Orchard, Singapore 238891. |
| (4) | Consists of (a) 1,494,356 shares held by Focus Ventures III, L.P. (“FV III”) and (b) 26,648 shares held by FV Investors III, L.P. (“FVI III”), which numbers include shares of our Series F-1 preferred stock issued in November 2012. Focus Ventures Partners III, L.P. (“FVP III”) serves as the general partner of FV III and has sole voting and investment control over the shares owned by FV III, and may be deemed to own beneficially the shares held by FV III. Focus Management, Inc. (“FMI”) serves as the general partner of FVI III and has sole voting and investment control over the shares owned by FV III and may be deemed to own beneficially the shares held by FVI III. Steven P. Bird, Kevin J. McQuillan and James Boettcher are general partners of FVP III and directors of FMI and share voting and dispositive power over the shares held by FV III and FVI III, and may be deemed to own beneficially the shares held by FV III and FVI III. The address for Focus Ventures is 525 University Ave., Suite 1400, Palo Alto, CA 94301. |
| (5) | Consists of (a) 596,698 shares held by Crosslink Ventures VI, L.P. (“CV VI”), (b) 165,317 shares held by Crosslink Ventures VI-B, L.P. (“CV VI-B”), (c) 45,737 shares held by Offshore Crosslink Ventures VI Unit Trust (“Offshore CV VI Unit Trust”), (d) 17,477 shares held by Crosslink Bayview VI, L.L.C. (“Crosslink Bayview VI”), (e) 508,871 shares held by Crosslink Crossover Fund V, L.P. (“Crosslink CF V”) and (f) 41,282 shares held by Crosslink Crossover Fund VI, L.P. (“Crosslink CF VI”), which numbers include shares of our Series F-1 preferred stock issued in November 2012. Crosslink Capital, Inc. (“Crosslink Capital”) serves as the investment advisor of CV VI, |
(footnotes continued on next page)
115
Table of Contents
| CV VI-B, Offshore CV VI Unit Trust, Crosslink Bayview VI, Crosslink CF V and Crosslink CF VI and has shared voting and investment control over the shares owned by such entities and may be deemed to beneficially own the shares owned by CV VI, CV VI-B, Offshore CV VI Unit Trust and Crosslink Bayview VI. Crosslink Ventures VI Holdings, L.L.C. (“CV VI Holdings”) serves as the general partner of CV VI, CV VI-B, Offshore CV VI Unit Trust and Crosslink Bayview VI and has shared voting and investment control with Crosslink Capital over the shares owned by CV VI, CV VI-B, Offshore CV VI Unit Trust and Crosslink Bayview VI, and may be deemed to own beneficially the shares owned by CV VI, CV VI-B, Offshore CV VI Unit Trust and Crosslink Bayview VI. Crossover Fund V Management, L.L.C. (“CF V Management”) serves as the general partner of Crosslink CF V and Crosslink CF VI and has shared voting and investment control with Crosslink Capital over the shares owned by Crosslink CF V and Crosslink CF VI and may be deemed to own beneficially the shares owned by Crosslink CF V and Crosslink CF VI. Michael J. Stark is the managing member of CV VI Holdings and CF V Management and shares voting and dispositive power over the shares held by CV VI, CV VI-B, Offshore CV VI Unit Trust, Crosslink Bayview VI, Crosslink CF V and Crosslink CF VI, and may be deemed to own beneficially the shares held by CV VI, CV VI-B, Offshore CV VI Unit Trust, Crosslink Bayview VI, Crosslink CF V and Crosslink CF VI. The address for Crosslink Capital and its affiliated entities is Two Embarcadero Center, Suite 2200, San Francisco, CA 94111. |
| (6) | Consists of (a) 1,806,397 shares held directly by the Lien Revocable Trust dated 7/8/2003, of which Mr. Lien is a co-trustee, and (b) 257,421 shares issuable to Mr. Lien upon exercise of stock options exercisable within 60 days after September 30, 2012. |
| (7) | Consists of (a) 313,001 shares held by Joseph Chang and Rachel Chang, husband and wife, as community property, and (b) 338,345 shares issuable to Mr. Chang upon exercise of stock options exercisable within 60 days after September 30, 2012. |
| (8) | Includes (a) 581,092 shares held directly by the Walcott Family Trust, (b) 41,841 shares held by the Walcott Family Trust dated September 12, 2007 and (c) 26,659 shares issuable to Mr. Walcott upon exercise of stock options exercisable within 60 days after September 30, 2012. |
| (9) | Includes (a) 43,953 shares held by Paul Auvil and Sarah Auvil, husband and wife, as community property, of which 11,928 shares would be subject to forfeiture upon Mr. Auvil’s resignation from the Board prior to vesting, and (b) 20,000 shares issuable to Mr. Auvil upon exercise of stock options exercisable within 60 days after September 30, 2012. |
| (10) | Consists of (a) 53,007 shares of our common stock held by Gordon Crovitz, of which 48,591 shares would be subject to forfeiture upon Mr. Crovitz’s resignation from the Board prior to vesting, and (b) 35,461 shares of our common stock held by Mr. Crovitz, of which 29,553 shares would be subject to forfeiture within 60 days of September 30, 2012 upon Mr. Crovitz’s resignation from the Board prior to vesting. |
| (11) | Consists of (a) 100,181 shares of our common stock held directly by the Hutchison Family Trust, of which Mr. Hutchison is a co-trustee, (b) 158,906 shares of our preferred stock held directly by the Hutchison Family Trust, which will convert into common stock upon the closing of this offering, (c) 49,200 shares of our preferred stock held by Glasgow Investments, LLC and (d) 20,000 shares issuable to Mr. Hutchison upon exercise of stock options exercisable within 60 days after September 30, 2012. Mr. Hutchison is a managing member of Glasgow Investments, LLC and possesses the power to direct the voting and disposition of the shares held by Glasgow Investments, LLC and as such may be deemed to beneficially own the shares held by Glasgow Investments, LLC. |
| (12) | Includes (a) 1,107,082 shares issuable upon exercise of stock options exercisable within 60 days of September 30, 2012 and (b) 181,433 shares subject to forfeiture upon cessation of service prior to vesting. |
116
Table of Contents
Upon the closing of this offering and the filing of our restated certificate of incorporation, our authorized capital stock will consist of shares of common stock, $0.001 par value per share, and shares of undesignated preferred stock, $0.001 par value per share. The following description summarizes the most important terms of our capital stock. Because it is only a summary, it does not contain all the information that may be important to you. For a complete description, you should refer to our restated certificate of incorporation and restated bylaws, which are included as exhibits to the registration statement of which this prospectus forms a part, and to the applicable provisions of Delaware law.
Pursuant to the provisions of our certificate of incorporation all of the outstanding preferred stock will automatically convert stock into common stock, effective immediately prior to the completion of this offering. Assuming the conversion of all outstanding shares of our preferred stock into shares of our common stock, which will occur immediately prior to the completion of this offering, as of September 30, 2012, there were 23,266,995 shares of our common stock outstanding, held by 176 stockholders of record, and no shares of our preferred stock outstanding. Our board of directors is authorized, without stockholder approval, to issue additional shares of our capital stock.
Common Stock
Dividend Rights
Subject to preferences that may apply to any shares of preferred stock outstanding at the time, the holders of our common stock are entitled to receive dividends out of funds legally available if our board of directors, in its discretion, determines to issue dividends and then only at the times and in the amounts that our board of directors may determine. See “Dividend Policy” above.
Voting Rights
Holders of our common stock are entitled to one vote for each share held on all matters submitted to a vote of stockholders. We have not provided for cumulative voting for the election of directors in our restated certificate of incorporation. Accordingly, holders of a majority of the shares of our common stock will be able to elect all of our directors. Our restated certificate of incorporation establishes a classified board of directors, to be divided into three classes with staggered three-year terms. Only one class of directors will be elected at each annual meeting of our stockholders, with the other classes continuing for the remainder of their respective three-year terms.
No Preemptive or Similar Rights
Our common stock is not entitled to preemptive rights, and is not subject to conversion, redemption or sinking fund provisions.
Right to Receive Liquidation Distributions
Upon our liquidation, dissolution or winding-up, the assets legally available for distribution to our stockholders would be distributable ratably among the holders of our common stock and any participating preferred stock outstanding at that time, subject to prior satisfaction of all outstanding debt and liabilities and the preferential rights of and the payment of liquidation preferences, if any, on any outstanding shares of preferred stock.
117
Table of Contents
Preferred Stock
Pursuant to the provisions of our certificate of incorporation, all of our outstanding preferred stock will automatically convert all common stock, with such conversion to be effective immediately prior to the completion of this offering. As a result, each currently outstanding share of preferred stock will be converted into common stock. All series of preferred stock will convert at a ratio of one share of common stock for each share of preferred stock.
Following this offering, our board of directors will be authorized, subject to limitations prescribed by Delaware law, to issue preferred stock in one or more series, to establish from time to time the number of shares to be included in each series, and to fix the designation, powers, preferences and rights of the shares of each series and any of its qualifications, limitations or restrictions, in each case without further vote or action by our stockholders. Our board of directors can also increase or decrease the number of shares of any series of preferred stock, but not below the number of shares of that series then outstanding, without any further vote or action by our stockholders. Our board of directors may authorize the issuance of preferred stock with voting or conversion rights that could adversely affect the voting power or other rights of the holders of our common stock. The issuance of preferred stock, while providing flexibility in connection with possible acquisitions and other corporate purposes, could, among other things, have the effect of delaying, deferring or preventing a change in control of our company and might adversely affect the market price of our common stock and the voting and other rights of the holders of our common stock. We have no current plan to issue any shares of preferred stock.
Options
As of September 30, 2012, we had outstanding options to purchase an aggregate 4,273,447 shares of our common stock, with a weighted-average exercise price of $3.72.
Warrants
As of September 30, 2012, we had outstanding one warrant to purchase 36,900 shares of our common stock with an exercise price of $2.70 per share and one warrant to purchase 50,792 shares of our Series B convertible preferred stock, which upon the closing of this offering will become exercisable for the same number of shares of our common stock, with an exercise price of $2.7563 per share. The exercise price of these warrants may be paid either in cash or by surrendering the right to receive shares of common stock having a value equal to the exercise price.
Registration Rights
Pursuant to the terms of our fourth amended and restated investors’ rights agreement, immediately following this offering, the holders of approximately shares of our common stock will be entitled to rights with respect to the registration of these shares under the Securities Act, as described below.
Demand Registration Rights
The holders of at least 50% of the then-outstanding shares having registration rights may make a written request to us for the registration of the offer and sale of all or part of the shares having registration rights or registrable securities at any time after six months after the effective date of our first registration statement, if the amount of registrable securities to be registered has an aggregate
118
Table of Contents
market value of at least $15.0 million. We are only required to file two registration statements that are declared effective upon exercise of these demand registration rights. We may postpone the filing of a registration statement for up to 120 days in a 12-month period if our board of directors determines that the filing would be seriously detrimental to us and our stockholders.
Piggyback Registration Rights
If we register any of our securities for public sale, holders of shares having registration rights will have the right to include their shares in the registration statement. However, this right does not apply to a registration relating to employee benefit plans or a registration relating to a corporate reorganization. The underwriters of any underwritten offering will have the right to limit the number of shares registered by these holders if they determine in good faith that marketing factors require limitation, in which case the number of shares to be registered will be apportioned pro rata among these holders, according to the total amount of securities entitled to be included by each holder, or in a manner mutually agreed upon by the holders. However, the number of shares to be registered by these holders cannot be reduced below 30% of the total shares covered by the registration statement.
Form S-3 Registration Rights
The holders of then-outstanding shares having registration rights can request that we register all or part of their shares on Form S-3 if we are eligible to file a registration statement on Form S-3 and if the aggregate price to the public of the shares offered is at least $10.0 million. The stockholders may only require us to effect at most three registration statements on Form S-3 and may only require us to effect two registration statements on Form S-3 in a 12-month period. We may postpone the filing of a registration statement on Form S-3 no more than once during any 12-month period for a total cumulative period of not more than 120 days if our board of directors determines that the filing would be detrimental to us and our stockholders.
Expenses of Registration Rights
We generally will pay all expenses, other than underwriting discounts and commissions and the reasonable fees and disbursements, not to exceed $35,000, of one counsel for the selling stockholders, incurred in connection with the registrations described above.
Expiration of Registration Rights
The registration rights described above will expire, with respect to any particular holder of these rights, on the earlier of the fourth anniversary of the closing of this offering or when that holder can sell all of its registrable securities in a 3-month period without restriction under Rule 144 of the Securities Act.
Anti-Takeover Provisions
The provisions of Delaware law, our restated certificate of incorporation and our restated bylaws, as we expect they will be in effect upon the completion of this offering, could have the effect of delaying, deferring or discouraging another person from acquiring control of our company. These provisions, which are summarized below, may have the effect of discouraging takeover bids. They are also designed, in part, to encourage persons seeking to acquire control of us to negotiate first with our board of directors. We believe that the benefits of increased protection of our potential ability to negotiate with an unfriendly or unsolicited acquirer outweigh the disadvantages of discouraging a proposal to acquire us because negotiation of these proposals could result in an improvement of their terms.
Delaware Law
We are subject to the provisions of Section 203 of the Delaware General Corporation Law regulating corporate takeovers. In general, Section 203 prohibits a publicly-held Delaware corporation
119
Table of Contents
from engaging in a business combination with an interested stockholder for a period of three years following the date on which the person became an interested stockholder unless:
| Ÿ | Prior to the date of the transaction, the board of directors of the corporation approved either the business combination or the transaction which resulted in the stockholder becoming an interested stockholder; |
| Ÿ | The interested stockholder owned at least 85% of the voting stock of the corporation outstanding at the time the transaction commenced, excluding for purposes of determining the voting stock outstanding, but not the outstanding voting stock owned by the interested stockholder, (i) shares owned by persons who are directors and also officers and (ii) shares owned by employee stock plans in which employee participants do not have the right to determine confidentially whether shares held subject to the plan will be tendered in a tender or exchange offer; or |
| Ÿ | At or subsequent to the date of the transaction, the business combination is approved by the board of directors of the corporation and authorized at an annual or special meeting of stockholders, and not by written consent, by the affirmative vote of at least 66.67% of the outstanding voting stock that is not owned by the interested stockholder. |
Generally, a business combination includes a merger, asset or stock sale, or other transaction or series of transactions together resulting in a financial benefit to the interested stockholder. An interested stockholder is a person who, together with affiliates and associates, owns or, within three years prior to the determination of interested stockholder status, did own 15% or more of a corporation’s outstanding voting stock. We expect the existence of this provision to have an anti-takeover effect with respect to transactions our board of directors does not approve in advance. We also anticipate that Section 203 may also discourage attempts that might result in a premium over the market price for the shares of common stock held by stockholders.
Restated Certificate of Incorporation and Restated Bylaw Provisions
Our restated certificate of incorporation and our restated bylaws, as we expect they will be in effect upon the completion of this offering, include a number of provisions that could deter hostile takeovers or delay or prevent changes in control of our company, including the following:
| Ÿ | Board of Directors Vacancies. Our restated certificate of incorporation and restated bylaws will authorize only our board of directors to fill vacant directorships, including newly created seats. In addition, the number of directors constituting our board of directors is permitted to be set only by a resolution adopted by a majority vote of our entire board of directors. These provisions would prevent a stockholder from increasing the size of our board of directors and then gaining control of our board of directors by filling the resulting vacancies with its own nominees. This makes it more difficult to change the composition of our board of directors but promotes continuity of management. |
| Ÿ | Classified Board. Our restated certificate of incorporation and restated bylaws will provide that our board is classified into three classes of directors, each with staggered three year terms. A third party may be discouraged from making a tender offer or otherwise attempting to obtain control of us as it is more difficult and time consuming for stockholders to replace a majority of the directors on a classified board of directors. See “Management—Board of Directors.” |
| Ÿ | Stockholder Action; Special Meetings of Stockholders. Our restated certificate of incorporation will provide that our stockholders may not take action by written consent, but may only take action at annual or special meetings of our stockholders. As a result, a holder controlling a majority of our capital stock would not be able to amend our bylaws or remove directors without holding a meeting of our stockholders called in accordance with our amended and restated bylaws. Our restated bylaws further will provide that special meetings of our |
120
Table of Contents
| stockholders may be called only by a majority of our board of directors, the chairman of our board of directors, our Chief Executive Officer or our President, thus prohibiting a stockholder from calling a special meeting. These provisions might delay the ability of our stockholders to force consideration of a proposal or for stockholders controlling a majority of our capital stock to take any action, including the removal of directors. |
| Ÿ | Advance Notice Requirements for Stockholder Proposals and Director Nominations. Our restated bylaws will provide advance notice procedures for stockholders seeking to bring business before our annual meeting of stockholders or to nominate candidates for election as directors at our annual meeting of stockholders. Our restated bylaws also will specify certain requirements regarding the form and content of a stockholder’s notice. These provisions might preclude our stockholders from bringing matters before our annual meeting of stockholders or from making nominations for directors at our annual meeting of stockholders if the proper procedures are not followed. We expect that these provisions might also discourage or deter a potential acquirer from conducting a solicitation of proxies to elect the acquirer’s own slate of directors or otherwise attempting to obtain control of our company. |
| Ÿ | No Cumulative Voting. The Delaware General Corporation Law provides that stockholders are not entitled to the right to cumulate votes in the election of directors unless a corporation’s certificate of incorporation provides otherwise. Our amended and restated certificate of incorporation and amended and restated bylaws will not provide for cumulative voting. |
| Ÿ | Directors Removed Only for Cause. Our restated certificate of incorporation will provide that stockholders may remove directors only for cause. |
| Ÿ | Amendment of Charter Provisions. Any amendment of the above expected provisions in our restated certificate of incorporation would require approval by holders of at least two-thirds of our outstanding common stock. |
| Ÿ | Issuance of Undesignated Preferred Stock. Our board of directors has the authority, without further action by the stockholders, to issue up to shares of undesignated preferred stock with rights and preferences, including voting rights, designated from time to time by our board of directors. The existence of authorized but unissued shares of preferred stock would enable our board of directors to render more difficult or to discourage an attempt to obtain control of us by means of a merger, tender offer, proxy contest or other means. |
| Ÿ | Choice of Forum. Our restated certificate of incorporation will provide that the Court of Chancery of the State of Delaware will be the exclusive forum for any derivative action or proceeding brought on our behalf, any action asserting a breach of fiduciary duty, any action asserting a claim against us arising pursuant to the Delaware General Corporation Law, our amended and restated certificate of incorporation or our bylaws, or any action asserting a claim against us that is governed by the internal affairs doctrine. The enforceability of similar choice of forum provisions in other companies’ certificates of incorporation has been challenged in legal proceedings, and it is possible that, in connection with any action, a court could find the choice of forum provisions contained in our restated certificate of incorporation to be inapplicable or unenforceable in such action. |
Listing
We have applied to list our common stock on the New York Stock Exchange under the symbol “MRIN.”
Transfer Agent and Registrar
The transfer agent and registrar for our common stock will be . The transfer agent’s address is . Our shares of common stock will be issued in uncertificated form only, subject to limited circumstances.
121
Table of Contents
SHARES ELIGIBLE FOR FUTURE SALE
Prior to this offering, there has been no public market for our common stock, and we cannot predict the effect, if any, that market sales of shares of our common stock or the availability of shares of our common stock for sale will have on the market price of our common stock prevailing from time to time. Nevertheless, sales of substantial amounts of our common stock, including shares issued upon exercise of outstanding options, in the public market following this offering could adversely affect market prices prevailing from time to time and could impair our ability to raise capital through the sale of our equity securities.
Upon the closing of this offering, we will have a total of shares of our common stock outstanding, based on the 21,788,931 shares of our capital stock outstanding as of September 30, 2012. Of these outstanding shares, all of the shares of common stock sold in this offering will be freely tradable, except that any shares purchased in this offering by our affiliates, as that term is defined in Rule 144 under the Securities Act, would only be able to be sold in compliance with the Rule 144 limitations described below.
The remaining outstanding shares of our common stock will be deemed “restricted securities” as defined in Rule 144. Restricted securities may be sold in the public market only if they are registered under the Securities Act or if they qualify for an exemption from registration under Rule 144 or Rule 701 promulgated under the Securities Act, which rules are summarized below. In addition, all of our security holders have entered into market standoff agreements with us or lock-up agreements with the underwriters under which they have agreed, subject to specific exceptions, not to sell any of our stock for at least 180 days following the date of this prospectus, as described below. As a result of these agreements and the provisions of our investors’ rights agreement described above under “Description of Capital Stock—Registration Rights,” subject to the provisions of Rule 144 or Rule 701, based on an assumed offering date of , shares will be available for sale in the public market as follows:
| Ÿ | Beginning on the date of this prospectus, all of the shares sold in this offering will be immediately available for sale in the public market; |
| Ÿ | Beginning 181 days after the date of this prospectus, additional shares will become eligible for sale in the public market, of which shares will be held by affiliates and subject to the volume and other restrictions of Rule 144, as described below; and |
| Ÿ | The remainder of the shares will be eligible for sale in the public market from time to time thereafter, subject in some cases to the volume and other restrictions of Rule 144, as described below. |
Lock-Up/Market Standoff Agreements
All of our directors and officers and substantially all of our security holders are subject to lock-up agreements or market standoff provisions that, subject to exceptions described in the section entitled “Underwriting” below, prohibit them from offering for sale, selling, contracting to sell, granting any option for the sale of, transferring or otherwise disposing of any shares of our common stock, options to acquire shares of our common stock or any security or instrument related to this common stock, option or warrant, or entering into any swap, hedge or other arrangement that transfers to another any of the economic consequences of ownership of the common stock, for a period of at least 180 days following the date of this prospectus without the prior written consent of Goldman, Sachs & Co. and Deutsche Bank Securities Inc. See “Underwriting.”
Rule 144
In general, under Rule 144 as currently in effect, once we have been subject to public company reporting requirements for at least 90 days, a person who is not deemed to have been one of our affiliates
122
Table of Contents
for purposes of the Securities Act at any time during the 90 days preceding a sale and who has beneficially owned the shares proposed to be sold for at least six months, including the holding period of any prior owner other than our affiliates, is entitled to sell those shares without complying with the manner of sale, volume limitation or notice provisions of Rule 144, subject to compliance with the public information requirements of Rule 144. If such a person has beneficially owned the shares proposed to be sold for at least one year, including the holding period of any prior owner other than our affiliates, then that person would be entitled to sell those shares without complying with any of the requirements of Rule 144.
In general, under Rule 144, as currently in effect, our affiliates or persons selling shares on behalf of our affiliates are entitled to sell upon expiration of the lock-up and market standoff agreements described above, within any three-month period, a number of shares that does not exceed the greater of:
| Ÿ | 1% of the number of shares of our common stock then outstanding, which will equal approximately shares immediately after this offering; or |
| Ÿ | the average weekly trading volume of our common stock during the four calendar weeks preceding the filing of a notice on Form 144 with respect to that sale. |
Sales under Rule 144 by our affiliates or persons selling shares on behalf of our affiliates are also subject to certain manner of sale provisions and notice requirements and to the availability of current public information about us.
Rule 701
Rule 701 generally allows a stockholder who purchased shares of our common stock pursuant to a written compensatory plan or contract and who is not deemed to have been an affiliate of our company during the immediately preceding 90 days to sell these shares in reliance upon Rule 144, but without being required to comply with the public information, holding period, volume limitation or notice provisions of Rule 144. Rule 701 also permits affiliates of our company to sell their Rule 701 shares under Rule 144 without complying with the holding period requirements of Rule 144. All holders of Rule 701 shares, however, are required by that rule to wait until 90 days after the date of this prospectus before selling those shares pursuant to Rule 701.
Stock Options
As soon as practicable after the closing of this offering, we intend to file one or more registration statements on Form S-8 under the Securities Act covering all of the shares of our common stock subject to outstanding options and the shares of our common stock reserved for issuance under our stock plans. In addition, we intend to file a registration statement on Form S-8 or such other form as may be required under the Securities Act for the resale of shares of our common stock issued upon the exercise of options that were not granted under Rule 701. We expect to file this registration statement as soon as permitted under the Securities Act. However, the shares registered on Form S-8 may be subject to the volume limitations and the manner of sale, notice and public information requirements of Rule 144 and will not be eligible for resale until expiration of the lock-up and market standoff agreements to which they are subject.
Registration Rights
We have granted demand, piggyback and Form S-3 registration rights to certain of our stockholders to sell our common stock. Registration of the sale of these shares under the Securities Act would result in these shares becoming freely tradable without restriction under the Securities Act immediately upon the effectiveness of the registration, except for shares purchased by affiliates. For a further description of these rights, see “Description of Capital Stock—Registration Rights.”
123
Table of Contents
MATERIAL U.S. FEDERAL INCOME TAX CONSIDERATIONS
FOR NON-U.S. HOLDERS OF COMMON STOCK
This section summarizes the material U.S. federal income tax considerations relating to the acquisition, ownership and disposition of our common stock by “non-U.S. holders” (as defined below) pursuant to this offering. This summary does not provide a complete analysis of all potential U.S. federal income tax considerations relating thereto. The information provided below is based upon provisions of the Internal Revenue Code of 1986, as amended (the Code), Treasury regulations promulgated thereunder, administrative rulings, and judicial decisions currently in effect. These authorities may change at any time, possibly retroactively, or the Internal Revenue Service (IRS), might interpret the existing authorities differently. In either case, the tax considerations of owning or disposing of our common stock could differ from those described below. As a result, we cannot assure you that the tax consequences described in this discussion will not be challenged by the IRS or will be sustained by a court if challenged by the IRS.
This summary does not address the tax considerations arising under the laws of any non-U.S., state or local jurisdiction, or under U.S. federal gift and estate tax laws, except to the limited extent provided below. In addition, this discussion does not address tax considerations applicable to an investor’s particular circumstances or to investors that may be subject to special tax rules, including, without limitation:
| Ÿ | banks, insurance companies or other financial institutions; |
| Ÿ | partnerships or entities or arrangements treated as partnerships or other pass-through entities for U.S. federal tax purposes (or investors in such entities); |
| Ÿ | corporations that accumulates earnings to avoid United States federal income tax; |
| Ÿ | persons subject to the alternative minimum tax; |
| Ÿ | tax-exempt organizations or tax-qualified retirement plans; |
| Ÿ | real estate investment trusts or regulated investment companies; |
| Ÿ | controlled foreign corporations or passive foreign investment companies; |
| Ÿ | persons who acquired our common stock as compensation for services; |
| Ÿ | dealers in securities or currencies; |
| Ÿ | traders in securities that elect to use a mark-to-market method of accounting for their securities holdings; |
| Ÿ | persons that own, or are deemed to own, more than 5% of our capital stock (except to the extent specifically set forth below); |
| Ÿ | certain former citizens or long-term residents of the United States; |
| Ÿ | persons who hold our common stock as a position in a hedging transaction, “straddle,” “conversion transaction” or other risk reduction transaction; |
| Ÿ | persons who do not hold our common stock as a capital asset within the meaning of Section 1221 of the Code (generally, for investment purposes); or |
| Ÿ | persons deemed to sell our common stock under the constructive sale provisions of the Code. |
In addition, if a partnership or entity classified as a partnership for U.S. federal income tax purposes is a beneficial owner of our common stock, the tax treatment of a partner in the partnership
124
Table of Contents
or an owner of the entity will depend upon the status of the partner or other owner and the activities of the partnership or other entity. Accordingly, this summary does not address tax considerations applicable to partnerships that hold our common stock, and partners in such partnerships should consult their tax advisors.
INVESTORS CONSIDERING THE PURCHASE OF OUR COMMON STOCK SHOULD CONSULT THEIR OWN TAX ADVISORS REGARDING THE APPLICATION OF THE U.S. FEDERAL INCOME AND ESTATE TAX LAWS TO THEIR PARTICULAR SITUATIONS AND THE CONSEQUENCES OF FOREIGN, STATE OR LOCAL LAWS, AND TAX TREATIES.
Non-U.S. Holder Defined
For purposes of this summary, a “non-U.S. holder” is any holder of our common stock, other than a partnership, that is not:
| Ÿ | an individual who is a citizen or resident of the United States; |
| Ÿ | a corporation, or other entity taxable as a corporation for United States federal income tax purposes, created or organized under the laws of the United States, any state therein or the District of Columbia; |
| Ÿ | a trust if it (i) is subject to the primary supervision of a U.S. court and one of more U.S. persons have authority to control all substantial decisions of the trust or (ii) has a valid election in effect under applicable U.S. Treasury regulations to be treated as a U.S. person; or |
| Ÿ | an estate whose income is subject to U.S. income tax regardless of source. |
If you are a non-U.S. citizen that is an individual, you may, in many cases, be deemed to be a resident alien, as opposed to a nonresident alien, by virtue of being present in the United States for at least 31 days in the calendar year and for an aggregate of at least 183 days during a three-year period ending in the current calendar year. For these purposes, all the days present in the current year, one-third of the days present in the immediately preceding year, and one-sixth of the days present in the second preceding year are counted. Resident aliens are subject to U.S. federal income tax as if they were U.S. citizens. Such an individual is urged to consult his or her own tax advisor regarding the U.S. federal income tax consequences of the ownership or disposition of our common stock.
Dividends
We do not expect to declare or make any distributions on our common stock in the foreseeable future. If we do pay dividends on shares of our common stock, however, such distributions will constitute dividends for U.S. federal income tax purposes to the extent paid from our current or accumulated earnings and profits, as determined under U.S. federal income tax principles. Distributions in excess of our current and accumulated earnings and profits will constitute a return of capital that is applied against and reduces, but not below zero, a non-U.S. holder’s adjusted tax basis in shares of our common stock. Any remaining excess will be treated as gain realized on the sale or other disposition of our common stock. See “Sale of Common Stock.”
Any dividend paid to a non-U.S. holder on our common stock that is not effectively connected with a non-U.S. holder’s conduct of a trade or business in the United States will generally be subject to U.S. withholding tax at a 30% rate. The withholding tax might not apply, however, or might apply at a reduced rate, under the terms of an applicable income tax treaty between the United States and the non-U.S. holder’s country of residence. You should consult your tax advisors regarding your entitlement to benefits under a relevant income tax treaty. Generally, in order for us or our paying
125
Table of Contents
agent to withhold tax at a lower treaty rate, a non-U.S. holder must certify its entitlement to treaty benefits. A non-U.S. holder generally can meet this certification requirement by providing a Form W-8BEN (or any successor form) or appropriate substitute form to us or our paying agent. If the non-U.S. holder holds the stock through a financial institution or other agent acting on the holder’s behalf, the holder will be required to provide appropriate documentation to the agent. The holder’s agent will then be required to provide certification to us or our paying agent, either directly or through other intermediaries. For payments made to a partnership or other pass-through entity, the certification requirements generally apply to the partners or other owners rather than to the partnership or other entity, and the partnership or other entity must provide the partners’ or other owners’ documentation to us or our paying agent. If you are eligible for a reduced rate of U.S. federal withholding tax under an income tax treaty, you may obtain a refund or credit of any excess amounts withheld by filing an appropriate claim for a refund with the IRS in a timely manner.
Dividends received by a non-U.S. holder that are effectively connected with a U.S. trade or business conducted by the non-U.S. holder, and if required by an applicable income tax treaty between the United States and the non-U.S. holder’s country of residence, are attributable to a permanent establishment maintained by the non-U.S. holder in the United States, are not subject to United States withholding tax. To obtain this exemption, a non-U.S. holder must provide us or our paying agent with an IRS Form W-8ECI properly certifying such exemption. Such effectively connected dividends, although not subject to withholding tax, are taxed at the same graduated rates applicable to U.S. persons, net of certain deductions and credits. In addition to being taxed at graduated tax rates, dividends received by corporate non-U.S. holders that are effectively connected with a U.S. trade or business of the corporate non-U.S. holder may also be subject to a branch profits tax at a rate of 30% or such lower rate as may be specified by an applicable tax treaty.
Sale of Common Stock
Subject to the discussion below regarding the Foreign Account Tax Compliance Act, non-U.S. holders will generally not be subject to U.S. federal income tax on any gains realized on the sale, exchange or other disposition of our common stock unless:
| Ÿ | the gain (i) is effectively connected with the conduct by the non-U.S. holder of a U.S. trade or business and (ii) if required by an applicable income tax treaty between the United States and the non-U.S. holder’s country of residence, is attributable to a permanent establishment (or, in certain cases involving individual holders, a fixed base) maintained by the non-U.S. holder in the United States (in which case the special rules described below apply); |
| Ÿ | the non-U.S. holder is an individual who is present in the United States for 183 days or more in the taxable year of the sale, exchange or other disposition of our common stock, and certain other requirements are met (in which case the gain would be subject to a flat 30% tax, or such reduced rate as may be specified by an applicable income tax treaty, which may be offset by U.S. source capital losses, even though the individual is not considered a resident of the United States); or |
| Ÿ | the rules of the Foreign Investment in Real Property Tax Act (FIRPTA) treat the gain as effectively connected with a U.S. trade or business. |
The FIRPTA rules may apply to a sale, exchange or other disposition of our common stock if we are, or were within the shorter of the five-year period preceding the disposition and the non-U.S. holder’s holding period, a “U.S. real property holding corporation,” or USRPHC. In general, we would be a USRPHC if interests in U.S. real estate comprised at least half of the value of our business assets. We do not believe that we are a USRPHC and we do not anticipate becoming one in the future. Even if we become a USRPHC, as long as our common stock is regularly traded on an established
126
Table of Contents
securities market, such common stock will be treated as U.S. real property interests only if beneficially owned by a non-U.S. holder that actually or constructively owned more than 5% of our outstanding common stock at some time within the five-year period preceding the disposition.
If any gain from the sale, exchange or other disposition of our common stock, (i) is effectively connected with a U.S. trade or business conducted by a non-U.S. holder and (ii) if required by an applicable income tax treaty between the United States and the non-U.S. holder’s country of residence, is attributable to a permanent establishment (or, in certain cases involving individuals, a fixed base) maintained by such non-U.S. holder in the United States, then the gain generally will be subject to U.S. federal income tax at the same graduated rates applicable to U.S. persons, net of certain deductions and credits. If the non-U.S. holder is a corporation, under certain circumstances, that portion of its earnings and profits that is effectively connected with its U.S. trade or business, subject to certain adjustments, generally would be subject also to a “branch profits tax.” The branch profits tax rate is 30%, although an applicable income tax treaty between the United States and the non-U.S. holder’s country of residence might provide for a lower rate.
U.S. Federal Estate Tax
The estates of nonresident alien individuals generally are subject to U.S. federal estate tax on property with a U.S. situs. Because we are a U.S. corporation, our common stock will be U.S. situs property and therefore will be included in the taxable estate of a nonresident alien decedent, unless an applicable estate tax treaty between the United States and the decedent’s country of residence provides otherwise.
Backup Withholding and Information Reporting
The Code and the Treasury regulations require those who make specified payments to report the payments to the IRS. Among the specified payments are dividends and proceeds paid by brokers to their customers. The required information returns enable the IRS to determine whether the recipient properly included the payments in income. This reporting regime is reinforced by “backup withholding” rules. These rules require the payors to withhold tax from payments subject to information reporting if the recipient fails to cooperate with the reporting regime by failing to provide his taxpayer identification number to the payor, furnishing an incorrect identification number, or failing to report interest or dividends on his returns. The backup withholding tax rate is currently 28% for all payments made through December 31, 2012. The backup withholding rules do not apply to payments to corporations, whether domestic or foreign, provided they establish such exemption.
Payments to non-U.S. holders of dividends on common stock generally will not be subject to backup withholding, and payments of proceeds made to non-U.S. holders by a broker upon a sale of common stock will not be subject to information reporting or backup withholding, in each case so long as the non-U.S. holder certifies its nonresident status (and we or our paying agent do not have actual knowledge or reason to know the holder is a U.S. person or that the conditions of any other exemption are not, in fact, satisfied) or otherwise establishes an exemption. The certification procedures to claim treaty benefits described under “Dividends” will generally satisfy the certification requirements necessary to avoid the backup withholding tax. We must report annually to the IRS any dividends paid to each non-U.S. holder and the tax withheld, if any, with respect to these dividends. Copies of these reports may be made available to tax authorities in the country where the non-U.S. holder resides.
Under the Treasury regulations, the payment of proceeds from the disposition of shares of our common stock by a non-U.S. holder made to or through a U.S. office of a broker generally will be subject to information reporting and backup withholding unless the beneficial owner certifies, under
127
Table of Contents
penalties of perjury, among other things, its status as a non-U.S. holder (and the broker does not have actual knowledge or reason to know the holder is a U.S. person) or otherwise establishes an exemption. The payment of proceeds from the disposition of shares of our common stock by a non-U.S. holder made to or through a non-U.S. office of a broker generally will not be subject to backup withholding and information reporting, except as noted below. Information reporting, but not backup withholding, will apply to a payment of proceeds, even if that payment is made outside of the United States, if you sell our common stock through a non-U.S. office of a broker that is:
| Ÿ | a U.S. person (including a foreign branch or office of such person); |
| Ÿ | a “controlled foreign corporation” for U.S. federal income tax purposes; |
| Ÿ | a foreign person 50% or more of whose gross income from certain periods is effectively connected with a U.S. trade or business; or |
| Ÿ | a foreign partnership if at any time during its tax year (a) one or more of its partners are U.S. persons who, in the aggregate, hold more than 50% of the income or capital interests of the partnership or (b) the foreign partnership is engaged in a U.S. trade or business; |
unless the broker has documentary evidence that the beneficial owner is a non-U.S. holder and certain other conditions are satisfied, or the beneficial owner otherwise establishes an exemption (and the broker has no actual knowledge or reason to know to the contrary).
Backup withholding is not an additional tax. Any amounts withheld from a payment to a holder of common stock under the backup withholding rules can be credited against any U.S. federal income tax liability of the holder and may entitle the holder to a refund, provided that the required information is furnished to the IRS in a timely manner.
Foreign Account Tax Compliance Act
The Foreign Account Tax Compliance Act, or FATCA, will impose a U.S. federal withholding tax of 30% on certain “withholdable payments” (including U.S. source dividends and the gross proceeds from the sale or other disposition of U.S. stock) to foreign financial institutions and other non-U.S. entities that fail to comply with certain certification and information reporting requirements. The obligation to withhold under FATCA is currently expected to apply to, among other items, (i) dividends on our common stock that are paid after December 31, 2013 and (ii) gross proceeds from the disposition of our common stock paid after December 31, 2016.
THE PRECEDING DISCUSSION OF U.S. FEDERAL TAX CONSIDERATIONS IS FOR GENERAL INFORMATION ONLY. IT IS NOT TAX ADVICE. EACH PROSPECTIVE INVESTOR SHOULD CONSULT ITS OWN TAX ADVISOR REGARDING THE PARTICULAR U.S. FEDERAL, STATE, LOCAL AND FOREIGN TAX CONSEQUENCES OF PURCHASING, HOLDING AND DISPOSING OF OUR COMMON STOCK, INCLUDING THE CONSEQUENCES OF ANY PROPOSED CHANGE IN APPLICABLE LAWS.
128
Table of Contents
We, the selling stockholders and the underwriters named below have entered into an underwriting agreement with respect to the shares being offered. Subject to certain conditions, each underwriter has severally agreed to purchase the number of shares indicated in the following table. Goldman, Sachs & Co. and Deutsche Bank Securities Inc. are the representatives of the underwriters.
| Underwriter |
Number of Shares | |
| Goldman, Sachs & Co. |
||
| Deutsche Bank Securities Inc. |
||
| UBS Securities LLC |
||
| Stifel, Nicolaus & Company, Incorporated |
||
| Wells Fargo Securities, LLC |
||
|
| ||
| Total |
||
|
|
The underwriters are committed to take and pay for all of the shares being offered, if any are taken, other than the shares covered by the option described below unless and until this option is exercised.
The underwriters have an option to buy up to an additional shares from us and the selling stockholders to cover sales by the underwriters of a greater number of shares than the total number set forth in the table above. They may exercise that option for 30 days. If any shares are purchased pursuant to this option, the underwriters will severally purchase shares in approximately the same proportion as set forth in the table above.
The following tables show the per share and total underwriting discounts and commissions to be paid to the underwriters by us and the selling stockholders. Such amounts are shown assuming both no exercise and full exercise of the underwriters’ option to purchase additional shares.
Paid by Us
| No Exercise | Full Exercise | |||||||
| Per Share |
$ | $ | ||||||
| Total |
$ | $ | ||||||
Paid by the Selling Stockholders
| No Exercise | Full Exercise | |||||||
| Per Share |
$ | $ | ||||||
| Total |
$ | $ | ||||||
Shares sold by the underwriters to the public will initially be offered at the initial public offering price set forth on the cover of this prospectus. Any shares sold by the underwriters to securities dealers may be sold at a discount of up to $ per share from the initial public offering price. If all the shares are not sold at the initial public offering price, the representatives may change the offering price and the other selling terms. The offering of the shares by the underwriters is subject to receipt and acceptance and subject to the underwriters’ right to reject any order in whole or in part.
We and our officers, directors and holders of substantially all of our common stock, including the selling stockholders, have agreed, subject to certain exceptions, not to dispose of or hedge any of our common stock or securities convertible into or exchangeable for shares of common stock during the period from the date of this prospectus continuing through the date 180 days after the date of this
129
Table of Contents
prospectus, except with the prior written consent of the representatives. This agreement does not apply to any grants under existing employee benefit plans and other customary exceptions. See “Shares Eligible for Future Sale” for a discussion of certain transfer restrictions.
Prior to the offering, there has been no public market for the shares. The initial public offering price will be negotiated among us and the representatives. Among the factors to be considered in determining the initial public offering price of the shares, in addition to prevailing market conditions, will be our historical performance, estimates of our business potential and earnings prospects, an assessment of our management and the consideration of the above factors in relation to market valuation of companies in related businesses.
We intend to apply to list the common stock on the New York Stock Exchange under the symbol “MRIN.”
In connection with the offering, the underwriters may purchase and sell shares of common stock in the open market. These transactions may include short sales, stabilizing transactions and purchases to cover positions created by short sales. Short sales involve the sale by the underwriters of a greater number of shares than they are required to purchase in the offering, and a short position represents the amount of such sales that have not been covered by subsequent purchases. A “covered short position” is a short position that is not greater than the amount of additional shares for which the underwriters’ option described above may be exercised. The underwriters may cover any covered short position by either exercising their option to purchase additional shares or purchasing shares in the open market. In determining the source of shares to cover the covered short position, the underwriters will consider, among other things, the price of shares available for purchase in the open market as compared to the price at which they may purchase additional shares pursuant to the option described above. “Naked” short sales are any short sales that create a short position greater than the amount of additional shares for which the option described above may be exercised. The underwriters must cover any such naked short position by purchasing shares in the open market. A naked short position is more likely to be created if the underwriters are concerned that there may be downward pressure on the price of the common stock in the open market after pricing that could adversely affect investors who purchase in the offering. Stabilizing transactions consist of various bids for or purchases of common stock made by the underwriters in the open market prior to the completion of the offering.
The underwriters may also impose a penalty bid. This occurs when a particular underwriter repays to the underwriters a portion of the underwriting discount received by it because the representatives have repurchased shares sold by or for the account of such underwriter in stabilizing or short covering transactions.
Purchases to cover a short position and stabilizing transactions, as well as other purchases by the underwriters for their own accounts, may have the effect of preventing or retarding a decline in the market price of the company’s stock, and together with the imposition of the penalty bid, may stabilize, maintain or otherwise affect the market price of the common stock. As a result, the price of the common stock may be higher than the price that otherwise might exist in the open market. The underwriters are not required to engage in these activities and may end any of these activities at any time. These transactions may be effected on , in the over-the-counter market or otherwise.
The underwriters do not expect sales to discretionary accounts to exceed five percent of the total number of shares offered.
We and the selling stockholders estimate that our share of the total expenses of the offering, excluding underwriting discounts and commissions, will be approximately $ million.
We and the selling stockholders have agreed to indemnify the several underwriters against certain liabilities, including liabilities under the Securities Act of 1933, as amended.
130
Table of Contents
The underwriters and their respective affiliates are full service financial institutions engaged in various activities, including securities trading, commercial and investment banking, financial advisory, investment management, principal investment, hedging, financing and brokerage activities. The underwriters and their respective affiliates may in the future perform, various financial advisory or investment banking services for the issuer, for which they will receive customary fees and expenses.
In the ordinary course of their various business activities, the underwriters and their respective affiliates may make or hold a broad array of investments and actively trade debt and equity securities (or related derivative securities) and financial instruments (including bank loans) for their own account and for the accounts of their customers and may at any time hold long and short positions in such securities and instruments. Such investment and securities activities may involve securities and instruments of the issuer.
European Economic Area
In relation to each Member State of the European Economic Area which has implemented the Prospectus Directive (each, a Relevant Member State), each underwriter has represented and agreed that with effect from and including the date on which the Prospectus Directive is implemented in that Relevant Member State (the Relevant Implementation Date) it has not made and will not make an offer of shares to the public in that Relevant Member State prior to the publication of a prospectus in relation to the shares which has been approved by the competent authority in that Relevant Member State or, where appropriate, approved in another Relevant Member State and notified to the competent authority in that Relevant Member State, all in accordance with the Prospectus Directive, except that it may, with effect from and including the Relevant Implementation Date, make an offer of shares to the public in that Relevant Member State at any time:
| (a) | to legal entities which are authorized or regulated to operate in the financial markets or, if not so authorized or regulated, whose corporate purpose is solely to invest in securities; |
| (b) | to any legal entity which has two or more of (1) an average of at least 250 employees during the last financial year; (2) a total balance sheet of more than €43,000,000 and (3) an annual net turnover of more than €50,000,000, as shown in its last annual or consolidated accounts; |
| (c) | to fewer than 100 natural or legal persons (other than qualified investors as defined in the Prospectus Directive) subject to obtaining the prior consent of the representatives for any such offer; or |
| (d) | in any other circumstances which do not require the publication by us of a prospectus pursuant to Article 3 of the Prospectus Directive. |
For the purposes of this provision, the expression an “offer of shares to the public” in relation to any shares in any Relevant Member State means the communication in any form and by any means of sufficient information on the terms of the offer and the shares to be offered so as to enable an investor to decide to purchase or subscribe the shares, as the same may be varied in that Relevant Member State by any measure implementing the Prospectus Directive in that Relevant Member State and the expression Prospectus Directive means Directive 2003/71/EC and includes any relevant implementing measure in each Relevant Member State.
Notice to Investors in the United Kingdom
Each underwriter has represented and agreed that:
| (a) | it has only communicated or caused to be communicated and will only communicate or cause to be communicated an invitation or inducement to engage in investment activity (within the meaning of Section 21 of the FSMA) received by it in connection with the issue or sale of the shares in circumstances in which Section 21(1) of the FSMA does not apply to us; and |
131
Table of Contents
| (b) | it has complied and will comply with all applicable provisions of the FSMA with respect to anything done by it in relation to the shares in, from or otherwise involving the United Kingdom. |
Notice to Residents of Hong Kong
The shares may not be offered or sold by means of any document other than (i) in circumstances which do not constitute an offer to the public within the meaning of the Companies Ordinance (Cap. 32, Laws of Hong Kong), or (ii) to “professional investors” within the meaning of the Securities and Futures Ordinance (Cap. 571, Laws of Hong Kong) and any rules made thereunder, or (iii) in other circumstances which do not result in the document being a “prospectus” within the meaning of the Companies Ordinance (Cap. 32, Laws of Hong Kong), and no advertisement, invitation or document relating to the shares may be issued or may be in the possession of any person for the purpose of issue (in each case whether in Hong Kong or elsewhere), which is directed at, or the contents of which are likely to be accessed or read by, the public in Hong Kong (except if permitted to do so under the laws of Hong Kong) other than with respect to shares which are or are intended to be disposed of only to persons outside Hong Kong or only to “professional investors” within the meaning of the Securities and Futures Ordinance (Cap. 571, Laws of Hong Kong) and any rules made thereunder.
Notice to Residents of Singapore
This prospectus has not been registered as a prospectus with the Monetary Authority of Singapore. Accordingly, this prospectus and any other document or material in connection with the offer or sale, or invitation for subscription or purchase, of the shares may not be circulated or distributed, nor may the shares be offered or sold, or be made the subject of an invitation for subscription or purchase, whether directly or indirectly, to persons in Singapore other than (i) to an institutional investor under Section 274 of the Securities and Futures Act, Chapter 289 of Singapore (the SFA), (ii) to a relevant person, or any person pursuant to Section 275(1A), and in accordance with the conditions, specified in Section 275 of the SFA or (iii) otherwise pursuant to, and in accordance with the conditions of, any other applicable provision of the SFA.
Where the shares are subscribed or purchased under Section 275 by a relevant person which is: (a) a corporation (which is not an accredited investor) the sole business of which is to hold investments and the entire share capital of which is owned by one or more individuals, each of whom is an accredited investor; or (b) a trust (where the trustee is not an accredited investor) whose sole purpose is to hold investments and each beneficiary is an accredited investor, shares, debentures and units of shares and debentures of that corporation or the beneficiaries’ rights and interest in that trust shall not be transferable for 6 months after that corporation or that trust has acquired the shares under Section 275 except: (i) to an institutional investor under Section 274 of the SFA or to a relevant person, or any person pursuant to Section 275(1A), and in accordance with the conditions, specified in Section 275 of the SFA; (ii) where no consideration is given for the transfer; or (iii) by operation of law.
Notice to Residents of Japan
The securities have not been and will not be registered under the Financial Instruments and Exchange Law of Japan (the Financial Instruments and Exchange Law) and each underwriter has agreed that it will not offer or sell any securities, directly or indirectly, in Japan or to, or for the benefit of, any resident of Japan (which term as used herein means any person resident in Japan, including any corporation or other entity organized under the laws of Japan), or to others for re-offering or resale, directly or indirectly, in Japan or to a resident of Japan, except pursuant to an exemption from the registration requirements of, and otherwise in compliance with, the Financial Instruments and Exchange Law and any other applicable laws, regulations and ministerial guidelines of Japan.
132
Table of Contents
The validity of the shares of common stock offered by this prospectus will be passed upon for us by Fenwick & West LLP, Mountain View, California, which beneficially owns an aggregate of 30,511 shares of our preferred stock that will convert to common stock upon the closing of this offering, representing approximately 0.13% of our outstanding shares of common stock as of September 30, 2012. Certain legal matters relating to the offering will be passed upon for the underwriters by Gibson, Dunn & Crutcher LLP, San Francisco, California.
The consolidated financial statements of Marin Software Incorporated as of December 31, 2010 and 2011 and for each of the three fiscal years in the period ended December 31, 2011 included in this prospectus have been so included in reliance on the report of PricewaterhouseCoopers LLP, an independent registered public accounting firm, given on the authority of said firm as experts in accounting and auditing.
WHERE YOU CAN FIND ADDITIONAL INFORMATION
We have filed with the SEC a registration statement on Form S-1 under the Securities Act with respect to the shares of common stock offered hereby. This prospectus, which constitutes a part of the registration statement, does not contain all of the information set forth in the registration statement or the exhibits filed therewith. For further information about us and the common stock offered hereby, reference is made to the registration statement and the exhibits filed therewith. Statements contained in this prospectus regarding the contents of any contract or any other document that is filed as an exhibit to the registration statement are not necessarily complete, and in each instance we refer you to the copy of such contract or other document filed as an exhibit to the registration statement. We currently do not file periodic reports with the SEC. Upon closing of our initial public offering, we will be required to file periodic reports, proxy statements and other information with the SEC pursuant to the Exchange Act. A copy of the registration statement and the exhibits filed therewith may be inspected without charge at the public reference room maintained by the SEC, located at 100 F Street, NE, Washington, DC 20549, and copies of all or any part of the registration statement may be obtained from that office. Please call the SEC at 1-800-SEC-0330 for further information about the public reference room. The SEC also maintains a website that contains reports, proxy and information statements and other information regarding registrants that file electronically with the SEC. The address of the website is www.sec.gov.
133
Table of Contents
INDEX TO CONSOLIDATED FINANCIAL STATEMENTS
| Page | ||||
| F-2 | ||||
| F-3 | ||||
| F-4 | ||||
| Consolidated Statements of Convertible Preferred Stock and Stockholders’ Deficit |
F-5 | |||
| F-6 | ||||
| F-7 | ||||
F-1
Table of Contents
Report of Independent Registered Public Accounting Firm
To the Board of Directors and Stockholders of
Marin Software Incorporated
In our opinion, the accompanying consolidated balance sheets and the related consolidated statements of comprehensive loss, convertible preferred stock and stockholders’ deficit and cash flows present fairly, in all material respects, the financial position of Marin Software Incorporated and its subsidiaries (the “Company”) at December 31, 2011 and 2010, and the results of their operations and their cash flows for each of the three years in the period ended December 31, 2011 in conformity with accounting principles generally accepted in the United States of America. These financial statements are the responsibility of the Company’s management. Our responsibility is to express an opinion on these financial statements based on our audits. We conducted our audits of these statements in accordance with the standards of the Public Company Accounting Oversight Board (United States). Those standards require that we plan and perform the audit to obtain reasonable assurance about whether the financial statements are free of material misstatement. An audit includes examining, on a test basis, evidence supporting the amounts and disclosures in the financial statements, assessing the accounting principles used and significant estimates made by management, and evaluating the overall financial statement presentation. We believe that our audits provide a reasonable basis for our opinion.
/s/ PricewaterhouseCoopers LLP
San Jose, CA
June 27, 2012, except for Notes 12 and 13, as to which the date is December 13, 2012
F-2
Table of Contents
Consolidated Balance Sheets
(dollars and share numbers in thousands, except per share data)
| As of December 31, |
As of September 30, 2012 |
Pro Forma As of September 30, 2012 |
||||||||||||||
| 2010 | 2011 | |||||||||||||||
| (Unaudited) | ||||||||||||||||
| Assets |
||||||||||||||||
| Current assets |
||||||||||||||||
| Cash and cash equivalents |
$ | 1,172 | $ | 1,719 | $ | 16,990 | $ | 36,890 | ||||||||
| Accounts receivable, net |
5,095 | 10,047 | 12,352 | 12,352 | ||||||||||||
| Prepaid expenses and other current assets |
1,206 | 1,264 | 2,095 | 2,095 | ||||||||||||
|
|
|
|
|
|
|
|
|
|||||||||
| Total current assets |
7,473 | 13,030 | 31,437 | 51,337 | ||||||||||||
| Property and equipment, net |
3,113 | 4,909 | 8,479 | 8,479 | ||||||||||||
| Other noncurrent assets |
67 | 358 | 384 | 384 | ||||||||||||
|
|
|
|
|
|
|
|
|
|||||||||
| Total assets |
$ | 10,653 | $ | 18,297 | $ | 40,300 | $ | 60,200 | ||||||||
|
|
|
|
|
|
|
|
|
|||||||||
| Liabilities, Convertible Preferred Stock and Stockholders’ (Deficit) Equity |
||||||||||||||||
| Current liabilities |
||||||||||||||||
| Accounts payable |
$ | 1,004 | $ | 1,251 | $ | 1,428 | $ | 1,428 | ||||||||
| Accrued payroll and other expenses |
3,153 | 6,690 | 8,138 | 8,138 | ||||||||||||
| Current portion of long-term debt |
1,207 | 4,997 | 8,545 | 8,545 | ||||||||||||
|
|
|
|
|
|
|
|
|
|||||||||
| Total current liabilities |
5,364 | 12,938 | 18,111 | 18,111 | ||||||||||||
| Long-term debt, less current portion |
1,988 | 1,632 | 1,483 | 1,483 | ||||||||||||
| Other long-term liabilities |
299 | 621 | 1,658 | 1,334 | ||||||||||||
|
|
|
|
|
|
|
|
|
|||||||||
| Total liabilities |
7,651 | 15,191 | 21,252 | 20,928 | ||||||||||||
|
|
|
|
|
|
|
|
|
|||||||||
| Commitments and contingencies (Note 14) |
||||||||||||||||
| Convertible preferred stock, net of issuance costs $0.001 par value—14,557 and 17,457 shares authorized, 14,470 and 17,275 shares issued and outstanding as of December 31, 2011 and September 30, 2012 (unaudited), respectively (liquidation preferences of $52,031 and $86,518 as of December 31, 2011 and September 30, 2012 (unaudited), respectively); no shares issued and outstanding, September 30, 2012 pro forma (unaudited) |
35,580 | 51,514 | 85,808 | — | ||||||||||||
| Stockholders’ (deficit) equity |
||||||||||||||||
| Common stock, $0.001 par value—30,000 shares authorized, 4,730 and 4,823 shares issued, 4,439, and 4,514 outstanding as of December 31, 2011 and September 30, 2012 (unaudited), respectively; 23,576 and 23,267 issued and outstanding September 30, 2012 pro forma (unaudited) |
4 | 5 | 5 | 24 | ||||||||||||
| Additional paid-in capital |
862 | 2,454 | 3,328 | 109,341 | ||||||||||||
| Accumulated other comprehensive loss |
— | — | — | — | ||||||||||||
| Accumulated deficit |
(33,444 | ) | (50,867 | ) | (70,093 | ) | (70,093 | ) | ||||||||
|
|
|
|
|
|
|
|
|
|||||||||
| Total stockholders’ (deficit) equity |
(32,578 | ) | (48,408 | ) | (66,760 | ) | 39,272 | |||||||||
|
|
|
|
|
|
|
|
|
|||||||||
| Total liabilities, convertible preferred stock, and stockholders’ (deficit) equity |
$ | 10,653 | $ | 18,297 | $ | 40,300 | $ | 60,200 | ||||||||
|
|
|
|
|
|
|
|
|
|||||||||
The accompanying notes are an integral part of these consolidated financial statements.
F-3
Table of Contents
Consolidated Statements of Comprehensive Loss
(dollars and share numbers in thousands, except per share data)
| Years Ended December 31, |
Nine Months Ended September 30, |
|||||||||||||||||||
| 2009 | 2010 | 2011 | 2011 | 2012 | ||||||||||||||||
| (Unaudited) | ||||||||||||||||||||
| Revenues |
$ | 7,527 | $ | 19,005 | $ | 36,121 | $ | 24,711 | $ | 42,507 | ||||||||||
| Cost of revenues |
5,101 | 11,040 | 18,691 | 13,523 | 17,728 | |||||||||||||||
|
|
|
|
|
|
|
|
|
|
|
|||||||||||
| Gross profit |
2,426 | 7,965 | 17,430 | 11,188 | 24,779 | |||||||||||||||
|
|
|
|
|
|
|
|
|
|
|
|||||||||||
| Operating expenses |
||||||||||||||||||||
| Sales and marketing |
6,146 | 8,884 | 20,357 | 14,474 | 23,615 | |||||||||||||||
| Research and development |
3,410 | 4,568 | 7,071 | 5,027 | 9,651 | |||||||||||||||
| General and administrative |
2,171 | 5,195 | 6,679 | 4,132 | 10,001 | |||||||||||||||
|
|
|
|
|
|
|
|
|
|
|
|||||||||||
| Total operating expenses |
11,727 | 18,647 | 34,107 | 23,633 | 43,267 | |||||||||||||||
|
|
|
|
|
|
|
|
|
|
|
|||||||||||
| Loss from operations |
(9,301 | ) | (10,682 | ) | (16,677 | ) | (12,445 | ) | (18,488 | ) | ||||||||||
| Interest expense, net |
(212 | ) | (230 | ) | (378 | ) | (276 | ) | (349 | ) | ||||||||||
| Other income (expenses), net |
(92 | ) | 78 | (229 | ) | (143 | ) | (222 | ) | |||||||||||
|
|
|
|
|
|
|
|
|
|
|
|||||||||||
| Loss before provision for income taxes |
(9,605 | ) | (10,834 | ) | (17,284 | ) | (12,864 | ) | (19,059 | ) | ||||||||||
| Provision for income taxes |
(103 | ) | (23 | ) | (139 | ) | (96 | ) | (167 | ) | ||||||||||
|
|
|
|
|
|
|
|
|
|
|
|||||||||||
| Net loss |
$ | (9,708 | ) | $ | (10,857 | ) | $ | (17,423 | ) | $ | (12,960 | ) | $ | (19,226 | ) | |||||
| Redemption of preferred stock in connection with the Series D financing and deemed dividend |
— | (1,033 | ) | — | — | — | ||||||||||||||
|
|
|
|
|
|
|
|
|
|
|
|||||||||||
| Net loss available to common stockholders |
$ | (9,708 | )$ | |
(11,890 |
) |
$ | (17,423 | ) | $ | (12,960 | ) | $ | (19,226 | ) | |||||
|
|
|
|
|
|
|
|
|
|
|
|||||||||||
| Net loss per share available to common stockholders, basic and diluted |
$ | (2.74 | ) | $ | (3.27 | ) | $ | (4.29 | ) | $ | (3.26 | ) | $ | (4.46 | ) | |||||
|
|
|
|
|
|
|
|
|
|
|
|||||||||||
| Weighted-average shares used to compute net loss per share available to common stockholders, basic and diluted |
3,540 | 3,639 | 4,058 | 3,978 | 4,312 | |||||||||||||||
|
|
|
|
|
|
|
|
|
|
|
|||||||||||
| Pro forma net loss per share available to common stockholders, basic and diluted (unaudited) (Note 12) |
$ | (0.96 | ) | $ | (0.84 | ) | ||||||||||||||
|
|
|
|
|
|||||||||||||||||
| Pro forma weighted-average shares used to compute pro forma net loss per share available to common stockholders, basic and diluted (unaudited) (Note 12) |
18,108 | 22,809 | ||||||||||||||||||
|
|
|
|
|
|
|
|
|
|
|
|||||||||||
| Other comprehensive income (loss) |
$ | — | $ | — | $ | — | $ | — | $ | — | ||||||||||
|
|
|
|
|
|
|
|
|
|
|
|||||||||||
| Comprehensive loss |
$ | (9,708 | ) | $ | (10,857 | ) | $ | (17,423 | ) | $ | (12,960 | ) | $ | (19,226 | ) | |||||
|
|
|
|
|
|
|
|
|
|
|
|||||||||||
| Stock-based compensation is allocated as follows (Note 10): |
||||||||||||||||||||
| Cost of revenues |
$ | 66 | $ | 90 | $ | 165 | $ | 119 | $ | 292 | ||||||||||
| Sales and marketing |
81 | 66 | 226 | 162 | 817 | |||||||||||||||
| Research and development |
26 | 58 | 163 | 120 | 648 | |||||||||||||||
| General and administrative |
19 | 1,172 | 143 | 82 | 2,490 | |||||||||||||||
The accompanying notes are an integral part of these consolidated financial statements.
F-4
Table of Contents
Consolidated Statements of Convertible Preferred Stock and Stockholders’ Deficit
(dollars and share numbers in thousands, except per share data)
| Convertible Preferred Stock |
Common Stock | Additional Paid-In Capital |
Accumu- lated Deficit |
Accumu- lated Other Compre- hensive Loss |
Total Stock- holders’ Deficit |
|||||||||||||||||||||||||||||
| Shares | Amount | Shares | Amount | |||||||||||||||||||||||||||||||
| (in thousands) | (in thousands) | |||||||||||||||||||||||||||||||||
| Balances as of December 31, 2008 |
6,358 | $ | 12,059 | 3,459 | $ | 4 | $ | 116 | $ | (11,251 | ) | $ | — | $ | (11,131 | ) | ||||||||||||||||||
| Issuance of Series C preferred stock for cash, net of issuance costs of $85 |
4,673 | 12,915 | — | — | — | — | — | — | ||||||||||||||||||||||||||
| Issuance of common stock |
— | — | 82 | — | 42 | — | — | 42 | ||||||||||||||||||||||||||
| Stock-based compensation expense |
— | — | — | — | 192 | — | — | 192 | ||||||||||||||||||||||||||
| Net loss and comprehensive loss |
— | — | — | — | — | (9,708 | ) | — | (9,708 | ) | ||||||||||||||||||||||||
|
|
|
|
|
|
|
|
|
|
|
|
|
|
|
|
|
|||||||||||||||||||
| Balances as of December 31, 2009 |
11,031 | 24,974 | 3,541 | 4 | 350 | (20,959 | ) | — | (20,605 | ) | ||||||||||||||||||||||||
| Issuance of Series D preferred stock for cash, net of issuance costs of $155 |
1,445 | 7,845 | — | — | — | — | — | — | ||||||||||||||||||||||||||
| Redemption of preferred stock in connection with Series D Financing and deemed dividend |
(327 | ) | (432 | ) | 327 | — | — | (1,033 | ) | — | (1,033 | ) | ||||||||||||||||||||||
| Issuance of Series D preferred stock in connection with redemption of preferred stock and dividend |
577 | 3,193 | (577 | ) | (1 | ) | — | (595 | ) | — | (596 | ) | ||||||||||||||||||||||
| Issuance of common stock from exercise of vested stock options and vesting of early exercised options |
— | — | 517 | 1 | 259 | — | — | 260 | ||||||||||||||||||||||||||
| Stock-based compensation expense |
— | — | — | — | 253 | — | — | 253 | ||||||||||||||||||||||||||
| Net loss and comprehensive loss |
— | — | — | — | — | (10,857 | ) | — | (10,857 | ) | ||||||||||||||||||||||||
|
|
|
|
|
|
|
|
|
|
|
|
|
|
|
|
|
|||||||||||||||||||
| Balances as of December 31, 2010 |
12,726 | 35,580 | 3,808 | 4 | 862 | (33,444 | ) | — | (32,578 | ) | ||||||||||||||||||||||||
| Issuance of Series E preferred stock for cash, net of issuance costs of $102 |
1,744 | 15,934 | — | — | — | — | — | — | ||||||||||||||||||||||||||
| Issuance of common stock from exercise of vested stock options and vesting of early exercised stock options |
— | — | 574 | 1 | 552 | — | — | 553 | ||||||||||||||||||||||||||
| Issuance of common stock from exercise of warrant |
— | — | 57 | — | 155 | — | — | 155 | ||||||||||||||||||||||||||
| Stock-based compensation expense |
— | — | — | — | 697 | — | — | 697 | ||||||||||||||||||||||||||
| Compensation expense from issuance of warrants |
— | — | — | — | 49 | — | — | 49 | ||||||||||||||||||||||||||
| Issuance of warrants in connection with debt agreement |
— | — | — | — | 139 | — | — | 139 | ||||||||||||||||||||||||||
| Net loss and comprehensive loss |
— | — | — | — | — | (17,423 | ) | — | (17,423 | ) | ||||||||||||||||||||||||
|
|
|
|
|
|
|
|
|
|
|
|
|
|
|
|
|
|||||||||||||||||||
| Balances as of December 31, 2011 |
14,470 | 51,514 | 4,439 | 5 | 2,454 | (50,867 | ) | — | (48,408 | ) | ||||||||||||||||||||||||
| Issuance of Series F preferred stock for cash, net of issuance costs of $194 (unaudited) |
2,805 | 34,294 | — | — | — | — | — | — | ||||||||||||||||||||||||||
| Issuance of common stock from exercise of vested stock options and vesting of early exercised stock options (unaudited) |
— | — | 356 | — | 555 | — | — | 555 | ||||||||||||||||||||||||||
| Issuance of common stock from stock purchase agreements(unaudited) |
— | — | 84 | 500 | — | — | 500 | |||||||||||||||||||||||||||
| Redemption of common stock (unaudited) |
— | — | (365 | ) | — | (4,488 | ) | — | — | (4,488 | ) | |||||||||||||||||||||||
| Stock-based compensation expense (unaudited) |
— | — | — | — | 4,247 | — | — | 4,247 | ||||||||||||||||||||||||||
| Compensation expense from issuance of warrants (unaudited) |
— | — | — | — | 60 | — | — | 60 | ||||||||||||||||||||||||||
| Net loss (unaudited) |
— | — | — | — | — | (19,226 | ) | — | (19,226 | ) | ||||||||||||||||||||||||
|
|
|
|
|
|
|
|
|
|
|
|
|
|
|
|
|
|||||||||||||||||||
| Balances as of September 30, 2012 (unaudited) |
17,275 | $ | 85,808 | 4,514 | $ | 5 | $ | 3,328 | $ | (70,093 | ) | $ | — | $ | (66,760 | ) | ||||||||||||||||||
|
|
|
|
|
|
|
|
|
|
|
|
|
|
|
|
|
|||||||||||||||||||
The accompanying notes are an integral part of these consolidated financial statements.
F-5
Table of Contents
Consolidated Statements of Cash Flows
(dollars and share numbers in thousands, except per share data)
| Years Ended December 31, |
Nine Months Ended September 30, |
|||||||||||||||||||
| 2009 | 2010 | 2011 | 2011 | 2012 | ||||||||||||||||
| (Unaudited) | ||||||||||||||||||||
| (in thousands) | ||||||||||||||||||||
| Operating activities |
||||||||||||||||||||
| Net loss |
$ | (9,708 | ) | $ | (10,857 | ) | $ | (17,423 | ) | $ | (12,960 | ) | $ | (19,226 | ) | |||||
| Adjustments to reconcile net loss to net cash used in operating activities |
||||||||||||||||||||
| Depreciation and amortization |
382 | 1,016 | 1,800 | 1,268 | 2,148 | |||||||||||||||
| Loss on disposal of fixed assets |
13 | 24 | 65 | — | — | |||||||||||||||
| Noncash interest expense related to warrants issued in connection with debt |
27 | 227 | 56 | 23 | 96 | |||||||||||||||
| Noncash expense related to warrants issued in connection with service agreement |
— | — | 49 | — | 60 | |||||||||||||||
| Stock-based compensation related to stock option grants |
192 | 253 | 697 | 483 | 1,657 | |||||||||||||||
| Stock-based compensation related to preferred stock financing |
— | 1,133 | — | — | 2,590 | |||||||||||||||
| Change in the valuation of outstanding preferred stock warrants |
78 | (102 | ) | 73 | 47 | 178 | ||||||||||||||
| Provision for bad debt |
79 | 23 | 289 | 144 | 274 | |||||||||||||||
| Other noncash expenses |
— | 93 | 211 | 24 | 315 | |||||||||||||||
| Changes in operating assets and liabilities |
||||||||||||||||||||
| Accounts receivable |
(1,241 | ) | (3,263 | ) | (5,452 | ) | (3,696 | ) | (2,894 | ) | ||||||||||
| Prepaid expenses and other current assets |
(303 | ) | (539 | ) | (58 | ) | (209 | ) | (831 | ) | ||||||||||
| Other assets |
— | 58 | (291 | ) | (261 | ) | (26 | ) | ||||||||||||
| Accounts payable |
178 | 613 | (54 | ) | 18 | 430 | ||||||||||||||
| Accrued expenses and other liabilities |
681 | 1,546 | 3,548 | 1,791 | 1,451 | |||||||||||||||
|
|
|
|
|
|
|
|
|
|
|
|||||||||||
| Net cash used in operating activities |
(9,622 | ) | (9,775 | ) | (16,490 | ) | (13,328 | ) | (13,778 | ) | ||||||||||
|
|
|
|
|
|
|
|
|
|
|
|||||||||||
| Investing activities |
||||||||||||||||||||
| Purchases of property and equipment |
(777 | ) | (2,447 | ) | (2,332 | ) | (1,306 | ) | (4,697 | ) | ||||||||||
| Capitalized internal-use software development costs |
(373 | ) | (435 | ) | (1,028 | ) | (714 | ) | (1,274 | ) | ||||||||||
|
|
|
|
|
|
|
|
|
|
|
|||||||||||
| Net cash used in investing activities |
(1,150 | ) | (2,882 | ) | (3,360 | ) | (2,020 | ) | (5,971 | ) | ||||||||||
|
|
|
|
|
|
|
|
|
|
|
|||||||||||
| Financing activities |
||||||||||||||||||||
| Proceeds from issuance of note payable |
— | 1,500 | 5,662 | 3,725 | 7,314 | |||||||||||||||
| Repayment of note payable |
(634 | ) | (1,134 | ) | (2,012 | ) | (1,118 | ) | (4,011 | ) | ||||||||||
| Payment of debt issuance costs |
— | — | (133 | ) | — | — | ||||||||||||||
| Redemption of common stock |
— | — | — | — | (4,488 | ) | ||||||||||||||
| Redemption of unvested shares subject to repurchase |
(3 | ) | — | — | — | (40 | ) | |||||||||||||
| Proceeds from issuance of convertible, preferred stock, net of issuance costs |
12,915 | 7,845 | 15,934 | 15,934 | 34,294 | |||||||||||||||
| Proceeds from common stock purchase agreements |
— | — | — | — | 500 | |||||||||||||||
| Proceeds from exercise of common stock warrants |
— | — | 155 | — | — | |||||||||||||||
| Proceeds from exercise of common stock options |
42 | 486 | 791 | 512 | 1,451 | |||||||||||||||
|
|
|
|
|
|
|
|
|
|
|
|||||||||||
| Net cash provided by financing activities |
12,320 | 8,697 | 20,397 | 19,053 | 35,020 | |||||||||||||||
|
|
|
|
|
|
|
|
|
|
|
|||||||||||
| Net increase (decrease) in cash and cash equivalents |
1,548 | (3,960 | ) | 547 | 3,705 | 15,271 | ||||||||||||||
| Cash and cash equivalents |
||||||||||||||||||||
| Beginning of period |
3,584 | 5,132 | 1,172 | 1,172 | 1,719 | |||||||||||||||
|
|
|
|
|
|
|
|
|
|
|
|||||||||||
| End of period |
$ | 5,132 | $ | 1,172 | $ | 1,719 | $ | 4,877 | $ | 16,990 | ||||||||||
|
|
|
|
|
|
|
|
|
|
|
|||||||||||
| Supplemental disclosures of other cash flow information |
||||||||||||||||||||
| Cash paid for interest |
$ | 203 | $ | 204 | $ | 264 | $ | 202 | $ | 338 | ||||||||||
| Cash paid for income taxes |
103 | 95 | 8 | 9 | 10 | |||||||||||||||
| Supplemental disclosure of noncash investing and financing activities |
||||||||||||||||||||
| Redemption of preferred stock in connection with Series D Financing |
$ | — | $ | 432 | $ | — | $ | — | $ | — | ||||||||||
| Deemed dividend on redemption of preferred stock |
— | 1,033 | — | — | — | |||||||||||||||
| Issuance of Series D preferred stock in connection with redemption of preferred stock and dividend |
— | 3,193 | — | — | — | |||||||||||||||
| Accounts payable related purchases of property and equipment |
— | — | 301 | 72 | 48 | |||||||||||||||
The accompanying notes are an integral part of these consolidated financial statements.
F-6
Table of Contents
Notes to Consolidated Financial Statements
(dollars and share numbers in thousands, except per share data)
1. Background
Marin Software Incorporated (the “Company”) was incorporated in Delaware in March 2006. The Company provides a leading cloud-based revenue acquisition management platform, offering integrated digital advertising management solutions for search, display, social media and mobile advertising. The Company’s platform helps advertisers and agencies improve financial performance, realize efficiencies and time savings, and make better business decisions. The Company’s corporate headquarters are located in San Francisco, California, and the Company has additional offices in the following locations: New York, Chicago, London, Hamburg, Paris, Tokyo, Singapore, Sydney, Austin, Texas, Portland, Oregon and Mountain View, California.
The Company has funded its operations through preferred stock financings with net proceeds totaling $51,514 and $85,808 (unaudited) through December 31, 2011 and September 30, 2012, respectively. However, the Company has incurred losses and negative cash flows from operations since inception. As of December 31, 2011 and September 30, 2012, the Company had an accumulated deficit of $50,867 and $70,093 (unaudited), respectively. Management of the Company expects that operating losses and negative cash flows from operations will continue in the foreseeable future. While management believes that the Company’s current cash resources and cash proceeds from the issuance of preferred stock subsequent to December 31, 2011 are adequate to meet its needs through at least December 31, 2013, the Company may need to borrow funds or raise additional equity to achieve its longer-term business objectives.
2. Summary of Significant Accounting Policies
Principles of Consolidation
The consolidated financial statements include the accounts of the Company and its wholly-owned subsidiaries. All intercompany accounts and transactions have been eliminated upon consolidation.
Accounting Estimates
The preparation of financial statements in conformity with accounting principles generally accepted in the United States (“GAAP”) requires management to make certain estimates and assumptions that affect the amounts reported in the financial statements and accompanying notes. The Company is subject to uncertainties such as the impact of future events, economic and political factors and changes in the Company’s business environment; therefore, actual results could differ from these estimates. Accordingly, the accounting estimates used in the preparation of the Company’s financial statements will change as new events occur, as more experience is acquired, as additional information is obtained and as the Company’s operating environment changes. Changes in estimates are made when circumstances warrant. Such changes in estimates and refinements in estimation methodologies are reflected in reported results of operations and if material, the effects of changes in estimates are disclosed in the notes to the financial statements. Significant estimates and assumptions by management affect the allowances for doubtful accounts and customer credits, the carrying value of long-lived assets, the useful lives of long-lived assets, the provision for income taxes and related deferred taxes, the sales tax accrual, stock-based compensation and the fair value of the Company’s Common Stock and Preferred Stock warrants.
Certain Significant Risks and Uncertainties
The Company operates in a rapidly changing environment that involves a number of risks, some of which are beyond the Company’s control that could have a material adverse effect on the Company’s
F-7
Table of Contents
Marin Software Incorporated
Notes to Consolidated Financial Statements
(dollars and share numbers in thousands, except per share data)
business, operating results, and financial condition. These risks include, among others, the Company’s: history of losses and ability to achieve profitability in the future; highly competitive environment; ability to maintain and increase usage rate of the Company’s platform; and ability to increase demand for its solutions.
Financial instruments that potentially subject the Company to concentrations of credit risk consist of cash, cash equivalents and trade receivables. The Company’s cash and cash equivalents are placed with high-credit-quality financial institutions and issuers, and at times exceed federally insured limits. The Company has not experienced any loss relating to cash and cash equivalents in these accounts. The Company performs periodic credit evaluations of its customers and generally does not require collateral.
Concentration of Credit Risk
Financial instruments that potentially subject the Company to credit risk consist principally of cash, cash equivalents and accounts receivable.
The Company limits its concentration of risk in cash equivalents and short-term investments by diversifying its investments among a variety of industries and issuers and by limiting the average maturity to one year or less.
As of December 31, 2010, two customers accounted for 12% and 11%, respectively, of net accounts receivable. As of December 31, 2011 and September 30, 2012 (unaudited), no single customer accounted for greater than 10% of net accounts receivable. One customer accounted for 12% of consolidated revenues during the year ended December 31, 2010. No single customer accounted for greater than 10% of consolidated revenues during the year ended December 31, 2011 and the nine months ended September 30, 2011 and 2012 (unaudited).
Unaudited Interim Financial Information
The consolidated financial statements as of September 30, 2012, and for the nine months ended September 30, 2011 and 2012 are unaudited. All disclosures as of September 30, 2012 and for the nine months ended September 30, 2011 and 2012, presented in the notes to the consolidated financial statements are unaudited. The unaudited interim consolidated financial statements have been prepared on the same basis as the annual consolidated financial statements and, in the opinion of management, reflect all normal recurring adjustments necessary for a fair statement of the Company’s consolidated financial position as of September 30, 2012 and the results of operations and cash flows for the nine months ended September 30, 2011 and 2012. The results of operations for the nine months ended September 30, 2012 are not necessarily indicative of the results to be expected for the year ended December 31, 2012 or for other interim periods or for future years.
Unaudited Pro Forma Stockholders’ Equity
Upon the consummation of the Company’s initial public offering, all of the outstanding shares of the Company’s convertible preferred stock will automatically convert into shares of the Company’s common stock and the Company’s convertible preferred stock warrants will become warrants for common stock (see Note 7). The September 30, 2012 unaudited pro forma balance sheet data has been prepared assuming the issuance of 1,478 shares of Series F-1 Preferred Stock and receipt of the related $19,900 net proceeds, the conversion of the convertible preferred stock outstanding, including the Series F-1 Preferred Stock issued in November 2012 (see Note 17), into 18,752 shares of common stock and the
F-8
Table of Contents
Marin Software Incorporated
Notes to Consolidated Financial Statements
(dollars and share numbers in thousands, except per share data)
reclassification of the convertible preferred stock warrant liability to additional paid-in capital upon conversion of the preferred stock warrant into a common stock warrant.
Cash and Cash Equivalents
The Company considers all highly liquid investments with an original or remaining maturity from the Company’s date of purchase of 90 days or less to be cash equivalents. Deposits held with financial institutions are likely to exceed the amount of insurance on these deposits. Cash equivalents consist of money market funds, which are readily convertible into cash and are stated at cost, which approximates fair market value. Cash equivalents were $357, $605 and $15,425 (unaudited) as of December 31, 2010 and 2011 and September 30, 2012, respectively.
Fair Value of Financial Instruments
The Company’s financial instruments, including cash equivalents, accounts receivable and accounts payable are carried at cost, which approximates fair value because of the short-term nature of those instruments. The carrying value of the Preferred Stock warrant liability (Note 6) represents fair value. Based on borrowing rates available to the Company for loans with similar terms and maturities, the carrying value of borrowings approximates fair value (Level 2 within the fair value hierarchy).
The Company measures and reports certain financial assets at fair value on a recurring basis, including its investments in money market funds. The fair value hierarchy prioritizes the inputs into three broad levels:
| Level 1 |
Inputs are unadjusted quoted prices in active markets for identical assets or liabilities. | |
| Level 2 |
Inputs are quoted prices for similar assets and liabilities in active markets or inputs that are observable for the asset or liability, either directly or indirectly through market corroboration, for substantially the full term of the financial instrument. | |
| Level 3 |
Inputs are unobservable inputs based on the Company’s assumptions. | |
A financial instrument’s level within the fair value hierarchy is based on the lowest level of input that is significant to the fair value measurement.
Allowance for Doubtful Accounts and Revenue Credits
The allowance for doubtful accounts reflects the Company’s best estimate of probable losses inherent in the Company’s receivables portfolio determined on the basis of historical experience, specific allowances for known troubled accounts and other currently available evidence. The Company has not experienced significant credit losses from its accounts receivable. The Company performs a regular review of its customers’ payment histories and associated credit risks and it does not require collateral from its customers. Certain contracts with advertising agencies contain sequential liability provisions, whereby, the agency does not have an obligation to pay until payment is received from the agency’s customers. In these circumstances, the Company evaluates the credit worthiness of the agency’s customers, in addition to the agency itself. As of December 31, 2010 and 2011 and September 30, 2012, the Company recorded an allowance for doubtful accounts in the amount of $0, $196 and $293
F-9
Table of Contents
Marin Software Incorporated
Notes to Consolidated Financial Statements
(dollars and share numbers in thousands, except per share data)
(unaudited), respectively. The following are changes in the allowance for doubtful accounts during 2009, 2010 and 2011 and the nine months ended September 30, 2011 and 2012, respectively.
| Years Ended December 31, |
Nine Months Ended September 30, |
|||||||||||||||||||
| 2009 | 2010 | 2011 | 2011 | 2012 | ||||||||||||||||
| (Unaudited) | ||||||||||||||||||||
| Balances at beginning of period |
$ | — | $ | — | $ | — | $ | — | $ | 140 | ||||||||||
| Additions |
79 | 23 | 289 | 144 | 274 | |||||||||||||||
| Write-offs |
(79 | ) | (23 | ) | (93 | ) | (4 | ) | (121 | ) | ||||||||||
|
|
|
|
|
|
|
|
|
|
|
|||||||||||
| Balances at end of period |
$ | — | $ | — | $ | 196 | $ | 140 | $ | 293 | ||||||||||
|
|
|
|
|
|
|
|
|
|
|
|||||||||||
From time to time the Company provides credits to customers and an allowance is made based on historical credit activity. As of December 31, 2010, 2011 and September 30, 2012, the Company recorded an allowance for potential customer credits in the amount of $93, $211 and $403 (unaudited), respectively.
Property and Equipment
Property and equipment are stated at historical cost less accumulated depreciation and amortization. Depreciation and amortization are computed using the straight-line method over the estimated useful lives of the related assets.
The useful lives of the property and equipment are as follows:
| Computer equipment |
3 to 5 years | |
| Office equipment, furniture and fixtures |
3 to 5 years | |
| Software |
2 to 3 years | |
| Leasehold improvements |
Shorter of useful life or lease term |
Upon retirement or sale, the cost and related accumulated depreciation are removed from the balance sheet and the resulting gain or loss is reflected in operations. Major additions and improvements are capitalized while repairs and maintenance that do not extend the life of the asset are charged to operations as incurred. Depreciation and amortization expense is allocated to both cost of revenues and operating expenses.
Internal Use Software
Costs incurred in the development phase are capitalized and amortized over the product’s estimated useful life, which is three years. The Company expenses all costs incurred that relate to planning and post implementation phases of development. Capitalized costs related to internal use software under development are treated as construction in progress until the program, feature or functionality is ready for its intended use, at which time amortization commences. For 2009, 2010 and 2011 and the nine months ended September 30, 2011 and 2012, the Company capitalized $373, $435, $1,028, $714 (unaudited) and $1,274 (unaudited) of software development costs related to software for internal use, respectively. Amortization of software developed for internal use was $185, $364, $456, $323 (unaudited) and $346 (unaudited) for 2009, 2010, 2011 and the nine months ended September 30, 2011 and 2012, respectively. As of December 31, 2010 and 2011 and September 30, 2012, unamortized internal use software development costs totaled $386, $958 and $1,887 (unaudited), respectively. Amortization of internal use software is reflected in cost of revenues. Costs associated with minor enhancement and maintenance are expensed as incurred.
F-10
Table of Contents
Marin Software Incorporated
Notes to Consolidated Financial Statements
(dollars and share numbers in thousands, except per share data)
As of January 1, 2012, the Company revised the estimated useful life of internal use software from two years to three years based on an evaluation of the use, maintenance and replacement practices of the Company’s internally developed software and the duration over which the software is expected to be utilized. As compared to amortization over a two year period, the revision resulted in a reduction of the amortization of internal use software recorded in cost of revenues of $225 (or $0.05 per share, basic and diluted) (unaudited) during the nine months ended September 30, 2012.
Impairment of Long-Lived Assets
The Company evaluates long-lived assets for potential impairment whenever adverse events or changes in circumstances or business climate indicate that expected undiscounted future cash flows related to such long-lived assets may not be sufficient to support the net book value of such assets. An impairment exists when the carrying value of a long-lived asset exceeds its fair value. An impairment loss is recognized only if the carrying value of a long-lived asset is not recoverable and exceeds its fair value. The carrying value of a long-lived asset is not recoverable if it exceeds the sum of the undiscounted cash flows expected to result from the use and eventual disposition of the asset. There were no such impairment losses during 2009, 2010 and 2011 or the nine months ended September 30, 2012 (unaudited).
Operating Leases
The Company’s operating lease agreements include provisions for certain rent holidays and escalations in the base price of the rent payment. The Company records rent holidays and rent escalations on a straight-line basis over the lease term. Deferred rent is included in accrued payroll and other expenses in the accompanying consolidated balance sheets.
Freestanding Preferred Stock Warrants
Freestanding warrants related to the Company’s Convertible Preferred Stock are classified as liabilities on the Company’s consolidated balance sheet. The warrants are subject to reassessment at each balance sheet date, and any change in fair value is recognized as a component of other income (expenses), net. The Company will continue to adjust the liability for changes in fair value until all Preferred Stock warrants are exercised, expired or converted into warrants to purchase stock. Upon the consummation of the initial public offering contemplated in this prospectus, the convertible Preferred Stock warrants will convert into warrants to purchase Common Stock. Upon conversion, the liability recorded for the Preferred Stock warrants will be reclassified to additional paid-in capital.
Revenue Recognition
The Company generates revenues principally from subscriptions to its platform either directly with advertisers or with advertising agencies. The Company’s subscription agreements are generally six months to one year in length for direct advertisers and up to two years in length for advertising agencies. The Company’s subscription fee under most contracts is variable based on the value of the advertising spend that the Company’s advertisers manage through the Company’s platform. Contracts with direct advertisers and certain contracts with advertising agencies also include a minimum monthly fee that is payable over the duration of the contract. The Company’s customers do not have the right to take possession of the software supporting the application service at any time, nor do the arrangements contain general rights of return. The Company commences revenue recognition for both direct advertisers and advertising agencies when all of the following conditions are met:
| Ÿ | persuasive evidence of an arrangement exists; |
F-11
Table of Contents
Marin Software Incorporated
Notes to Consolidated Financial Statements
(dollars and share numbers in thousands, except per share data)
| Ÿ | the Company’s platform is made available to the customer; |
| Ÿ | the fee is fixed or determinable, and; |
| Ÿ | collection is reasonably assured. |
The Company recognizes the total minimum fee for both direct advertisers and advertising agencies, where applicable, over the duration of the contract, commencing on the date that the Company’s platform is made available to the customer, provided revenues recognized do not exceed amounts that are invoiced and due. The variable fee, which is based on a percentage of the value of the advertising spend managed through the Company’s platform, is recognized once the amount is fixed or determinable, which is generally on a monthly basis concurrent with the issuance of the customer invoice. Signed contracts are used as evidence of an arrangement. The Company assesses collectability based on a number of factors such as past collection history with the customer and creditworthiness of the customer. Certain agreements with advertising agencies also contain sequential liability provisions, which provide that the agency has no obligation to pay the Company until the agency receives payment from its customers. In these circumstances, the Company evaluates the credit worthiness of the agency’s customers, in addition to the agency itself, to conclude whether or not collectability is reasonably assured. If the Company determines collectability is not reasonably assured, the Company defers the revenue recognition until collectability becomes reasonably assured.
In October 2009, the Financial Accounting Standards Board (“FASB”) ratified authoritative accounting guidance regarding revenue recognition for arrangements with multiple deliverables effective for fiscal periods beginning on or after June 15, 2010. The Company adopted the new guidance on a prospective basis for fiscal 2011. Professional services and training, when sold with the Company’s platform subscription services, are accounted for separately when those services have standalone value. In determining whether professional services and training services can be accounted for separately from subscription services, the Company considers the following factors: availability of the services from other vendors; the nature of the services; the dependence of the subscription services on the customer’s decision to buy the professional services; and whether the Company sells the Company’s subscription services without professional services. If the deliverables have stand-alone value, the Company accounts for each deliverable separately and revenues are recognized for the respective deliverables as they are delivered. If one or more of the deliverables do not have stand-alone value, the deliverables that do not have stand-alone value are combined with the final deliverables within the arrangement and treated as a single unit of accounting. Revenues for arrangements treated as a single unit of accounting are recognized over the period of the contract commencing upon delivery of the final deliverable. As of September 30, 2012, the Company did not have stand-alone value for the professional services and training services. This is because the Company includes professional services and training services with the Company’s subscription services and those services are not available from other vendors.
Cost of Revenues
Cost of revenues primarily consists of costs related to hosting the Company’s cloud-based platform, providing implementation and ongoing customer support, data communications expenses, salaries and benefits of operations and support personnel, software license fees, costs associated with website development activities, allocated overhead, amortization expense associated with capitalized internal use software and intangible assets and property and equipment depreciation.
F-12
Table of Contents
Marin Software Incorporated
Notes to Consolidated Financial Statements
(dollars and share numbers in thousands, except per share data)
Stock-Based Compensation
Stock-based compensation is measured at grant date based on the fair value of the award and is expensed on a straight-line basis over the requisite service period.
Fair values of share-based payment awards are determined on the date of grant using an option-pricing model. The Company has selected the Black-Scholes option pricing model to estimate the fair value of its stock options awards to employees and non-employees. In applying the Black-Scholes option pricing model, the Company’s determination of the fair value of the share-based payment award on the date of grant is affected by the Company’s estimated fair value of Common Stock, as well as assumptions regarding a number of subjective variables. These variables include, but are not limited to, the Company’s expected stock price volatility over the term of the stock options and the optionholders’ actual and projected stock option exercise and pre-vesting employment termination behaviors.
For awards with graded vesting, the Company recognizes stock-based compensation expense over the requisite service period using the straight-line method, based on awards ultimately expected to vest. The Company estimates future forfeitures at the date of grant and revises the estimates, if necessary, in subsequent periods if actual forfeitures differ from those estimates.
Stock options issued to non-employees such as consultants are recorded at their fair value on the measurement date. The measurement of stock-based compensation is subject to periodic adjustment as the underlying equity instruments vest. The fair value of options granted to consultants is expensed when vested. The non-employee stock-based compensation expense was not material for the years ended December 31, 2009, 2010 and 2011 and for the nine months ended September 30, 2012 (unaudited).
See Note 10 for further information.
Research and Development
Research and development costs are expensed as incurred, except for certain internal use software development costs, which may be capitalized as noted above. Research and development costs include salaries, stock-based compensation expense, benefits and other operating costs such as outside services, supplies and allocated overhead costs.
Advertising
Advertising costs are expensed as incurred and included in sales and marketing expense in the accompanying consolidated statements of operations. Advertising expense totaled $174, $195, $359, $267 (unaudited) and $453 (unaudited) for 2009, 2010, 2011 and the nine months ended September 30, 2011 and 2012, respectively.
Foreign Currency Transactions and Remeasurement
The U.S. Dollar is the functional currency of the Company’s foreign subsidiaries. Transactions in foreign currencies are remeasured into U.S. Dollars at the rates of exchange in effect at the date of the transaction. Monetary assets and liabilities denominated in non-U.S. currencies are re-measured to U.S. dollars using current exchange rates in effect at the balance sheet date. Nonmonetary assets and liabilities are re-measured to U.S. dollars using historical exchange rates. Other accounts are re-measured to U.S. dollars using average exchange rates in effect during each period. Transaction
F-13
Table of Contents
Marin Software Incorporated
Notes to Consolidated Financial Statements
(dollars and share numbers in thousands, except per share data)
gains and losses were not material for all periods presented and are included in other income (expenses), net, in the accompanying consolidated statements of operations.
Income Taxes
The Company accounts for income taxes using the asset and liability method. Under this method, deferred tax assets and liabilities are determined based on differences between the financial statement and tax basis of assets and liabilities and net operating loss and credit carryforwards using enacted tax rates in effect for the year in which the differences are expected to reverse. Valuation allowances are established when necessary to reduce deferred tax assets to the amounts expected to be realized.
The Company accounts for unrecognized tax benefits using a more-likely-than-not threshold for financial statement recognition and measurement of tax positions taken or expected to be taken in a tax return. The Company establishes a liability for tax-related uncertainties based on estimates of whether, and the extent to which, additional taxes will be due. The Company records an income tax liability, if any, for the difference between the benefit recognized and measured and the tax position taken or expected to be taken on the Company’s tax returns. To the extent that the assessment of such tax positions changes, the change in estimate is recorded in the period in which the determination is made. The liability is adjusted in light of changing facts and circumstances, such as the outcome of a tax audit. The provision for income taxes includes the impact of liability provisions and changes to the liability that are considered appropriate. As of December 31, 2010 and 2011 and September 30, 2012 (unaudited), the Company has not recorded any liabilities for unrecognized tax benefits.
Recent Accounting Pronouncements
In June 2011, the FASB issued Accounting Standards Update (“ASU”) 2011-05, Comprehensive Income. This guidance requires entities to have more detailed reporting of comprehensive income. The guidance is effective for fiscal years and interim periods within those years beginning after December 15, 2011. Early adoption is permitted. The guidance should be applied retrospectively. The adoption of this guidance on January 1, 2012 did not have a material impact on the consolidated financial statements.
In May 2011, the FASB issued ASU 2011-04, Fair Value Measurement. This guidance requires entities to change certain measurements and disclosures about fair value measurements. The guidance is effective during interim and annual periods beginning after December 15, 2011. The Company adopted this new guidance on January 1, 2012 and it did not have a material impact on the consolidated financial statements.
F-14
Table of Contents
Marin Software Incorporated
Notes to Consolidated Financial Statements
(dollars and share numbers in thousands, except per share data)
3. Revision of Previously Issued Financial Statements
During 2012, the Company determined that in 2009 it had recorded an elimination of intercompany balances in the incorrect functional expense category on its statement of comprehensive loss. In addition, in 2011, the Company improperly allocated overhead expenses to the functional expense categories on its consolidated statement of comprehensive loss. The Company assessed the materiality of these errors on the prior period financial statements in accordance with the SEC’s Staff Accounting Bulletin No. 99 (“SAB 99”) and concluded that the errors were not material to the previously issued financial statements taken as a whole. The Company has revised its prior year statements of comprehensive loss to correct the effects of those immaterial errors as follows:
| Fiscal Year Ended December 31 | ||||||||||||||||
| 2009 | 2011 | |||||||||||||||
| Consolidated statements of comprehensive loss: |
As Reported | As Revised | As Reported | As Revised | ||||||||||||
| Cost of Revenue |
$ | 5,101 | $ | 5,101 | $ | 17,574 | $ | 18,691 | ||||||||
| Gross Profit |
2,426 | 2,426 | 18,547 | 17,430 | ||||||||||||
| Sales and Marketing |
4,612 | 6,146 | 19,462 | 20,357 | ||||||||||||
| Research and Development |
3,410 | 3,410 | 6,561 | 7,071 | ||||||||||||
| General and Administrative |
3,705 | 2,171 | 9,174 | 6,679 | ||||||||||||
|
|
|
|
|
|
|
|
|
|||||||||
| Net Loss |
$ | (9,708 | ) | $ | (9,708 | ) | $ | (17,423 | ) | $ | (17,423 | ) | ||||
|
|
|
|
|
|
|
|
|
|||||||||
| Accumulated Deficit |
$ | 20,959 | $ | 20,959 | $ | 50,867 | $ | 50,867 | ||||||||
|
|
|
|
|
|
|
|
|
|||||||||
4. Balance Sheet Components
The following table shows the components of property and equipment as of December 31, 2010 and 2011 and September 30, 2012:
| December 31, | September 30, 2012 |
|||||||||||
| 2010 | 2011 | |||||||||||
| (Unaudited) | ||||||||||||
| Computer equipment |
$ | 3,006 | $ | 5,073 | $ | 8,134 | ||||||
| Software |
1,093 | 2,131 | 3,663 | |||||||||
| Office equipment |
34 | 36 | 290 | |||||||||
| Furniture, fixtures and leasehold improvements |
473 | 703 | 1,574 | |||||||||
|
|
|
|
|
|
|
|||||||
| 4,606 | 7,943 | 13,661 | ||||||||||
| Less: Accumulated depreciation and amortization |
(1,493 | ) | (3,034 | ) | (5,182 | ) | ||||||
|
|
|
|
|
|
|
|||||||
| $ | 3,113 | $ | 4,909 | $ | 8,479 | |||||||
|
|
|
|
|
|
|
|||||||
Depreciation and amortization expense for 2009, 2010 and 2011 and the nine months ended September 30, 2011 and 2012 was $382, $1,016, $1,800, $1,268 (unaudited) and $2,148 (unaudited), respectively.
F-15
Table of Contents
Marin Software Incorporated
Notes to Consolidated Financial Statements
(dollars and share numbers in thousands, except per share data)
The following table shows the components of accrued payroll and other expenses as of December 31, 2010 and 2011 and September 30, 2012:
| December 31, | September 30, 2012 |
|||||||||||
| 2010 | 2011 | |||||||||||
| (Unaudited) | ||||||||||||
| Accrued salary and payroll related expenses |
$ | 1,689 | $ | 3,699 | $ | 4,211 | ||||||
| Accrued accounts payable |
352 | 1,513 | 2,648 | |||||||||
| Sales tax payable |
662 | 900 | 104 | |||||||||
| Deferred revenue |
219 | 173 | 297 | |||||||||
| Other |
231 | 405 | 878 | |||||||||
|
|
|
|
|
|
|
|||||||
| $ | 3,153 | $ | 6,690 | $ | 8,138 | |||||||
|
|
|
|
|
|
|
|||||||
During 2009, 2010 and 2011 and nine months ended September 30, 2011 the Company neither charged nor remitted sales tax. The Company recorded expense of $259, $396, $151, $160 (unaudited) and $0 (unaudited), respectively, related to uncollected and unremitted sales tax including estimated interest during 2009, 2010 and 2011 and the nine months ended September 30, 2011 and 2012. The expense related to sales tax and interest was recorded in general and administrative expenses in the accompanying consolidated statements of comprehensive loss. The Company has executed Voluntary Disclosure Agreements with each of the relevant states, and, accordingly, began invoicing and remitting sales taxes to the applicable jurisdictions during the nine months ended September 30, 2012 (unaudited).
5. Fair Value Measurements
Account balances measured at fair value on a recurring basis include the following as of December 31, 2010 and 2011 and September 30, 2012:
| December 30, | September 30, | |||||||||||||||||||||||||||||||||||
| 2010 | 2011 | 2012 | ||||||||||||||||||||||||||||||||||
| Level 1 | Level 2 | Level 3 | Level 1 | Level 2 | Level 3 | Level 1 | Level 2 | Level 3 | ||||||||||||||||||||||||||||
| (Unaudited) | ||||||||||||||||||||||||||||||||||||
| Cash equivalents |
||||||||||||||||||||||||||||||||||||
| Money market funds |
$ | 357 | $ | — | $ | — | $ | 605 | $ | — | $ | — | $ | 15,425 | $ | — | $ | — | ||||||||||||||||||
| Long-term liabilities |
||||||||||||||||||||||||||||||||||||
| Preferred stock warrant obligation |
— | — | 72 | — | — | 145 | — | — | 323 | |||||||||||||||||||||||||||
The following table presents the changes in the preferred stock warrant obligation measured and recorded at fair value on a recurring basis, using significant unobservable inputs (Level 3) during 2009, 2010 and 2011 and the nine months ended September 30, 2011 and 2012:
| Years Ended December 31, | Nine Months Ended September 30, |
|||||||||||||||||||
| 2009 | 2010 | 2011 | 2011 | 2012 | ||||||||||||||||
| (Unaudited) | ||||||||||||||||||||
| Balances at beginning of period |
$ | 96 | $ | 174 | $ | 72 | $ | 72 | $ | 145 | ||||||||||
| Change in unrealized (gain) loss included in earnings |
78 | (102 | ) | 73 | 47 | 178 | ||||||||||||||
|
|
|
|
|
|
|
|
|
|
|
|||||||||||
| Balances at end of period |
$ | 174 | $ | 72 | $ | 145 | $ | 119 | $ | 323 | ||||||||||
|
|
|
|
|
|
|
|
|
|
|
|||||||||||
F-16
Table of Contents
Marin Software Incorporated
Notes to Consolidated Financial Statements
(dollars and share numbers in thousands, except per share data)
The Company’s cash equivalents as of December 31, 2010 and 2011 and September 30, 2012 (unaudited) consisted of money market funds with original maturity dates of three months from the date of their respective purchase. Cash equivalents are classified as Level 1.
The fair value of the Company’s money market funds approximated amortized cost and, as such, there were no unrealized gains or losses on money market funds as of December 31, 2010 and 2011 and September 30, 2012 (unaudited).
As of December 31, 2010 and 2011 and September 30, 2012, amounts of $815, $1,114 and $1,565 (unaudited), respectively, were held in bank deposits.
6. Debt
In October 2008, the Company entered into a loan and security agreement with Silicon Valley Bank that made a “Growth Capital Advance” available to the Company in two tranches for an aggregate amount of $5,000, with the first tranche for a total amount of $3,500 expiring on July 1, 2012 and the second tranche for a total amount of $1,500 expiring on November 1, 2012. The aggregate amount available under both tranches is subject to an interest-only period of six months from the draw down date, and thereafter, 36 consecutive equal monthly installments of principal and interest. The annual interest rate on the Growth Capital Advance is the greater of (i) the Prime Rate (as defined in the loan and security agreement) plus 1.0% or (ii) 6%.
In connection with the Growth Capital Advance, the Company issued a warrant to purchase 51 shares of Series B Stock at $2.7563 per share. This warrant expires on the later date of October 30, 2018, or five years from the closing of the Company’s initial public offering. The fair value of the warrants was estimated at an aggregate of $72 using the Black-Scholes valuation model with the following assumptions: expected volatility of 53%, risk free interest rate of 4.85%, expected life of 10 years and no dividends. The fair value of the warrants was recorded as a discount to the loan and was amortized to interest expense over the loan term.
In January 2010, the Company signed an amendment to the loan and security agreement, which provided for a revolving credit facility (the “Revolving Credit Facility”). The amount available for borrowing under the Revolving Credit Facility was the lesser of $1,500 or 80% of the Company’s eligible accounts receivable, as defined in the amended loan and security agreement. Interest under the revolving credit facility would be due monthly at the greater of 1.5% above the Prime Rate or 5.5%. As of December 31, 2010, the applicable interest rate was 5.5% and the maturity date was January 2012. In connection with this amendment, the annual interest rate for the Growth Capital Advance was amended to be the greater of 1.0% above the Prime Rate or 6%. As of December 31, 2010, the applicable interest rate of the Growth Capital Advance was 6%. The amendment also introduced a restrictive financial covenant that required the Company to maintain a monthly minimum quick ratio. Additionally, the Company was required to establish a lockbox account with the lender for the deposit of certain accounts receivable collections which resulted in the outstanding balance to be classified in current liabilities in the December 31, 2011 consolidated balance sheet.
In January 2011, the Company entered into an amendment to the Revolving Credit Facility pursuant to which Silicon Valley Bank agreed to increase the revolving credit facility to the lesser of $4,000 or 80% of the Company’s eligible accounts receivable, as defined in the amended loan and security agreement, and also to extend an equipment advance facility of $2,000 (the “Equipment Advance Facility”). The Equipment Advance Facility may only be used to finance the purchase of
F-17
Table of Contents
Marin Software Incorporated
Notes to Consolidated Financial Statements
(dollars and share numbers in thousands, except per share data)
equipment. The Revolving Credit Facility would accrue interest at a floating per annum rate equal to the greater of (a) one half percent over the Prime Rate; or (b) 3.75%, which shall be payable monthly and which will expire on January 10, 2013. The Equipment Advance Facility would accrue interest at a fixed per annum rate of 5.5% and will be repayable in 36 consecutive monthly installments of principal and interest and will expire on December 1, 2014.
In December 2011, the Company entered into another amendment to its existing Revolving Credit Facility pursuant to which Silicon Valley Bank agreed to increase the Revolving Credit Facility to the lesser of $10,000 or 80% of the Company’s eligible accounts receivable and to extend an additional equipment advance facility of $2,000 (the “Additional Equipment Advance Facility,” collectively with the Equipment Advance Facility, the “Equipment Advance Facilities”). With respect to the Revolving Credit Facility, the expiration date was extended to July 10, 2013 and the annual interest rate was amended to 0.75% over the Prime Rate payable on a monthly basis. The Additional Equipment Advance Facility may only be used to finance the purchase of equipment. The Additional Equipment Advance Facility accrues interest at a fixed per annum rate of 5.5% and will be repayable in 36 consecutive monthly installments of principal and interest. The additional equipment advance facility expires September 1, 2015. As of December 31, 2011 and September 30, 2012, $838 and $0, respectively, was available for withdrawal under the Equipment Advance Facilities. In connection with the amendment, the Company issued a warrant to Silicon Valley Bank to purchase 37 shares of common stock at $2.70 per share. This warrant expires on November 30, 2021. The fair value of the warrant was estimated at an aggregate of $139 using the Black-Scholes valuation model with the following assumptions: expected volatility of 57%; risk-free interest rate of 2.1%; expected life of 10 years; and no dividends. The fair value of the warrants was recorded as a discount to the loan and was amortized to interest expense over the loan term. Together with the Series B convertible preferred stock warrants issued with the Growth Capital Advance, a total of $27, $227, $56, $23 (unaudited) and $96 (unaudited) was recognized as interest expense for 2009, 2010 and 2011 and the nine months ended September 30, 2011 and 2012, respectively, as a result of the amortization of the loan discounts.
The Growth Capital Advance, Revolving Credit Facility and Equipment Advance Facilities are all collateralized with all of the personal property of the Company, excluding shares of controlled foreign corporations, patents and copyrights.
The Revolving Credit Facility also contains various covenants, including covenants related to the delivery of financial and other information, the maintenance of monthly financial covenants, as well as limitations on dispositions, change in business or management, mergers or consolidations, dividends and other corporate activities. As of December 31, 2011 and September 30, 2012 (unaudited), the Company was in compliance with all loan covenants.
F-18
Table of Contents
Marin Software Incorporated
Notes to Consolidated Financial Statements
(dollars and share numbers in thousands, except per share data)
The Company’s outstanding balances under the Growth Capital Advance, the Revolving Credit Facility and the Equipment Advance Facilities as of December 31, 2010 and 2011 and September 30, 2012 are as follows:
| December 31, | September 30, 2012 |
|||||||||||
| 2010 | 2011 | |||||||||||
| (Unaudited) | ||||||||||||
| Growth Capital Advance |
$ | 1,732 | $ | 525 | $ | — | ||||||
| Revolving Credit Facility |
1,500 | 3,550 | 7,225 | |||||||||
| Equipment Advance Facilities |
— | 2,807 | 2,960 | |||||||||
|
|
|
|
|
|
|
|||||||
| 3,232 | 6,882 | 10,185 | ||||||||||
| Discount on long-term debt |
(37 | ) | (253 | ) | (157 | ) | ||||||
|
|
|
|
|
|
|
|||||||
| $ | 3,195 | $ | 6,629 | $ | 10,028 | |||||||
|
|
|
|
|
|
|
|||||||
The maturities of debt as of December 30, 2011 and September 30, 2012 are as follows:
| December 31, 2011 |
September 30, 2012 |
|||||||
| (Unaudited) | ||||||||
| Years Ending |
||||||||
| 2012 |
$ | 4,997 | $ | 323 | ||||
| 2013 |
1,070 | 8,563 | ||||||
| 2014 |
711 | 995 | ||||||
| 2015 |
104 | 304 | ||||||
|
|
|
|
|
|||||
| 6,882 | 10,185 | |||||||
| Less: |
||||||||
| Current portion |
(4,997 | ) | (8,545 | ) | ||||
| Discount on long-term debt |
(253 | ) | (157 | ) | ||||
|
|
|
|
|
|||||
| Noncurrent portion of debt |
$ | 1,632 | $ | 1,483 | ||||
|
|
|
|
|
|||||
Outstanding warrants to purchase the Company’s Series B Preferred Stock are classified as liabilities which must be adjusted to fair value at each reporting period until the earlier of their exercise or expiration on the later date of October 30, 2018 or five years from the closing of the Company’s initial public offering, or the completion of a liquidation event, including the completion of an initial public offering, at which time the Preferred Stock warrant liability will automatically convert into a warrant to purchase shares of Common Stock and will be reclassified to stockholders’ equity (deficit). The Company recorded a loss of $78, $73, $47 (unaudited) and $178 (unaudited), respectively, for 2009 and 2011 and the nine months ended September 30, 2011 and 2012, and a gain of $102 for 2010, within other income (expenses), net to adjust the warrant liability to fair value. The fair values were determined using Level 3 inputs under the GAAP fair value hierarchy.
F-19
Table of Contents
Marin Software Incorporated
Notes to Consolidated Financial Statements
(dollars and share numbers in thousands, except per share data)
7. Convertible Preferred Stock
As of December 31, 2011, the holders of convertible Preferred Stock (“Series A Stock”, “Series A-1 Stock”, “Series B Stock”, “Series C Stock”, “Series D Stock” and “Series E Stock”) have various rights and preferences as follows:
| Shares Authorized |
Shares Outstanding |
Liquidation Amount |
Proceeds Net of Issuance Cost |
|||||||||||||
| Series A |
2,009 | 2,009 | $ | 2,248 | $ | 2,208 | ||||||||||
| Series A-1 |
1,400 | 1,400 | 2,329 | 2,273 | ||||||||||||
| Series B |
2,672 | 2,622 | 7,227 | 7,146 | ||||||||||||
| Series C |
4,673 | 4,673 | 12,999 | 12,915 | ||||||||||||
| Series D |
2,022 | 2,022 | 11,192 | 11,038 | ||||||||||||
| Series E |
1,780 | 1,744 | 16,036 | 15,934 | ||||||||||||
|
|
|
|
|
|
|
|
|
|||||||||
| 14,556 | 14,470 | $ | 52,031 | $ | 51,514 | |||||||||||
|
|
|
|
|
|
|
|
|
|||||||||
Dividends
Holders of Series A, Series A-1, Series B, Series, Series D and Series E Stock are entitled to receive noncumulative dividends at the per annum rate of $0.06714, $0.0998, $0.165378, $0.1669, $0.332106 and $0.551694, respectively, on each outstanding share of Series A Stock, Series A-1, Series B, Series C, Series D and Series E Stock, when and if declared by the Board of Directors.
Holders of all Preferred Stock will also be entitled to participate in dividends on Common Stock when, as and if declared by the Board of Directors, based on the number of shares of Common Stock held on an as-if converted basis. From the inception of the Company through September 30, 2012 (unaudited), the Company’s Board of Directors had not declared any dividends.
Liquidation
In the event of any liquidation, dissolution or winding up of the Company whether voluntary or involuntary, before any distribution or payment shall be made to the holders of Common Stock, the holders of each Preferred Stock then outstanding shall be entitled to be paid, on a pari passu basis, plus all declared but unpaid dividends on such Preferred Stock out of the assets of the Company legally available for distribution. If, upon any such liquidation, distribution or winding up, the assets of the Company legally available for distribution shall be insufficient to make payment in full to the holders of each Preferred Stock then such assets shall be distributed among the holders of each Preferred Stock at the time outstanding, ratably in proportion to the full amounts to which they would otherwise be, respectively, entitled. These rights notwithstanding, in the event of liquidation, the holders of Series E Preferred Stock would be entitled to paid, prior and in preference to any payment to Series A, Series A-1, Series B, Series, Series D Preferred Stockholders or Common Stockholders.
After the payment of the full liquidation preferences of the Preferred Stock, the remaining assets of the Company legally available for distribution, if any, shall be distributed ratably to the holders of the then outstanding Common Stock according to the number of outstanding shares of Common Stock held by each such holder. The liquidation features cause the Preferred Stock to be classified as mezzanine equity rather than as a component of stockholders’ equity (deficit).
F-20
Table of Contents
Marin Software Incorporated
Notes to Consolidated Financial Statements
(dollars and share numbers in thousands, except per share data)
Conversion
Each Preferred Stock shall automatically be converted into fully paid shares of Common Stock, upon the earlier of (i) immediately prior to the closing of a public offering pursuant to an effective registration statement filed under the Securities Act, in which the gross proceeds to the Company equals or exceeds $30 million; or (ii) upon the date specified in a written consent of the holders of at least two-thirds of then outstanding shares of Preferred Stock to the conversion of all then-outstanding Preferred Stock. Upon the occurrence of any conversion event, the outstanding warrant to purchase Series B convertible preferred stock (Note 6) shall convert into a warrant to purchase Common Stock.
In addition to the conversion features noted above, each share of preferred stock, at the option of the preferred stockholder, shall be converted into fully paid shares of common stock.
All of the outstanding shares of Preferred Stock will convert into Common Stock at the then-applicable conversion rate, which is 1:1 for each series of Preferred Stock as of December 31, 2011.
As of December 31, 2010 and 2011, the Company had 12,726 and 14,470, respectively, shares of Common Stock available for the conversion of convertible Preferred Stock.
Voting
Each holder of Preferred Stock shall have voting rights equal to an equivalent whole number of shares of Common Stock into which it is convertible.
Issuance of Preferred Stock
In May 2010, the Company issued 1,445 shares of Series D Convertible Preferred Stock, $0.001 par value per share, for net proceeds of $7,845. The holders of Series D Stock are entitled to receive noncumulative dividends at the per annum rate of $0.332106, on each outstanding share of Series D Stock, when and if declared by the Board of Directors. The holders of Series D Stock will also be entitled to participate in dividends along with Common Stockholders, voting rights, conversion rights and liquidation preferences similar to the holders of Series A, Series A-1, Series B and Series C Convertible Preferred Stock.
Concurrent with the issuance of the Series D stock, the Company also entered into an agreement with certain existing Series A, Series A-1, Series B and Common Stockholders (“Selling Stockholders”) and the purchasers of Series D Stock, whereby the Selling Stockholders, in conjunction with the primary issuance of Series D, would convert their Preferred Stock into Common Stock of the Company, where applicable, and transfer the Common Stock to the purchaser of Series D Stock for consideration to be paid by the purchaser of Series D Stock to the Selling Stockholders. The Company also agreed that such Common Shares will be exchanged for shares of Series D Stock. Under this agreement, certain existing shareholders sold 577 shares of Common Stock, which were concurrently exchanged with Series D Stock. The Company recorded compensation expense of $1,133, equal to the difference between the fair value of the exchanged Common Stock and Series A Stock sold by a participating employee and the issuance price of the related Series D Stock. The Company also recorded a deemed dividend of $145, equal to the difference between the original issuance price and the estimated fair value of the Series A Stock held by such employee at the date of the exchange. In connection with nonemployee preferred stockholders who participated in the exchange, the Company also recorded a deemed dividend of $888, equal to the difference between the original issuance prices of the exchanged Series A, Series A-1 and Series B Stock and the issuance price of the related Series D Stock.
F-21
Table of Contents
Marin Software Incorporated
Notes to Consolidated Financial Statements
(dollars and share numbers in thousands, except per share data)
In March 2011, the Company issued 1,744 shares of Series E Convertible Preferred Stock, $0.001 par value per share, for net proceeds of $15,934. The holders of Series E Stock are entitled to receive noncumulative dividends at the per annum rate of $0.551694, on each outstanding share of Series E Stock, when and if declared by the Board of Directors, prior and in preference to the payment of any dividend on Series A, Series A-1, Series B, Series C and Series D Preferred Stock (“Junior Preferred Stock”) and Common Stock in such calendar year. The holders of Series E Stock will also be entitled to participate in dividends along with Common Stockholders, voting rights, conversion rights similar to the holders of Series A, Series A-1, Series B, Series C and Series D Convertible Preferred Stock. In the event of liquidation, the holders of Series E Preferred Stock would be entitled to be paid, prior and in preference to any payment to Junior Preferred Stockholders or Common Stockholders.
8. Common Stock
As of December 31, 2010 and 2011 and September 30, 2012 (unaudited), the Company was authorized to issue 30,000 shares of $0.001 par value Common Stock. Reserved shares of Common Stock are as follows:
| December 31, | September 30, 2012 |
|||||||||||
| 2010 | 2011 | |||||||||||
| (Unaudited) | ||||||||||||
| Preferred Stock and Common Stock Warrants |
51 | 88 | 88 | |||||||||
| Stock options |
3,744 | 5,439 | 6,333 | |||||||||
| Convertible preferred stock |
13,006 | 14,557 | 17,457 | |||||||||
|
|
|
|
|
|
|
|||||||
| 16,801 | 20,084 | 23,878 | ||||||||||
|
|
|
|
|
|
|
|||||||
As of September 30, 2012, warrants to purchase 51 shares of Series B Preferred Stock at $2.76 per share and warrants to purchase 37 shares of Common Stock at $2.70 per share were outstanding (unaudited). During the nine months ended September 30, 2012, the Company entered into common stock purchase agreements (“CSPAs”) with two members of the Board of Directors. In connection with the CSPAs, the Company sold 84 shares of common stock for a cumulative purchase price of $500 (unaudited). The underlying shares vest ratably on a monthly basis over 24 months. The CSPAs include a repurchase feature which provides the Company the option, but not the obligation, to repurchase any unvested shares upon termination at the original purchase price. As of September 30, 2012, 64 common shares issued under the CSPAs were unvested (unaudited).
9. Equity Award Plans
In April 2006, the Company’s Board of Directors adopted and the stockholders approved the 2006 Stock Option Plan (“2006 Plan”). The 2006 Plan provides for the grant of incentive stock options under the federal tax laws and nonstatutory stock options. Only employees may receive incentive stock options, but nonstatutory stock options may be granted to employees, nonemployee directors and consultants. The exercise price of incentive stock options may not be less than 100% of the fair market value of the Company’s Common Stock on the date of grant. The exercise price of nonstatutory stock options may not be less than 85% of the fair market value of the Company’s Common Stock on the date of grant. Shares subject to options under the 2006 Plan generally vest in a series of installments over an optionee’s period of service, generally four years.
F-22
Table of Contents
Marin Software Incorporated
Notes to Consolidated Financial Statements
(dollars and share numbers in thousands, except per share data)
The term of options granted under the 2006 Plan may not exceed ten years. Unless the terms of an optionee’s stock option agreement provide otherwise, if an optionee’s service relationship with the Company, or any of its affiliates, ceases for any reason other than disability or death, the optionee may exercise the vested portion of any options for three months after the date of such termination. If an optionee’s service relationship with the Company, or any of its affiliates, ceases due to disability or death (or an optionee dies within a certain period following cessation of service), the optionee or a beneficiary may exercise any vested options for a period of 12 months. In no event, however, may an option be exercised beyond the expiration of its term.
As of December 31, 2010 and 2011 and September 30, 2012, the Company had reserved 3,744, 5,439 and 6,333 (unaudited) shares of Common Stock, respectively, for issuance under the 2006 Plan.
Certain options are eligible for exercise prior to vesting. Exercised but unvested shares are subject to repurchase by the Company at the initial exercise price. The proceeds from the shares subject to repurchase are classified as a liability and reclassified to equity as the shares vest. Under the 2006 Plan’s early exercise feature, the Company could be required to repurchase 261, 291 and 309 (unaudited) shares as of December 31, 2010 and 2011 and September 30, 2012, respectively. The Company records cash received from early exercised shares as a long-term liability. As of December 31, 2010, 2011 and September 30, 2012, $227, $466 and $1,322 (unaudited), respectively, has been recorded as a long-term liability on the consolidated balance sheets.
F-23
Table of Contents
Marin Software Incorporated
Notes to Consolidated Financial Statements
(dollars and share numbers in thousands, except per share data)
A summary of activity under the 2006 Plan is as follows:
| Options Outstanding | ||||||||||||||||
| Number of Shares |
Weighted Average Exercise Price |
Weighted Average Remaining Contractual Term (in Years) |
Aggregate Intrinsic Value |
|||||||||||||
| Balances as of December 31, 2008 |
2,074 | $ | 0.63 | 9.57 | $ | 322 | ||||||||||
|
|
|
|||||||||||||||
| Options granted |
621 | 0.81 | 9.53 | |||||||||||||
| Options exercised |
(46 | ) | 0.78 | — | ||||||||||||
| Options forfeited and cancelled |
(354 | ) | 0.78 | — | ||||||||||||
|
|
|
|
|
|
|
|||||||||||
| Balances as of December 31, 2009 |
2,295 | $ | 0.65 | 8.76 | 327 | |||||||||||
|
|
|
|||||||||||||||
| Options granted |
1,060 | 1.89 | 9.57 | |||||||||||||
| Options exercised |
(731 | ) | 0.66 | — | ||||||||||||
| Options forfeited and cancelled |
(138 | ) | 1.15 | — | ||||||||||||
|
|
|
|
|
|
|
|||||||||||
| Balances as of December 31, 2010 |
2,486 | 1.14 | 8.46 | 3,174 | ||||||||||||
|
|
|
|||||||||||||||
| Options granted |
1,399 | 2.53 | 9.28 | |||||||||||||
| Options exercised |
(607 | ) | 1.31 | — | ||||||||||||
| Options forfeited and cancelled |
(278 | ) | 1.65 | — | ||||||||||||
|
|
|
|
|
|
|
|||||||||||
| Balances as of December 31, 2011 |
3,000 | 1.71 | 8.21 | 10,575 | ||||||||||||
|
|
|
|||||||||||||||
| Options granted (unaudited) |
1,835 | 6.94 | 9.62 | |||||||||||||
| Options exercised (unaudited) |
(396 | ) | 3.66 | — | ||||||||||||
| Options forfeited and cancelled (unaudited) |
(165 | ) | 3.15 | — | ||||||||||||
|
|
|
|
|
|
|
|||||||||||
| Balances as of September 30, 2012 (unaudited) |
4,274 | $ | 3.72 | 8.25 | $ | 27,691 | ||||||||||
|
|
|
|
|
|
|
|
|
|||||||||
| Options exercisable as of December 31, 2011 |
3,000 | $ | 1.71 | 8.21 | $ | 10,575 | ||||||||||
|
|
|
|
|
|
|
|
|
|||||||||
| Options vested as of December 31, 2011 |
1,471 | $ | 1.17 | 7.50 | $ | 5,924 | ||||||||||
|
|
|
|
|
|
|
|
|
|||||||||
| Options vested and expected to vest as of December 31, 2011 |
2,844 | $ | 1.67 | 8.17 | $ | 10,031 | ||||||||||
|
|
|
|
|
|
|
|
|
|||||||||
| Options exercisable as of September 30, 2012 (unaudited) |
4,274 | $ | 3.72 | 8.25 | $ | 27,691 | ||||||||||
|
|
|
|
|
|
|
|
|
|||||||||
| Options vested as of September 30, 2012 (unaudited) |
1,774 | $ | 1.73 | 7.10 | $ | 15,028 | ||||||||||
|
|
|
|
|
|
|
|
|
|||||||||
| Options vested and expected to vest of September 30, 2012 (unaudited) |
4,135 | $ | 3.64 | 8.15 | $ | 27,107 | ||||||||||
|
|
|
|
|
|
|
|
|
|||||||||
The intrinsic value of options exercised during 2009, 2010 and 2011 and the nine months ended September 30, 2011 and 2012 was $0, $344, $545, $275 (unaudited) and $1,141 (unaudited), respectively. The total estimated fair value of share options vested during 2009, 2010 and 2011 and the nine months ended September 30, 2011 and 2012 was $114, $221, $559, $280 (unaudited) and $1,173 (unaudited), respectively.
F-24
Table of Contents
Marin Software Incorporated
Notes to Consolidated Financial Statements
(dollars and share numbers in thousands, except per share data)
The following table summarizes information about shares subject to stock options outstanding as of September 30, 2012 (unaudited):
| Exercise Price |
Number of Shares Subject to Outstanding Options |
Weighted Average Remaining Contractual Life (in years) |
||||||
| $0.14 |
253 | 4.67 | ||||||
| 0.78 |
465 | 6.15 | ||||||
| 0.82 |
391 | 7.18 | ||||||
| 2.39 |
1,020 | 8.18 | ||||||
| 2.70 |
530 | 8.57 | ||||||
| 5.20 |
125 | 9.11 | ||||||
| 7.05 |
1,176 | 9.60 | ||||||
| 7.55 |
314 | 9.90 | ||||||
|
|
|
|||||||
| 4,274 | ||||||||
|
|
|
|||||||
10. Stock-Based Compensation
For stock options granted by the Company, stock-based compensation cost is measured at grant date based on the fair value of the award and is expensed over the requisite service period. The Company recorded stock-based compensation of $192, $1,386, $697, $483 (unaudited) and $4,247 (unaudited) for 2009, 2010 and 2011 and nine months ended September 30, 2011 and 2012, respectively.
The Company uses the Black-Scholes option pricing model to estimate the fair value of options. This model requires the input of highly subjective assumptions including the expected term of the option, expected stock price volatility and expected forfeitures. The Company used the following assumptions:
| Years Ended December 31, | Nine Months Ended September 30, |
|||||||||||||||||||
| 2009 | 2010 | 2011 | 2011 | 2012 | ||||||||||||||||
| (Unaudited) | ||||||||||||||||||||
| Dividend yield |
— | — | — | — | — | |||||||||||||||
| Expected volatility |
52.0 | % | 49.0 | % | 56.7 | % | 56.7 | % | 57.0 | % | ||||||||||
| Risk-free interest rate |
2.52 | % | 1.83 | % | 2.02 | % | 2.02 | % | 0.97 | % | ||||||||||
| Expected life of options (in years) |
5.96 | 5.92 | 6.25 | 6.25 | 6.25 | |||||||||||||||
| Forfeiture rate |
8.3% - 14.0 | % | 8.3% - 14.0 | % | 3.0% - 8.0 | % | 3.0% - 8.0 | % | 3.2% - 7.0 | % | ||||||||||
| Weighted-average grant-date fair value |
$ | 0.42 | $ | 0.89 | $ | 1.61 | $ | 1.61 | $ | 4.12 | ||||||||||
| Weighted-average grant-date exercise price |
$ | 0.81 | $ | 1.89 | $ | 2.53 | $ | 2.53 | $ | 6.94 | ||||||||||
As the Company has limited historical option exercise data, the expected term of the stock options granted to employees under the 2006 Plan was calculated based on the simplified method. Under the simplified method, the expected term is equal to the average of an option’s weighted-average vesting period and its contractual term. Pursuant to the Securities and Exchange Commission (“SEC”) Staff Accounting Bulletin (“SAB”) No. 110, the Company is permitted to continue using the simplified method
F-25
Table of Contents
Marin Software Incorporated
Notes to Consolidated Financial Statements
(dollars and share numbers in thousands, except per share data)
until sufficient information regarding exercise behavior, such as historical exercise data or exercise information from external sources, becomes available. The Company estimates the expected volatility of its Common Stock on the date of grant based on the historical stock volatilities of similar publicly-traded entities over a period equal to the expected terms of the options, as the Company does not have any trading history to use the volatility of its own common stock. The Company has no history or expectation of paying cash dividends on its Common Stock. The risk-free interest rate is based on the U.S. Treasury yield for a term consistent with the expected life of the options in effect at the time of grant.
As of December 31, 2011 and September 30, 2012 (unaudited), the Company has deferred the recognition of its excess tax benefit from stock options until it is actually realized.
Cash proceeds from the exercise of stock options were $42, $486, $791, $512 (unaudited) and $1,451 (unaudited) during 2009, 2010 and 2011 and the nine months ended September 30, 2011 and 2012, respectively.
Compensation expense is recognized ratably over the requisite service period. As of December 31, 2011 and September 30, 2012, there was $2,622 and $8,137 (unaudited), respectively, of unrecognized compensation cost related to options, which is expected to be recognized over a weighted-average period of 2.72 and 2.96 years, respectively.
As of December 31, 2011 and September 30, 2012 (unaudited), there were 757 and 3 shares, respectively, available for future stock option grants to employees and directors under the existing plan.
Given the lack of an active public market for the Company’s outstanding Common and Preferred Stock, the Company’s Board of Directors established an estimate of fair value for these securities as well as for options and warrants to purchase these securities. The fair value of the Company’s Common Stock as used in the determination of the exercise price of stock options was estimated by the Board of Directors based on factors such as the liquidation preference, dividends and other rights of the outstanding Preferred Stock; recent financial and operating performance; the status of the Company’s development and sales efforts, revenue growth and additional objectives; the likelihood and proximity of an initial public offering; and the valuation of comparable companies that are publicly traded.
11. Income Taxes
The components of the Company’s loss before provision for income taxes were as follows:
| Years Ended December 31, |
Nine Months Ended September 30, |
|||||||||||||||||||
| 2009 | 2010 | 2011 | 2011 | 2012 | ||||||||||||||||
| (Unaudited) | ||||||||||||||||||||
| United States |
$ | (9,970 | ) | $ | (11,015 | ) | $ | (17,791 | ) | $ | (13,214 | ) | $ | (19,713 | ) | |||||
| Foreign |
365 | 181 | 507 | 350 | 654 | |||||||||||||||
|
|
|
|
|
|
|
|
|
|
|
|||||||||||
| $ | (9,605 | ) | $ | (10,834 | ) | $ | (17,284 | ) | $ | (12,864 | ) | $ | (19,059 | ) | ||||||
|
|
|
|
|
|
|
|
|
|
|
|||||||||||
F-26
Table of Contents
Marin Software Incorporated
Notes to Consolidated Financial Statements
(dollars and share numbers in thousands, except per share data)
The components of the provision for income taxes were as follows:
| Years Ended December 31, |
Nine Months Ended September 30, |
|||||||||||||||||||
| 2009 | 2010 | 2011 | 2011 | 2012 | ||||||||||||||||
| (Unaudited) | ||||||||||||||||||||
| Current income tax provision |
||||||||||||||||||||
| Federal |
$ | — | $ | — | $ | — | $ | — | $ | — | ||||||||||
| State |
1 | — | 8 | 8 | 4 | |||||||||||||||
| Foreign |
102 | 23 | 131 | 88 | 163 | |||||||||||||||
|
|
|
|
|
|
|
|
|
|
|
|||||||||||
| Total current income tax provision |
$ | 103 | $ | 23 | $ | 139 | $ | 96 | $ | 167 | ||||||||||
|
|
|
|
|
|
|
|
|
|
|
|||||||||||
The Company has incurred operating losses and has recorded a full valuation allowance against its deferred tax assets for all periods to date and, accordingly, has not recorded a provision for income taxes for any of the periods presented other than provisions for foreign income taxes.
The differences in the total provision for income taxes that would result from applying the 34% federal statutory rate to loss before provision for income taxes and the reported provision for income taxes were as follows:
| Years Ended December 31, |
Nine Months Ended September 30, |
|||||||||||||||||||
| 2009 | 2010 | 2011 | 2011 | 2012 | ||||||||||||||||
| (Unaudited) | ||||||||||||||||||||
| Tax benefit at U.S. statutory rate |
$ | (3,229 | ) | $ | (3,684 | ) | $ | (5,877 | ) | $ | (4,374 | ) | $ | (6,435 | ) | |||||
| State income taxes, net of federal benefit |
1 | — | 8 | 8 | 4 | |||||||||||||||
| Foreign income and withholding taxes |
(21 | ) | (39 | ) | (41 | ) | (25 | ) | (57 | ) | ||||||||||
| Stock-based compensation |
86 | 472 | 171 | 128 | 305 | |||||||||||||||
| Change in valuation allowance |
3,200 | 3,251 | 5,839 | 4,325 | 6,206 | |||||||||||||||
| Other |
66 | 23 | 39 | 34 | 144 | |||||||||||||||
|
|
|
|
|
|
|
|
|
|
|
|||||||||||
| $ | 103 | $ | 23 | $ | 139 | $ | 96 | $ | 167 | |||||||||||
|
|
|
|
|
|
|
|
|
|
|
|||||||||||
F-27
Table of Contents
Marin Software Incorporated
Notes to Consolidated Financial Statements
(dollars and share numbers in thousands, except per share data)
Major components of the Company’s deferred tax assets (liabilities) as of December 31, 2010 and 2011 are as follows:
| December 31, | ||||||||
| 2010 | 2011 | |||||||
| Accruals and reserves |
$ | 605 | $ | 1,216 | ||||
| Intangibles |
462 | 624 | ||||||
| Stock-based compensation |
— | 41 | ||||||
| Net operating loss |
10,937 | 16,888 | ||||||
| Research and development credits |
101 | 101 | ||||||
| Other |
5 | 27 | ||||||
|
|
|
|
|
|||||
| Total deferred tax assets |
12,110 | 18,897 | ||||||
| Property and equipment |
(92 | ) | (39 | ) | ||||
|
|
|
|
|
|||||
| Total deferred tax liabilities |
(92 | ) | (39 | ) | ||||
|
|
|
|
|
|||||
| Total net deferred tax assets |
12,018 | 18,858 | ||||||
| Valuation allowance |
(12,018 | ) | (18,858 | ) | ||||
|
|
|
|
|
|||||
| Total net deferred tax asset, net of valuation allowance |
$ | — | $ | — | ||||
|
|
|
|
|
|||||
The Internal Revenue Code of 1986, as amended, imposes restrictions on the utilization of net operating losses in the event of an “ownership change” of a corporation. Accordingly, a company’s ability to use net operating losses may be limited as prescribed under Internal Revenue Code Section 382 (“IRC Section 382”). Events which may cause limitations in the amount of the net operating losses that the Company may use in any one year include, but are not limited to, a cumulative ownership change of more than 50% over a three-year period.
Due to the effects of historical equity issuances, the Company has determined that the future utilization of a portion of its net operating losses is limited annually pursuant to IRC Section 382.
As of December 31, 2011, the Company had federal and state net operating losses of approximately $42,450 and $38,100, respectively. The federal net operating loss carryforward will begin expiring in 2026 and the state net operating loss carryforward will begin expiring in 2016.
The Company has recorded a full valuation allowance against its otherwise recognizable deferred income tax assets as of December 31, 2010 and 2011 and September 30, 2012 (unaudited). The Company has determined, after evaluating all positive and negative historical and prospective evidence, that it is more likely than not that these assets will not be realized. The valuation allowance increased by $3,690, $3,814 and $6,840 during the years ended December 31, 2009, 2010 and 2011, respectively.
The Company files U.S. state and foreign income tax returns in jurisdictions with varying statutes of limitations. In the normal course of business, the Company is subject to examination by taxing authorities throughout the world. These audits include questioning the timing and amount of deduction, the nexus of income among various tax jurisdictions and compliance with state, local and foreign tax laws. The Company is not currently under any examination by the U.S. state or foreign tax authorities and the Company is not subject to examination by state and foreign tax authorities for tax years before 2006. As of December 31, 2010 and 2011 and September 30, 2012 (unaudited), the Company did not have any unrecognized tax benefits that if recognized would impact the annual effective tax rate.
F-28
Table of Contents
Marin Software Incorporated
Notes to Consolidated Financial Statements
(dollars and share numbers in thousands, except per share data)
During 2009, 2010, 2011 and the nine months ended September 30, 2012 (unaudited), the Company did not recognize any interest or penalties related to unrecognized tax benefits.
12. Net Loss Per Share and Pro Forma Net Loss Per Share Available to Common Stockholders
Basic net loss per share available to common stockholders is calculated by dividing the net loss available to common stockholders by the weighted-average number of shares of common stock outstanding for the period. Net (loss) income available to common stockholders is calculated using the two class method as net (loss) income less the preferred stock dividend for the period less the amount of net (loss) income, if any, allocated to the preferred stock based on weighted preferred stock outstanding during the period relative to total stock outstanding during the period. As the Company’s convertible preferred stockholders do not have the contractual obligations to share in the losses of the Company, no loss has been allocated to the convertible preferred stockholders in the determination of net loss available to common stockholders. The weighted-average number of shares of common stock used to calculate the Company’s basic net loss per share available to common stockholders excludes those shares subject to repurchase related to unvested common shares and stock options that were exercised prior to vesting as these shares are not deemed to be issued for accounting purposes until they vest. The diluted net loss per share of common stock is computed by dividing the net loss using the weighted-average number of shares of common stock, excluding common stock subject to repurchase, and, if dilutive, potential shares of common stock outstanding during the period. Potential shares of common stock consist of common stock subject to repurchase and stock options to purchase common stock and warrants to purchase convertible preferred stock (using the treasury stock method) and the conversion of the Company’s convertible preferred stock (using the “if converted” method).
The following table presents the calculation of basic and diluted net loss per share:
| Years Ended December 31, |
Nine Months Ended September 30, |
|||||||||||||||||||
| 2009 | 2010 | 2011 | 2011 | 2012 | ||||||||||||||||
| (Unaudited) | ||||||||||||||||||||
| Numerator: |
||||||||||||||||||||
| Net loss |
$ | (9,708 | ) | $ | (10,857 | ) | $ | (17,423 | ) | $ | (12,960 | ) | $ | (19,226 | ) | |||||
| Redemption of preferred stock in connection with Series D financing and deemed dividend |
— | (1,033 | ) | — | — | — | ||||||||||||||
|
|
|
|
|
|
|
|
|
|
|
|||||||||||
| Net loss available to common shareholders |
$ | (9,708 | ) | $ | (11,890 | ) | $ | (17,423 | ) | $ | (12,960 | ) | $ | (19,226 | ) | |||||
| Denominator: |
||||||||||||||||||||
| Weighted average number of shares, basic and diluted |
3,540 | 3,639 | 4,058 | 3,978 | 4,312 | |||||||||||||||
|
|
|
|
|
|
|
|
|
|
|
|||||||||||
| Net loss per share available to common stockholders |
||||||||||||||||||||
| Basic and diluted net loss per common share available to common stockholders |
$ | (2.74 | ) | $ | (3.27 | ) | $ | (4.29 | ) | $ | (3.26 | ) | $ | (4.46 | ) | |||||
|
|
|
|
|
|
|
|
|
|
|
|||||||||||
F-29
Table of Contents
Marin Software Incorporated
Notes to Consolidated Financial Statements
(dollars and share numbers in thousands, except per share data)
The following table presents the potential common shares outstanding that were excluded from the computation of diluted net loss per share available to common stockholders for the periods presented because including them would have been anti-dilutive:
| Years Ended December 31, |
Nine Months Ended September 30, |
|||||||||||||||||||
| 2009 | 2010 | 2011 | 2011 | 2012 | ||||||||||||||||
| (Unaudited) | ||||||||||||||||||||
| Convertible preferred stock |
11,031 | 12,726 | 14,470 | 14,470 | 17,275 | |||||||||||||||
| Options to purchase common stock |
2,295 | 2,486 | 3,000 | 3,106 | 4,274 | |||||||||||||||
| Common stock subject to repurchase |
38 | 261 | 291 | 319 | 309 | |||||||||||||||
| Convertible preferred stock warrants |
51 | 51 | 51 | 51 | 51 | |||||||||||||||
| Common stock warrants |
— | — | 37 | — | 37 | |||||||||||||||
|
|
|
|
|
|
|
|
|
|
|
|||||||||||
| 13,415 | 15,524 | 17,849 | 17,946 | 21,946 | ||||||||||||||||
|
|
|
|
|
|
|
|
|
|
|
|||||||||||
The basic and diluted pro forma net loss per share available to common stockholders information has been computed to give effect to the following:
| Ÿ | the pro forma net loss applied in computing the unaudited pro forma basic and diluted loss per share for the year ended December 31, 2011 and the nine months ended September 30, 2012 is based upon the Company’s historical net loss as adjusted to reflect the elimination of the losses on the change in valuation of the outstanding Series B convertible preferred stock warrants; and |
| Ÿ | the pro forma shares used in computing basic and diluted pro forma net loss per share gives effect to the conversion of the convertible preferred stock (using the if-converted method) into common stock as of the later the beginning of the period or the issuance date, including the conversion of 1,478 shares of Series F-1 Preferred Stock issued in November 2012. |
The basic and diluted pro forma per common share calculations are presented below.
| Year Ended December 31, 2011 |
Nine Months Ended September 30, 2012 |
|||||||
| Basic and diluted pro forma net loss per common share |
||||||||
| Net loss available to common stockholders, as reported |
$ | (17,423 | ) | $ | (19,226 | ) | ||
| Adjustment to other income (expenses), net, related to the change in valuation of Preferred Stock warrants |
73 | 178 | ||||||
|
|
|
|
|
|||||
| Pro forma net loss |
$ | (17,350 | ) | $ | (19,048 | ) | ||
|
|
|
|
|
|||||
| Weighted-average shares used to compute net loss per share available to common stockholders, basic and diluted |
4,058 | 4,312 | ||||||
| Pro forma adjustments to reflect conversion of convertible preferred stock |
14,050 | 18,497 | ||||||
|
|
|
|
|
|||||
| Weighted-average shares used to compute pro forma net loss per share available to common stockholders, basic and diluted |
18,108 | 22,809 | ||||||
|
|
|
|
|
|||||
| Pro forma net loss per share available to common stockholders—basic and diluted |
$ | (0.96 | ) | $ | (0.84 | ) | ||
|
|
|
|
|
|||||
F-30
Table of Contents
Marin Software Incorporated
Notes to Consolidated Financial Statements
(dollars and share numbers in thousands, except per share data)
13. Segment Reporting
The Company defines the term “chief operating decision maker” to be the Chief Executive Officer. The Chief Executive Officer reviews the financial information presented on a consolidated basis for purposes of allocating resources and evaluation of financial performance. Accordingly, the Company has determined that it operates as a single operating segment.
Revenues by geographic area, based on the billing location of the customer, were as follows:
| Years Ended December 31, |
Nine Months Ended September 30, |
|||||||||||||||||||
| 2009 | 2010 | 2011 | 2011 | 2012 | ||||||||||||||||
| (Unaudited) | ||||||||||||||||||||
| United States |
$ | 6,966 | $ | 15,246 | $ | 26,673 | $ | 18,573 | $ | 31,360 | ||||||||||
| International |
561 | 3,759 | 9,448 | 6,138 | 11,147 | |||||||||||||||
|
|
|
|
|
|
|
|
|
|
|
|||||||||||
| Total revenues, net |
$ | 7,527 | $ | 19,005 | $ | 36,121 | $ | 24,711 | $ | 42,507 | ||||||||||
|
|
|
|
|
|
|
|
|
|
|
|||||||||||
Long-lived assets by geographic area were as follows:
| As of December 31, |
As of September 30, |
|||||||||||
| 2010 | 2011 | 2012 | ||||||||||
| (Unaudited) | ||||||||||||
| United States |
$ | 2,939 | $ | 4,663 | $ | 8,212 | ||||||
| International |
174 | 246 | 267 | |||||||||
|
|
|
|
|
|
|
|||||||
| Total long-lived assets, net |
$ | 3,113 | $ | 4,909 | $ | 8,479 | ||||||
|
|
|
|
|
|
|
|||||||
14. Commitments and Contingencies
Operating Leases
Rent expense for 2009, 2010, and 2011 and the nine months ended September 30, 2011 and 2012 was $497, $920, $1,523, $958 (unaudited) and $2,203 (unaudited), respectively.
The Company has leased office space in San Francisco and London under noncancelable operating leases, which expire between December 2014 and January 2015. Additionally, in 2011 the Company entered into annual and month-to-month arrangements to lease office space in New York, Chicago, Hamburg, Stockholm, Paris, Singapore, Sydney and Mountain View, California.
Future minimum lease payments for significant operating leases as of December 31, 2011 were as follows:
| Years Ended |
||||
| 2012 |
$ | 1,645 | ||
| 2013 |
1,441 | |||
| 2014 |
438 | |||
|
|
|
|||
| $ | 3,254 | |||
|
|
|
F-31
Table of Contents
Marin Software Incorporated
Notes to Consolidated Financial Statements
(dollars and share numbers in thousands, except per share data)
After giving effect to the leases entered into subsequent to December 31, 2011 (see Note 16), future minimum lease payments for significant operating leases as of September 30, 2012 were as follows (unaudited):
| Years Ended |
||||
| 2012 |
$ | 1,179 | ||
| 2013 |
4,696 | |||
| 2014 |
5,013 | |||
| 2015 |
1,822 | |||
| 2016 and thereafter |
1,142 | |||
|
|
|
|||
| $ | 13,852 | |||
|
|
|
Legal Matters
From time to time, the Company may be involved in lawsuits, claims, investigations and proceedings, consisting of intellectual property, commercial, employment and other matters, which arise in the ordinary course of business. In accordance with GAAP, the Company records a liability when it is both probable that a liability has been incurred and the amount of the loss can be reasonably estimated. These provisions are reviewed at least quarterly and adjusted to reflect the impact of negotiations, settlements, ruling, advice of legal counsel and other information and events pertaining to a particular case. Litigation is inherently unpredictable. If any unfavorable ruling were to occur in any specific period or if a loss becomes probable and estimable, there exists the possibility of a material adverse impact on the Company’s results of operations, financial position or cash flows.
Indemnification
The Company enters into standard indemnification agreements in the ordinary course of business. Pursuant to the agreements, each party may indemnify, defend and hold the other party harmless with respect to such claim, suit or proceeding brought against it by a third party alleging that the indemnifying party’s intellectual property infringes upon the intellectual property of the third party, or results from a breach of the indemnifying party’s representations and warranties or covenants, or that results from any acts of negligence or willful misconduct. The term of these indemnification agreements is generally perpetual any time after execution of the agreement. The maximum potential amount of future payments the Company could be required to make under these indemnification agreements is unlimited. Historically, the Company has not been obligated to make significant payments for these obligations and no liabilities have been recorded for these obligations on the consolidated balance sheets as of December 31, 2010 and 2011 and September 30, 2012 (unaudited).
The Company also indemnifies its officers and directors for certain events or occurrences, subject to certain limits, while the officer is or was serving at the Company’s request in such capacity. The maximum amount of potential future indemnification is unlimited; however, the Company has a Directors and Officers insurance policy that limits its exposure and enables the Company to recover a portion of any future amounts paid. Historically, the Company has not been obligated to make any payments for these obligations and no liabilities have been recorded for these obligations on the consolidated balance sheets as of December 31, 2010 and 2011 and September 30, 2012 (unaudited).
F-32
Table of Contents
Marin Software Incorporated
Notes to Consolidated Financial Statements
(dollars and share numbers in thousands, except per share data)
Other Contingencies
The Company is subject to claims and assessments from time to time in the ordinary course of business. The Company’s management does not believe that any such matters, individually or in the aggregate, will have a material adverse effect on the Company’s financial position, results of operations or cash flows.
15. Employee Benefit Plans
The Company sponsors a 401(k) defined contribution plan covering all employees in the United States. The Board of Directors determines contributions made by the Company annually. The Company made no contributions under this plan for 2009, 2010, 2011 and the nine months ended September 30, 2012 (unaudited).
16. Subsequent Events
Issuance of Preferred Stock
In January 2012, the Company issued 2,805 shares of Series F Convertible Preferred Stock, $0.001 par value per share, for net proceeds of $34,294. The holders of Series F Stock are entitled to receive noncumulative dividends at the per annum rate of $0.7378 on each outstanding share of Series F Stock, when and if declared by the Board of Directors, pari passu with shares of Series E Preferred Stock and prior and in preference to the payment of any dividend on Series A, Series A-1, Series B, Series C and Series D Preferred Stock (“Junior Preferred Stock”) and Common Stock in such calendar year. The holders of Series F Stock will also be entitled to participate in dividends along with Common Stockholders, voting rights, preferred conversion rights similar to the holders of Series A, Series A-1, Series B, Series C, Series D and Series E Convertible Preferred Stock. In the event of liquidation, the holders of Series F Preferred Stock would be entitled to paid, prior and in preference to any payment to Junior Preferred Stockholders or Common Stockholders.
Concurrent with primary issuance of Series F Stock, the Company also entered into an agreement with certain executives of the company to repurchase certain Common Stock held by them, whereby the Company repurchased 365 shares of their Common Stock in the Company at the Series F Preferred Stock issuance price of $12.30 per share for an aggregate price of $4,488. At the date of the repurchase, the aggregate estimated fair value of the repurchased Common Stock was $1,898. As a result of this arrangement, the Company recorded stock-based compensation expense of $2,590 during the nine months ended September 30, 2012. Of this amount, $364, $317 and $1,909 were recorded as cost sales and marketing, research and development and general and administrative expenses, respectively, in the accompanying statement of comprehensive loss for the nine months ended September 30, 2012.
Option Grants
In February, March, May and June 2012, the Board of Directors granted stock options to purchase 1,521 shares of Common Stock at a weighted average exercise price of $6.81 per share. The stock options generally vest over four years.
Significant New Leases or Changes in Existing Leases
In January 2012, the Company entered into a new lease in Chicago. This lease arrangement is noncancelable and expires in October 2015. In February 2012, the Company entered into a lease for
F-33
Table of Contents
Marin Software Incorporated
Notes to Consolidated Financial Statements
(dollars and share numbers in thousands, except per share data)
an additional floor in the office building in San Francisco. In May 2012, the Company entered into a new lease in New York. Additionally, in 2012 the Company entered into annual and month-to-month arrangements to lease office space in Hamburg, Stockholm, Tokyo and Mountain View, California.
The Company has evaluated, for potential recognition and disclosure, events that occurred after the balance sheet date of December 31, 2011, through June 27, 2012, the date the annual audited consolidated financial statements were available to be issued.
17. Subsequent Events (Unaudited)
Issuance of Preferred Stock
In November 2012, the Company issued 1,478 shares of Series F-1 Convertible Preferred Stock, $0.001 par value per share, for net proceeds of $19,900. The holders of Series F-1 Stock are entitled to receive noncumulative dividends at the per annum rate of $0.8119, on each outstanding share of Series F-1 Stock, when and if declared by the Board of Directors, prior and in preference to the payment of any dividend on Series A, Series A-1, Series B, Series C and Series D Preferred Stock (the “Junior Preferred Stock”) and the Common Stock, and pari passu with the Series E and Series F Preferred Stock (“Senior Preferred Stock”). The holders of Series F-1 Stock will also be entitled to participate in dividends along with holders of Common Stock. In the event of liquidation event, including acquisition or sale of substantially all of the Company’s assets, the holders of Series F-1 Preferred Stock would be entitled to paid, prior and in preference to any payment to holders of Junior Preferred Stock and Common Stock and pari passu with holders of Senior Preferred Stock. The Series F-1 Stock is pari passu with the Senior Preferred Stock with respect to voting rights, conversion rights and other rights and privileges of Senior Preferred Stock.
In December 2012, the Company entered into an amendment to its existing Revolving Credit Facility and Equipment Advance Facility pursuant to which Silicon Valley Bank agreed to increase the Revolving Credit Facility to the lesser of $15,000 or 80% of the Company’s eligible accounts receivable and to extend an additional equipment advance facility of $3,000 (the “Supplemental Equipment Advance”). With respect to the Revolving Credit Facility, the expiration date was extended to July 31, 2014. The Supplemental Equipment Advance may only be used to finance the purchase of equipment. The Supplemental Equipment Advance accrues interest at a fixed per annum rate of 3.0% and will be repayable in 33 consecutive monthly installments of principal and interest. The Supplemental Equipment Advance expires March 1, 2016. In connection with the amendment, the Company issued a warrant to Silicon Valley Bank to purchase 27 shares of common stock at $12.15 per share. This warrant expires in November 2022.
Options Grants
In September and December 2012, the Board of Directors granted stock options to purchase 525 shares of Common Stock at a weighted average exercise price of $9.40 per share. In January 2013, the Board of Directors granted stock options to purchase 963 shares of Common Stock at an exercise price of $12.15 per share. The stock options vest over four years.
The Company has evaluated, for potential recognition and disclosure, events that occurred between October 1, 2012 and December 13, 2012, the date the unaudited interim consolidated financial statements were available to be issued.
F-34
Table of Contents
Shares
Common Stock
| Goldman, Sachs & Co. | Deutsche Bank Securities |
| UBS Investment Bank | Stifel | |
| Wells Fargo Securities | ||
Through and including , 2013 (the 25th day after the date of this prospectus), all dealers effecting transactions in these securities, whether or not participating in this offering, may be required to deliver a prospectus. This is in addition to a dealer’s obligation to deliver a prospectus when acting as an underwriter and with respect to an unsold allotment or subscription.
Table of Contents
PART II
INFORMATION NOT REQUIRED IN PROSPECTUS
Item 13. Other Expenses of Issuance and Distribution.
The following table sets forth all costs and expenses, other than underwriting discounts and commissions, paid or payable by us in connection with the sale of the common stock being registered. All amounts shown are estimates except for the SEC registration fee and the FINRA filing fee:
| Amount Paid or to be Paid |
||||
| SEC registration fee |
$ | 10,230 | ||
| FINRA filing fee |
13,438 | |||
| New York Stock Exchange listing fee |
* | |||
| Blue sky qualification fees and expenses |
* | |||
| Printing and engraving expenses |
* | |||
| Legal fees and expenses |
* | |||
| Accounting fees and expenses |
* | |||
| Transfer agent and registrar fees and expenses |
* | |||
| Miscellaneous expenses |
* | |||
|
|
|
|||
| Total |
$ | * | ||
|
|
|
|||
| * | To be completed by amendment. |
Item 14. Indemnification of Directors and Officers.
Section 145 of the Delaware General Corporation Law authorizes a court to award, or a corporation’s board of directors to grant, indemnity to directors and officers under certain circumstances and subject to certain limitations. The terms of Section 145 of the Delaware General Corporation Law are sufficiently broad to permit indemnification under certain circumstances for liabilities, including reimbursement of expenses incurred, arising under the Securities Act of 1933, as amended (the “Securities Act”).
As permitted by the Delaware General Corporation Law, the Registrant’s restated certificate of incorporation to be effective upon the closing of this offering contains provisions that eliminate the personal liability of its directors for monetary damages for any breach of fiduciary duties as a director, except liability for the following:
| Ÿ | any breach of the director’s duty of loyalty to the Registrant or its stockholders; |
| Ÿ | acts or omissions not in good faith or that involve intentional misconduct or a knowing violation of law; |
| Ÿ | under Section 174 of the Delaware General Corporation Law (regarding unlawful dividends and stock purchases); or |
| Ÿ | any transaction from which the director derived an improper personal benefit. |
As permitted by the Delaware General Corporation Law, the Registrant’s restated bylaws to be effective upon the closing of this offering, provide that:
| Ÿ | the Registrant is required to indemnify its directors and executive officers to the fullest extent permitted by the Delaware General Corporation Law, subject to very limited exceptions; |
II-1
Table of Contents
| Ÿ | the Registrant may indemnify its other employees and agents as set forth in the Delaware General Corporation Law; |
| Ÿ | the Registrant is required to advance expenses, as incurred, to its directors and executive officers in connection with a legal proceeding to the fullest extent permitted by the Delaware General Corporation Law, subject to very limited exceptions; and |
| Ÿ | the rights conferred in the bylaws are not exclusive. |
Prior to the closing of this offering, the Registrant has entered into indemnification agreements with each of its current directors and executive officers to provide these directors and executive officers additional contractual assurances regarding the scope of the indemnification set forth in the Registrant’s restated certificate of incorporation and restated bylaws and to provide additional procedural protections. There is no pending litigation or proceeding involving a director or executive officer of the Registrant for which indemnification is sought. Reference is also made to Section 9 of the underwriting agreement to be filed as Exhibit 1.1 to this registration statement, which provides for the indemnification of executive officers, directors and controlling persons of the Registrant against certain liabilities. The indemnification provisions in the Registrant’s restated certificate of incorporation, restated bylaws and the indemnification agreements entered into or to be entered into between the Registrant and each of its directors and executive officers may be sufficiently broad to permit indemnification of the Registrant’s directors and executive officers for liabilities arising under the Securities Act.
The Registrant currently carries liability insurance for its directors and officers.
Reference is made to the following documents filed as exhibits to this Registration Statement regarding relevant indemnification provisions described above and elsewhere herein:
| Exhibit Document |
Number | |||
| Form of Underwriting Agreement. |
1.1 | |||
| Form of Restated Certificate of Incorporation to be effective upon the closing of this offering. |
3.2 | |||
| Form of Restated Bylaws to be effective upon the closing of this offering. |
3.4 | |||
| Amended and Restated Investors Rights Agreement dated January 25, 2012 among the Registrant and certain of its stockholders, as amended. |
4.2 | |||
| Form of Indemnification Agreement. |
10.1 | |||
Item 15. Recent Sales of Unregistered Securities.
Since February 1, 2010 and through January 31, 2013, the Registrant has issued and sold the following securities:
1. Since February 1, 2010 and through January 31, 2013, the Registrant has granted to its directors, officers, employees and consultants options to purchase 5,363,393 shares of common stock under its 2006 Equity Incentive Plan with per share exercise prices ranging from $0.8246 to $12.15, and has issued 619,795 shares of common stock upon exercise of such options. These transactions were exempt from the registration requirements of the Securities Act in reliance upon Rule 701 promulgated under the Securities Act, Section 4(2) of the Securities Act or Regulation D promulgated under the Securities Act.
2. In May 2010, the Registrant sold an aggregate of 2,022,239 shares of the Registrant’s Series D convertible preferred stock at a purchase price of $5.5351 per share for an aggregate purchase price of $11.2 million to 23 purchasers that represented to us that they were sophisticated
II-2
Table of Contents
accredited investors and qualified institutional buyers. This transaction was exempt from the registration requirements of the Securities Act in reliance upon Regulation D promulgated under the Securities Act.
3. In March and April 2011, the Registrant sold an aggregate of 1,743,940 shares of the Registrant’s Series E convertible preferred stock at a purchase price of $9.1949 per share for an aggregate purchase price of $16.0 million to 29 purchasers that represented to us that they were sophisticated accredited investors and qualified institutional buyers. This transaction was exempt from the registration requirements of the Securities Act in reliance upon Regulation D promulgated under the Securities Act.
4. In October 2011, the Registrant issued a warrant to purchase 57,378 shares of the Registrant’s common stock to a consultant that represented to us that it was an accredited investor with an exercise price of $2.70 per share. The consultant exercised this warrant in full for cash that same month. This transaction was exemption from the registration requirements of the Securities Act in reliance upon Section 4(2) of the Securities Act.
5. In December 2011, the Registrant issued a warrant to purchase 36,900 shares of the Registrant’s common stock to a lender of the Registrant with an exercise price of $2.70 per share. This transaction was exemption from the registration requirements of the Securities Act in reliance upon Section 4(2) of the Securities Act.
6. In January 2012, the Registrant sold an aggregate of 2,804,788 shares of the Registrant’s Series F convertible preferred stock at a purchase price of $12.2962 per share for an aggregate purchase price of $34.5 million to 30 purchasers that represented to us that they were sophisticated accredited investors and qualified institutional buyers. This transaction was exempt from the registration requirements of the Securities Act in reliance upon Regulation D or Regulation S promulgated under the Securities Act.
7. In November 2012, the Registrant sold an aggregate of 1,478,064 shares of the Registrant’s Series F-1 convertible preferred stock at a purchase price of $13.5312 per share for an aggregate purchase price of $20.0 million to 33 purchasers that represented to us that they were sophisticated accredited investors and qualified institutional buyers. This transaction was exempt from the registration requirements of the Securities Act in reliance upon Section 4(2) of the Securities Act or Regulation S promulgated under the Securities Act.
None of the foregoing transactions involved any underwriters, underwriting discounts or commissions, or any public offering, and the Registrant believes each transaction was exempt from the registration requirements of the Securities Act as stated above. All recipients of the foregoing transactions either received adequate information about the Registrant or had access, through their relationships with the Registrant, to such information. Furthermore, the Registrant affixed appropriate legends to the share certificates and instruments issued in each foregoing transaction setting forth that the securities had not been registered and the applicable restrictions on transfer.
II-3
Table of Contents
Item 16. Exhibits and Financial Statement Schedules.
(a) Exhibits.
| Exhibit Number |
Description of Document | |
| 1.1† | Form of Underwriting Agreement. | |
| 3.1 | Restated Certificate of Incorporation. | |
| 3.2† | Form of Restated Certificate of Incorporation to be effective upon closing of this offering. | |
| 3.3 | Bylaws, as currently in effect. | |
| 3.4† | Form of Restated Bylaws to be effective upon closing of this offering. | |
| 4.1† | Form of Common Stock Certificate. | |
| 4.2 | Amended and Restated Investors’ Rights Agreement, dated as of January 25, 2012, by and among the Registrant and certain of its stockholders, as amended. | |
| 5.1† | Opinion of Fenwick & West LLP. | |
| 10.1† | Form of Indemnification Agreement. | |
| 10.2 | 2006 Equity Incentive Plan and forms of stock option agreement and stock option exercise agreement. | |
| 10.3† | 2013 Equity Incentive Plan and forms of stock option award agreement, stock option exercise agreement, restricted stock agreement, stock appreciation right award agreement, restricted stock unit award agreement, performance shares award agreement and stock bonus agreement. | |
| 10.4† | 2013 Employee Stock Purchase Plan and form of subscription agreement. | |
| 10.5 | Offer Letter, dated as of June 15, 2006, by and between the Registrant and Joseph Chang. | |
| 10.6 | Office Lease, dated as of January 7, 2011, by and between the Registrant and 123 Mission, LLC. | |
| 10.7 | Master Services Agreement, dated as of August 3, 2009, by and between the Registrant and Switch Communications Group L.L.C. | |
| 10.8 | Amended and Restated Loan and Security Agreement, dated as of December 9, 2011, by and among the Registrant, Marin Software Limited and Silicon Valley Bank, as amended. | |
| 21.1 | Subsidiaries of the Registrant. | |
| 23.1 | Consent of Independent Registered Public Accounting Firm. | |
| 23.2† | Consent of Fenwick & West LLP (included in Exhibit 5.1). | |
| 24.1 | Power of Attorney. Reference is made to the signature page hereto. | |
| † | To be filed by amendment. |
(b) Financial Statement Schedule.
No financial statement schedules are provided because the information called for is not required or is shown either in the financial statements or notes.
Item 17. Undertakings.
The undersigned registrant hereby undertakes to provide to the underwriters at the closing specified in the underwriting agreement certificates in such denominations and registered in such names as required by the underwriters to permit prompt delivery to each purchaser.
II-4
Table of Contents
Insofar as indemnification for liabilities arising under the Securities Act of 1933 may be permitted to directors, officers and controlling persons of the registrant pursuant to the foregoing provisions, or otherwise, the registrant has been advised that in the opinion of the Securities and Exchange Commission such indemnification is against public policy as expressed in the Act and is, therefore, unenforceable. In the event that a claim for indemnification against such liabilities (other than the payment by the registrant of expenses incurred or paid by a director, officer or controlling person of the registrant in the successful defense of any action, suit or proceeding) is asserted by such director, officer or controlling person in connection with the securities being registered, the registrant will, unless in the opinion of its counsel the matter has been settled by controlling precedent, submit to a court of appropriate jurisdiction the question whether such indemnification by it is against public policy as expressed in the Act and will be governed by the final adjudication of such issue.
The undersigned Registrant hereby undertakes that:
(1) For purposes of determining any liability under the Securities Act of 1933, the information omitted from the form of prospectus filed as part of this registration statement in reliance upon Rule 430A and contained in a form of prospectus filed by the registrant pursuant to Rule 424(b)(1) or (4) or 497(h) under the Securities Act shall be deemed to be part of this registration statement as of the time it was declared effective.
(2) For the purpose of determining any liability under the Securities Act of 1933, each post-effective amendment that contains a form of prospectus shall be deemed to be a new registration statement relating to the securities offered therein, and the offering of such securities at that time shall be deemed to be the initial bona fide offering thereof.
II-5
Table of Contents
SIGNATURES
Pursuant to the requirements of the Securities Act of 1933, the Registrant has duly caused this Registration Statement to be signed on its behalf by the undersigned, thereunto duly authorized, in the City of San Francisco, State of California, on this 13th day of February, 2013.
| MARIN SOFTWARE INCORPORATED | ||||
| By: |
/s/ Christopher A. Lien | |||
| Christopher A. Lien Founder, Chief Executive Officer and Director | ||||
KNOW ALL BY THESE PRESENTS, that each person whose signature appears below constitutes and appoints Christopher Lien and John A. Kaelle, and each of them, as his true and lawful attorneys-in-fact and agents, each with the full power of substitution, for him and in his name, place or stead, in any and all capacities, to sign any and all amendments to this registration statement (including post-effective amendments), and to sign any registration statement for the same offering covered by this registration statement that is to be effective upon filing pursuant to Rule 462(b) promulgated under the Securities Act, and all post-effective amendments thereto, and to file the same, with exhibits thereto and other documents in connection therewith, with the Securities and Exchange Commission, granting unto said attorneys-in-fact and agents, and each of them, full power and authority to do and perform each and every act and thing requisite and necessary to be done in and about the premises, as fully to all intents and purposes as he might or could do in person, hereby ratifying and confirming all that said attorneys-in-fact and agents, or their or his substitute or substitutes, may lawfully do or cause to be done by virtue hereof.
Pursuant to the requirements of the Securities Act of 1933, this Registration Statement has been signed by the following persons in the capacities and on the dates indicated.
| Signature |
Title |
Date | ||
| /s/ Christopher A. Lien Christopher A. Lien |
Founder, Chief Executive Officer and Director (Principal Executive Officer) |
February 13, 2013 | ||
| /s/ John A. Kaelle John A. Kaelle |
Chief Financial Officer (Principal Financial Officer and Principal Accounting Officer) |
February 13, 2013 | ||
| /s/ Paul R. Auvil III Paul R. Auvil III |
Director |
February 13, 2013 | ||
| /s/ L. Gordon Crovitz L. Gordon Crovitz |
Director |
February 13, 2013 | ||
| /s/ Bruce W. Dunlevie Bruce W. Dunlevie |
Director |
February 13, 2013 | ||
| /s/ Donald P. Hutchison Donald P. Hutchison |
Director |
February 13, 2013 | ||
II-6
Table of Contents
EXHIBIT INDEX
| Exhibit Number |
Description of Document | |
| 1.1† | Form of Underwriting Agreement. | |
| 3.1 | Restated Certificate of Incorporation. | |
| 3.2† | Form of Restated Certificate of Incorporation to be effective upon closing of this offering. | |
| 3.3 | Bylaws, as currently in effect. | |
| 3.4† | Form of Restated Bylaws to be effective upon closing of this offering. | |
| 4.1† | Form of Common Stock Certificate. | |
| 4.2 | Amended and Restated Investors’ Rights Agreement, dated as of January 25, 2012, by and among the Registrant and certain of its stockholders, as amended. | |
| 5.1† | Opinion of Fenwick & West LLP. | |
| 10.1† | Form of Indemnification Agreement. | |
| 10.2 | 2006 Equity Incentive Plan and forms of stock option agreement and stock option exercise agreement. | |
| 10.3† | 2013 Equity Incentive Plan and forms of stock option award agreement, stock option exercise agreement, restricted stock agreement, stock appreciation right award agreement, restricted stock unit award agreement, performance shares award agreement and stock bonus agreement. | |
| 10.4† | 2013 Employee Stock Purchase Plan and form of subscription agreement. | |
| 10.5 | Offer Letter, dated as of June 15, 2006, by and between the Registrant and Joseph Chang. | |
| 10.6 | Office Lease, dated as of January 7, 2011, by and between the Registrant and 123 Mission, LLC. | |
| 10.7 | Master Services Agreement, dated as of August 3, 2009, by and between the Registrant and Switch Communications Group L.L.C. | |
| 10.8 | Amended and Restated Loan and Security Agreement, dated as of December 9, 2011, by and among the Registrant, Marin Software Limited and Silicon Valley Bank, as amended. | |
| 21.1 | Subsidiaries of the Registrant. | |
| 23.1 | Consent of Independent Registered Public Accounting Firm. | |
| 23.2† | Consent of Fenwick & West LLP (included in Exhibit 5.1). | |
| 24.1 | Power of Attorney. Reference is made to the signature page hereto. | |
| † | To be filed by amendment. |