Attached files
| file | filename |
|---|---|
| EX-99.1 - EXHIBIT 99.1 - AMERICAN CAMPUS COMMUNITIES INC | a50562281_ex991.htm |
| 8-K - AMERICAN CAMPUS COMMUNITIES, INC. 8-K - AMERICAN CAMPUS COMMUNITIES INC | a50562281.htm |
Exhibit 99.2
Supplemental Analyst Package 4Q-2012 February 12, 2013 BRINGING QUALITY TOGETHER AMERICAN CAMPUS COMMUNITIES 20 YEARS
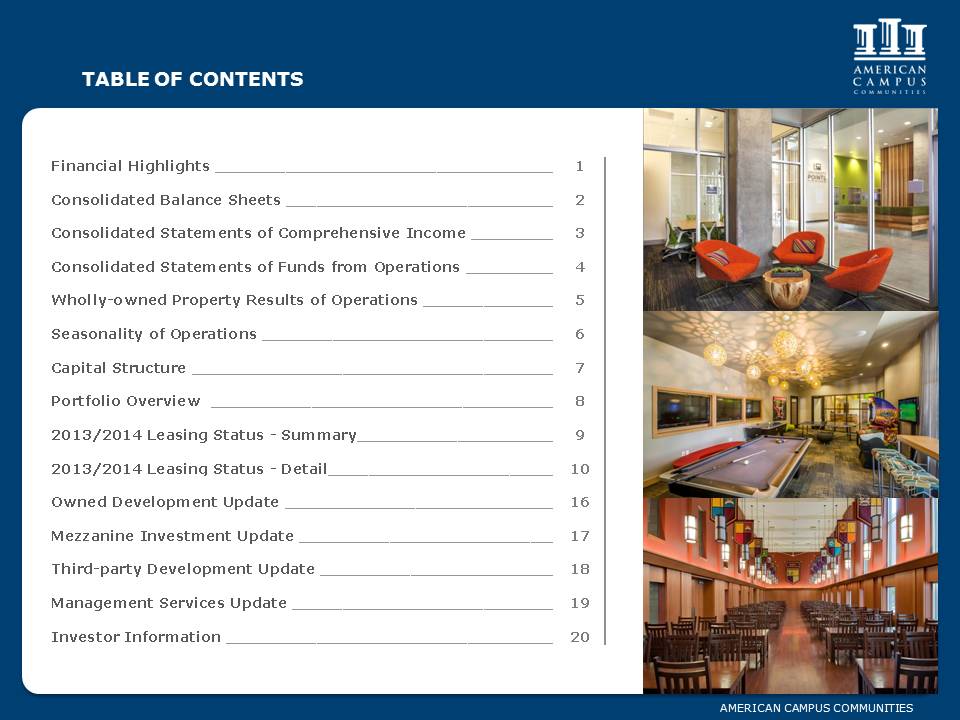
AMERICAN CAMPUS COMMUNITIES TABLE OF CONTENTS Financial Highlights 1 Consolidated Balance Sheets 2 Consolidated Statements of Comprehensive Income 3 Consolidated Statements of Funds from Operations 4 Wholly-owned Property Results of Operations 5 Seasonality of Operations 6 Capital Structure 7 Portfolio Overview 8 2013/2014 Leasing Status – Summary 9 2013/2014 Leasing Status – Detail 10 Owned Development Update 16 Mezzanine Investment Update 17 Third-party Development Update 18 Management Services Update 19 Investor Information 20
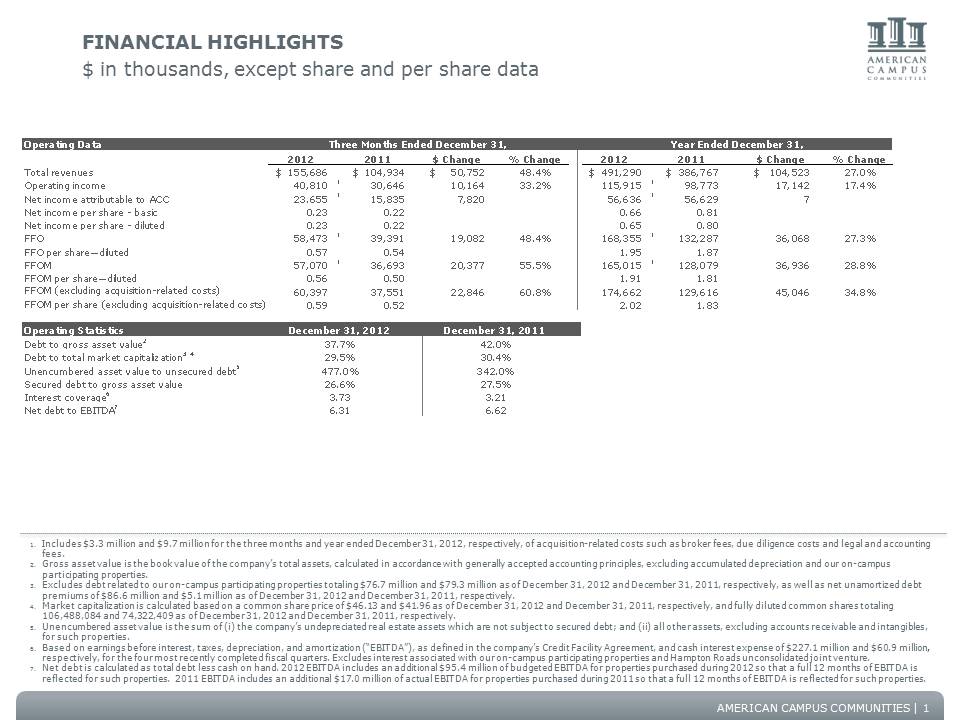
AMERICAN CAMPUS COMMUNITIES FINANCIAL HIGHLIGHTS $ in thousands, except share and per share data 1. Includes $3.3 million and $9.7 million for the three months and year ended December 31, 2012, respectively, of acquisition-related costs such as broker fees, due diligence costs and legal and accounting fees. 2. Gross asset value is the book value of the company’s total assets, calculated in accordance with generally accepted accounting principles, excluding accumulated depreciation and our on-campus participating properties. 3. Excludes debt related to our on-campus participating properties totaling $76.7 million and $79.3 million as of December 31, 2012 and December 31, 2011, respectively, as well as net unamortized debt premiums of $86.6 million and $5.1 million as of December 31, 2012 and December 31, 2011, respectively. 4. Market capitalization is calculated based on a common share price of $46.13 and $41.96 as of December 31, 2012 and December 31, 2011, respectively, and fully diluted common shares totaling 106,488,084 and 74,322,409 as of December 31, 2012 and December 31, 2011, respectively. 5. Unencumbered asset value is the sum of (i) the company’s undepreciated real estate assets which are not subject to secured debt; and (ii) all other assets, excluding accounts receivable and intangibles, for such properties. 6. Based on earnings before interest, taxes, depreciation, and amortization (“EBITDA”), as defined in the company’s Credit Facility Agreement, and cash interest expense of $227.1 million and $60.9 million, respectively, for the four most recently completed fiscal quarters. Excludes interest associated with our on-campus participating properties and Hampton Roads unconsolidated joint venture. 7. Net debt is calculated as total debt less cash on hand. 2012 EBITDA includes an additional $95.4 million of budgeted EBITDA for properties purchased during 2012 so that a full 12 months of EBITDA is reflected for such properties. 2011 EBITDA includes an additional $17.0 million of actual EBITDA for properties purchased during 2011 so that a full 12 months of EBITDA is reflected for such properties. 1 Operating Data 2012 2011 $ Change % Change 2012 2011 $ Change % Change Total revenues 155,686 $ 104,934 $ 50,752 $ 48.4% 491,290 $ 386,767 $ 104,523 $ 27.0% Operating income 40,810 1 30,646 10,164 33.2% 115,915 1 98,773 17,142 17.4% Net income attributable to ACC 23,655 1 15,835 7,820 56,636 1 56,629 7 Net income per share - basic 0.23 0.22 0.66 0.81 Net income per share - diluted 0.23 0.22 0.65 0.80 FFO 58,473 1 39,391 19,082 48.4% 168,355 1 132,287 36,068 27.3% FFO per share—diluted 0.57 0.54 1.95 1.87 FFOM 57,070 1 36,693 20,377 55.5% 165,015 1 128,079 36,936 28.8% FFOM per share—diluted 0.56 0.50 1.91 1.81 FFOM (excluding acquisition-related costs) 60,397 37,551 22,846 60.8% 174,662 129,616 45,046 34.8% FFOM per share (excluding acquisition-related costs) 0.59 0.52 2.02 1.83 Operating Statistics Debt to gross asset value2 Debt to total market capitalization3 4 Unencumbered asset value to unsecured debt5 Secured debt to gross asset value Interest coverage6 Net debt to EBITDA7 6.62 Year Ended December 31, December 31, 2012 29.5% 3.73 December 31, 2011 30.4% 3.21 Three Months Ended December 31, 42.0% 37.7% 6.31 477.0% 26.6% 342.0% 27.5%
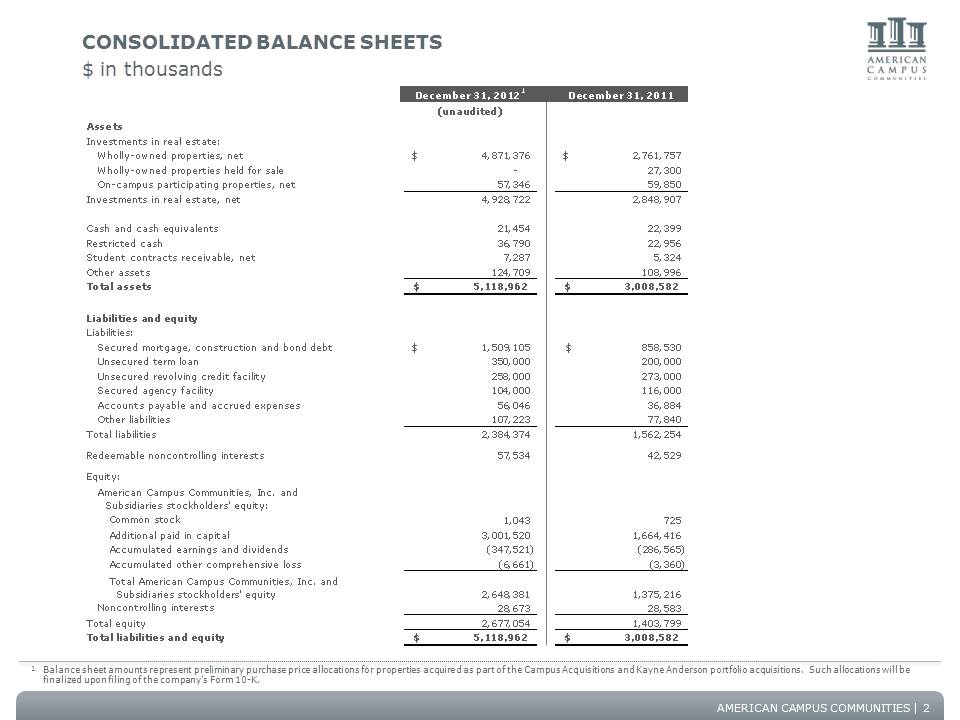
AMERICAN CAMPUS COMMUNITIES CONSOLIDATED BALANCE SHEETS $ in thousands December 31, 20121 December 31, 2011 (unaudited) Assets Investments in real estate: Wholly-owned properties, net 4,871,376 $ 2,761,757 $ Wholly-owned properties held for sale - 27,300 On-campus participating properties, net 57,346 59,850 Investments in real estate, net 4,928,722 2,848,907 Cash and cash equivalents 21,454 22,399 Restricted cash 36,790 22,956 Student contracts receivable, net 7,287 5,324 Other assets 124,709 108,996 Total assets 5,118,962 $ 3,008,582 $ Liabilities and equity Liabilities: Secured mortgage, construction and bond debt 1,509,105 $ 858,530 $ Unsecured term loan 350,000 200,000 Unsecured revolving credit facility 258,000 273,000 Secured agency facility 104,000 116,000 Accounts payable and accrued expenses 56,046 36,884 Other liabilities 107,223 77,840 Total liabilities 2,384,374 1,562,254 Redeemable noncontrolling interests 57,534 42,529 Equity: American Campus Communities, Inc. and Subsidiaries stockholders' equity: Common stock 1,043 725 Additional paid in capital 3,001,520 1,664,416 Accumulated earnings and dividends (347,521) (286,565) Accumulated other comprehensive loss (6,661) (3,360) 2,648,381 1,375,216 Noncontrolling interests 28,673 28,583 Total equity 2,677,054 1,403,799 Total liabilities and equity 5,118,962 $ 3,008,582 $ Total American Campus Communities, Inc. and Subsidiaries stockholders' equity 2 1. Balance sheet amounts represent preliminary purchase price allocations for properties acquired as part of the Campus Acquisitions and Kayne Anderson portfolio acquisitions. Such allocations will be finalized upon filing of the company’s Form 10-K.
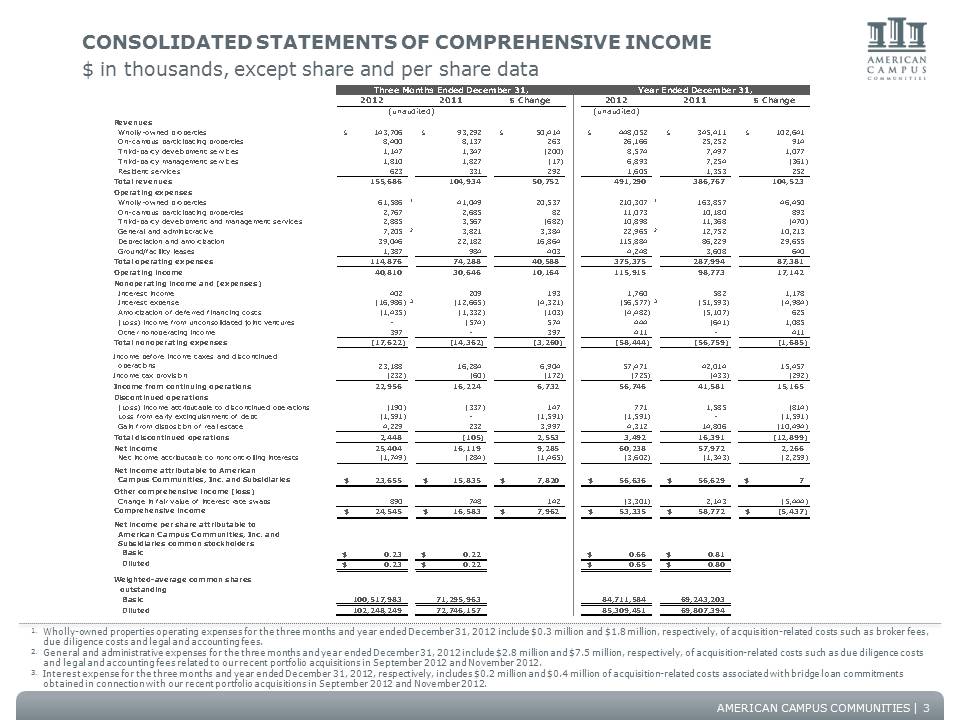
AMERICAN CAMPUS COMMUNITIES CONSOLIDATED STATEMENTS OF COMPREHENSIVE INCOME $ in thousands, except share and per share data 3 2012 2011 $ Change 2012 2011 $ Change (unaudited) Revenues Wholly-owned properties 143,706 $ 93,292 $ 50,414 $ 448,052 $ 345,411 $ 102,641 $ On-campus participating properties 8,400 8,137 263 26,166 25,252 914 Third-party development services 1,147 1,347 (200) 8,574 7,497 1,077 Third-party management services 1,810 1,827 (17) 6,893 7,254 (361) Resident services 623 331 292 1,605 1,353 252 Total revenues 155,686 104,934 50,752 491,290 386,767 104,523 Operating expenses Wholly-owned properties 61,586 1 41,049 20,537 210,307 1 163,857 46,450 On-campus participating properties 2,767 2,685 82 11,073 10,180 893 Third-party development and management services 2,885 3,567 (682) 10,898 11,368 (470) General and administrative 7,205 2 3,821 3,384 22,965 2 12,752 10,213 Depreciation and amortization 39,046 22,182 16,864 115,884 86,229 29,655 Ground/facility leases 1,387 984 403 4,248 3,608 640 Total operating expenses 114,876 74,288 40,588 375,375 287,994 87,381 Operating income 40,810 30,646 10,164 115,915 98,773 17,142 Nonoperating income and (expenses) Interest income 402 209 193 1,760 582 1,178 Interest expense (16,986) 3 (12,665) (4,321) (56,577) 3 (51,593) (4,984) Amortization of deferred financing costs (1,435) (1,332) (103) (4,482) (5,107) 625 (Loss) income from unconsolidated joint ventures - (574) 574 444 (641) 1,085 Other nonoperating income 397 - 397 411 – 411 Total nonoperating expenses (17,622) (14,362) (3,260) (58,444) (56,759) (1,685) Income before income taxes and discontinued operations 23,188 16,284 6,904 57,471 42,014 15,457 Income tax provision (232) (60) (172) (725) (433) (292) Income from continuing operations 22,956 16,224 6,732 56,746 41,581 15,165 Discontinued operations (Loss) income attributable to discontinued operations (190) (337) 147 771 1,585 (814) Loss from early extinguishment of debt (1,591) - (1,591) (1,591) - (1,591) Gain from disposition of real estate 4,229 232 3,997 4,312 14,806 (10,494) Total discontinued operations 2,448 (105) 2,553 3,492 16,391 (12,899) Net income 25,404 16,119 9,285 60,238 57,972 2,266 Net income attributable to noncontrolling interests (1,749) (284) (1,465) (3,602) (1,343) (2,259) Net income attributable to American Campus Communities, Inc. and Subsidiaries 23,655 $ 15,835 $ 7,820 $ 56,636 $ 56,629 $ 7 $ Other comprehensive income (loss) Change in fair value of interest rate swaps 890 748 142 (3,301) 2,143 (5,444) Comprehensive income 24,545 $ 16,583 $ 7,962 $ 53,335 $ 58,772 $ (5,437) $ Net income per share attributable to American Campus Communities, Inc. and Subsidiaries common stockholders Basic 0.23 $ 0.22 $ 0.66 $ 0.81 $ Diluted 0.23 $ 0.22 $ 0.65 $ 0.80 $ Weighted-average common shares outstanding Basic 100,517,983 71,295,963 84,711,584 69,243,203 Diluted 102,248,249 72,746,157 85,309,451 69,807,394 Three Months Ended December 31, (unaudited) Year Ended December 31, 1. Wholly-owned properties operating expenses for the three months and year ended December 31, 2012 include $0.3 million and $1.8 million, respectively, of acquisition-related costs such as broker fees, due diligence costs and legal and accounting fees. 2. General and administrative expenses for the three months and year ended December 31, 2012 include $2.8 million and $7.5 million, respectively, of acquisition-related costs such as due diligence costs and legal and accounting fees related to our recent portfolio acquisitions in September 2012 and November 2012. 3. Interest expense for the three months and year ended December 31, 2012, respectively, includes $0.2 million and $0.4 million of acquisition-related costs associated with bridge loan commitments obtained in connection with our recent portfolio acquisitions in September 2012 and November 2012.
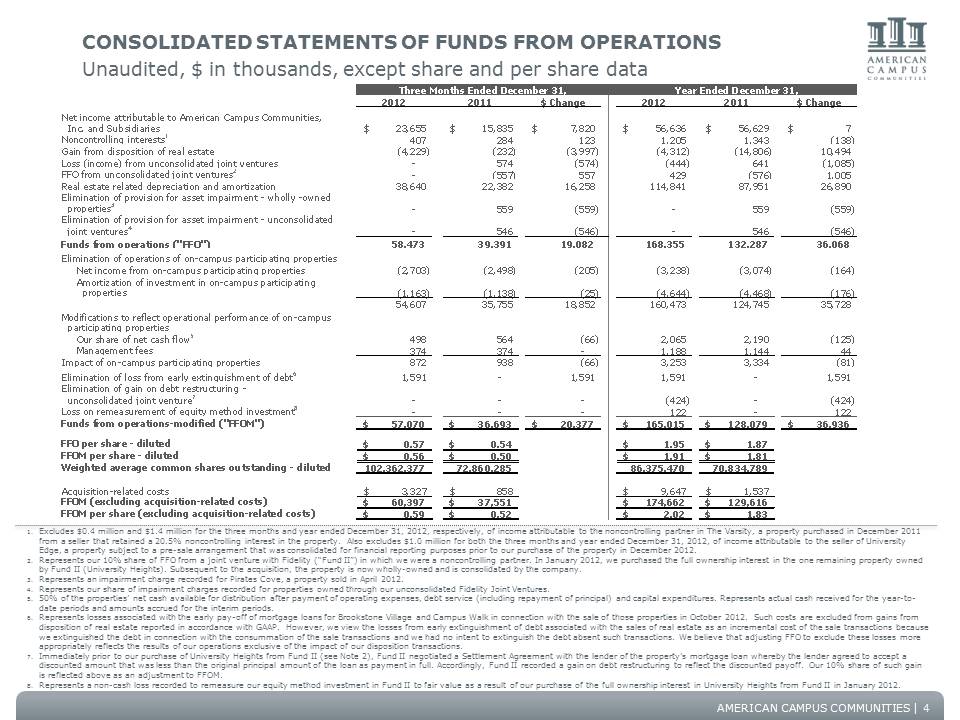
AMERICAN CAMPUS COMMUNITIES CONSOLIDATED STATEMENTS OF FUNDS FROM OPERATIONS Unaudited, $ in thousands, except share and per share data 1. Excludes $0.4 million and $1.4 million for the three months and year ended December 31, 2012, respectively, of income attributable to the noncontrolling partner in The Varsity, a property purchased in December 2011 from a seller that retained a 20.5% noncontrolling interest in the property. Also excludes $1.0 million for both the three months and year ended December 31, 2012, of income attributable to the seller of University Edge, a property subject to a pre-sale arrangement that was consolidated for financial reporting purposes prior to our purchase of the property in December 2012. 2. Represents our 10% share of FFO from a joint venture with Fidelity (“Fund II”) in which we were a noncontrolling partner. In January 2012, we purchased the full ownership interest in the one remaining property owned by Fund II (University Heights). Subsequent to the acquisition, the property is now wholly-owned and is consolidated by the company. 3. Represents an impairment charge recorded for Pirates Cove, a property sold in April 2012. 4. Represents our share of impairment charges recorded for properties owned through our unconsolidated Fidelity Joint Ventures. 5. 50% of the properties’ net cash available for distribution after payment of operating expenses, debt service (including repayment of principal) and capital expenditures. Represents actual cash received for the year-todate periods and amounts accrued for the interim periods. 6. Represents losses associated with the early pay-off of mortgage loans for Brookstone Village and Campus Walk in connection with the sale of those properties in October 2012. Such costs are excluded from gains from disposition of real estate reported in accordance with GAAP. However, we view the losses from early extinguishment of debt associated with the sales of real estate as an incremental cost of the sale transactions because we extinguished the debt in connection with the consummation of the sale transactions and we had no intent to extinguish the debt absent such transactions. We believe that adjusting FFO to exclude these losses more appropriately reflects the results of our operations exclusive of the impact of our disposition transactions. 7. Immediately prior to our purchase of University Heights from Fund II (see Note 2), Fund II negotiated a Settlement Agreement with the lender of the property’s mortgage loan whereby the lender agreed to accept a discounted amount that was less than the original principal amount of the loan as payment in full. Accordingly, Fund II recorded a gain on debt restructuring to reflect the discounted payoff. Our 10% share of such gain is reflected above as an adjustment to FFOM. 8. Represents a non-cash loss recorded to remeasure our equity method investment in Fund II to fair value as a result of our purchase of the full ownership interest in University Heights from Fund II in January 2012. 4 2012 2011 $ Change 2012 2011 $ Change Net income attributable to American Campus Communities, Inc. and Subsidiaries 23,655 $ 15,835 $ 7,820 $ 56,636 $ 56,629 $ 7 $ Noncontrolling interests1 407 284 123 1,205 1,343 (138) Gain from disposition of real estate (4,229) (232) (3,997) (4,312) (14,806) 10,494 Loss (income) from unconsolidated joint ventures - 574 (574) (444) 641 (1,085) FFO from unconsolidated joint ventures2 - (557) 557 429 (576) 1,005 Real estate related depreciation and amortization 38,640 22,382 16,258 114,841 87,951 26,890 Elimination of provision for asset impairment - wholly –owned properties3 - 559 (559) - 559 (559) Elimination of provision for asset impairment – unconsolidated joint ventures4 - 546 (546) - 546 (546) Funds from operations ("FFO") 58,473 39,391 19,082 168,355 132,287 36,068 Elimination of operations of on-campus participating properties Net income from on-campus participating properties (2,703) (2,498) (205) (3,238) (3,074) (164) Amortization of investment in on-campus participating properties (1,163) (1,138) (25) (4,644) (4,468) (176) 54,607 35,755 18,852 160,473 124,745 35,728 Modifications to reflect operational performance of on-campus participating properties Our share of net cash flow5 498 564 (66) 2,065 2,190 (125) Management fees 374 374 - 1,188 1,144 44 Impact of on-campus participating properties 872 938 (66) 3,253 3,334 (81) Elimination of loss from early extinguishment of debt6 1,591 - 1,591 1,591 - 1,591 Elimination of gain on debt restructuring - unconsolidated joint venture7 - - - (424) - (424) Loss on remeasurement of equity method investment8 - - - 122 – 122 Funds from operations-modified ("FFOM") 57,070 $ 36,693 $ 20,377 $ 165,015 $ 128,079 $ 36,936 $ FFO per share - diluted 0.57 $ 0.54 $ 1.95 $ 1.87 $ FFOM per share - diluted 0.56 $ 0.50 $ 1.91 $ 1.81 $ Weighted average common shares outstanding - diluted 102,362,377 72,860,285 86,375,470 70,834,789 Acquisition-related costs 3,327 $ 858 $ 9,647 $ 1,537 $ FFOM (excluding acquisition-related costs) 60,397 $ 37,551 $ 174,662 $ 129,616 $ FFOM per share (excluding acquisition-related costs) 0.59 $ 0.52 $ 2.02 $ 1.83 $ Year Ended December 31, Three Months Ended December 31,
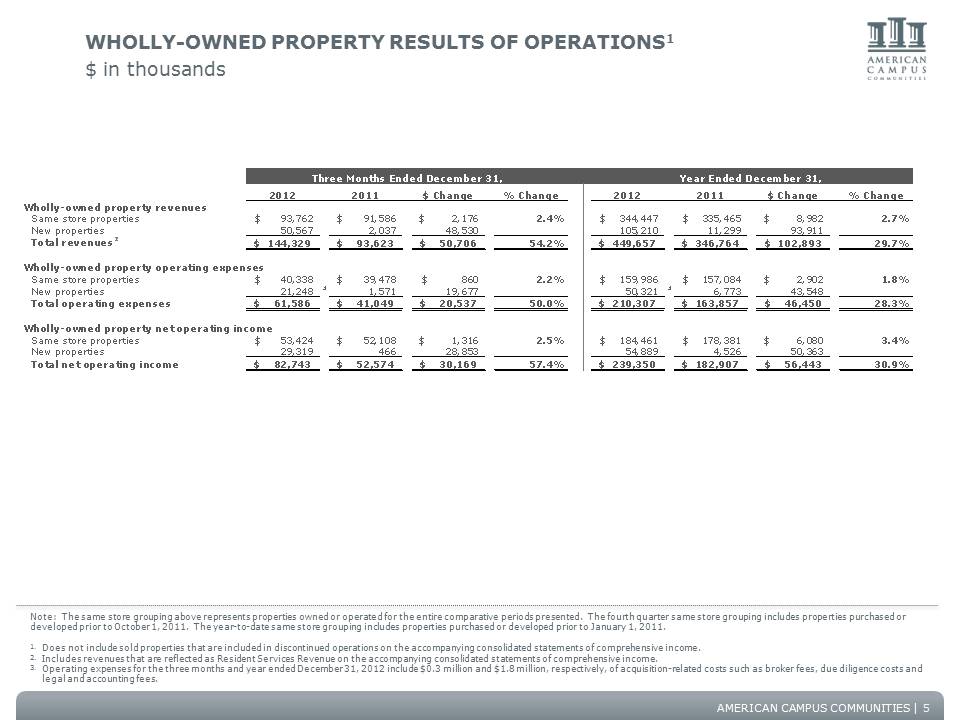
AMERICAN CAMPUS COMMUNITIES WHOLLY-OWNED PROPERTY RESULTS OF OPERATIONS1 $ in thousands Note: The same store grouping above represents properties owned or operated for the entire comparative periods presented. The fourth quarter same store grouping includes properties purchased or developed prior to October 1, 2011. The year-to-date same store grouping includes properties purchased or developed prior to January 1, 2011. 1. Does not include sold properties that are included in discontinued operations on the accompanying consolidated statements of comprehensive income. 2. Includes revenues that are reflected as Resident Services Revenue on the accompanying consolidated statements of comprehensive income. 3. Operating expenses for the three months and year ended December 31, 2012 include $0.3 million and $1.8 million, respectively, of acquisition-related costs such as broker fees, due diligence costs and legal and accounting fees. 5 2012 2011 $ Change % Change 2012 2011 $ Change % Change Wholly-owned property revenues Same store properties 93,762 $ 91,586 $ 2,176 $ 2.4% 344,447 $ 335,465 $ 8,982 $ 2.7% New properties 50,567 2,037 48,530 105,210 11,299 93,911 Total revenues2 144,329 $ 93,623 $ 50,706 $ 54.2% 449,657 $ 346,764 $ 102,893 $ 29.7% Wholly-owned property operating expenses Same store properties 40,338 $ 39,478 $ 860 $ 2.2% 159,986 $ 157,084 $ 2,902 $ 1.8% New properties 21,248 3 1,571 19,677 50,321 3 6,773 43,548 Total operating expenses 61,586 $ 41,049 $ 20,537 $ 50.0% 210,307 $ 163,857 $ 46,450 $ 28.3% Wholly-owned property net operating income Same store properties 53,424 $ 52,108 $ 1,316 $ 2.5% 184,461 $ 178,381 $ 6,080 $ 3.4% New properties 29,319 466 28,853 54,889 4,526 50,363 Total net operating income 82,743 $ 52,574 $ 30,169 $ 57.4% 239,350 $ 182,907 $ 56,443 $ 30.9% Three Months Ended December 31, Year Ended December 31,
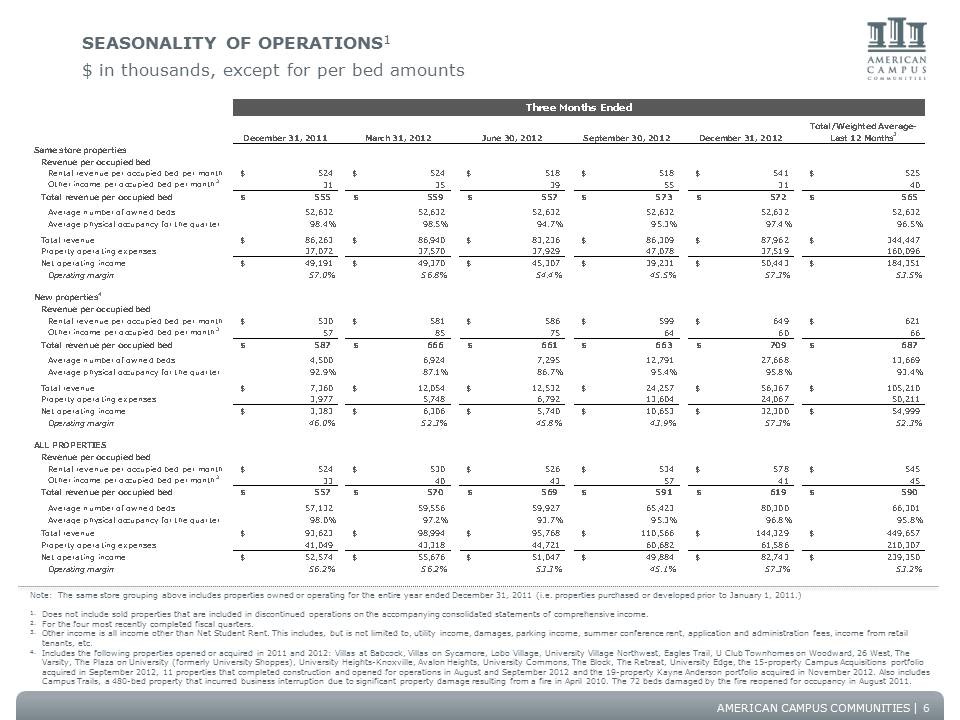
AMERICAN CAMPUS COMMUNITIES SEASONALITY OF OPERATIONS1 $ in thousands, except for per bed amounts Note: The same store grouping above includes properties owned or operating for the entire year ended December 31, 2011 (i.e. properties purchased or developed prior to January 1, 2011.) 1. Does not include sold properties that are included in discontinued operations on the accompanying consolidated statements of comprehensive income. 2. For the four most recently completed fiscal quarters. 3. Other income is all income other than Net Student Rent. This includes, but is not limited to, utility income, damages, parking income, summer conference rent, application and administration fees, income from retail tenants, etc. 4. Includes the following properties opened or acquired in 2011 and 2012: Villas at Babcock, Villas on Sycamore, Lobo Village, University Village Northwest, Eagles Trail, U Club Townhomes on Woodward, 26 West, The Varsity, The Plaza on University (formerly University Shoppes), University Heights-Knoxville, Avalon Heights, University Commons, The Block, The Retreat, University Edge, the 15-property Campus Acquisitions portfolio acquired in September 2012, 11 properties that completed construction and opened for operations in August and September 2012 and the 19-property Kayne Anderson portfolio acquired in November 2012. Also includes Campus Trails, a 480-bed property that incurred business interruption due to significant property damage resulting from a fire in April 2010. The 72 beds damaged by the fire reopened for occupancy in August 2011. 6 December 31, 2011 March 31, 2012 June 30, 2012 September 30, 2012 December 31, 2012 Total/Weighted Average - Last 12 Months2 Same store properties Revenue per occupied bed Rental revenue per occupied bed per month 524 $ 524 $ 518 $ 518 $ 541 $ 525 $ Other income per occupied bed per month3 31 35 39 55 31 40 Total revenue per occupied bed 555 $ 559 $ 557 $ 573 $ 572 $ 565 $ Average number of owned beds 52,632 52,632 52,632 52,632 52,632 52,632 Average physical occupancy for the quarter 98.4% 98.5% 94.7% 95.3% 97.4% 96.5% Total revenue 86,263 $ 86,940 $ 83,236 $ 86,309 $ 87,962 $ 344,447 $ Property operating expenses 37,072 37,570 37,929 47,078 37,519 160,096 Net operating income 49,191 $ 49,370 $ 45,307 $ 39,231 $ 50,443 $ 184,351 $ Operating margin 57.0% 56.8% 54.4% 45.5% 57.3% 53.5% New properties4 Revenue per occupied bed Rental revenue per occupied bed per month 530 $ 581 $ 586 $ 599 $ 649 $ 621 $ Other income per occupied bed per month3 57 85 75 64 60 66 Total revenue per occupied bed 587 $ 666 $ 661 $ 663 $ 709 $ 687 $ Average number of owned beds 4,500 6,924 7,295 12,791 27,668 13,669 Average physical occupancy for the quarter 92.9% 87.1% 86.7% 95.4% 95.8% 93.4% Total revenue 7,360 $ 12,054 $ 12,532 $ 24,257 $ 56,367 $ 105,210 $ Property operating expenses 3,977 5,748 6,792 13,604 24,067 50,211Net operating income 3,383 $ 6,306 $ 5,740 $ 10,653 $ 32,300 $ 54,999 $ Operating margin 46.0% 52.3% 45.8% 43.9% 57.3% 52.3% ALL PROPERTIES Revenue per occupied bed Rental revenue per occupied bed per month 524 $ 530 $ 526 $ 534 $ 578 $ 545 $ Other income per occupied bed per month3 33 40 43 57 41 45 Total revenue per occupied bed 557 $ 570 $ 569 $ 591 $ 619 $ 590 $ Average number of owned beds 57,132 59,556 59,927 65,423 80,300 66,301 Average physical occupancy for the quarter 98.0% 97.2% 93.7% 95.3% 96.8% 95.8% Total revenue 93,623 $ 98,994 $ 95,768 $ 110,566 $ 144,329 $ 449,657 $ Property operating expenses 41,049 43,318 44,721 60,682 61,586 210,307 Net operating income 52,574 $ 55,676 $ 51,047 $ 49,884 $ 82,743 $ 239,350 $ Operating margin 56.2% 56.2% 53.3% 45.1% 57.3% 53.2% Three Months Ended
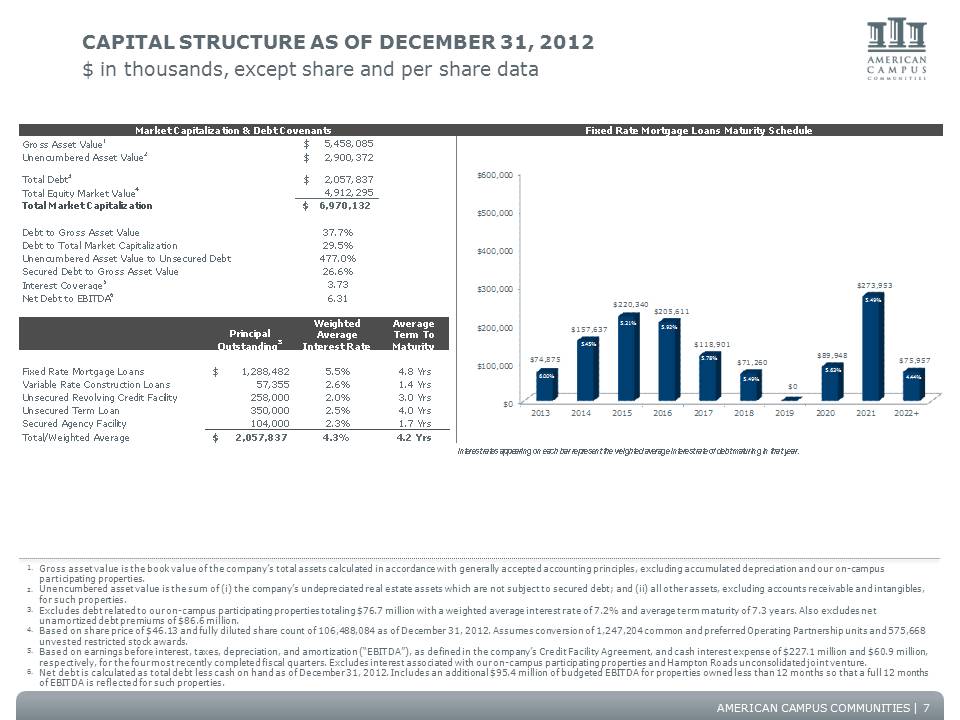
AMERICAN CAMPUS COMMUNITIES CAPITAL STRUCTURE AS OF DECEMBER 31, 2012 $ in thousands, except share and per share data Gross Asset Value1 5,458,085 $ Unencumbered Asset Value2 2,900,372 $ Total Debt3 2,057,837 $ Total Equity Market Value4 4,912,295 Total Market Capitalization 6,970,132 $ Debt to Gross Asset Value 37.7% Debt to Total Market Capitalization 29.5% Unencumbered Asset Value to Unsecured Debt 477.0% Secured Debt to Gross Asset Value 26.6% Interest Coverage5 3.73 Net Debt to EBITDA6 6.31 Principal Outstanding3 Weighted Average Interest Rate Average Term To Maturity Fixed Rate Mortgage Loans 1,288,482 $ 5.5% 4.8 Yrs Variable Rate Construction Loans 57,355 2.6% 1.4 Yrs Unsecured Revolving Credit Facility 258,000 2.0% 3.0 Yrs Unsecured Term Loan 350,000 2.5% 4.0 Yrs Secured Agency Facility 104,000 2.3% 1.7 Yrs Total/Weighted Average 2,057,837 $ 4.3% 4.2 Yrs 20 Interest rates appearing on each bar represent the weighted average interest rate of debt maturing in that year. Fixed Rate Mortgage Loans Maturity Schedule Market Capitalization & Debt Covenants $0 $100,000 $200,000 $300,000 $400,000 $500,000 $600,000 2013 2014 2015 2016 2017 2018 2019 2020 2021 2022+ $74,875 $157,637 $220,340 $205,611 $118,901 $71,260 $0 $89,948 $273,953 $75,957 6.00% 5.21% 5.45% 5.92% 4.44% 5.78% 5.49% 5.63% 5.49% 1. Gross asset value is the book value of the company’s total assets calculated in accordance with generally accepted accounting principles, excluding accumulated depreciation and our on-campus participating properties. 2. Unencumbered asset value is the sum of (i) the company’s undepreciated real estate assets which are not subject to secured debt; and (ii) all other assets, excluding accounts receivable and intangibles, for such properties. 3. Excludes debt related to our on-campus participating properties totaling $76.7 million with a weighted average interest rate of 7.2% and average term maturity of 7.3 years. Also excludes net unamortized debt premiums of $86.6 million. 4. Based on share price of $46.13 and fully diluted share count of 106,488,084 as of December 31, 2012. Assumes conversion of 1,247,204 common and preferred Operating Partnership units and 575,668 unvested restricted stock awards. 5. Based on earnings before interest, taxes, depreciation, and amortization (“EBITDA”), as defined in the company’s Credit Facility Agreement, and cash interest expense of $227.1 million and $60.9 million, respectively, for the four most recently completed fiscal quarters. Excludes interest associated with our on-campus participating properties and Hampton Roads unconsolidated joint venture. 6. Net debt is calculated as total debt less cash on hand as of December 31, 2012. Includes an additional $95.4 million of budgeted EBITDA for properties owned less than 12 months so that a full 12 months of EBITDA is reflected for such properties. 7
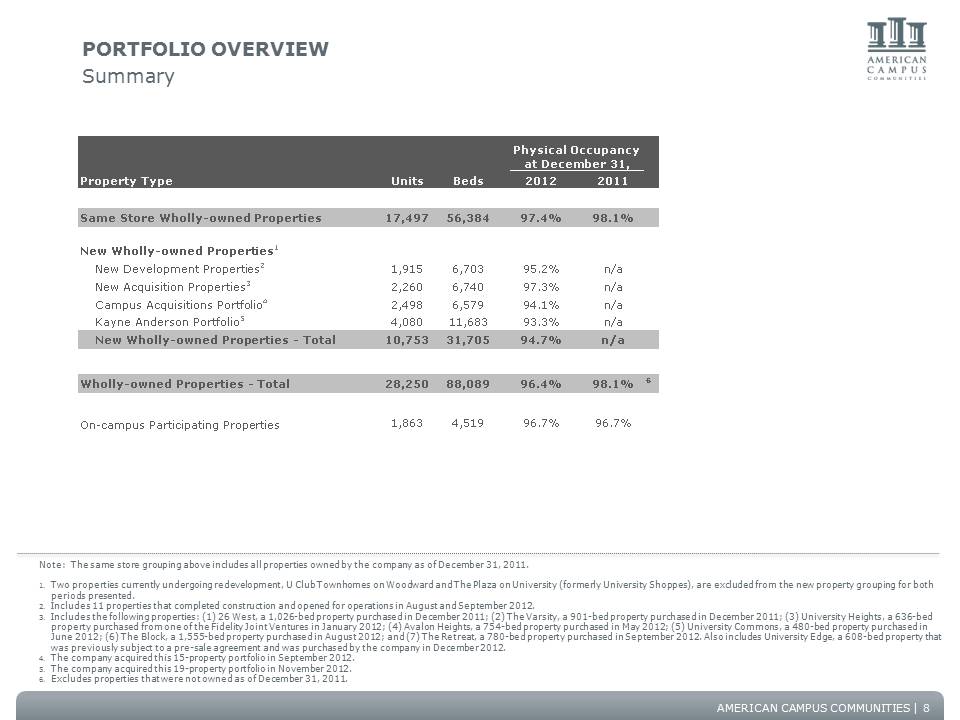
AMERICAN CAMPUS COMMUNITIES PORTFOLIO OVERVIEW Summary Note: The same store grouping above includes all properties owned by the company as of December 31, 2011. 1. Two properties currently undergoing redevelopment, U Club Townhomes on Woodward and The Plaza on University (formerly University Shoppes), are excluded from the new property grouping for both periods presented. 2. Includes 11 properties that completed construction and opened for operations in August and September 2012. 3. Includes the following properties: (1) 26 West, a 1,026-bed property purchased in December 2011; (2) The Varsity, a 901-bed property purchased in December 2011; (3) University Heights, a 636-bed property purchased from one of the Fidelity Joint Ventures in January 2012; (4) Avalon Heights, a 754-bed property purchased in May 2012; (5) University Commons, a 480-bed property purchased in June 2012; (6) The Block, a 1,555-bed property purchased in August 2012; and (7) The Retreat, a 780-bed property purchased in September 2012. Also includes University Edge, a 608-bed property that was previously subject to a pre-sale agreement and was purchased by the company in December 2012. 4. The company acquired this 15-property portfolio in September 2012. 5. The company acquired this 19-property portfolio in November 2012. 6. Excludes properties that were not owned as of December 31, 2011. 8 Units Beds 2012 2011 Same Store Wholly-owned Properties 17,497 56,384 97.4% 98.1% New Wholly-owned Properties1 New Development Properties2 1,915 6,703 95.2% n/a New Acquisition Properties3 2,260 6,740 97.3% n/a Campus Acquisitions Portfolio4 2,498 6,579 94.1% n/a Kayne Anderson Portfolio5 4,080 11,683 93.3% n/a New Wholly-owned Properties - Total 10,753 31,705 94.7% n/a Wholly-owned Properties - Total 28,250 88,089 96.4% 98.1% 6 On-campus Participating Properties 1,863 4,519 96.7% 96.7% Physical Occupancy at December 31, Property Type
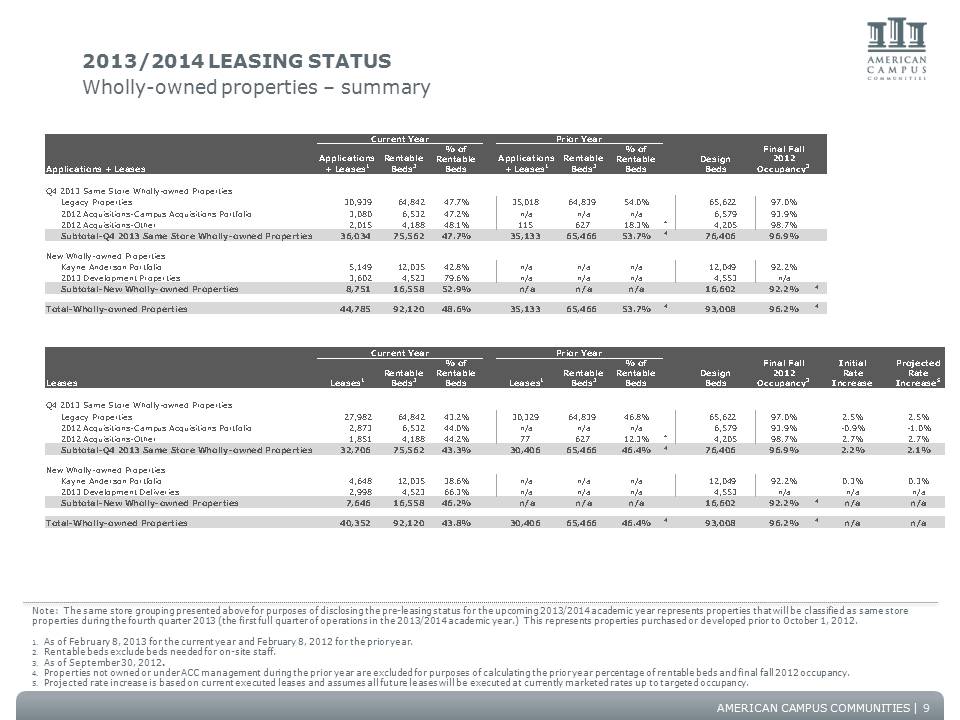
AMERICAN CAMPUS COMMUNITIES 2013/2014 LEASING STATUS Wholly-owned properties – summary Applications + Leases Applications + Leases1 Rentable Beds2 % of Rentable Beds Applications + Leases1 Rentable Beds2 % of Rentable Beds Design Beds Final Fall 2012 Occupancy3 Q4 2013 Same Store Wholly-owned Properties Legacy Properties 30,939 64,842 47.7% 35,018 64,839 54.0% 65,622 97.0% 2012 Acquisitions-Campus Acquisitions Portfolio 3,080 6,532 47.2% n/a n/a n/a 6,579 93.9% 2012 Acquisitions-Other 2,015 4,188 48.1% 115 627 18.3% 4 4,205 98.7% Subtotal-Q4 2013 Same Store Wholly-owned Properties 36,034 75,562 47.7% 35,133 65,466 53.7% 4 76,406 96.9% New Wholly-owned Properties Kayne Anderson Portfolio 5,149 12,035 42.8% n/a n/a n/a 12,049 92.2% 2013 Development Properties 3,602 4,523 79.6% n/a n/a n/a 4,553 n/a Subtotal-New Wholly-owned Properties 8,751 16,558 52.9% n/a n/a n/a 16,602 92.2% 4 Total-Wholly-owned Properties 44,785 92,120 48.6% 35,133 65,466 53.7% 4 93,008 96.2% 4 Leases Leases1 Rentable Beds2 % of Rentable Beds Leases1 Rentable Beds2 % of Rentable Beds Design Beds Final Fall 2012 Occupancy3 Initial Rate Increase Q4 2013 Same Store Wholly-owned Properties Legacy Properties 27,982 64,842 43.2% 30,329 64,839 46.8% 65,622 97.0% 2.5% 2012 Acquisitions-Campus Acquisitions Portfolio 2,873 6,532 44.0% n/a n/a n/a 6,579 93.9% -0.9% 2012 Acquisitions-Other 1,851 4,188 44.2% 77 627 12.3% 4 4,205 98.7% 2.7% Subtotal-Q4 2013 Same Store Wholly-owned Properties 32,706 75,562 43.3% 30,406 65,466 46.4% 4 76,406 96.9% 2.2% New Wholly-owned Properties Kayne Anderson Portfolio 4,648 12,035 38.6% n/a n/a n/a 12,049 92.2% 0.3% 2013 Development Deliveries 2,998 4,523 66.3% n/a n/a n/a 4,553 n/a n/a Subtotal-New Wholly-owned Properties 7,646 16,558 46.2% n/a n/a n/a 16,602 92.2% 4 n/a Total-Wholly-owned Properties 40,352 92,120 43.8% 30,406 65,466 46.4% 4 93,008 96.2% 4 n/a Current Year Prior Year Current Year Prior Year Note: The same store grouping presented above for purposes of disclosing the pre-leasing status for the upcoming 2013/2014 academic year represents properties that will be classified as same store properties during the fourth quarter 2013 (the first full quarter of operations in the 2013/2014 academic year.) This represents properties purchased or developed prior to October 1, 2012. 1. As of February 8, 2013 for the current year and February 8, 2012 for the prior year. 2. Rentable beds exclude beds needed for on-site staff. 3. As of September 30, 2012. 4. Properties not owned or under ACC management during the prior year are excluded for purposes of calculating the prior year percentage of entable beds and final fall 2012 occupancy. 5. Projected rate increase is based on current executed leases and assumes all future leases will be executed at currently marketed rates up to targeted occupancy. 9
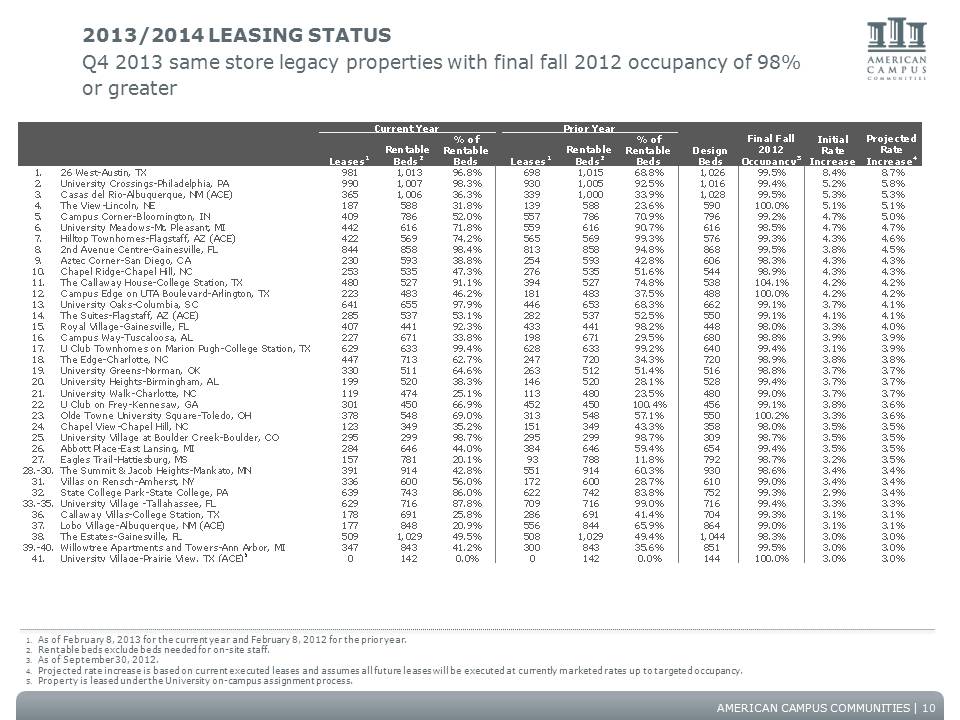
AMERICAN CAMPUS COMMUNITIES Leases1 Rentable Beds2 % of Rentable Beds Leases1 Rentable Beds2 % of Rentable Beds 1. 26 West-Austin, TX 981 1,013 96.8% 698 1,015 68.8% 1,026 99.5% 8.4% 8.7% 2. University Crossings-Philadelphia, PA 990 1,007 98.3% 930 1,005 92.5% 1,016 99.4% 5.2% 5.8% 3. Casas del Rio-Albuquerque, NM (ACE) 365 1,006 36.3% 339 1,000 33.9% 1,028 99.5% 5.3% 5.3% 4. The View-Lincoln, NE 187 588 31.8% 139 588 23.6% 590 100.0% 5.1% 5.1% 5. Campus Corner-Bloomington, IN 409 786 52.0% 557 786 70.9% 796 99.2% 4.7% 5.0% 6. University Meadows-Mt. Pleasant, MI 442 616 71.8% 559 616 90.7% 616 98.5% 4.7% 4.7% 7. Hilltop Townhomes-Flagstaff, AZ (ACE) 422 569 74.2% 565 569 99.3% 576 99.3% 4.3% 4.6% 8. 2nd Avenue Centre-Gainesville, FL 844 858 98.4% 813 858 94.8% 868 99.5% 3.8% 4.5% 9. Aztec Corner-San Diego, CA 230 593 38.8% 254 593 42.8% 606 98.3% 4.3% 4.3% 10. Chapel Ridge-Chapel Hill, NC 253 535 47.3% 276 535 51.6% 544 98.9% 4.3% 4.3% 11. The Callaway House-College Station, TX 480 527 91.1% 394 527 74.8% 538 104.1% 4.2% 4.2% 12. Campus Edge on UTA Boulevard-Arlington, TX 223 483 46.2% 181 483 37.5% 488 100.0% 4.2% 4.2% 13. University Oaks-Columbia, SC 641 655 97.9% 446 653 68.3% 662 99.1% 3.7% 4.1% 14. The Suites-Flagstaff, AZ (ACE) 285 537 53.1% 282 537 52.5% 550 99.1% 4.1% 4.1% 15. Royal Village-Gainesville, FL 407 441 92.3% 433 441 98.2% 448 98.0% 3.3% 4.0% 16. Campus Way-Tuscaloosa, AL 227 671 33.8% 198 671 29.5% 680 98.8% 3.9% 3.9% 17. U Club Townhomes on Marion Pugh-College Station, TX 629 633 99.4% 628 633 99.2% 640 99.4% 3.1% 3.9% 18. The Edge-Charlotte, NC 447 713 62.7% 247 720 34.3% 720 98.9% 3.8% 3.8% 19. University Greens-Norman, OK 330 511 64.6% 263 512 51.4% 516 98.8% 3.7% 3.7% 20. University Heights-Birmingham, AL 199 520 38.3% 146 520 28.1% 528 99.4% 3.7% 3.7% 21. University Walk-Charlotte, NC 119 474 25.1% 113 480 23.5% 480 99.0% 3.7% 3.7% 22. U Club on Frey-Kennesaw, GA 301 450 66.9% 452 450 100.4% 456 99.1% 3.8% 3.6% 23. Olde Towne University Square-Toledo, OH 378 548 69.0% 313 548 57.1% 550 100.2% 3.3% 3.6% 24. Chapel View-Chapel Hill, NC 123 349 35.2% 151 349 43.3% 358 98.0% 3.5% 3.5% 25. University Village at Boulder Creek-Boulder, CO 295 299 98.7% 295 299 98.7% 309 98.7% 3.5% 3.5% 26. Abbott Place-East Lansing, MI 284 646 44.0% 384 646 59.4% 654 99.4% 3.5% 3.5% 27. Eagles Trail-Hattiesburg, MS 157 781 20.1% 93 788 11.8% 792 98.7% 3.2% 3.5% 28.-30. The Summit & Jacob Heights-Mankato, MN 391 914 42.8% 551 914 60.3% 930 98.6% 3.4% 3.4% 31. Villas on Rensch-Amherst, NY 336 600 56.0% 172 600 28.7% 610 99.0% 3.4% 3.4% 32. State College Park-State College, PA 639 743 86.0% 622 742 83.8% 752 99.3% 2.9% 3.4% 33.-35. University Village -Tallahassee, FL 629 716 87.8% 709 716 99.0% 716 9.4% 3.3% 3.3% 36. Callaway Villas-College Station, TX 178 691 25.8% 286 691 41.4% 704 99.3% 3.1% 3.1% 37. Lobo Village-Albuquerque, NM (ACE) 177 848 20.9% 556 844 65.9% 864 99.0% 3.1% 3.1% 38. The Estates-Gainesville, FL 509 1,029 49.5% 508 1,029 49.4% 1,044 98.3% 3.0% 3.0% 39.-40. Willowtree Apartments and Towers-Ann Arbor, MI 347 843 41.2% 300 843 35.6% 851 99.5% 3.0% 3.0% 41. University Village-Prairie View, TX (ACE)5 0 142 0.0% 0 142 0.0% 144 100.0% 3.0% 3.0% Current Year Prior Year Projected Rate Increase4 Initial Rate Increase Final Fall 2012 Occupancy3 Design Beds 2013/2014 LEASING STATUS Q4 2013 same store legacy properties with final fall 2012 occupancy of 98% or greater 1. As of February 8, 2013 for the current year and February 8, 2012 for the prior year. 2. Rentable beds exclude beds needed for on-site staff. 3. As of September 30, 2012. 4. Projected rate increase is based on current executed leases and assumes all future leases will be executed at currently marketed rates up to targeted occupancy. 5. Property is leased under the University on-campus assignment process. 10
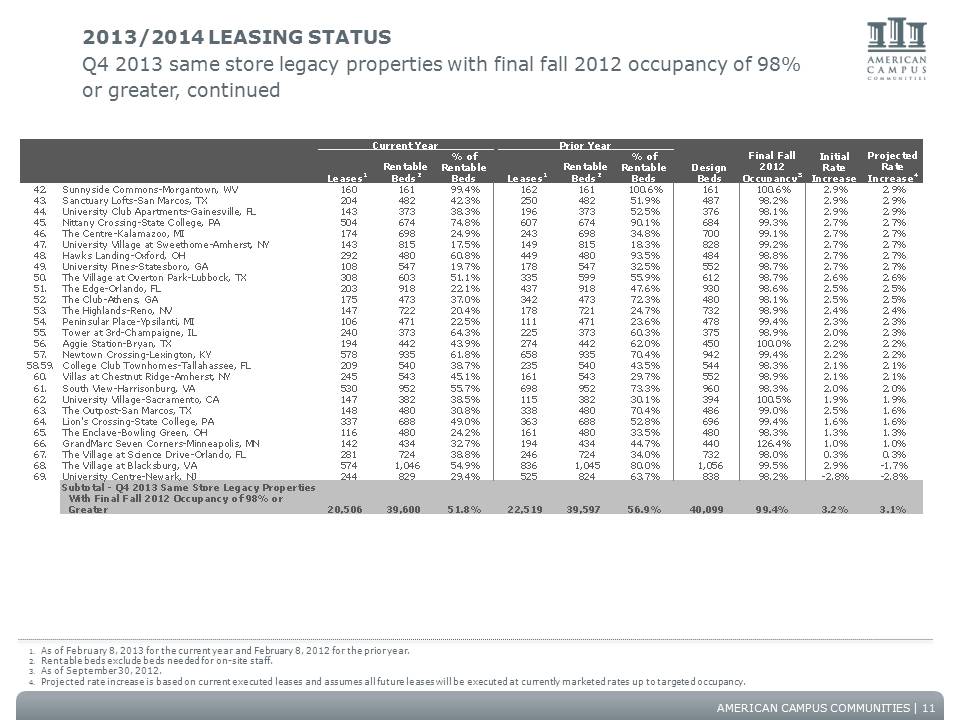
AMERICAN CAMPUS COMMUNITIES Leases1 Rentable Beds2 % of Rentable Beds Leases1Rentable Beds2 % of Rentable Beds 42. Sunnyside Commons-Morgantown, WV 160 161 99.4% 162 161 100.6% 161 100.6% 2.9% 2.9% 43. Sanctuary Lofts-San Marcos, TX 204 482 42.3% 250 482 51.9% 487 98.2% 2.9% 2.9% 44. University Club Apartments-Gainesville, FL 143 373 38.3% 196 373 52.5% 376 98.1% 2.9% 2.9% 45. Nittany Crossing-State College, PA 504 674 74.8% 607 674 90.1% 684 99.3% 2.7% 2.7% 46. The Centre-Kalamazoo, MI 174 698 24.9% 243 698 34.8% 700 99.1% 2.7% 2.7% 47. University Village at Sweethome-Amherst, NY 143 815 17.5% 149 815 18.3% 828 99.2% 2.7% 2.7% 48. Hawks Landing-Oxford, OH 292 480 60.8% 449 480 93.5% 484 98.8% 2.7% 2.7% 49. University Pines-Statesboro, GA 108 547 19.7% 178 547 32.5% 552 98.7% 2.7% 2.7% 50. The Village at Overton Park-Lubbock, TX 308 603 51.1% 335 599 55.9% 612 98.7% 2.6% 2.6% 51. The Edge-Orlando, FL 203 918 22.1% 437 918 47.6% 930 98.6% 2.5% 2.5% 52. The Club-Athens, GA 175 473 37.0% 342 473 72.3% 480 98.1% 2.5% 2.5% 53. The Highlands-Reno, NV 147 722 20.4% 178 721 24.7% 732 98.9% 2.4% 2.4% 54. Peninsular Place-Ypsilanti, MI 106 471 22.5% 111 471 23.6% 478 99.4% 2.3% 2.3% 55. Tower at 3rd-Champaigne, IL 240 373 64.3% 225 373 60.3% 375 98.9% 2.0% 2.3% 56. Aggie Station-Bryan, TX 194 442 43.9% 274 442 62.0% 450 100.0% 2.2% 2.2% 57. Newtown Crossing-Lexington, KY 578 935 61.8% 658 935 70.4% 942 99.4% 2.2% 2.2% 58.59. College Club Townhomes-Tallahassee, FL 209 540 38.7% 235 540 43.5% 544 98.3% 2.1% 2.1% 60. Villas at Chestnut Ridge-Amherst, NY 245 543 45.1% 161 543 29.7% 552 98.9% 2.1% 2.1% 61. South View-Harrisonburg, VA 530 952 55.7% 698 952 73.3% 960 98.3% 2.0% 2.0% 62. University Village-Sacramento, CA 147 382 38.5% 115 382 30.1% 394 100.5% 1.9% 1.9% 63. The Outpost-San Marcos, TX 148 480 30.8% 338 480 70.4% 486 99.0% 2.5% 1.6% 64. Lion's Crossing-State College, PA 337 688 49.0% 363 688 52.8% 696 99.4% 1.6% 1.6% 65. The Enclave-Bowling Green, OH 116 480 24.2% 161 480 33.5% 480 98.3% 1.3% 1.3% 66. GrandMarc Seven Corners-Minneapolis, MN 142 434 32.7% 194 434 44.7% 440 126.4% 1.0% 1.0% 67. The Village at Science Drive-Orlando, FL 281 724 38.8% 246 724 34.0% 732 98.0% 0.3% 0.3% 68. The Village at Blacksburg, VA 574 1,046 54.9% 836 1,045 80.0% 1,056 99.5% 2.9% -1.7% 69. University Centre-Newark, NJ 244 829 29.4% 525 824 63.7% 838 98.2% -2.8% -2.8% Subtotal - Q4 2013 Same Store Legacy Properties With Final Fall 2012 Occupancy of 98% or Greater 20,506 39,600 51.8% 22,519 39,597 56.9% 40,099 99.4% 3.2% 3.1% Projected Rate Increase4 Current Year Prior Year Design Beds Final Fall 2012 Occupancy3 Initial Rate Increase 2013/2014 LEASING STATUS Q4 2013 same store legacy properties with final fall 2012 occupancy of 98% or greater, continued 1. As of February 8, 2013 for the current year and February 8, 2012 for the prior year. 2. Rentable beds exclude beds needed for on-site staff. 3. As of September 30, 2012. 4. Projected rate increase is based on current executed leases and assumes all future leases will be executed at currently marketed rates up to targeted occupancy. 11
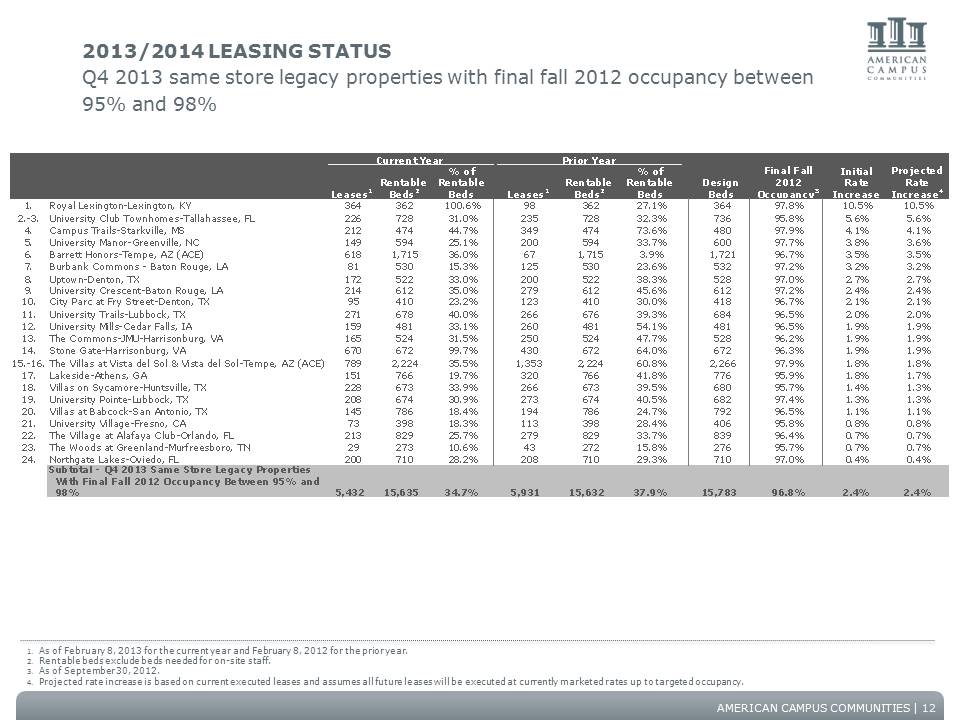
AMERICAN CAMPUS COMMUNITIES Leases1 Rentable Beds2 % of Rentable Beds Leases1 Rentable Beds2 % of Rentable Beds 1. Royal Lexington-Lexington, KY 364 362 100.6% 98 362 27.1% 364 97.8% 10.5% 10.5% 2.-3. University Club Townhomes-Tallahassee, FL 226 728 31.0% 235 728 32.3% 736 95.8% 5.6% 5.6% 4. Campus Trails-Starkville, MS 212 474 44.7% 349 474 73.6% 480 97.9% 4.1% 4.1% 5. University Manor-Greenville, NC 149 594 25.1% 200 594 33.7% 600 97.7% 3.8% 3.6% 6. Barrett Honors-Tempe, AZ (ACE) 618 1,715 36.0% 67 1,715 3.9% 1,721 96.7% 3.5% 3.5% 7. Burbank Commons - Baton Rouge, LA 81 530 15.3% 125 530 23.6% 532 97.2% 3.2% 3.2% 8. Uptown-Denton, TX 172 522 33.0% 200 522 38.3% 528 97.0% 2.7% 2.7% 9. University Crescent-Baton Rouge, LA 214 612 35.0% 279 612 45.6% 612 97.2% 2.4% 2.4% 10. City Parc at Fry Street-Denton, TX 95 410 23.2% 123 410 30.0% 418 96.7% 2.1% 2.1% 11. University Trails-Lubbock, TX 271 678 40.0% 266 676 39.3% 684 96.5% 2.0% 2.0% 12. University Mills-Cedar Falls, IA 159 481 33.1% 260 481 54.1% 481 96.5% 1.9% 1.9% 13. The Commons-JMU-Harrisonburg, VA 165 524 31.5% 250 524 47.7% 528 96.2% 1.9% 1.9% 14. Stone Gate-Harrisonburg, VA 670 672 99.7% 430 672 64.0% 672 96.3% 1.9% 1.9% 15.-16. The Villas at Vista del Sol & Vista del Sol-Tempe, AZ (ACE) 789 2,224 35.5% 1,353 2,224 60.8% 2,266 97.9% 1.8% 1.8% 17. Lakeside-Athens, GA 151 766 19.7% 320 766 41.8% 776 95.9% 1.8% 1.7% 18. Villas on Sycamore-Huntsville, TX 228 673 33.9% 266 673 39.5% 680 95.7% 1.4% 1.3% 19. University Pointe-Lubbock, TX 208 674 30.9% 273 674 40.5% 682 97.4% 1.3% 1.3% 20. Villas at Babcock-San Antonio, TX 145 786 18.4% 194 786 24.7% 792 96.5% 1.1% 1.1% 21. University Village-Fresno, CA 73 398 18.3% 113 398 28.4% 406 95.8% 0.8% 0.8% 22. The Village at Alafaya Club-Orlando, FL 213 829 25.7% 279 829 33.7% 839 96.4% 0.7% 0.7% 23. The Woods at Greenland-Murfreesboro, TN 29 273 10.6% 43 272 15.8% 276 95.7% 0.7% 0.7% 24. Northgate Lakes-Oviedo, FL 200 710 28.2% 208 710 29.3% 710 97.0% 0.4% 0.4% Subtotal - Q4 2013 Same Store Legacy Properties With Final Fall 2012 Occupancy Between 95% and 98% 5,432 15,635 34.7% 5,931 15,632 37.9% 15,783 96.8% 2.4% 2.4% Projected Rate Increase4 Current Year Prior Year Design Beds Final Fall 2012 Occupancy3 Initial Rate Increase 2013/2014 LEASING STATUS Q4 2013 same store legacy properties with final fall 2012 occupancy between 95% and 98% 1. As of February 8, 2013 for the current year and February 8, 2012 for the prior year. 2. Rentable beds exclude beds needed for on-site staff. 3. As of September 30, 2012. 4. Projected rate increase is based on current executed leases and assumes all future leases will be executed at currently marketed rates up to targeted occupancy. 12
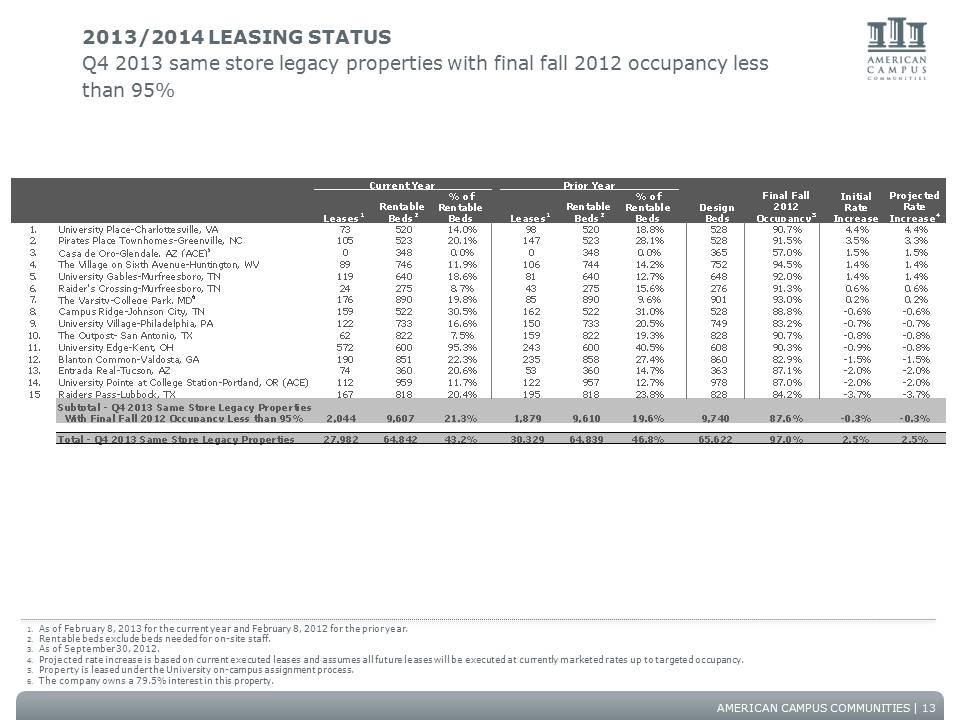
AMERICAN CAMPUS COMMUNITIES Leases1 Rentable Beds2 % of Rentable Beds Leases1 Rentable Beds2 % of Rentable Beds 1. University Place-Charlottesville, VA 73 520 14.0% 98 520 18.8% 528 90.7% 4.4% 4.4% 2. Pirates Place Townhomes-Greenville, NC 105 523 20.1% 147 523 28.1% 528 91.5% 3.5% 3.3% 3. Casa de Oro-Glendale, AZ (ACE)5 0 348 0.0% 0 348 0.0% 365 57.0% 1.5% 1.5% 4. The Village on Sixth Avenue-Huntington, WV 89 746 11.9% 106 744 14.2% 752 94.5% 1.4% 1.4% 5. University Gables-Murfreesboro, TN 119 640 18.6% 81 640 12.7% 648 92.0% 1.4% 1.4% 6. Raider's Crossing-Murfreesboro, TN 24 275 8.7% 43 275 15.6% 276 91.3% 0.6% 0.6% 7. The Varsity-College Park, MD6 176 890 19.8% 85 890 9.6% 901 93.0% 0.2% 0.2% 8. Campus Ridge-Johnson City, TN 159 522 30.5% 162 522 31.0% 528 88.8% -0.6% -0.6% 9. University Village-Philadelphia, PA 122 733 16.6% 150 733 20.5% 749 83.2% -0.7% -0.7% 10. The Outpost- San Antonio, TX 62 822 7.5% 159 822 19.3% 828 90.7% -0.8% -0.8% 11. University Edge-Kent, OH 572 600 95.3% 243 600 40.5% 608 90.3% -0.9% -0.8% 12. Blanton Common-Valdosta, GA 190 851 22.3% 235 858 27.4% 860 82.9% -1.5% -1.5% 13. Entrada Real-Tucson, AZ 74 360 20.6% 53 360 14.7% 363 87.1% -2.0% -2.0% 14. University Pointe at College Station-Portland, OR (ACE) 112 959 11.7% 122 957 12.7% 978 87.0% -2.0% -2.0% 15 Raiders Pass-Lubbock, TX 167 818 20.4% 195 818 23.8% 828 84.2% -3.7% -3.7% Subtotal - Q4 2013 Same Store Legacy Properties With Final Fall 2012 Occupancy Less than 95% 2,044 9,607 21.3% 1,879 9,610 19.6% 9,740 87.6% -0.3% -0.3% Total - Q4 2013 Same Store Legacy Properties 27,982 64,842 43.2% 30,329 64,839 46.8% 65,622 97.0% 2.5% 2.5% Projected Rate Increase4 Current Year Prior Year Design Beds Final Fall 2012 Occupancy3 Initial Rate Increase 2013/2014 LEASING STATUS Q4 2013 same store legacy properties with final fall 2012 occupancy less than 95% 1. As of February 8, 2013 for the current year and February 8, 2012 for the prior year. 2. Rentable beds exclude beds needed for on-site staff. 3. As of September 30, 2012. 4. Projected rate increase is based on current executed leases and assumes all future leases will be executed at currently marketed rates up to targeted occupancy. 5. Property is leased under the University on-campus assignment process. 6. The company owns a 79.5% interest in this property. 13
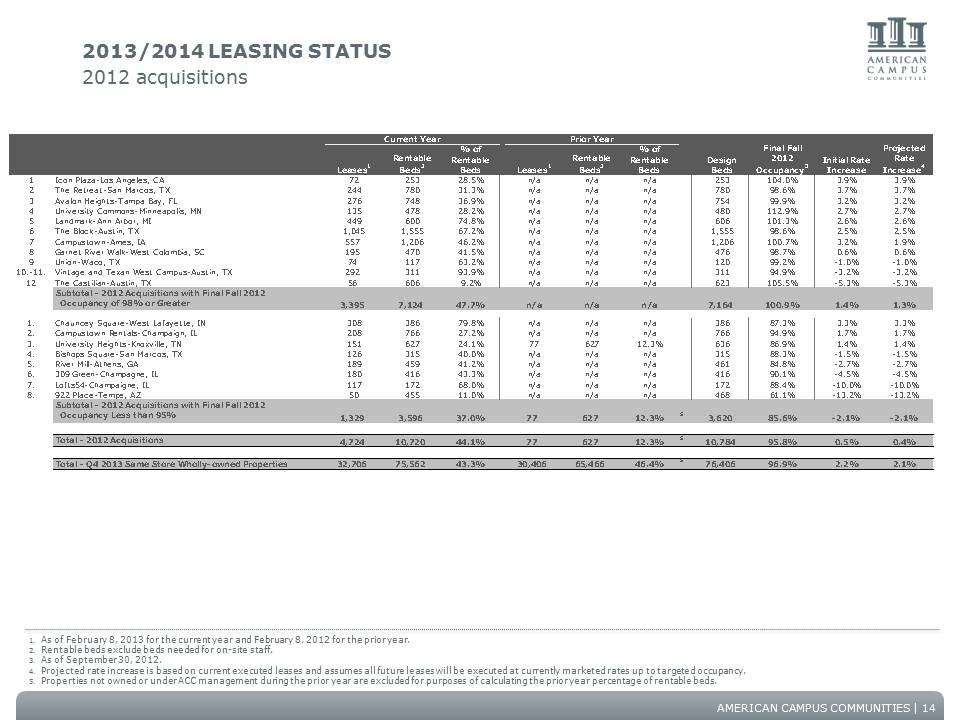
AMERICAN CAMPUS COMMUNITIES Leases1 Rentable Beds2 % of Rentable Beds Leases1 Rentable Beds2 % of Rentable Beds 1 Icon Plaza-Los Angeles, CA 72 253 28.5% n/a n/a n/a 253 104.0% 3.9% 3.9% 2 The Retreat-San Marcos, TX 244 780 31.3% n/a n/a n/a 780 98.6% 3.7% 3.7% 3 Avalon Heights-Tampa Bay, FL 276 748 36.9% n/a n/a n/a 754 99.9% 3.2% 3.2% 4 University Commons-Minneapolis, MN 135 478 28.2% n/a n/a n/a 480 112.9% 2.7% 2.7% 5 Landmark-Ann Arbor, MI 449 600 74.8% n/a n/a n/a 606 101.3% 2.6% 2.6% 6 The Block-Austin, TX 1,045 1,555 67.2% n/a n/a n/a 1,555 98.6% 2.5% 2.5% 7 Campustown-Ames, IA 557 1,206 46.2% n/a n/a n/a 1,206 100.7% 3.2% 1.9% 8 Garnet River Walk-West Colombia, SC 195 470 41.5% n/a n/a n/a 476 98.7% 0.6% 0.6% 9 Union-Waco, TX 74 117 63.2% n/a n/a n/a 120 99.2% -1.0% -1.0% 10.-11. Vintage and Texan West Campus-Austin, TX 292 311 93.9% n/a n/a n/a 311 94.9% -3.2% -3.2% 12 The Castilian-Austin, TX 56 606 9.2% n/a n/a n/a 623 105.5% -5.3% -5.3% Subtotal - 2012 Acquisitions with Final Fall 2012 Occupancy of 98% or Greater 3,395 7,124 47.7% n/a n/a n/a 7,164 100.9% 1.4% 1.3% 1. Chauncey Square-West Lafayette, IN 308 386 79.8% n/a n/a n/a 386 87.3% 3.3% 3.3% 2. Campustown Rentals-Champaign, IL 208 766 27.2% n/a n/a n/a 766 94.9% 1.7% 1.7% 3. University Heights-Knoxville, TN 151 627 24.1% 77 627 12.3% 636 86.9% 1.4% 1.4% 4. Bishops Square-San Marcos, TX 126 315 40.0% n/a n/a n/a 315 88.3% -1.5% -1.5% 5. River Mill-Athens, GA 189 459 41.2% n/a n/a n/a 461 84.8% -2.7% -2.7% 6. 309 Green-Champagne, IL 180 416 43.3% n/a n/a n/a 416 90.1% -4.5% -4.5% 7. Lofts54-Champaigne, IL 117 172 68.0% n/a n/a n/a 172 88.4% -10.0% -10.0% 8. 922 Place-Tempe, AZ 50 455 11.0% n/a n/a n/a 468 61.1% -13.2% -13.2% Subtotal - 2012 Acquisitions with Final Fall 2012 Occupancy Less than 95% 1,329 3,596 37.0% 77 627 12.3% 5 3,620 85.6% -2.1% -2.1% Total - 2012 Acquisitions 4,724 10,720 44.1% 77 627 12.3% 5 10,784 95.8% 0.5% 0.4% Total - Q4 2013 Same Store Wholly-owned Properties 32,706 75,562 43.3% 30,406 65,466 46.4% 5 76,406 96.9% 2.2% 2.1% Projected Rate Increase4 Current Year Prior Year Design Beds Final Fall 2012 Occupancy3 Initial Rate Increase 2013/2014 LEASING STATUS 2012 acquisitions 1. As of February 8, 2013 for the current year and February 8, 2012 for the prior year. 2. Rentable beds exclude beds needed for on-site staff. 3. As of September 30, 2012. 4. Projected rate increase is based on current executed leases and assumes all future leases will be executed at currently marketed rates up to targeted occupancy. 5. Properties not owned or under ACC management during the prior year are excluded for purposes of calculating the prior year percentage of rentable beds. 14
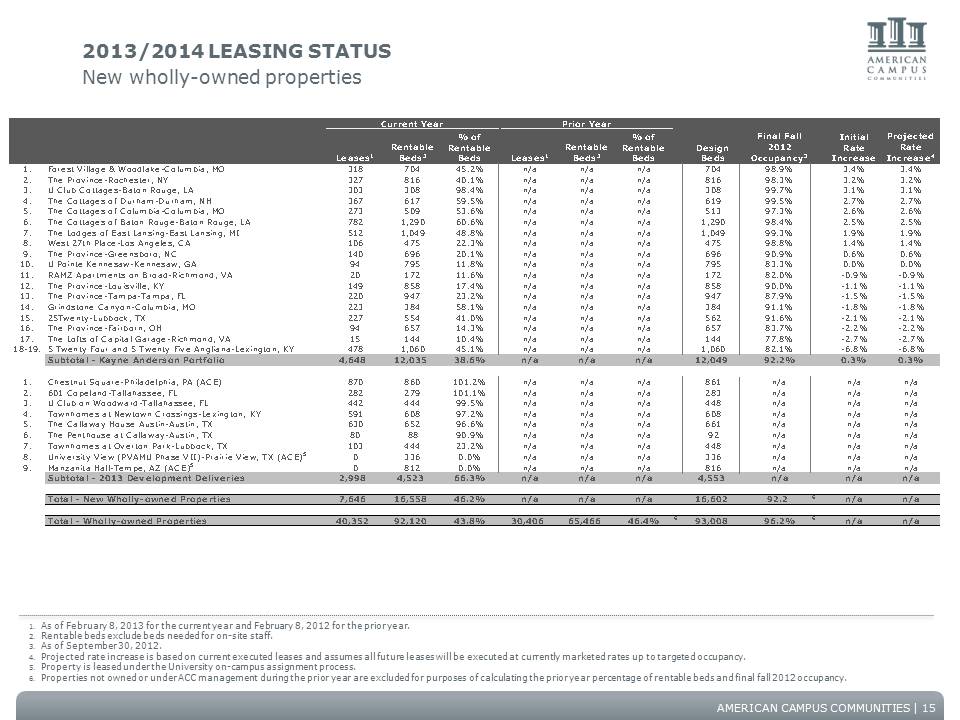
AMERICAN CAMPUS COMMUNITIES Leases1 Rentable Beds2 % of Rentable Beds Leases1 Rentable Beds2 % of Rentable Beds 1. Forest Village & Woodlake-Columbia, MO 318 704 45.2% n/a n/a n/a 704 98.9% 3.4% 3.4% 2. The Province-Rochester, NY 327 816 40.1% n/a n/a n/a 816 98.3% 3.2% 3.2% 3. U Club Cottages-Baton Rouge, LA 303 308 98.4% n/a n/a n/a 308 99.7% 3.1% 3.1% 4. The Cottages of Durham-Durham, NH 367 617 59.5% n/a n/a n/a 619 99.5% 2.7% 2.7% 5. The Cottages of Columbia-Columbia, MO 273 509 53.6% n/a n/a n/a 513 97.3% 2.6% 2.6% 6. The Cottages of Baton Rouge-Baton Rouge, LA 782 1,290 60.6% n/a n/a n/a 1,290 98.4% 2.5% 2.5% 7. The Lodges of East Lansing-East Lansing, MI 512 1,049 48.8% n/a n/a n/a 1,049 99.3% 1.9% 1.9% 8. West 27th Place-Los Angeles, CA 106 475 22.3% n/a n/a n/a 475 98.8% 1.4% 1.4% 9. The Province-Greensboro, NC 140 696 20.1% n/a n/a n/a 696 90.9% 0.6% 0.6% 10. U Pointe Kennesaw-Kennesaw, GA 94 795 11.8% n/a n/a n/a 795 83.3% 0.0% 0.0% 11. RAMZ Apartments on Broad-Richmond, VA 20 172 11.6% n/a n/a n/a 172 82.0% -0.9% -0.9% 12. The Province-Louisville, KY 149 858 17.4% n/a n/a n/a 858 90.0% -1.1% -1.1% 13. The Province-Tampa-Tampa, FL 220 947 23.2% n/a n/a n/a 947 87.9% -1.5% -1.5% 14. Grindstone Canyon-Columbia, MO 223 384 58.1% n/a n/a n/a 384 91.1% -1.8% -1.8% 15. 25Twenty-Lubbock, TX 227 554 41.0% n/a n/a n/a 562 91.6% -2.1% -2.1% 16. The Province-Fairborn, OH 94 657 14.3% n/a n/a n/a 657 83.7% -2.2% -2.2% 17. The Lofts of Capital Garage-Richmond, VA 15 144 10.4% n/a n/a n/a 144 77.8% -2.7% -2.7% 18-19. 5 Twenty Four and 5 Twenty Five Angliana-Lexington, KY 478 1,060 45.1% n/a n/a n/a 1,060 82.1% -6.8% -6.8% Subtotal - Kayne Anderson Portfolio 4,648 12,035 38.6% n/a n/a n/a 12,049 92.2% 0.3% 0.3% 1. Chestnut Square-Philadelphia, PA (ACE) 870 860 101.2% n/a n/a n/a 861 n/a n/a n/a 2. 601 Copeland-Tallahassee, FL 282 279 101.1% n/a n/a n/a 283 n/a n/a n/a 3. U Club on Woodward-Tallahassee, FL 442 444 99.5% n/a n/a n/a 448 n/a n/a n/a 4. Townhomes at Newtown Crossings-Lexington, KY 591 608 97.2% n/a n/a n/a 608 n/a n/a n/a 5. The Callaway House Austin-Austin, TX 630 652 96.6% n/a n/a n/a 661 n/a n/a n/a 6. The Penthouse at Callaway-Austin, TX 80 88 90.9% n/a n/a n/a 92 n/a n/a n/a 7. Townhomes at Overton Park-Lubbock, TX 103 444 23.2% n/a n/a n/a 448 n/a n/a n/a 8. University View (PVAMU Phase VII)-Prairie View, TX (ACE)5 0 336 0.0% n/a n/a n/a 336 n/a n/a n/a 9. Manzanita Hall-Tempe, AZ (ACE)5 0 812 0.0% n/a n/a n/a 816 n/a n/a n/a Subtotal - 2013 Development Deliveries 2,998 4,523 66.3% n/a n/a n/a 4,553 n/a n/a n/a Total - New Wholly-owned Properties 7,646 16,558 46.2% n/a n/a n/a 16,602 92.2 6 n/a n/a Total - Wholly-owned Properties 40,352 92,120 43.8% 30,406 65,466 46.4% 6 93,008 96.2% 6 n/a n/a Projected Rate Increase4 Current Year Prior Year Design Beds Final Fall 2012 Occupancy3 Initial Rate Increase 2013/2014 LEASING STATUS New wholly-owned properties 1. As of February 8, 2013 for the current year and February 8, 2012 for the prior year. 2. Rentable beds exclude beds needed for on-site staff. 3. As of September 30, 2012. 4. Projected rate increase is based on current executed leases and assumes all future leases will be executed at currently marketed rates up to targeted occupancy. 5. Property is leased under the University on-campus assignment process. 6. Properties not owned or under ACC management during the prior year are excluded for purposes of calculating the prior year percentage of rentable beds and final fall 2012 occupancy. 15
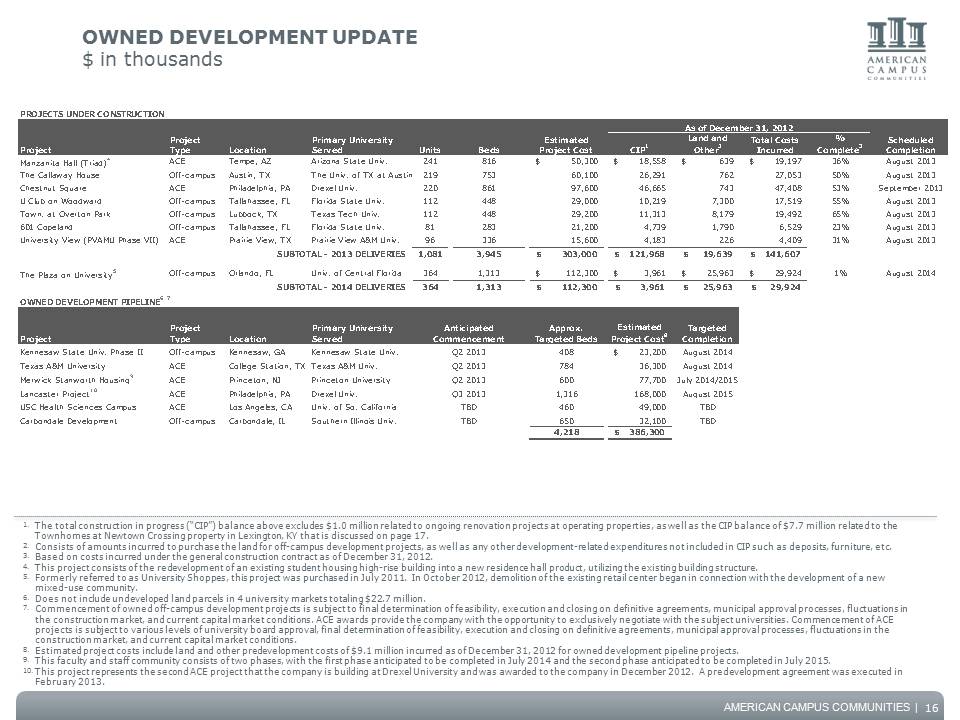
AMERICAN CAMPUS COMMUNITIES OWNED DEVELOPMENT UPDATE $ in thousands 16 1. The total construction in progress (“CIP”) balance above excludes $1.0 million related to ongoing renovation projects at operating properties, as well as the CIP balance of $7.7 million related to the Townhomes at Newtown Crossing property in Lexington, KY that is discussed on page 17. 2. Consists of amounts incurred to purchase the land for off-campus development projects, as well as any other development-related expenditures not included in CIP such as deposits, furniture, etc. 3. Based on costs incurred under the general construction contract as of December 31, 2012. 4. This project consists of the redevelopment of an existing student housing high-rise building into a new residence hall product, utilizing the existing building structure. 5. Formerly referred to as University Shoppes, this project was purchased in July 2011. In October 2012, demolition of the existing retail center began in connection with the development of a new mixed-use community. 6. Does not include undeveloped land parcels in 4 university markets totaling $22.7 million. 7. Commencement of owned off-campus development projects is subject to final determination of feasibility, execution and closing on definitive agreements, municipal approval processes, fluctuations in the construction market, and current capital market conditions. ACE awards provide the company with the opportunity to exclusively negotiate with the subject universities. Commencement of ACE projects is subject to various levels of university board approval, final determination of feasibility, execution and closing on definitive agreements, municipal approval processes, fluctuations in the construction market, and current capital market conditions. 8. Estimated project costs include land and other predevelopment costs of $9.1 million incurred as of December 31, 2012 for owned development pipeline projects. 9. This faculty and staff community consists of two phases, with the first phase anticipated to be completed in July 2014 and the second phase anticipated to be completed in July 2015. 10. This project represents the second ACE project that the company is building at Drexel University and was awarded to the company in December 2012. A predevelopment agreement was executed in February 2013. PROJECTS UNDER CONSTRUCTION Project Project Type Location Primary University Served Units Beds CIP1 Land and Other2 Total Costs Incurred % Complete3 Scheduled Completion Manzanita Hall (Triad)4 ACE Tempe, AZ Arizona State Univ. 241 816 50,300 $ 18,558 $ 639 $ 19,197 $ 36% August 2013 The Callaway House Off-campus Austin, TX The Univ. of TX at Austin 219 753 60,100 26,291 762 27,053 50% August 2013 Chestnut Square ACE Philadelphia, PA Drexel Univ. 220 861 97,600 46,665 743 47,408 53% September 2013 U Club on Woodward Off-campus Tallahassee, FL Florida State Univ. 112 448 29,000 10,219 7,300 17,519 55% August 2013 Town. at Overton Park Off-campus Lubbock, TX Texas Tech Univ. 112 448 29,200 11,313 8,179 19,492 65% August 2013 601 Copeland Off-campus Tallahassee, FL Florida State Univ. 81 283 21,200 4,739 1,790 6,529 23% August 2013 University View (PVAMU Phase VII) ACE Prairie View, TX Prairie View A&M Univ. 96 336 15,600 4,183 226 4,409 31% August 2013 SUBTOTAL - 2013 DELIVERIES 1,081 3,945 303,000 $ 121,968 $ 19,639 $ 141,607 $ The Plaza on University5 Off-campus Orlando, FL Univ. of Central Florida 364 1,313 112,300 $ 3,961 $ 25,963 $ 29,924 $ 1% August 2014 SUBTOTAL - 2014 DELIVERIES 364 1,313 112,300 $ 3,961 $ 25,963 $ 29,924 $ OWNED DEVELOPMENT PIPELINE6 7 Project Project Type Location Primary University Served Approx. Targeted Beds Estimated Project Cost8 Targeted Completion Kennesaw State Univ. Phase II Off-campus Kennesaw, GA Kennesaw State Univ. 408 23,200 $ August 2014 Texas A&M University ACE College Station, TX Texas A&M Univ. 784 36,300 August 2014 Merwick Stanworth Housing9 ACE Princeton, NJ Princeton University 600 77,700 July 2014/2015 Lancaster Project10 ACE Philadelphia, PA Drexel Univ. 1,316 168,000 August 2015 USC Health Sciences Campus ACE Los Angeles, CA Univ. of So. California 460 49,000 TBD Carbondale Development Off-campus Carbondale, IL Southern Illinois Univ. 650 32,100 TBD 4,218 386,300 $ Q2 2013 TBD Q3 2013 Anticipated Commencement TBD Q2 2013 As of December 31, 2012 Estimated Project Cost Q2 2013
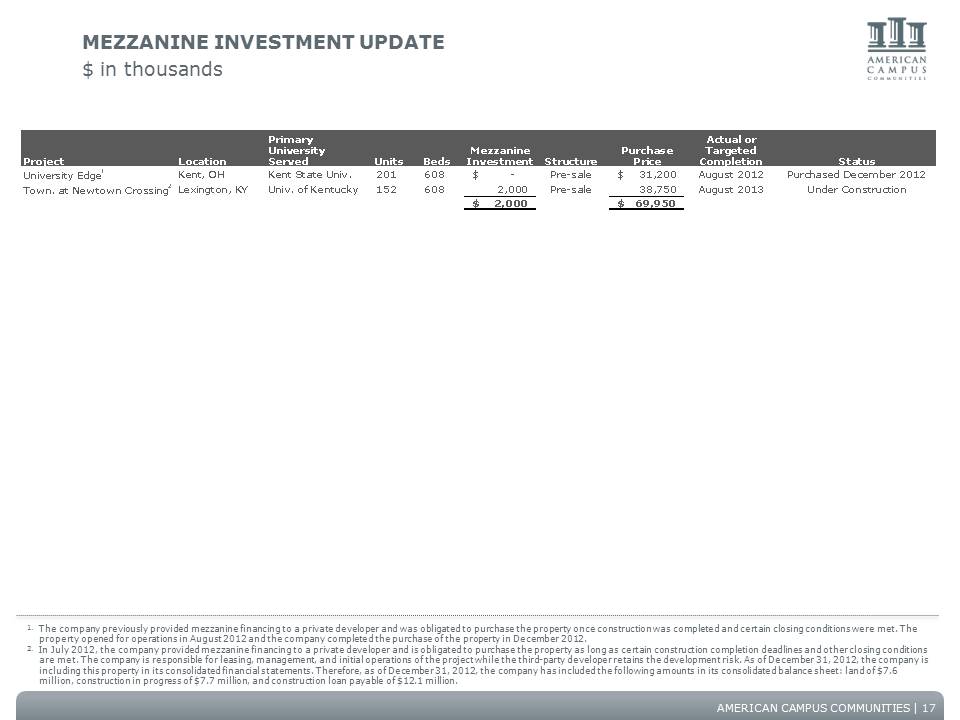
AMERICAN CAMPUS COMMUNITIES MEZZANINE INVESTMENT UPDATE $ in thousands Location Primary University Served Units Beds Mezzanine Investment Structure Purchase Price Actual or Targeted Completion Status University Edge1 Kent, OH Kent State Univ. 201 608 - $ Pre-sale 31,200 $ August 2012 Purchased December 2012 Town. at Newtown Crossing2 Lexington, KY Univ. of Kentucky 152 608 2,000 Pre-sale 38,750 August 2013 Under Construction 2,000 $ 69,950 $ Project 1. The company previously provided mezzanine financing to a private developer and was obligated to purchase the property once construction was completed and certain closing conditions were met. The property opened for operations in August 2012 and the company completed the purchase of the property in December 2012. 2. In July 2012, the company provided mezzanine financing to a private developer and is obligated to purchase the property as long as certain construction completion deadlines and other closing conditions are met. The company is responsible for leasing, management, and initial operations of the project while the third-party developer retains the development risk. As of December 31, 2012, the company is including this property in its consolidated financial statements. Therefore, as of December 31, 2012, the company has included the following amounts in its consolidated balance sheet: land of $7.6 million, construction in progress of $7.7 million, and construction loan payable of $12.1 million. 17
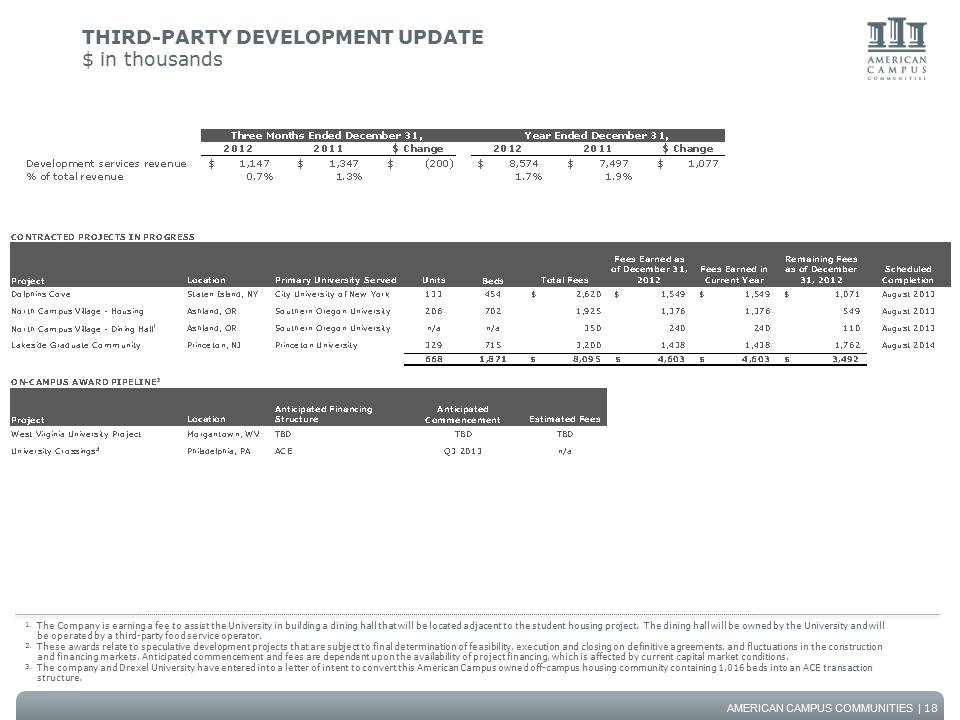
AMERICAN CAMPUS COMMUNITIES THIRD-PARTY DEVELOPMENT UPDATE $ in thousands 18 1. The Company is earning a fee to assist the University in building a dining hall that will be located adjacent to the student housing project. The dining hall will be owned by the University and will be operated by a third-party food service operator. 2. These awards relate to speculative development projects that are subject to final determination of feasibility, execution and closing on definitive agreements, and fluctuations in the construction and financing markets. Anticipated commencement and fees are dependent upon the availability of project financing, which is affected by current capital market conditions. 3. The company and Drexel University have entered into a letter of intent to convert this American Campus owned off-campus housing community containing 1,016 beds into an ACE transaction structure. CONTRACTED PROJECTS IN PROGRESS Project Location Primary University Served Units Beds Total Fees Fees Earned as of December 31, 2012 Fees Earned in Current Year Remaining Fees as of December 31, 2012 Scheduled Completion Dolphins Cove Staten Island, NY City University of New York 133 454 2,620 $ 1,549 $ 1,549 $ 1,071 $ August 2013 North Campus Village - Housing Ashland, OR Southern Oregon University 206 702 1,925 1,376 1,376 549 August 2013 North Campus Village - Dining Hall1 Ashland, OR Southern Oregon University n/a n/a 350 240 240 110 August 2013 Lakeside Graduate Community Princeton, NJ Princeton University 329 715 3,200 1,438 1,438 1,762 August 2014 668 1,871 8,095 $ 4,603 $ 4,603 $ 3,492 $ ON-CAMPUS AWARD PIPELINE2 Project Location Anticipated Financing Structure Estimated Fees West Virginia University Project Morgantown, WV TBD TBD University Crossings3 Philadelphia, PA ACE n/a Anticipated Commencement TBD Q3 2013 2012 2011 $ Change 2012 2011 $ Change Development services revenue 1,147 $ 1,347 $ (200) $ 8,574 $ 7,497 $ 1,077 $ % of total revenue 0.7% 1.3% 1.7% 1.9% Three Months Ended December 31, Year Ended December 31,
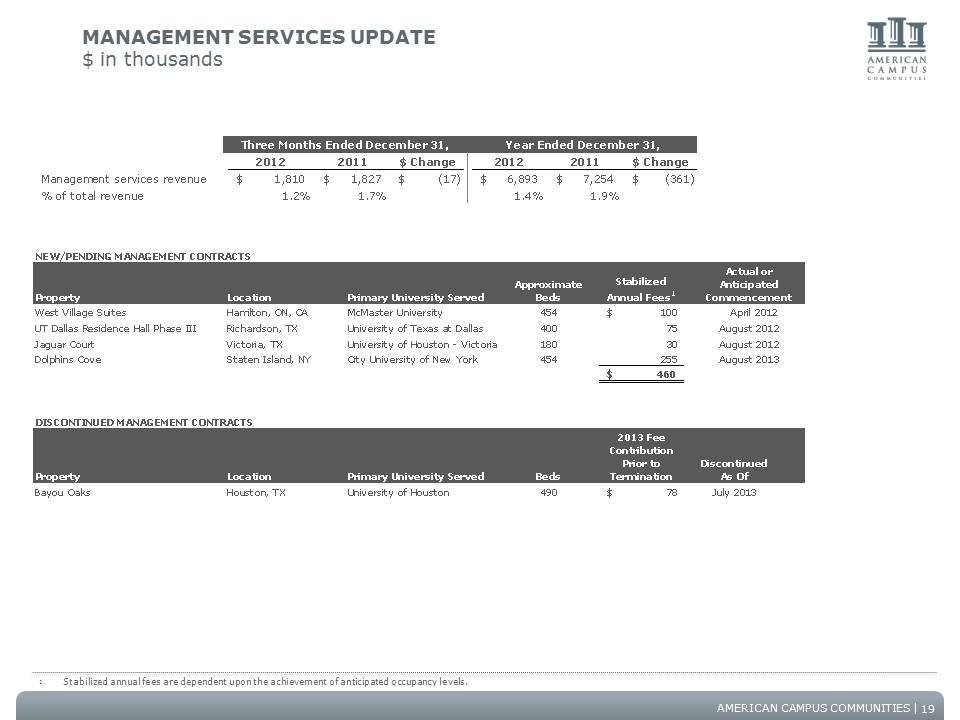
AMERICAN CAMPUS COMMUNITIES MANAGEMENT SERVICES UPDATE $ in thousands NEW/PENDING MANAGEMENT CONTRACTS Property Location Approximate Beds Stabilized Annual Fees1 West Village Suites Hamilton, ON, CA McMaster University 454 100 $ April 2012 UT Dallas Residence Hall Phase III Richardson, TX University of Texas at Dallas 400 75 Jaguar Court Victoria, TX University of Houston - Victoria 180 30 Dolphins Cove Staten Island, NY City University of New York 454 255 460 $ DISCONTINUED MANAGEMENT CONTRACTS Property Location Beds 2013 Fee Contribution Prior to Termination Discontinued As Of Bayou Oaks Houston, TX University of Houston 490 78 $ July 2013 Primary University Served Actual or Anticipated Commencement Primary University Served August 2012 August 2012 August 2013 19 2012 2011 $ Change 2012 2011 $ Change Management services revenue 1,810 $ 1,827 $ (17) $ 6,893 $ 7,254 $ (361) $ % of total revenue 1.2% 1.7% 1.4% 1.9% Year Ended December 31, Three Months Ended December 31, 1. Stabilized annual fees are dependent upon the achievement of anticipated occupancy levels.
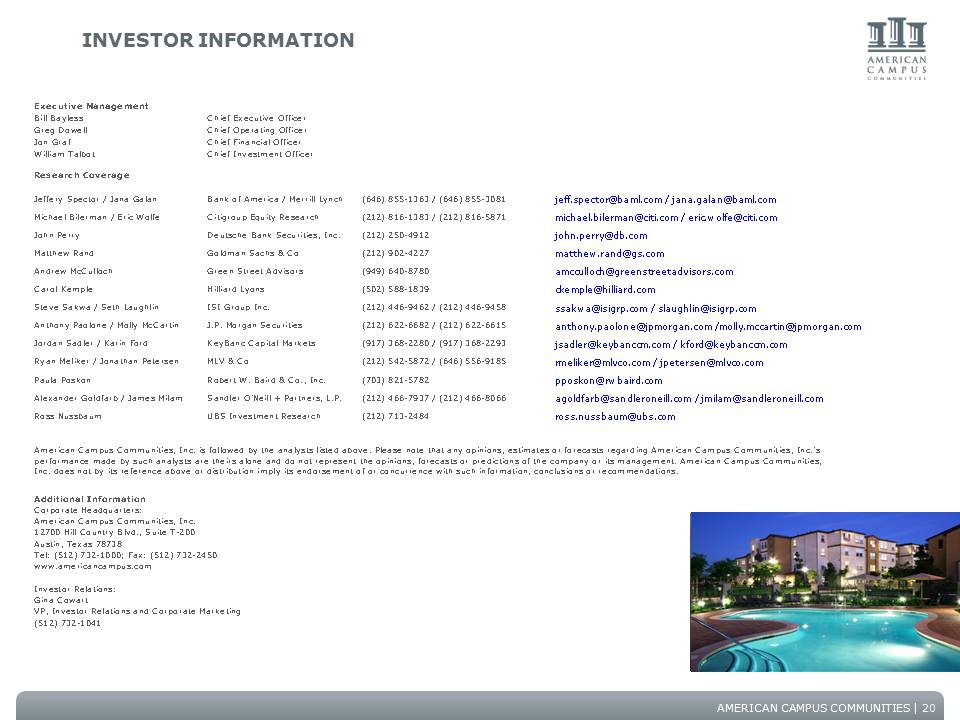
AMERICAN CAMPUS COMMUNITIES Executive Management Bill Bayless Chief Executive Officer Greg Dowell Chief Operating Officer Jon Graf Chief Financial Officer William Talbot Chief Investment Officer Research Coverage Jeffery Spector / Jana Galan Bank of America / Merrill Lynch (646) 855-1363 / (646) 855-3081 jeff.spector@baml.com / jana.galan@baml.com Michael Bilerman / Eric Wolfe Citigroup Equity Research (212) 816-1383 / (212) 816-5871 michael.bilerman@citi.com / eric.wolfe@citi.com John Perry Deutsche Bank Securities, Inc. (212) 250-4912 john.perry@db.com Matthew Rand Goldman Sachs & Co (212) 902-4227 matthew.rand@gs.com Andrew McCulloch Green Street Advisors (949) 640-8780 amcculloch@greenstreetadvisors.com Carol Kemple Hilliard Lyons (502) 588-1839 ckemple@hilliard.com Steve Sakwa / Seth Laughlin ISI Group Inc. (212) 446-9462 / (212) 446-9458 ssakwa@isigrp.com / slaughlin@isigrp.com Anthony Paolone / Molly McCartin J.P. Morgan Securities (212) 622-6682 / (212) 622-6615 anthony.paolone@jpmorgan.com /molly.mccartin@jpmorgan.com Jordan Sadler / Karin Ford KeyBanc Capital Markets (917) 368-2280 / (917) 368-2293 jsadler@keybanccm.com / kford@keybanccm.com Ryan Meliker / Jonathan Petersen MLV & Co (212) 542-5872 / (646) 556-9185 rmeliker@mlvco.com / jpetersen@mlvco.com Paula Poskon Robert W. Baird & Co., Inc. (703) 821-5782 pposkon@rwbaird.com Alexander Goldfarb / James Milam Sandler O'Neill + Partners, L.P. (212) 466-7937 / (212) 466-8066 agoldfarb@sandleroneill.com / jmilam@sandleroneill.com Ross Nussbaum UBS Investment Research (212) 713-2484 ross.nussbaum@ubs.com Investor Relations: Gina Cowart VP, Investor Relations and Corporate Marketing (512) 732-1041 12700 Hill Country Blvd., Suite T-200 Austin, Texas 78738 Tel: (512) 732-1000; Fax: (512) 732-2450 www.americancampus.com American Campus Communities, Inc. is followed by the analysts listed above. Please note that any opinions, estimates or forecasts regarding American Campus Communities, Inc.'s performance made by such analysts are theirs alone and do not represent the opinions, forecasts or predictions of the company or its management. American Campus Communities, Inc. does not by its reference above or distribution imply its endorsement of or concurrence with such information, conclusions or recommendations. Additional Information Corporate Headquarters: American Campus Communities, Inc. INVESTOR INFORMATION 20
AMERICAN CAMPUS COMMUNITIES FORWARD-LOOKING STATEMENT In addition to historical information, this supplemental package contains forward-looking statements under the federal securities law. These statements are based on current expectations, estimates and projections about the industry and markets in which American Campus operates, management's beliefs, and assumptions made by management. Forward-looking statements are not guarantees of future performance and involve certain risks and uncertainties, which are difficult to predict.