Attached files
| file | filename |
|---|---|
| 8-K - FORM 8-K - United Financial Bancorp, Inc. | d483975d8k.htm |
 Forward Looking Statements
Certain
comments
made
in
the
course
of
this
presentation
by
UBNK
may
be
forward-looking
in
nature.
These
include
all
statements
about
realizing
cost
savings
in
connection
with
our
recent
acquisition,
UBNK’s
operating
results
or financial condition for periods ending or on dates occurring after December 31,
2012 and usually use words such as “expect”, “anticipate”, “believe”, and similar expressions. These comments represent management’s current
beliefs, based upon information available to it at the time the statements are made
with regard to the matters addressed. All forward looking statements are
subject to risks and uncertainties that could cause UBNK’s actual results or financial condition to differ materially from those expressed in or implied by such statements. Factors of particular
importance to UBNK include, but are not limited to: (1) changes in general economic
conditions, including interest rates; (2) competition among providers of financial services; (3) changes in the interest rate environment that
reduce
our
margins
or
reduce
the
fair
value
of
financial
instruments;
(4)
adverse
changes
in
the
securities
markets;
and
(5)
our
ability
to
enter
new
markets
successfully
and
capitalize
on
growth
opportunities.
UBNK
does
not
undertake any obligation to update or revise any forward-looking statements,
whether as a result of new information, future events or otherwise. Holding
Company for NASDAQ: UBNK
Sterne Agee & Leach Conference
Miami, FL
February 11-13, 2013 |
 Building a
Regional Community Bank Franchise 2 |
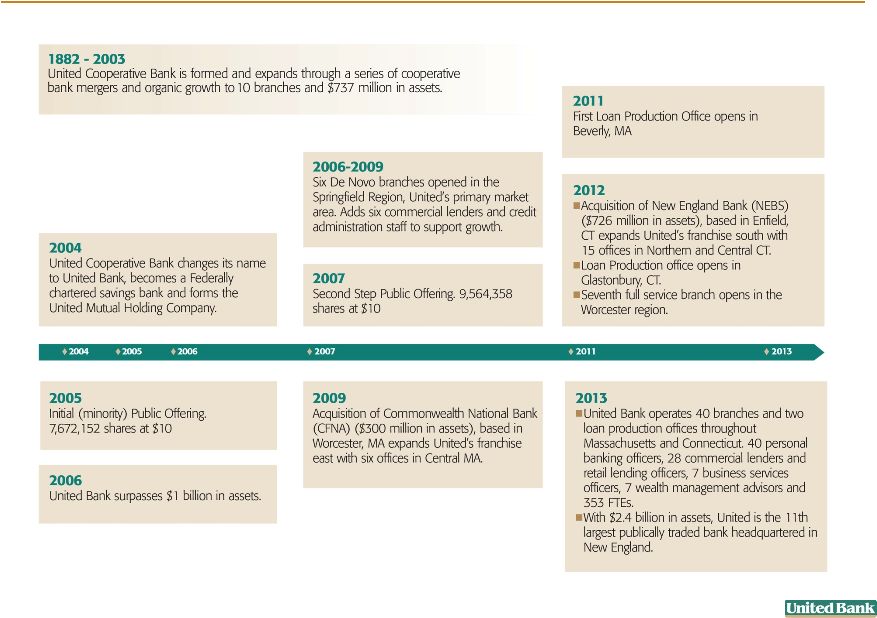 History of
Expansion through Organic Growth and Acquisitions 3 |
 Strategic
Rationale for NEBS Merger 4
Strategic Acquisition That Improves Franchise Value
•
Immediate scale and strong footprint in markets with attractive demographic profile
•
Gives UBNK a significant presence along the I-91 Corridor
•
Strategic expansion consistent with UBNK’s business plan
•
Low execution risk given expansion into contiguous market and similar business mix
Improved Scale
•
$2.4 billion in combined assets
•
Larger capital base provides the opportunity to compete for larger lending opportunities
Strong Transaction Fundamentals
•
Greater than 20% earnings accretion in 2013 based on realistic and achievable cost savings
and no revenue enhancements
•
Reasonable tangible book value dilution of approximately 9% projected with acceptable
incremental earn back period (approximately 5.5 years) |
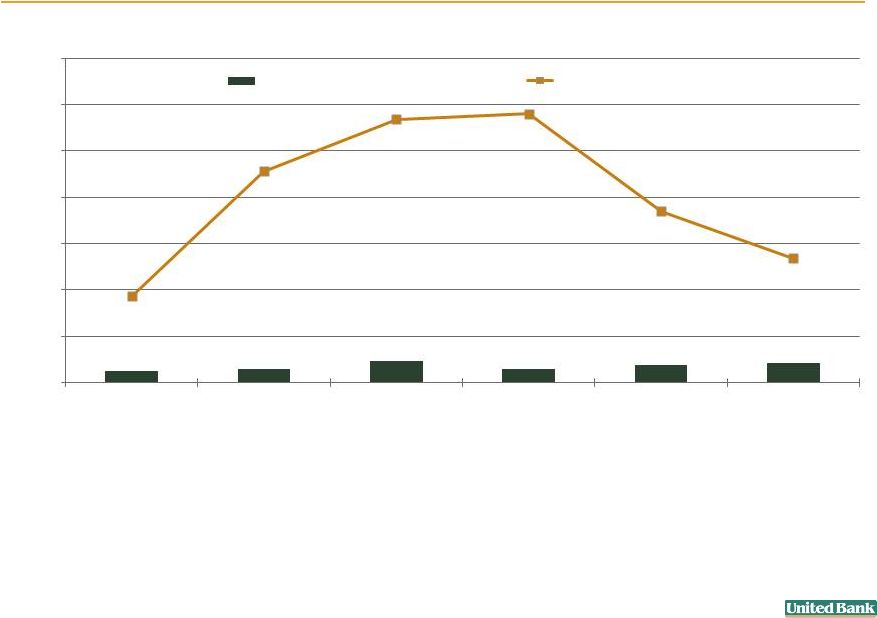
 Asset
Quality-Non Performing Loans 5
0.00%
0.50%
1.00%
1.50%
2.00%
2.50%
3.00%
3.50%
4.00%
4.50%
5.00%
Non-performing Loans/Total Loans
National average |
 Asset
Quality
-
Net
Charge-Offs
6
0.00%
0.50%
1.00%
1.50%
2.00%
2.50%
3.00%
3.50%
2007Y
2008Y
2009Y
2010Y
2011Y
2012Y
Net Charge-offs to Avg Loans
National average |
 Credit Mark NEBS
Acquisition (000’s) 7
United Pre-Merger ALLL
$12,089
NEB Pre-Merger ALLL
$ 5,002
Elimination of NEB ALLL
($5,002)
Credit Mark for NEB loans
$12,424
Credit Mark Pre-Merger
$ 1,320
TOTAL “COVERAGE”
$25,833 |
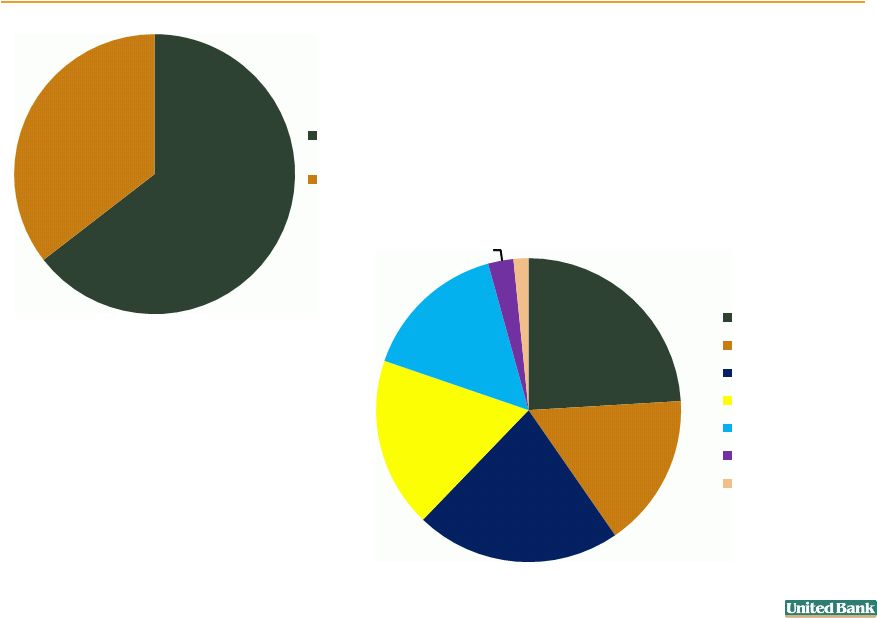
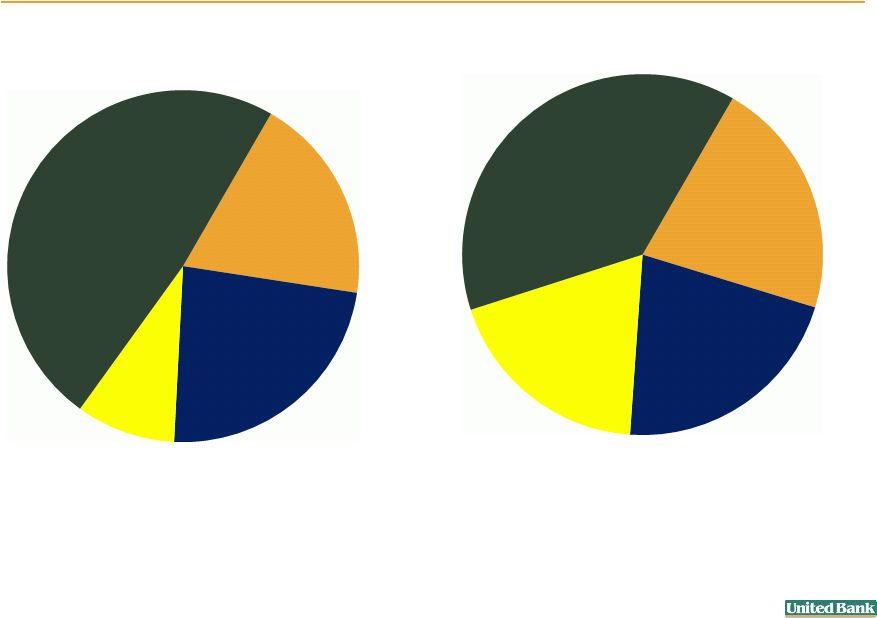
 Loan Mix as of
December 31, 2012 (in millions)
Shift Toward Bank-Like Mix for Loans
Total Loans $1,816.1
QTD Yield 4.65%
Loan Mix as of December 31, 2007
(in millions)
Total Loans $824.7
QTD Yield 6.24%
1-4 Family RE
41%
Multifamily &
Commerical RE
26%
Construction
5%
Commercial
10%
Consumer & HE
18%
1-4 Family RE
24%
Multifamily & Commercial RE
45%
Construction
3%
Commercial
17%
Consumer & HE
11%
8
$339.5
$146.8
$81.6
$214.8
$42.0
$441.9
$306.2
$814.7
$200.5
$52.8 |
 9
$526
$289
CRE Loans-
Investor
CRE Loans-Owner
Occupied
$196
$133
$178
$147
$126
$22
$13
Other
Apartments
Industrial
Retail
Office
Hospitality
Retail Petroleum
Commercial
Real
Estate
Portfolio
Analysis
–
CRE
Concentration
=
226% |
 Deposit Mix as
of December 31, 2012 (in millions)
$395.3
Total Deposits $1,848.2, 62% Core Deposits
QTD Cost of Deposits 0.68%
$137.2
Deposit Mix as of December 31, 2007
(in millions)
Total Deposits $718.7, 52% Core Deposits
QTD Cost of Deposits 3.11%
$347.7
$168.1
$65.7
$350.2
$707.4
$395.3
10
Strong and Balanced Deposit Base with 38% Reliance on CDs
Transaction
19%
Money Market
24%
Savings
9%
CDs
48%
Transaction
21%
Money Market
22%
Savings
19%
CDs
38% |
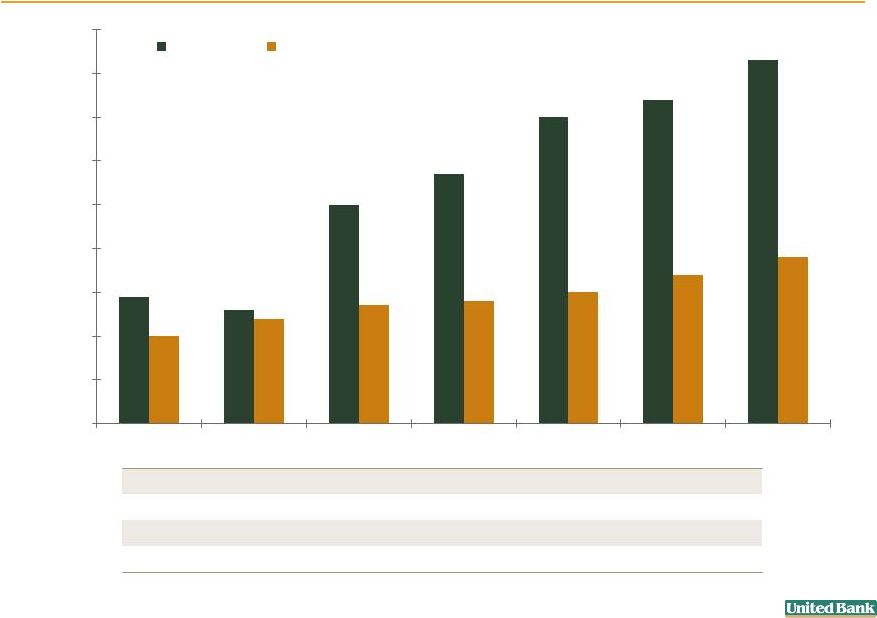
 Annual
Core
Net
Income
&
Earnings
Per
Share
(1)
5 YR CAGR = EPS 26.1%, Net Income 24.0%
11
(1)
Please refer to appendix for the reconciliation of GAAP and non-GAAP results.
0
2,000
4,000
6,000
8,000
10,000
12,000
14,000
$0.26
$0.50
$0.57
$0.70
$0.74
$0.83
$0.00
$0.25
$0.50
$0.75
$1.00
2007Y
2008Y
2009Y
2010Y
2011Y
2012Y
Core Net Income
Core EPS |
 Dividend
History & Share Buybacks (1)
(1)
Please refer to appendix for the reconciliation of GAAP and non-GAAP
results (2)
Includes ESOP Plan Termination Share Repurchases as of 12/31/2012
Shares Repurchased
2008
2009
2010
2011
2012
Total
Amount (2)
261,798
1,537,787
798,242
396,209
1,120,274
4,114,310
$ Value (2)
$ 3,496,920
$ 20,593,752
$ 10,849,879
$ 6,042,446
$ 17,446,813
$ 58,429,810
Dividend $ Payout
$ 4,436,000
$ 4,238,000
$ 4,589,000
$ 5,067,000
$ 5,520,806
$ 23,850,806
12
$0.00
$0.10
$0.20
$0.30
$0.40
$0.50
$0.60
$0.70
$0.80
$0.90
Core EPS
Dividends per share
$0.29
$0.26
$0.50
$0.57
$0.70
$0.74
$0.83
$0.20
$0.24
$0.27
$0.28
$0.30
$0.34
$0.38
2006Y
2007Y
2008Y
2009Y
2010Y
2011Y
2012Y |
 Financial
Performance (1)
2006
2007
2008
2009
2010
2011
2012
Earnings Data (in mm except EPS):
Core Net Income
4.9
$
4.4
$
8.1
$
8.7
$
10.9
$
11.2
$
12.8
$
Core Earnings Per Share
$0.29
$0.26
$0.50
$0.57
$0.70
$0.74
$0.83
Net Interest Income
27.6
$
29.2
$
39.8
$
41.0
$
52.9
$
52.8
$
56.2
$
Provision for Loan Losses
1.0
1.4
1.8
3.0
2.3
3.2
3.1
Normalized Non-interest Income
5.4
5.7
6.6
8.7
8.7
9.3
10.8
Normalized Non-interest Expenses
24.0
26.0
30.7
33.5
42.7
44.1
46.6
Profitability Data and Ratios:
Average Earning Assets (mm)
$926
$1,001
$1,147
$1,208
$1,448
$1,504
$1,893
Net Interest Margin
2.97%
2.91%
3.47%
3.39%
3.65%
3.51%
3.43%
Efficiency Ratio
72.95%
74.02%
66.16%
68.49%
69.55%
71.08%
70.49%
Asset Quality:
Non-performing Assets/Total Assets
0.18%
0.25%
0.46%
1.16%
0.69%
0.65%
0.72%
Allowance for Loan Losses/ Total Loans
(excluding purchased loans)
0.95%
0.94%
0.95%
1.07%
1.18%
1.17%
1.05%
Net Charge-offs/Total Average Loans
0.02%
0.12%
0.15%
0.23%
0.13%
0.19%
0.18%
Capital:
Tangible Equity/Tangible Assets
13.65%
20.95%
18.03%
14.13%
13.54%
13.53%
11.11%
Tangible Book Value Per Share
8.03
$
12.73
$
13.01
$
12.93
$
13.30
$
13.90
$
12.99
$
Dividends Per Share
0.20
$
0.24
$
0.27
$
0.28
$
0.30
$
0.34
$
0.38
$
Period End Stock Price
13.80
$
11.10
$
15.14
$
13.11
$
15.27
$
16.09
$
15.72
$
(1)
Please refer to the appendix for the reconciliation of GAAP and non-GAAP
results. 13 |
 Net Interest
Margin 14
2.91%
3.47%
3.39%
3.65%
3.51%
3.43%
0.00%
0.50%
1.00%
1.50%
2.00%
2.50%
3.00%
3.50%
4.00%
2007Y
2008Y
2009Y
2010Y
2011Y
2012Y |
 Efficiency
Ratio (1)
15
(1)
Please refer to the appendix for the reconciliation of GAAP and non-GAAP
results. 74.02%
66.16%
68.49%
69.55%
71.08%
70.49%
50.00%
55.00%
60.00%
65.00%
70.00%
75.00%
80.00%
2007Y
2008Y
2009Y
2010Y
2011Y
2012Y |
 Total Assets (5
Year CAGR = 17.4%) 16
$1,079,281
$1,263,134
$1,541,040
$1,584,877
$1,623,522
$2,402,464
$600,000
$900,000
$1,200,000
$1,500,000
$1,800,000
$2,100,000
$2,400,000
2007Y
2008Y
2009Y
2010Y
2011Y
2012Y |
 Tangible
Equity/Tangible
Assets
(1)
17
(1)
Please refer to the appendix for the reconciliation of GAAP and non-GAAP
results. 20.95%
18.03%
14.13%
13.54%
13.53%
11.11%
0.00%
5.00%
10.00%
15.00%
20.00%
25.00%
2007Y
2008Y
2009Y
2010Y
2011Y
2012Y |
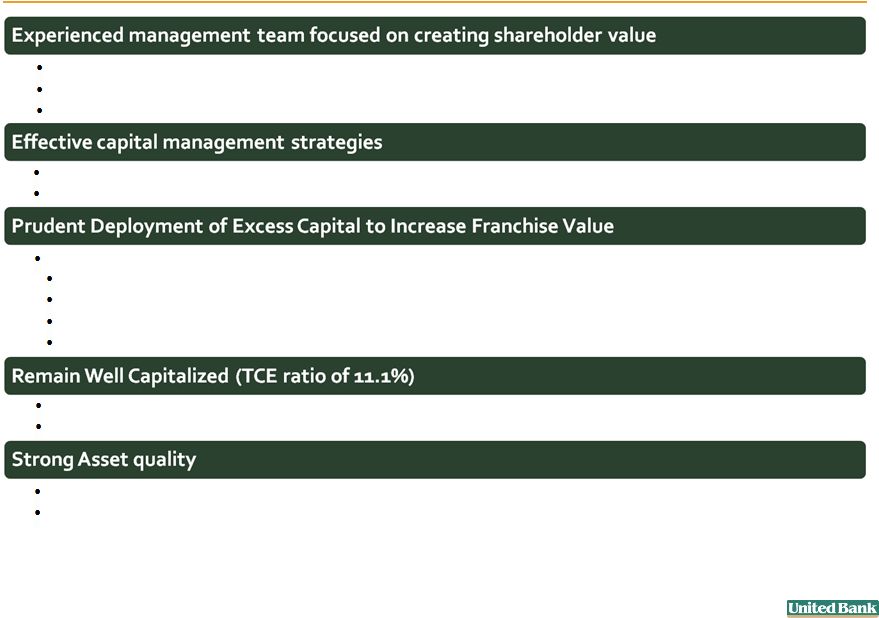 Summary
–
Why
Invest
In
UBNK?
18
Acquisition of CNB Financial in November, 2009
Acquisition of New England Bancshares in November, 2012
New loan production offices: Beverly, MA (2011) and Glastonbury,
CT (Q3 2012)
New branch opened in Northborough, MA (December, 2012)
Strategic transactions that further demonstrate UBNK’s strategy to expand its franchise
into attractive markets Successful stock repurchase program (acquired 4.1 million
shares at an average price of $14.20 since June 2008)
Competitive dividend yield (2.67% as of 01/31/13)
Superior
return
on
your
investment:
CAGR
6.8%
vs.
S&P
CAGR
2.1%
August,
2005
–
December,
2012
(excl.
dividends)
Good track record of increasing dividends (quarterly dividends increased 100% since February,
2006) Increased quarterly cash dividend by 11% to $0.10 per share in July, 2012
Ability and capacity to continue to execute capital deployment strategies
Well positioned for organic and strategic growth opportunities
Largest five NPLs comprise 39% of 12/31/12 total (workout strategies in place)
85%
of Investment portfolio is agency backed |
 Appendix
19 |
 Reconciliation
of GAAP and Non-GAAP Results 20
($ in thousands)
2006
2007
2008
2009
2010
2011
2012
Non-Interest Income (GAAP)
5,392
5,735
5,220
8,676
8,716
9,343
10,623
Other Than Temporary Impairment Charge
-
-
1,377
-
-
-
202
Adjusted Non-Interest Income (Non-GAAP)
5,392
5,735
6,597
8,676
8,716
9,343
10,825
Non-Interest Expense (GAAP)
24,036
26,039
30,690
36,858
43,841
44,062
56,240
Acquisition Costs
-
-
-
(2,863)
(1,148)
-
(4,952)
ESOP Plan Termination
-
-
-
-
-
-
(4,482)
FHLBB Prepayment Penalty
-
-
-
-
-
-
(207)
Special FDIC Insurance Assessment
-
-
-
(538)
-
-
-
Adjusted Non-Interest Expense (Non-GAAP)
24,036
26,039
30,690
33,458
42,693
44,062
46,599
Net Income (GAAP)
4,924
4,377
7,298
5,806
10,032
11,184
3,628
Adjustments to GAAP Net Income:
Other Than Temporary Impairment Charge
-
-
1,377
-
-
-
202
Acquisition Costs
-
-
-
2,863
1,148
-
4,952
ESOP Plan Termination
-
-
-
-
-
-
4,482
FLHBB Prepayment Penalty
-
-
-
-
-
-
207
Special FDIC Assessment
-
-
-
538
-
-
-
Income
Tax
Effect
-
All
Items
-
-
(527)
(556)
(329)
-
(660)
Core Net Income (Non-GAAP)
4,924
4,377
8,148
8,650
10,851
11,184
12,811
Per Share Data:
Diluted earnings per share (GAAP)
0.29
$
0.26
$
0.44
$
0.38
$
0.65
$
0.74
$
0.24
$
Core Diluted earnings per share (Non-GAAP)
0.29
$
0.26
$
0.50
$
0.57
$
0.70
$
0.74
$
0.83
$
Performance Ratios (annualized):
Return on average assets (GAAP)
0.51%
0.42%
0.62%
0.46%
0.65%
0.70%
0.21%
Return on average assets (Normalized)
0.51%
0.42%
0.69%
0.68%
0.71%
0.70%
0.73%
Return on average equity (GAAP)
3.59%
2.99%
3.23%
2.67%
4.49%
4.94%
1.51%
Return on average equity (Normalized)
3.59%
2.99%
3.60%
3.97%
4.85%
4.94%
5.34%
Efficiency ratio (GAAP)
72.95%
74.02%
66.16%
75.45%
71.42%
71.08%
85.08%
Efficiency ratio (Normalized)
72.95%
74.02%
66.16%
68.49%
69.55%
71.08%
70.49%
At or For the Years Ended December 31,
The following table presents reconciliations of the company's GAAP and
Non-GAAP (Normalized) results for the applicable periods. |
 Reconciliation
of GAAP and Non-GAAP Results 21
($ in thousands)
2006
2007
2008
2009
2010
2011
2012
Total Loans (Gross)
762,113
824,695
870,276
1,122,241
1,074,111
1,121,879
1,816,076
Acquired Loans
-
-
-
(242,930)
(209,785)
(148,925)
(659,614)
Purchased Loans (GE Loans)
-
-
-
(22,655)
(21,448)
(19,066)
(5,021)
Total Loans (Non-GAAP)
762,113
824,695
870,276
856,656
842,878
953,888
1,151,441
Total Equity
137,711
226,120
227,714
225,246
222,576
227,361
307,189
Goodwill
-
-
-
(7,844)
(8,192)
(8,192)
(40,824)
Other Intangible Assets
-
-
-
(927)
(976)
(752)
(4,514)
Tangible Equity (Non-GAAP)
137,711
226,120
227,714
216,475
213,408
218,417
261,851
Total Assets
1,009,433
1,079,281
1,263,134
1,541,040
1,584,877
1,623,522
2,402,464
Goodwill
-
-
-
(7,844)
(8,192)
(8,192)
(40,824)
Other Intangible Assets
-
-
-
(927)
(976)
(752)
(4,514)
Tangible Assets (Non-GAAP)
1,009,433
1,079,281
1,263,134
1,532,269
1,575,709
1,614,578
2,357,126
Asset Quality:
Allowance for Loan Losses/Total Loans
0.95%
0.94%
0.95%
0.82%
0.93%
0.99%
0.67%
Allowance for Loan Losses/Total Loans excl. Purchased Loans
0.95%
0.94%
0.95%
1.07%
1.18%
1.17%
1.05%
Capital:
Total Equity/Total Assets
13.65%
20.95%
18.03%
14.62%
14.04%
14.00%
12.79%
Tangible Equity/Tangible Assets
13.65%
20.95%
18.03%
14.13%
13.54%
13.53%
11.11%
Book Value Per Share
8.03
$
12.73
$
13.01
$
13.38
$
13.82
$
14.47
$
15.24
$
Tangible Book Value Per Share
8.03
$
12.73
$
13.01
$
12.93
$
13.30
$
13.90
$
12.99
$
At or For the Years Ended December 31,
The following table presents reconciliations of the company's GAAP and
Non-GAAP (Normalized) results for the applicable periods. |
 FOR
QUESTIONS, PLEASE CONTACT: Dena M. Hall, SVP, Marketing and Investor Relations
(413) 787-
1292
dhall@bankatunited.com
Mark A. Roberts, EVP and Chief Financial Officer
(413) 787-1201
mroberts@bankatunited.com
Thank you.
22 |