Attached files
| file | filename |
|---|---|
| 8-K - 8-K - Guaranty Bancorp | a13-4813_18k.htm |
Exhibit 99.1
|
|
Sterne Agee 2013 Financial Institutions Investor Conference Miami, Florida February 12, 2013 |
|
|
2 Forward Looking Statements This presentation contains forward-looking statements, which are included in accordance with the “safe harbor” provisions of the Private Securities Litigation Reform Act of 1995. In some cases, you can identify forward-looking statements by terminology such as “may,” “will,” “should,” “could,” “can,” “expects,” “plans,” “intends,” “anticipates,” “believes,” “estimates,” “predicts,” “potential,” or “continue,” or the negative of such terms and other comparable terminology. These forward-looking statements involve known and unknown risks, uncertainties and other factors that may cause the Company’s actual results, performance or achievements to be materially different from any future results, performance or achievements expressed or implied by such forward-looking statements. Such factors include, among others, the following: failure to maintain adequate levels of capital and liquidity to support Company’s operations; general economic and business conditions in those areas in which the Company operates; success of any future acquisitions; demographic changes; competition; fluctuations in interest rates; continued ability to attract and employ qualified personnel; ability to receive regulatory approval for our bank subsidiary to declare dividends to the Company; adequacy of our allowance for loan losses, changes in credit quality and the effect of credit quality on our provision for credit losses and allowance for loan losses; changes in governmental legislation or regulation, including, but not limited to, any increase in FDIC insurance premiums and regulatory capital standards; changes in accounting policies and practices; changes in business strategy or development plans; changes in the securities markets; changes in consumer spending, borrowing and savings habits; the availability of capital from private or government sources; competition for loans and deposits and failure to attract or retain loans and deposits; changes in the financial performance and/or condition of our borrowers and the ability of our borrowers to perform under the terms of their loans and other terms of credit agreements; political instability, acts of war or terrorism and natural disasters; and additional “Risk Factors” referenced in the Company’s most recent Annual Report on Form 10-K filed with the Securities and Exchange Commission, as supplemented from time to time. When relying on forward-looking statements to make decisions with respect to the Company, investors and others are cautioned to consider these and other risks and uncertainties. The Company can give no assurance that any goal or plan or expectation set forth in forward-looking statements can be achieved and readers are cautioned not to place undue reliance on such statements, which speak only as of the date made. The forward-looking statements are made as of the date of these materials, and the Company does not intend, and assumes no obligation, to update the forward-looking statements or to update the reasons why actual results could differ from those projected in the forward-looking statements. Investors and security holders are urged to read the Company’s Annual Report on Form 10-K, quarterly reports on Form 10-Q and other documents filed by the Company with the SEC. The documents filed by the Company with the SEC may be obtained at the Company’s website at www.gbnk.com or at the SEC's website at www.sec.gov. These documents may also be obtained free of charge from the Company by directing a request to: Guaranty Bancorp, 1331 Seventeenth St., Suite 345, Denver, CO 80202, Attention: Christopher Treece/Investor Relations; Telephone 303-675-1194. |
|
|
1 Closing Price on February 1, 2013 2 As of December 31, 2012 3 Based on 105,847,607 Shares Outstanding (Voting and Non-Voting) on December 31, 2012 4 See the accompanying reconciliation of non-GAAP measurements to GAAP. 3 A Colorado Community Bank NASDAQ Ticker: GBNK Recent Price: $ 2.091 Tangible Book Value: $ 1.69 2, 4 Market Capitalization: $ 221.2 million 1, 3 Total Risk-Based Capital Ratio: 16.27% 2 Tangible Common Equity Ratio: 9.53%2, 4 GAAP Equity Ratio: 9.97%2 Asset Size: $ 1.9 billion 2 Gross Loans: $ 1.2 billion 2 Total Deposits: $ 1.5 billion 2 Company Highlights |
|
|
4 Guaranty Bancorp is uniquely positioned in the Colorado market: Strategically located on the thriving Colorado Front Range, which encompasses 85% of the state’s population A Colorado community bank that has been committed to serving its customers for more than 50 years Poised to capitalize on market dislocation and big bank discontent Commercial and retail offerings delivered through a comprehensive network of branches About Us |
|
|
5 Investment Considerations Earnings momentum Two consecutive years of incremental growth in net income Loan growth Net loan growth of $60.6 million, or 5.5%, during 2012 despite decline in purchased participations of $71.5 million Commercial loans grew $45.1 million, or 27.6%, excluding energy loans Continued asset quality improvement Classified assets decreased $24.7 million, or 29.6%, in 2012 Classified asset ratio fell to 25.2% at December 31, 2012 compared to 36.6% at December 31, 2011 Sale of the single largest OREO property of $10.9 million in January 2013; pro-forma 12/31/12 classified asset and Texas ratios further declined to 20.5% and 9.72%, respectively Strong core deposit mix and growth Core deposits increased by $153.6 million, or 13.8%, during 2012 Noninterest bearing deposits comprised 38.8% of total deposits at December 31, 2012 |
|
|
1 See accompanying reconciliation of non-GAAP measurements to GAAP. 6 Strong capital structure supportive of future growth Tangible Common Equity ratio of 9.53%1 as of December 31, 2012 Total Risk-Based Capital ratio of 16.27% as of December 31, 2012 The Company did not participate in either TARP or SBLF Continued focus on expense management Closed six underperforming branches in 2012 Reduce troubled asset related expenses Planned redemption of $15 million of high cost trust preferred borrowings in first quarter 2013 Expected future annual savings of $1.6 million Total risk-based and tier-one risk based capital ratios are expected to decline approximately one percent following redemption, leaving the Company with capital levels well above regulatory requirements Well positioned for anticipated market consolidation Investment Considerations |
|
|
7 Private Capital Management Acquisition Acquired Denver-based wealth management firm July 31, 2012 Performance As of January 31, 2013, assets under management have grown $29.3 million or 17.8% since acquisition Expectation that 2013 fee income will be bolstered by organic growth, referrals and the performance of the equity capital markets should they continue to advance Benefits Rounds out existing trust and private banking wealth management platform Wealth Management platform can be leveraged to grow noninterest income Potential cross-referral opportunities for other banking services Favorable impact to EPS Led by a seasoned wealth management expert who is a leader in the community |
|
|
8 Deposit Composition December 31, 2012 Deposits by Product Deposits by Business Line |
|
|
9 Deposit Trends |
|
|
10 December 31, 2012 Loans by Type Loan Composition Loans by Business Line |
|
|
11 CRE Lending Capacity |
|
|
Loan Portfolio Activity1 ($ in thousands) 12 1 Excludes Loans Held for Sale 2010 YTD 2011 YTD 2012 YTD Loans - Beginning Balance $1,519,608 $1,204,580 $1,098,140 New Credit Extended and Advances on Existing Lines 276,604 388,088 522,679 Net Paydowns & Maturities (505,078) (457,442) (450,623) Net Loan Charge-Offs (39,322) (17,408) (7,519) Transfers to OREO (47,232) (19,678) (3,928) Loans - Ending Balance $1,204,580 $1,098,140 $1,158,749 |
|
|
13 Note: Classified Assets / Tier 1 Capital + ALLL is computed for our subsidiary bank, Guaranty Bank and Trust Company. Classified Asset Improvement ($ in thousands) |
|
|
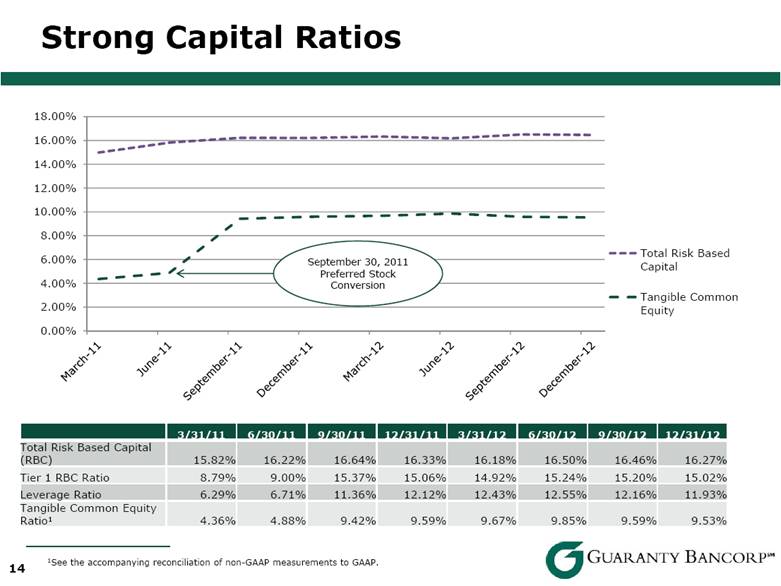
14 3/31/11 6/30/11 9/30/11 12/31/11 3/31/12 6/30/12 9/30/12 12/31/12 Total Risk Based Capital (RBC) 15.82% 16.22% 16.64% 16.33% 16.18% 16.50% 16.46% 16.27% Tier 1 RBC Ratio 8.79% 9.00% 15.37% 15.06% 14.92% 15.24% 15.20% 15.02% Leverage Ratio 6.29% 6.71% 11.36% 12.12% 12.43% 12.55% 12.16% 11.93% Tangible Common Equity Ratio1 4.36% 4.88% 9.42% 9.59% 9.67% 9.85% 9.59% 9.53% 1See the accompanying reconciliation of non-GAAP measurements to GAAP. Strong Capital Ratios |
|
|
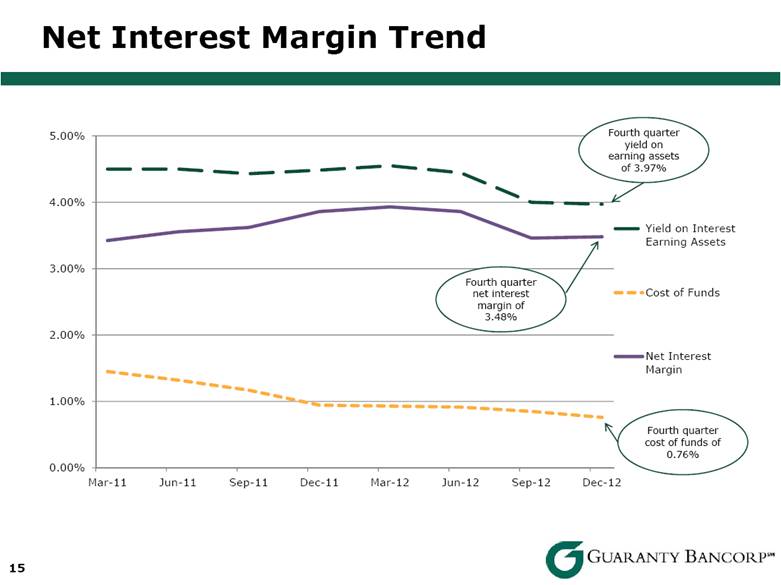
15 Fourth quarter yield on earning assets of 3.97% Net Interest Margin Trend |
|
|
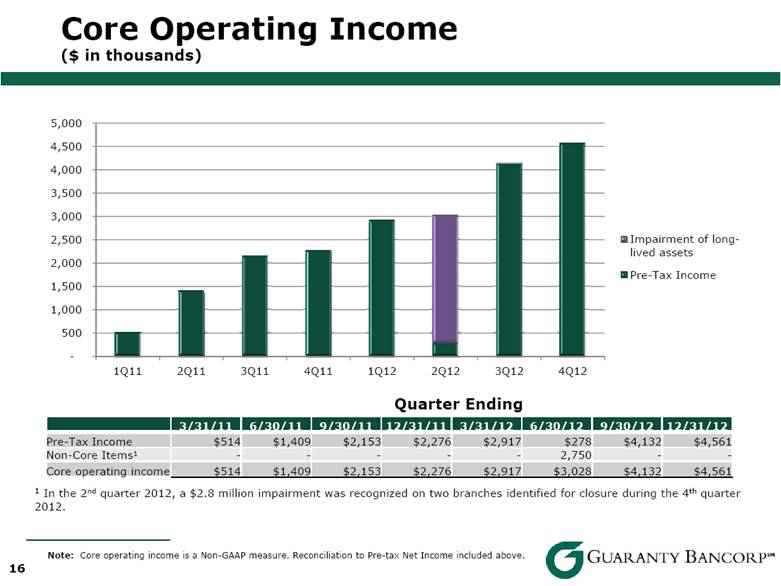
16 3/31/11 6/30/11 9/30/11 12/31/11 3/31/12 6/30/12 9/30/12 12/31/12 Pre-Tax Income $514 $1,409 $2,153 $2,276 $2,917 $278 $4,132 $4,561 Non-Core Items1 - - - - - 2,750 - - Core operating income $514 $1,409 $2,153 $2,276 $2,917 $3,028 $4,132 $4,561 Quarter Ending Note: Core operating income is a Non-GAAP measure. Reconciliation to Pre-tax Net Income included above. 1 In the 2nd quarter 2012, a $2.8 million impairment was recognized on two branches identified for closure during the 4th quarter 2012. Core Operating Income ($ in thousands) |
|
|
Income Statement and Balance Sheet Trends ($ in thousands) 17 3/30/11 6/30/11 9/30/11 12/31/11 3/31/12 6/30/12 9/30/12 12/31/12 Income Statement (summary) Net Interest Income $ 14,710 $ 14,747 $ 15,112 $ 15,325 $ 15,300 $ 15,383 $ 14,511 $ 15,217 Provision for Loan Losses 2,000 1,000 1,000 1,000 1,000 500 - (3,500) Noninterest Income 3,280 2,336 5,529 2,800 3,099 2,911 3,815 3,766 Noninterest Expense 15,476 14,674 17,488 14,849 14,482 17,516 14,194 17,922 Income Tax Expense (Benefit) - - - - - (5,914) 1,302 1,441 Net Income $ 514 $ 1,409 $ 2,153 $ 2,276 $ 2,917 $ 6,192 $ 2,830 $ 3,120 Balance Sheet (summary) Cash and time deposits with banks $ 184,777 $ 134,896 $ 93,226 $ 109,225 $ 105,273 $ 142,133 $ 167,823 $ 171,217 Investments 409,126 408,806 314,420 386,141 401,357 398,151 436,386 458,927 Loans 1,126,083 1,091,132 1,088,358 1,098,140 1,109,897 1,110,161 1,118,968 1,158,749 Allowance for Loan Losses (46,879) (38,855) (35,852) (34,661) (30,075) (29,307) (28,597) (25,142) Other Assets 161,350 151,081 232,216 130,823 129,992 129,401 140,398 123,187 Total Assets $1,834,457 $1,747,060 $1,692,368 $1,689,668 $1,716,444 $1,750,539 $1,834,978 $1,886,938 Deposits $1,438,320 $1,346,183 $1,330,661 $1,313,786 $1,338,928 $1,378,937 $1,395,096 $1,454,756 Other Liabilities 236,217 235,143 192,257 204,871 203,243 191,481 254,809 243,982 Total Liabilities $1,674,537 $1,581,326 $1,522,918 $1,518,657 $1,542,171 $1,570,418 $1,649,905 $1,698,738 Stockholders’ Equity 159,920 165,734 169,450 171,011 174,273 180,121 185,073 188,200 Liabilities and Stockholder’s Equity $1,834,457 $1,747,060 $1,692,368 $1,689,668 $1,716,444 $1,750,539 $1,834,978 $1,886,938 Quarter Ending |
|
|
18 Colorado Market |

|
|
1US Census Bureau 2 Bureau of Labor Statistics 19 Our Marketplace Demographics Colorado National Current Population1 5,114,102 311,212,863 Historical Population Change (2000-2010)1 18.90% 10.59% Projected Population Change (2010-2015)1 7.76% 3.85% Current Median Household Income1 $62,326 $54,442 Projected Household Income Change (2010-2015)1 14.61% 12.39% Current Unemployment Rate2 7.6% 7.8% |
|
|
20 Our Marketplace Business Climate Colorado is the third top state for business – CNBC 2012 Colorado is the nation’s third-most economically competitive state – Beacon Hill Institute 2012 Denver is 3rd best city for startups – Venture Beat 2012 Denver’s employment forecast is 5th best in the nation – Manpower 2012 Growth Metro Denver has a population of 2.8 million people, and has a growth rate that has consistently outpaced the national rate every decade since the 1930s – Metro Denver Economic Development Corporation Metro Denver ranked first among 337 metro areas for absolute increase in construction employment from Feb. 2011 to Feb. 2012 – Associated General Contractors of America 2012 Denver attracted the most relocating adults aged 25 to 34 of any large U.S. metropolitan area from 2008 to 2010 - Brookings Institution: U.S. Census Bureau, 2010 American Community Survey Downtown Denver development projects anticipated in the near future include: 16th Street mall renovation, Union Station redevelopment, Ralph L Carr Judicial Complex |
|
|
21 Our Marketplace Economy In the first quarter of 2013, results from the Manpower Employment Outlook Survey show that the percent of employers planning to hire new workers has jumped to the highest point since 2008 – Metro Denver Economic Development Corporation Home resale activity in Metro Denver increased 20.3 percent year-over-year in November 2012 – Metro Denver Economic Development Corporation Denver is one of the top 10 national cities to watch, according to the Urban Land Institute / Price Waterhouse Cooper’s 2011 Emerging Trends in Real Estate report, marking the fourth year in a row the report has highlighted Denver among top-tier cities – 2011 Urban Land Institute & PWC Emerging Trends in Real Estate Highly Educated Workforce Colorado is the best state for labor supply – Forbes 2012 Of Colorado’s adult population, 36 percent have a bachelor’s degree or higher, making Colorado the second-most highly educated state in the country behind only Massachusetts - U.S. Census Bureau; 2010 American Community Survey Colorado has the third highest concentration of scientists and engineers in the nation - Milken Institute, 2010 |
|
|
22 Reconciliations of Non-GAAP Measures |
|
|
Non-GAAP Measure Reconcilements ($ in thousands, except per share amounts) 23 Tangible Book Value as of December 31, 2012 Stockholders’ Equity $188,200 Less Intangible Assets (9,348) Tangible Stockholders’ Equity $178,852 Shares Outstanding 105,847,607 Tangible Book Value per common share $1.69 Book Value per common share $1.78 Tangible Common Equity Ratio at December 31, 2012 Stockholders’ Equity $188,200 Less Intangible Assets (9,348) Tangible Stockholders’ Equity $178,852 Total Assets $1,886,938 Less Intangible Assets (9,348) Total Tangible Assets $1,877,590 Tangible Common Equity / Tangible Assets 9.53% Equity Ratio – GAAP1 9.97% 1 Total stockholders’ equity / total assets |