Attached files
| file | filename |
|---|---|
| EX-23.1 - EX-23.1 - TAMINCO Corp | d426208dex231.htm |
| EX-10.22 - EX-10.22 - TAMINCO Corp | d426208dex1022.htm |
| EX-10.23 - EX-10.23 - TAMINCO Corp | d426208dex1023.htm |
Table of Contents
As filed with the Securities and Exchange Commission on February 8, 2013
Registration No. 333-185244
UNITED STATES
SECURITIES AND EXCHANGE COMMISSION
Washington, D.C. 20549
AMENDMENT NO. 2
TO
FORM S-1
REGISTRATION STATEMENT
UNDER
THE SECURITIES ACT OF 1933
TAMINCO ACQUISITION CORPORATION*
*A name change will be effected changing the name of the registrant to Taminco Global Chemical Corporation immediately following the effectiveness of this registration statement.
(Exact name of registrant as specified in its charter)
| Delaware | 2860 | 45-4031468 | ||
| (State or other jurisdiction of incorporation or organization) |
(Primary Standard Industrial Classification Code Number) |
(I.R.S. Employer Identification No.) |
Two Windsor Plaza, Suite 411
7540 Windsor Drive
Allentown, Pennsylvania 18195
(610) 366-6730
(Address, including zip code, and telephone number, including area code, of registrant’s principal executive offices)
Edward Yocum
Executive Vice President and General Counsel
Two Windsor Plaza, Suite 411
7540 Windsor Drive
Allentown, Pennsylvania 18195
(610) 366-6730
(Name, address, including zip code, and telephone number, including area code, of agent for service)
With copies to:
| Joshua N. Korff, Esq. Taurie M. Zeitzer, Esq. Michael Kim, Esq. Kirkland & Ellis LLP 601 Lexington Avenue New York, New York 10022 (212) 446-4800 |
Michael Kaplan, Esq. Davis Polk & Wardwell LLP 450 Lexington Avenue New York, New York 10017 (212) 450-4000 |
Approximate date of commencement of proposed sale to the public: As soon as practicable after this Registration Statement becomes effective.
If any of the securities being registered on this Form are to be offered on a delayed or continuous basis pursuant to Rule 415 under the Securities Act of 1933, check the following box: ¨
If this Form is filed to register additional securities for an offering pursuant to Rule 462(b) under the Securities Act, please check the following box and list the Securities Act registration statement number of the earlier effective registration statement for the same offering. ¨
If this Form is a post-effective amendment filed pursuant to Rule 462(c) under the Securities Act, check the following box and list the Securities Act registration statement number of the earlier effective registration statement for the same offering. ¨
If this Form is a post-effective amendment filed pursuant to Rule 462(d) under the Securities Act, check the following box and list the Securities Act registration statement number of the earlier effective registration statement for the same offering. ¨
Indicate by check mark whether the registrant is a large accelerated filer, an accelerated filer, a non-accelerated filer, or a smaller reporting company. See the definitions of “large accelerated filer,” “accelerated filer” and “smaller reporting company” in Rule 12b-2 of the Exchange Act. (Check one):
| Large accelerated filer | ¨ | Accelerated filer | ¨ | |||
| Non-accelerated filer | x (Do not check if a smaller reporting company) | Smaller reporting company | ¨ | |||
CALCULATION OF REGISTRATION FEE
|
| ||||
| Title of Each Class of Securities to be Registered |
Proposed Maximum Aggregate Offering Price(1)(2) |
Amount of Registration Fee(2) | ||
| Common Stock, $0.001 par value per share |
$250,000,000 | (3) | ||
|
| ||||
|
| ||||
| (1) | Estimated solely for the purpose of calculating the registration fee pursuant to Rule 457(o) under the Securities Act of 1933, as amended. |
| (2) | Includes the offering price of any additional shares of common stock that the underwriters have the option to purchase. |
| (3) | The registration fee for the offering was previously paid in connection with the filing of the Registration Statement on Form S-1 with the SEC on December 3, 2012 (File No. 333-185244), to which this Registration Statement is Amendment No. 1. |
The registrant hereby amends this registration statement on such date or dates as may be necessary to delay its effective date until the registrant shall file a further amendment which specifically states that this registration statement shall thereafter become effective in accordance with Section 8(a) of the Securities Act of 1933 or until this registration statement shall become effective on such date as the Commission, acting pursuant to said Section 8(a), may determine.
Table of Contents
The information in this prospectus is not complete and may be changed. We may not sell these securities until the registration statement filed with the Securities and Exchange Commission is effective. The prospectus is not an offer to sell these securities and it is not soliciting an offer to buy these securities in any jurisdiction where the offer or sale is not permitted.
Subject to Completion, dated February 8, 2013
PRELIMINARY PROSPECTUS
Shares

Taminco Global Chemical Corporation
Common Stock
$ per share
This is an initial public offering of our common stock. We are offering shares of our common stock.
After the completion of this offering, funds affiliated with Apollo Global Management, LLC will continue to own a majority of the voting power of our outstanding common stock. As a result, we expect to be a “controlled company” within the meaning of the corporate governance standards of . See “Principal Stockholders.”
We expect the public offering price to be between $ and $ . Currently, no public market exists for the shares. We intend to apply to list our common stock on under the symbol “ .”
Investing in our common stock involves risks that are described in the “Risk Factors” section beginning on page 14 of this prospectus.
| Per Share | Total | |||||||
| Price to public |
$ | $ | ||||||
| Underwriting discounts and commissions |
$ | $ | ||||||
| Proceeds, before expenses, to us |
$ | $ | ||||||
We have agreed to allow the underwriters to purchase up to an additional shares from us, at the public offering price, less the underwriting discount, within 30 days from the date of this prospectus.
Neither the Securities and Exchange Commission nor any state securities commission has approved or disapproved of these securities or determined if this prospectus is truthful or complete. Any representation to the contrary is a criminal offense.
The underwriters expect to deliver the shares of common stock against payment on or about .
Citigroup
Credit Suisse
Deutsche Bank Securities
Goldman, Sachs & Co.
Nomura
UBS Investment Bank
The date of this prospectus is , 2013
Table of Contents

Table of Contents
| Page | ||||
| 1 | ||||
| 14 | ||||
| 36 | ||||
| 38 | ||||
| 39 | ||||
| 40 | ||||
| 41 | ||||
| 42 | ||||
| 44 | ||||
| 52 | ||||
| MANAGEMENT’S DISCUSSION AND ANALYSIS OF FINANCIAL CONDITION AND RESULTS OF OPERATIONS |
53 | |||
| 74 | ||||
| 78 | ||||
| 101 | ||||
| 106 | ||||
| 123 | ||||
| 125 | ||||
| 127 | ||||
| 131 | ||||
| 135 | ||||
| MATERIAL U.S. FEDERAL TAX CONSIDERATIONS FOR NON-U.S. HOLDERS |
137 | |||
| 141 | ||||
| 147 | ||||
| 147 | ||||
| 147 | ||||
| 148 | ||||
| F-1 | ||||
We have not authorized anyone to provide any information other than that contained in this prospectus or to which we have referred you. We take no responsibility for, and can provide no assurance as to the reliability of, any other information that others may give you. We are not making an offer to sell these securities in any jurisdiction where the offer or sale is not permitted.
Dealer Prospectus Delivery Obligations
Until (25 days after the date of this prospectus), all dealers that effect transactions in these securities, whether or not participating in this offering, may be required to deliver a prospectus. This delivery requirement is in addition to the dealers’ obligation to deliver a prospectus when acting as an underwriter and with respect to their unsold allotments or subscriptions.
Our current name is Taminco Acquisition Corporation. Our subsidiary that is the direct holding company of our operating subsidiaries and the borrower under the senior secured credit facilities and issuer of the second-priority senior secured notes due 2020 is currently named Taminco Global Chemical Corporation. We will change our corporate name and the corporate name of the subsidiary prior to completion of this offering. Following the name changes, we will be known as Taminco Global Chemical Corporation and our subsidiary will be known as Taminco Finance Corporation. This prospectus reflects these future name changes. We, the issuer in this offering, are referred to in this prospectus as Taminco Global Chemical Corporation and our subsidiary is referred to as Taminco Finance Corporation.
i
Table of Contents
This summary highlights selected information contained in greater detail elsewhere in this prospectus. This summary does not contain all of the information you should consider before investing in our common stock. You should read this entire prospectus carefully, especially the risks of investing in our common stock discussed under “Risk Factors,” our consolidated financial statements and related notes, and supplemental pro forma financial information included elsewhere in this prospectus, before making an investment decision.
Our current name is Taminco Acquisition Corporation. As part of this offering, we and our subsidiary that is the borrower under the senior secured credit facilities and issuer of the second-priority senior secured notes due 2020 will change our respective corporate names. Following the name changes, we will be known as Taminco Global Chemical Corporation and our subsidiary will be known as Taminco Finance Corporation. This prospectus reflects these future name changes. We, the issuer in this offering, are referred to in this prospectus as Taminco Global Chemical Corporation and our subsidiary is referred to as Taminco Finance Corporation. Except as otherwise indicated herein or as the context otherwise requires, references in this prospectus to “Taminco,” “the Company,” “we,” “our,” and “us” refer collectively to Taminco Global Chemical Corporation and its consolidated subsidiaries (including Taminco Finance Corporation) for the Successor Period (as defined below) and to Taminco Group Holdings S.à r.l. for the Predecessor Period (as defined below).
In this prospectus, references to the “Pro Forma LTM Period” refer to the twelve month period ended September 30, 2012 on a pro forma combined basis including results for our predecessor and us. The consolidated financial statements for 2012 are presented in this prospectus for two periods: January 1 through February 14, 2012, which relates to the period immediately preceding the Acquisition (as defined below) and the nine months ended September 30, 2012. Prior to the Acquisition, Taminco Global Chemical Corporation had no operations or activity other than transaction costs related to the Acquisition. See “—Summary Historical Consolidated Financial Information” for more information. For a list of certain industry terms used herein, see “Appendix A: Glossary of Technical Terms.”
Our Company
We are the world’s largest pure play producer of alkylamines and alkylamine derivatives. Our products are used by our customers in the manufacturing of everyday products primarily for the agriculture, water treatment, personal & home care, animal nutrition and oil & gas end-markets. Our products provide these goods with a variety of ancillary characteristics required for optimal performance, such as neutralizing acidity, and removing contaminants. We have an extensive offering of differentiated value-added products that typically represent a small portion of our customers’ overall costs and are sold into diversified, global end-markets that benefit from favorable underlying economic and population growth trends. We currently operate in 19 countries with seven production facilities and, as of September 30, 2012, had an installed production capacity of 1,302 kt. According to the report issued by Arthur D. Little Benelux S.A./N.V. (the “ADL Report”), we hold the #1 or #2 market position globally in the vast majority of the chemicals we produce, including an approximately 50% and 75% share of certain products, respectively, in North America and Europe. During the Pro Forma LTM Period, eight of our products accounted for more than 57% of our revenue, with six of the eight products holding a leading global market position. During the Pro Forma LTM period, through our worldwide network of production facilities, we sold 48% of our volume in North America, 36% of our volume in Europe, and 16% of our volume in the emerging markets (7% in Latin America and 9% in Asia). Furthermore, we expect to increase the portion of our volume from the Americas and Asia with our recent capital investments. As a result of our leading market positions, attractive end-markets, and significant recent capital investments, we believe we are well positioned for significant growth over the coming years. In the Pro Forma LTM Period, we generated revenue of $1,110 million, Adjusted EBITDA of $234 million, and Adjusted EBITDA margin of over 21%. See “—Summary Historical Consolidated Financial Information” for a discussion and reconciliation of Adjusted EBITDA and Adjusted EBITDA margin.
1
Table of Contents
Alkylamines are organic compounds produced through the reaction of an alcohol with ammonia. The immediate results of these processes are the production of methylamines and higher alkylamines, which can then be further reacted with other chemicals to produce alkylamine derivatives. Our products are primarily used in the agriculture, water treatment, personal & home care, animal nutrition, pharmaceutical and oil & gas end-markets, which combined accounted for approximately 70% of our volume during the Pro Forma LTM Period. Our end-markets tend to be non-cyclical and benefit from strong underlying fundamentals such as increasing global population, urbanization of emerging markets and rising income levels.
We currently operate seven plants worldwide dedicated to the production of alkylamines and alkylamine derivatives, including two larger facilities in each of the United States and Europe that are among the world’s largest methylamine and higher alkylamines production facilities, a joint-venture facility with Mitsubishi Gas Chemical Company and certain of its affiliates (the “MGC Group”) in China, and two other 100% Taminco-owned facilities in China.
We are also in the process of pursuing numerous growth projects to further bolster our global footprint and leverage our strategic advantages. Our currently budgeted future investments include significantly extending production capacity at our Pace, Florida methylamine facility by the end of 2014 and further development of other derivative capacity. In total, we have spent $116 million in growth capital expenditures over the past three years, which is more than we have spent in any similar historical period. We expect to realize significant growth in our financial results from these investments.
We are organized into three segments: Functional Amines, Specialty Amines, and Crop Protection.
| • | Functional Amines. This segment serves the needs of external customers that use our alkylamines products as the integral element in their chemical processes for the production of formulated products applied in a variety of end-markets such as agriculture, personal & home care, animal nutrition, and oil & gas. Through this segment, we also produce basic amines, which are captively used as building blocks to produce our downstream derivatives through our Specialty Amines and Crop Protection segments, serving a variety of attractive, non-cyclical end-markets. Approximately 30% of the Functional Amines production is used internally and forms the basis of our vertically integrated model. In the Pro Forma LTM Period, the Functional Amines segment accounted for 50% of Adjusted EBITDA. |
| • | Specialty Amines. This segment sells alkylamine derivatives for use in the water treatment, personal & home care, oil & gas and animal nutrition end-markets, and specialty additives for use in the pharmaceutical, industrial coatings and metal working fluid end-markets. This segment is downstream from the Functional Amines segment and uses that segment’s production as one of its key raw materials. The Specialty Amines segment’s customers are typically large, multinational enterprises who are leading players in their industry. In the Pro Forma LTM Period, the Specialty Amines segment accounted for 33% of Adjusted EBITDA. |
| • | Crop Protection. This segment sells alkylamine derivatives, active ingredients and formulated products for use in the agriculture and crop protection end-markets. The majority of the segment’s customers range from multinational crop protection and agricultural enterprises to large local farms. In the Pro Forma LTM Period, the Crop Protection segment accounted for 17% of Adjusted EBITDA. |
Our Strengths
We believe the following competitive strengths, in addition to our industry leading alkylamine production technology, have been instrumental to our success and position us well for future growth and strong financial performance.
Serve strong end-markets with attractive global growth prospects
Our products are generally sold into large end-markets with attractive global growth prospects. We develop products mainly for use in the agriculture, water treatment, personal & home care, animal nutrition, and oil & gas
2
Table of Contents
end-markets. These targeted end-markets, which have been relatively resistant to economic downturns, represent over $1.0 trillion in market value as of 2011 and are projected by ADL to grow by an average of 6% per year from 2012 to 2016 (with certain of these end-markets expected to grow at 7% per year).
A steadily increasing world population, rising income levels (particularly in the emerging markets), increasing global urbanization and an aging global population are expected to help continue driving strong demand in our key end-markets. In the Pro Forma LTM Period, approximately 70% of our volume was generated from these key end-markets and we expect that to increase over the next few years.
Market leader in global amines industry targeting niche markets with very few competitors
We focus exclusively on the production of alkylamines and alkylamine derivatives and have not entered into the production of other chemical products. According to the ADL Report, we are the world’s largest pure play producer of alkylamines and alkylamine derivatives, as we hold the #1 position in alkylamine and methylamine production in North America and the #2 position in alkylamine and methylamine production in Europe.
We benefit from long-standing relationships with blue-chip, industry-leading companies in each of our key end-markets, as well as from low customer churn (our average customer relationship among our top 10 customers is thirteen years). Overall, we believe our market position provides us with a stable and flexible platform for profitable operation and positions us to capitalize on growth opportunities quickly.
We believe that our extensive expertise and technology, our existing investments in profitable, vertically integrated manufacturing facilities, and our current set of product registrations from environmental, health and safety regulatory authorities give us a significant advantage over our competitors and new entrants. We also find it advantageous that some of our competitors have chosen to enter into certain downstream products that we do not manufacture and that compete directly with their customers.
Significant room for near-term growth due to recent capital investments
Our vertically integrated business model is one of our key strengths, differentiating us from almost all of our competitors. As we have succeeded with this model in Europe, we recently completed our vertically integrated production model in the United States, which we believe ideally positions us to capture growth in several attractive end-markets, including oil & gas (driven by shale gas demand), water treatment, feed additives, and crop protection. These recent investments in derivative capacity in the United States (AAA, DIMLA, and DMAPA, which are important production inputs for several end-markets) have large growth potential. These investments increased our U.S. derivatives capacity by 11% and further distanced ourselves from the nearest competitor in each of these product lines.
In addition, as a result of our competitive cost position and recent capacity additions at our United States-based plants and our Latin America-based sales force, we believe we are well positioned to fully serve the Latin American market, which has limited local competition.
Demonstrated financial resilience through various economic environments
For the past several years, our revenue, gross profit and Adjusted EBITDA have been growing throughout various economic environments. Due to our resilient end-markets and the integral nature of alkylamines and their derivatives to our customers, we are less vulnerable to economic cycles. In addition, we benefit from being able to grow sales volume with a limited addition of fixed costs as a result of our vertically integrated global production model. Also, we have relatively low maintenance capital expenditure requirements, which allow us to easily maintain high cash flow conversion rates in any economic environment.
3
Table of Contents
As an example of our resilient end-markets, during the 2008 to 2009 economic downturn, our volume declined only 7%, compared to an average decline of 20% for the specialty chemical industry according to the ADL Report, and our Adjusted EBITDA grew 19% in that same time period. We strongly believe that our end-markets will continue to grow in various economic environments given their resilient nature.
Ability to pass through raw material price increases
We believe one of the key reasons for our historical success is our ability to manage fluctuating raw material prices by passing through the majority of price changes to our customers. During the Pro Forma LTM Period, our top four raw materials (methanol, ethylene oxide, ammonia and acetone) accounted for 39% of our total cost of sales. Our main raw materials are readily available commodity chemicals. Approximately half of our total revenue for the Pro Forma LTM Period is generated from contracts that allow cost increases for key raw materials to be directly passed through to customers (“CPT Contracts”).
We play an important role in our customers’ value chains but our products represent a relatively small percentage of our customers’ overall cost structures. Because of the value of our products, for the portion of sales that are not generated under CPT Contracts, we are often able to pass through raw material price increases to our customers through market-based sales contracts that are typically renegotiated quarterly. Positive market dynamics and our relative insulation from raw material price volatility have historically enabled us to maintain profitability in each of our segments. We have also deployed a strategic sourcing approach for critical raw materials, which, coupled with our CPT Contracts and market-based contracts, significantly mitigates the impact of raw material volatility on our margin.
Attractive product pipeline with significant value creation opportunities
We have a strong track record of identifying and exploiting growth opportunities for new applications of our existing products. We also have expertise in new product development and we are the preferred partner for many of our key customers to jointly develop new amine-based derivative products. Our current pipeline includes several products covering each of our key end-markets that we expect will reach the market in the next few years and represents significant incremental revenue opportunities. We have a suite of products in development that are nearing realization, such as the expected launch in mid-2013 of Tenaz, a proprietary formulation of bio available silicate that is used as a plant fortifier. Our research and development is focused on five key application areas: surfactants, water treatment, oil & gas, feed additives and crop protection. Our patent portfolio is actively managed and contains 78 patents as of September 30, 2012.
Well-positioned to continue exploiting fast growing emerging markets in partnership with blue-chip customer base
With manufacturing operations and sales operations in China, sales offices in several Latin American countries and manufacturing operations in North America which can serve Latin America cost effectively, we believe we have a strong platform for further growth in these regions. Our joint venture with the MGC Group in Nanjing provides us with a base for expanding high value-added amine derivative products in China in the coming years. According to the ADL Report, Brazil is one of the largest markets in the world for crop protection and herbicide systems, and our operations in the region are positioned towards serving that growing agriculture market. In addition, recent expansion at our U.S. operations provide us with fully-vertically integrated amine derivatives manufacturing facilities that will help meet demand for our higher value-added products in Latin America. We have a number of strong relationships as a trusted supplier to global industry leaders within our key developed end-markets. We will continue to leverage these relationships in order to grow alongside our customers in these and other emerging markets.
4
Table of Contents
Industry leading margins and cash flow generation
We believe we have been maintaining industry leading margins and strong cash flow generation throughout economic cycles as a result of our low cost position, leadership role in niche markets, and scalable fixed cost structure. Our ability to mitigate raw material pricing fluctuations provides stability to our margins. Our EBITDA margin has averaged approximately 22% over the period from 2007 to 2011, compared to approximately 17.8% for our industry peers over the same period according to the ADL Report. As a testament to our competitive strength, our cash flow conversion, measured by EBITDA minus capital expenditures divided by EBITDA, has averaged approximately 73% over the period from 2007 to 2011, compared to approximately 60% for our industry peers according to the ADL Report.
Proven management and employee culture with meaningful employee equity ownership
We believe that our management team is among the deepest and most experienced in the chemical industry. On average, the tenure of our executive management team is 15 years with the Company and 18 years in the chemical industry. Our management team has been responsible for developing and executing our strategy that has generated consistent year-over-year sales and Adjusted EBITDA growth. We believe our employees have developed a unique culture in which each employee throughout the entire company is aligned, focused and holds each other accountable to achieve goals that drive value creation for all of our stakeholders. Our employee ownership pool is deep with approximately 42 individual employees owning equity in the Company. As of September 30, 2012, employees owned over 10% of the shares in our Company on a fully diluted basis before giving effect to this offering.
Our Strategy
Our long-term growth drivers revolve around our continued ability to work closely with market industry leaders and to further expand into emerging markets through the principal strategies outlined below.
Capitalize on key fundamental drivers of our end-markets
The primary end-markets we serve have strong exposure to numerous positive, non-cyclical macroeconomic trends. According to ADL, key factors, including a steadily increasing world population, a growing middle class in emerging markets, clean water scarcity, and enhanced oil & gas recovery techniques (especially driven by the shale gas demand in the United States), will continue to drive strong demand for agriculture, water treatment, personal & home care, animal nutrition and oil & gas products. ADL projects that the agriculture, water treatment, personal & home care, animal nutrition and oil & gas end-markets will grow by 6%, 6%, 7%, 5% and 8%, respectively, per annum from 2012 to 2016, or on average 6%. We believe we are well positioned and intend to utilize our best-in-class business optimization and manufacturing processes to meet our customers’ increased supply needs in light of this anticipated growth in end-market demand.
Continue to partner with industry leaders to provide foundation for future growth
We currently have strong positions in each of our key end-markets, which we have achieved in part due to our strong customer relationships with leading global companies in each of those markets. A fundamental element of our strategy is to continue to work directly with our core customers to develop new products and new applications for our existing products that address their specific needs. In addition, we deploy a more customer-focused marketing approach, rather than a more traditional product-based approach. Our specialized sales force includes 29 professionals and six marketing managers with individual responsibility for particular end user markets in various regions. In addition, we employ approximately 35 other commercial professionals, including divisional managers, product managers and new business development specialists. We believe that a deeper understanding of customer needs will better enable our marketing professionals to identify future sources of
5
Table of Contents
demand for our products and, working in close cooperation with our research and development function, address that demand through product innovation. As a result, we believe our customer-focused approach will make us a more attractive partner and allow us to achieve greater penetration of our end-markets.
Leverage platform to expand emerging market presence
We have strong, leading positions in our product markets in North America and Europe as a result of our commitment to strategic capital investments and selective acquisitions. We expect to leverage this success to capture a significant portion of our future growth in demand from Asia and Latin America. One of our strategic priorities is to position ourselves for profitable growth in these markets. We currently have two production facilities in China serving the animal nutrition end-market as well as a joint venture with the MGC Group to manufacture amines and amine derivatives. We plan to use our facilities, including our joint venture, as a platform for further expansion in Asia, including potentially in the fast-growing markets of Malaysia, Indonesia, India and Vietnam, and become a partner of choice for our customers in that region by leveraging our high-quality products, standards and technical expertise and moving closer to end users. We plan to capture global growth through our continuous investment in the U.S., which also serves as a platform for export to Latin America. In addition, our joint venture with the MGC group is expected to capture growth in Asia, primarily in China. We believe our technological and process knowledge should give us a significant advantage over our competitors in that region. As we grow in Asia, we are very focused on pursuing growth opportunities and selective acquisitions that are attractive from a margin profile.
Further expand our vertically integrated model
Our vertically integrated business model is one of our key strengths, differentiating us from almost all of our competitors. Our vertically integrated model focuses on both the alkylamine and their associated derivatives, versus just focusing on the alkylamines, which some of our competitors do. By having a fully integrated value-chain we are able to maintain a sustainable low cost position, benefiting from energy optimization, limited recycling needs, optimized logistics, and a limited number of well positioned world-scale production units.
A cornerstone of our expansion strategy is the extension of our vertically integrated business and production approach to all our operations around the world. We are already vertically integrated to a high degree in our European operations, in particular at our facility in Ghent and more recently in the United States, where we have completed new derivative units at our St. Gabriel and Pace facilities. We have announced significant methylamine capacity expansion at Pace to be completed by the end of 2014 that will further increase our leadership in North America.
Furthermore, through our joint venture with the MGC Group, we produce amine derivatives in China to pursue profitable growth downstream. Equally important to our performance is the continuous pursuit of production efficiencies and regular debottlenecking projects, which yield significant benefits in exchange for modest capital expenditures. As part of the philosophy behind our vertically integrated business model, we will continue to seek and implement best-in-class process optimization and efficiency gains within each of our facilities and apply that expertise throughout our global operations.
Continue to develop new processes, markets and products to enhance growth and profitability
Another key element of our strategy is to capitalize on our technological leadership to develop new processes, new products and new applications for our existing products. Working closely with our customers to better understand our end-markets and our customers’ individual requirements, we will seek to continue developing new products that increase the overall value of our customers’ offerings. We will also focus on providing more efficient alternatives to existing formulations, using a wide range of technologies including green technologies for our solvents, plant physiologies for our agriculture products and genomics screening for our feed
6
Table of Contents
additives. In addition, we will seek to maintain and improve our knowledge of market trends and developments in order to find new and innovative applications for our existing products. Our product pipeline currently includes developments which we expect to reach our customers in the next few years in each of our key end-markets. We are focused on developing products which provide improved performance and, in most cases, represent safer, non-toxic and “greener” alternatives to existing chemicals.
Our Principal Stockholder
Apollo Investment Fund VII, L.P. and its parallel funds (the “Apollo Funds”) collectively have committed capital of approximately $14.7 billion and are our principal stockholders.
The Apollo Funds are affiliates of Apollo Global Management, LLC (together with its subsidiaries, “Apollo”). Founded in 1990, Apollo is a leading global alternative investment manager with over 22 years experience managing investments across all economic environments in companies, both domestically and internationally. As of September 30, 2012, Apollo employed approximately 250 investment professionals and had offices in New York, Houston, Los Angeles, London, Frankfurt, Luxembourg, Singapore, Hong Kong and Mumbai.
Apollo has total assets under management of approximately $110 billion as of September 30, 2012, of which approximately $40 billion is invested in the private equity business. Over the past 22 years, funds affiliated with Apollo have been large investors in industrial assets and a builder of businesses, nurturing the growth of several chemical companies in particular. The chemical industry is one of Apollo’s largest focus areas and it has completed 13 major transactions in the chemical industry since its funding, all with positive returns and most with full or partial realizations. Selected investments by funds affiliated with Apollo relevant to us include Lyondell Basell, Momentive Performance Materials, Berry Plastics, Covalence Specialty Materials Corp., Borden Chemical, Compass Minerals and United Agri Products, as well as numerous other prior investments in chemical businesses.
Our Formation
Our business was formed through the carve-out from Union Chimique Belge (“UCB”) in 2003. On December 15, 2011, an affiliate of Apollo Global Management, LLC entered into a share purchase agreement (the “Acquisition”) with the previous sponsor pursuant to which Taminco Finance Corporation acquired all of the issued share capital of Taminco Group Holdings S.à r.l. and its subsidiaries. The Acquisition was consummated on February 15, 2012.
Risk Factors
Our business is subject to numerous risks and uncertainties including those highlighted in the section titled “Risk Factors” immediately following this summary. Some of these risks include the following, among others:
| • | our substantial indebtedness could adversely affect our financial health and our ability to raise additional capital, and prevent us from fulfilling our obligations under our existing agreements; |
| • | our debt agreements contain restrictions that limit our flexibility in operating our business, which may lead to default under our debt agreements; |
| • | an increase in energy costs, in particular natural gas costs, or a disruption in the supply of energy for our operations may significantly increase operational costs; |
| • | the price and availability of raw materials, energy and equipment, and our inability to pass on increased costs to customers may significantly increase operational costs; |
| • | a loss of major customers would result in a decline in our revenues; |
7
Table of Contents
| • | a lack of commercial viability of our new products and products under development could harm our results of operations; and |
| • | changes in macroeconomic conditions could adversely affect our business. |
After consummation of this offering, funds affiliated with Apollo will continue to control a majority of our common stock. As a result, we will be a “controlled company’ within the meaning of the applicable stock exchange corporate governance standards and we will qualify for, and intent to rely on, exemptions from certain stock exchange corporate governance requirements. As a result, we will not have a majority of independent directors and our nominating/corporate governance and compensation committees will not consist entirely of independent directors and we will not be required to have an annual performance evaluation of the nominating/corporate governance and compensation committees. See “Risk Factors—Risks Relating to This Offering and Ownership of Our Common Stock—Following the offering, we will be classified as a “controlled company” and, as a result, we will qualify for, and intend to rely on, exemptions from certain corporate governance requirements. You will not have the same protections afforded to stockholders of companies that are subject to such requirements” for more information on the risks we face in connection with the Apollo Fund’s ownership of a majority of our common stock.
Additional Information
We were incorporated on December 12, 2011 in the state of Delaware. Our principal executive offices in the U.S. are located at Two Windsor Plaza, Suite 411, 7540 Windsor Drive, Allentown, Pennsylvania 18195, and the telephone number there is (610) 366-6730. Our website address is www.taminco.com. The contents of and information contained on our website do not form a part of this prospectus.
Recent Developments
On December 18, 2012, we issued $250,000,000 aggregate principal amount of 9.125%/9.875% Senior PIK Toggle Notes due 2017 (the “PIK Toggle Notes”). The initial interest payment on the PIK Toggle Notes will be payable in cash. With respect to each interest payment thereafter (other than the final interest payment made at stated maturity, which will be paid in cash), we will be required to pay interest on the PIK Toggle Notes entirely in cash unless certain conditions are satisfied, in which case we will be entitled to pay interest with respect to such interest period by increasing the principal amount of the PIK Toggle Notes or issuing new notes. Interest on the PIK Toggle Notes will accrue at the rate of 9.125% per annum for cash interest or 9.875% per annum for PIK interest. The PIK Toggle Notes will mature on December 15, 2017. The net proceeds from the PIK Toggle Notes were used to make a return of capital to our shareholders and to pay certain related transaction costs and expenses.
8
Table of Contents
THE OFFERING
| Common stock offered |
shares. |
| Common stock to be outstanding after this offering |
shares. |
| Listing |
We intend to apply to list our common stock on the under the symbol “ .” |
| Over-allotment option |
We have agreed to allow the underwriters to purchase up to an additional shares from us, at the public offering price, less the underwriting discount, within 30 days from the date of this prospectus. |
| Use of proceeds |
Assuming an initial public offering price of $ per share, which is the midpoint of the offering price range set forth on the cover page of this prospectus, we estimate that the net proceeds to us from the sale of our common stock in this offering will be $ (or $ if the underwriters exercise in full their option to purchase additional shares of common stock from us), after deducting estimated underwriting discounts and commissions and offering expenses. |
| We intend to use the net proceeds received by us in this offering to repay certain of our indebtedness and for other general corporate purposes. For additional information, see “Use of Proceeds.” |
| Dividend policy |
We do not currently anticipate paying dividends on our common stock following this offering. Any declaration and payment of future dividends to holders of our common stock may be limited by restrictive covenants in our debt agreements, and will be at the sole discretion of our board of directors and will depend on many factors, including our financial condition, earnings, capital requirements, level of indebtedness, statutory and contractual restrictions applying to the payment of dividends and other considerations that our board of directors deems relevant. See “Dividend Policy,” “Management’s Discussion and Analysis of Financial Condition and Results of Operations—Financial Condition, Liquidity and Capital Resources,” and “Description of Capital Stock.” |
| Risk factors |
For a discussion of risks relating to the Company, our business and an investment in our common stock, see “Risk Factors” and all other information set forth in this prospectus before investing in our common stock. |
Except as otherwise indicated, all information in this prospectus assumes:
| • | the for one stock split described below has been completed; |
| • | no exercise of the underwriters’ option to purchase up to additional shares of common stock from us; |
| • | the initial offering price of $ per share, which represents the midpoint of the range set forth on the cover page of this prospectus; and |
| • | our amended and restated certificate of incorporation and amended and restated bylaws are in effect, pursuant to which the provisions described under “Description of Capital Stock” will become operative. |
9
Table of Contents
SUMMARY HISTORICAL CONSOLIDATED FINANCIAL INFORMATION
The following table presents our summary historical consolidated financial data and operating statistics. The consolidated statement of operations data and cash flow data for the years ended December 31, 2009, 2010 and 2011 and the consolidated balance sheet data as of the years ended December 31, 2010 and 2011 have been derived from our audited consolidated financial statements included elsewhere in this prospectus.
The consolidated financial statements for 2012 are presented for two periods: January 1 through February 14, 2012 (the “Predecessor Period”), which relates to the period immediately preceding the Acquisition, and the nine months ended September 30, 2012 (the “Successor Period”). The results of the Successor Period are not comparable to the results of the Predecessor Period due to the difference in the basis of presentation of purchase accounting as compared to historical cost. The consolidated statement of operations data for the period January 1, 2012 to February 14, 2012 are derived from the unaudited financial statements of the Predecessor Period included elsewhere in this prospectus, and the consolidated statement of operations data for the nine months ended September 30, 2012 are derived from the unaudited financial statements of the Successor Period included elsewhere in this prospectus. Prior to the Acquisition, Taminco Global Chemical Corporation had no operations or activity other than transaction costs related to the Acquisition. The condensed consolidated financial statements, in the opinion of management, include all adjustments (consisting only of normal recurring adjustments) necessary for a fair presentation of the financial position and results of operations as of the dates and for the periods indicated. The unaudited pro forma income statement for the Pro Forma LTM Period is calculated as follows: (i) the unaudited pro forma income statement for the year ended December 31, 2011, less (ii) the unaudited pro forma income statement for the nine months ended September 30, 2011, plus (iii) the unaudited pro forma income statement for the nine months ended September 30, 2012.
10
Table of Contents
The summary historical consolidated financial information should be read in conjunction with “Risk Factors,” “Selected Historical Financial Information,” “Management’s Discussion and Analysis of Financial Condition and Results of Operations,” “Unaudited Pro Forma Financial Information” and our financial statements and related notes thereto included elsewhere in this prospectus. Historical results are not necessarily indicative of results that may be expected for any future period.
| Predecessor(1) | Successor(2) | Pro Forma LTM Period |
||||||||||||||||||||||||||||
| Year ended December 31, |
Nine
months ended September 30, 2011 |
January 1 through February 14, 2012 |
Nine months ended September 30, 2012 |
|||||||||||||||||||||||||||
| (In millions, other than per share information) | 2009 | 2010 | 2011 | |||||||||||||||||||||||||||
| Statement of Operations Data: |
||||||||||||||||||||||||||||||
| Net sales |
$ | 825 | $ | 951 | $ | 1,123 | $ | 868 | $ | 144 | $ | 711 | $ | 1,110 | ||||||||||||||||
| Cost of sales |
651 | 757 | 906 | 693 | 111 | 598 | 943 | |||||||||||||||||||||||
|
|
|
|
|
|
|
|
|
|
|
|
|
|
|
|||||||||||||||||
| Gross profit |
174 | 194 | 217 | 175 | 33 | 113 | 167 | |||||||||||||||||||||||
| Selling, general and administrative expense |
48 | 52 | 49 | 39 | 66 | 29 | 45 | |||||||||||||||||||||||
| Research and development expense |
12 | 13 | 12 | 9 | 1 | 7 | 11 | |||||||||||||||||||||||
| Other operating expense |
13 | 2 | 16 | 10 | 1 | 44 | 11 | |||||||||||||||||||||||
|
|
|
|
|
|
|
|
|
|
|
|
|
|
|
|||||||||||||||||
| Operating income |
101 | 127 | 140 | 117 | (35 | ) | 33 | 100 | ||||||||||||||||||||||
| Interest expense (income), net |
80 | 74 | 75 | 57 | 8 | 50 | 100 | |||||||||||||||||||||||
| Other non-operating (income) expense, net |
4 | (2 | ) | 1 | 2 | 2 | 8 | 9 | ||||||||||||||||||||||
|
|
|
|
|
|
|
|
|
|
|
|
|
|
|
|||||||||||||||||
| Income (loss) before income taxes and results from companies consolidated under equity method |
17 | 55 | 64 | 58 | (45 | ) | (25 | ) | (9 | ) | ||||||||||||||||||||
| Income tax expense (benefit) |
16 | 33 | 32 | 28 | 9 | 2 | 13 | |||||||||||||||||||||||
|
|
|
|
|
|
|
|
|
|
|
|
|
|
|
|||||||||||||||||
| Income from continuing operations before earnings from equity method investments |
1 | 22 | 32 | 30 | (54 | ) | (27 | ) | (22 | ) | ||||||||||||||||||||
| Loss from companies consolidated under equity method |
— | — | 2 | 1 | — | 2 | 3 | |||||||||||||||||||||||
|
|
|
|
|
|
|
|
|
|
|
|
|
|
|
|||||||||||||||||
| Net income (loss) for the period |
$ | 1 | $ | 22 | $ | 30 | $ | 29 | $ | (54 | ) | $ | (29 | ) | $ | (25 | ) | |||||||||||||
|
|
|
|
|
|
|
|
|
|
|
|
|
|
|
|||||||||||||||||
| Earnings per share: |
||||||||||||||||||||||||||||||
| Basic |
$ | — | $ | 0.02 | $ | 0.03 | $ | 0.03 | $ | (0.05 | ) | $ | (5.37 | ) | $ | (4.63 | ) | |||||||||||||
| Diluted |
$ | — | $ | 0.02 | $ | 0.03 | $ | 0.03 | $ | (0.05 | ) | $ | (5.37 | ) | $ | (4.63 | ) | |||||||||||||
| Cash Flow Data: |
||||||||||||||||||||||||||||||
| Cash flows provided by (used in) operating activities |
$ | 133 | $ | 112 | $ | 117 | $ | 109 | $ | 44 | $ | (8 | ) | $ | N/M | |||||||||||||||
| Cash flows provided by (used in) investing activities |
(51 | ) | (68 | ) | (75 | ) | (52 | ) | (6 | ) | (195 | ) | N/M | |||||||||||||||||
| Cash flows provided by (used in) financing activities |
(7 | ) | (22 | ) | (19 | ) | (10 | ) | — | 266 | N/M | |||||||||||||||||||
11
Table of Contents
| Predecessor(1) | Successor(2) | Pro Forma LTM Period |
||||||||||||||||||||||||||||
| Year ended December 31, | Nine months ended September 30, 2011 |
January 1 through February 14, 2012 |
Nine months ended September 30, 2012 |
|||||||||||||||||||||||||||
| (In millions, other than as indicated) | 2009 | 2010 | 2011 | |||||||||||||||||||||||||||
| Other financial and operating statistics: |
||||||||||||||||||||||||||||||
| Total volume (in kt) |
478 | 528 | 540 | 420 | 57 | 363 | 540 | |||||||||||||||||||||||
| Adjusted EBITDA(3) |
196 | 203 | 227 | 184 | 30 | 161 | 234 | |||||||||||||||||||||||
| Adjusted EBITDA margin(3) |
23.8 | % | 21.3 | % | 20.2 | % | 21.2 | % | 20.8 | % | 22.6 | % | 21.1 | % | ||||||||||||||||
| Capital improvement expenditures |
20 | 8 | 13 | 9 | 1 | 7 | 12 | |||||||||||||||||||||||
| Growth capital expenditure |
21 | 54 | 41 | 25 | 5 | 26 | 47 | |||||||||||||||||||||||
| Toxicology and regulatory capital expenditure |
10 | 5 | 7 | 4 | — | 4 | 7 | |||||||||||||||||||||||
| Total capital expenditures |
51 | 67 | 61 | 38 | 6 | 37 | 66 | |||||||||||||||||||||||
| As of December 31, | As of September 30, | |||||||||||
| (In millions) | 2010 | 2011 | 2012 | |||||||||
| Balance Sheet Data: |
||||||||||||
| Cash and cash equivalents |
$ | 111 | $ | 131 | $ | 58 | ||||||
| Property, plant and equipment, net |
246 | 249 | 415 | |||||||||
| Total assets |
1,327 | 1,348 | 1,824 | |||||||||
| Long-term debt |
1,124 | 1,102 | 904 | |||||||||
| Total liabilities |
1,382 | 1,380 | 1,323 | |||||||||
| Stockholders’ equity |
(55 | ) | (32 | ) | 501 | |||||||
| (1) | Taminco Group Holdings S.à r.l. |
| (2) | Taminco Global Chemical Corporation |
| (3) | We present Adjusted EBITDA and Adjusted EBITDA margin to enhance a prospective investor’s understanding of our results of operations and financial condition. EBITDA consists of profit for the period before interest, taxation, depreciation and amortization. Adjusted EBITDA consists of EBITDA and eliminates (i) transaction costs, (ii) restructuring charges, (iii) foreign exchange gains/losses, (iv) sponsor management and director fees and expenses (Successor Period only) and (v) share-based compensation expense. Adjusted EBITDA margin reflects Adjusted EBITDA as a percentage of net sales. We believe that making such adjustments provides investors meaningful information to understand our operating results and ability to analyze financial and business trends on a period-to-period basis. |
You should not consider Adjusted EBITDA or Adjusted EBITDA margin as an alternative to (a) operating profit or profit for the period, as reported in accordance with U.S. GAAP, as a measure of our operating performance, (b) cash flows from operating investing and financing activities as a measure to meet our cash needs or (c) any other measures of performance under generally accepted accounting principles. You should exercise caution in comparing Adjusted EBITDA and Adjusted EBITDA margin as reported by us to similar measures of other companies.
In evaluating Adjusted EBITDA, you should be aware that we are likely to incur expenses similar to the adjustments in this presentation in the future and that certain of these items could be considered recurring in nature. Our presentation of Adjusted EBITDA should not be construed as an inference that our future results will be unaffected by non-recurring items.
We present Adjusted EBITDA and Adjusted EBITDA margin because we believe Adjusted EBITDA and Adjusted EBITDA margin are useful as supplemental measures in evaluating the performance of our operating businesses and provide greater transparency into our results of operations. Adjusted EBITDA
12
Table of Contents
should not be considered in isolation or as a substitute for net income or other statement of operations data prepared in accordance with U.S. GAAP.
Our management, including our chief operating decision makers, uses Adjusted EBITDA as a factor in evaluating the performance of our business. This measure is not recognized in accordance with U.S. GAAP and should not be viewed as an alternative to U.S. GAAP measures of performance. The most directly comparable financial measure presented in accordance with U.S. GAAP in our consolidated financial statements for Adjusted EBITDA is net income.
Adjusted EBITDA has limitations as an analytical tool, and you should not consider Adjusted EBITDA either in isolation or as a substitute for analyzing our results as reported under U.S. GAAP. Some of these limitations include:
| • | it does not reflect our cash expenditures or future requirements for capital expenditures or contractual commitments; |
| • | although depreciation and amortization are non-cash charges, the assets being depreciated and amortized will often need to be replaced in the future and Adjusted EBITDA does not reflect any cash requirements that would be required for such replacements; |
| • | its does not reflect the interest expense, or the cash requirements necessary, to service interest or principal payments on our debt; |
| • | it does not reflect stock option expense or its potentially dilutive impact; |
| • | some of the exceptional items that we eliminate in calculating Adjusted EBITDA reflect cash payments that were made, or will be made in the future; and |
| • | other companies in our industry may calculate Adjusted EBITDA differently than we do, which limits its usefulness as a comparative measure. |
The following table provides reconciliations of net income (loss) to Adjusted EBITDA for the periods presented.
| Predecessor | Successor | Pro Forma LTM Period |
||||||||||||||||||||||||||||
| Year ended December 31, |
Nine months ended September 30, 2011 |
January 1 through February 14, 2012 |
Nine months ended September 30, 2012 |
|||||||||||||||||||||||||||
| (In millions) | 2009 | 2010 | 2011 | |||||||||||||||||||||||||||
| Net income (loss) attributable to Taminco |
$ | 1 | $ | 22 | $ | 30 | $ | 29 | $ | (54 | ) | $ | (29 | ) | $ | (25 | ) | |||||||||||||
| Income tax expense (benefit) |
16 | 33 | 32 | 28 | 9 | 2 | 13 | |||||||||||||||||||||||
| Interest expense, net |
80 | 74 | 75 | 57 | 8 | 50 | 100 | |||||||||||||||||||||||
| Depreciation and amortization |
82 | 74 | 72 | 58 | 7 | 64 | 107 | |||||||||||||||||||||||
|
|
|
|
|
|
|
|
|
|
|
|
|
|
|
|||||||||||||||||
| EBITDA |
$ | 179 | $ | 203 | $ | 209 | $ | 172 | $ | (30 | ) | $ | 87 | $ | 195 | |||||||||||||||
|
|
|
|
|
|
|
|
|
|
|
|
|
|
|
|||||||||||||||||
| Transaction costs |
9 | 2 | 5 | 2 | — | 68 | 29 | |||||||||||||||||||||||
| Restructuring charges |
4 | — | 11 | 8 | — | — | 3 | |||||||||||||||||||||||
| Foreign exchange gains (losses) |
4 | (2 | ) | 2 | 2 | — | 3 | 3 | ||||||||||||||||||||||
| Sponsor management and director fees and expenses |
— | — | — | — | — | 3 | 4 | |||||||||||||||||||||||
| Share-based compensation expense |
— | — | — | — | 60 | — | — | |||||||||||||||||||||||
|
|
|
|
|
|
|
|
|
|
|
|
|
|
|
|||||||||||||||||
| Adjusted EBITDA |
$ | 196 | $ | 203 | $ | 227 | $ | 184 | $ | 30 | $ | 161 | $ | 234 | ||||||||||||||||
|
|
|
|
|
|
|
|
|
|
|
|
|
|
|
|||||||||||||||||
13
Table of Contents
Investing in our common stock involves a high degree of risk. You should carefully consider the risk factors set forth below as well as the other information contained in this prospectus before investing in our common stock. The risks described below are not the only risks facing us. Additional risks and uncertainties not currently known to us or those we currently view to be immaterial may also materially and adversely affect our business, financial condition, results of operations or cash flows. If any of the following risks actually occurs, our business, financial condition, results of operations or cash flows would suffer. In such case, you may lose part or all of your investment.
Risks Relating to Our Business
Our substantial indebtedness could adversely affect our financial health and our ability to raise additional capital, and prevent us from fulfilling our obligations under our existing agreements.
At September 30, 2012, we had $910 million in face value of total indebtedness on a consolidated basis, all of which was secured. As of September 30, 2012, there were no borrowings outstanding under our revolving credit facility; however $3 million of the total capacity of $194 million was utilized to support outstanding letters of credit (as described under “Description of Indebtedness”). In addition, we had drawn $97 million under the Non-recourse Factoring Facility (as described under “Description of Indebtedness”). As of January 18, 2013, our annual debt service obligation is approximately $94 million. This amount includes principal and interest payments under the Senior Secured Credit Facilities and interest payments under the Second-Priority Senior Secured Notes and the PIK Toggle Notes. Additionally, principal payments of $400 million of Second-Priority Senior Secured Notes and $250 million of PIK Toggle Notes are due in 2020 and 2017, respectively. See “Prospectus Summary—Recent Developments” and “Description of Indebtedness—Senior PIK Toggle Notes” for more information on the PIK Toggle Notes.
Our substantial indebtedness could:
| • | make it more difficult for us to satisfy our obligations with respect to our indebtedness, and any failure to comply with the obligations of any of our debt instruments, including restrictive covenants and borrowing conditions, could result in an event of default under the agreements governing our indebtedness; |
| • | require us to dedicate a substantial portion of our cash flow from operations to the payments on our indebtedness, thereby reducing the availability of our cash flow to fund acquisitions, working capital, capital expenditures, research and development efforts and other general corporate purposes; |
| • | expose us to the risk of increased interest rates, as borrowings under the Senior Secured Credit Facilities will be subject to variable rates of interest; |
| • | place us at a competitive disadvantage compared to certain of our competitors that have less debt; |
| • | limit our ability to borrow additional funds; |
| • | make us more vulnerable to downturns in our business or the economy; |
| • | limit our flexibility in planning for, or reacting to, changes in our operations or business; and |
| • | increase our vulnerability to and limit our flexibility in planning for, or reacting to, changes in our business and the industry in which we operate. |
Also, we may still incur significantly more debt, which could intensify the risks described above.
14
Table of Contents
Our debt agreements contain restrictions that limit our flexibility in operating our business, which may lead to default under our debt agreements.
The agreements governing our existing indebtedness contain, and any future indebtedness of ours would likely contain, a number of covenants that impose significant operating and financial restrictions on us and our subsidiaries, including restrictions on our and our subsidiaries’ ability to among other things:
| • | incur additional debt or issue certain preferred shares; |
| • | pay dividends on or make distributions in respect of our common stock or make other restricted payments; |
| • | make certain investments; |
| • | sell certain assets; |
| • | create liens on certain assets; |
| • | consolidate, merge, sell or otherwise dispose of all or substantially all of our assets; |
| • | enter into certain transactions with our affiliates; and |
| • | designate our subsidiaries as unrestricted subsidiaries. |
As a result of these covenants, we are limited in the manner in which we conduct our business, and we may be unable to engage in favorable business activities or finance future operations or capital needs.
We have pledged and will pledge a significant portion of our assets as collateral under our Senior Secured Credit Facilities and Notes (as described under “Description of Indebtedness”). If repayment is accelerated, there can be no assurance that we will have sufficient assets to repay our indebtedness.
Under our Senior Secured Credit Facilities, we are required to satisfy and maintain specific financial ratios. Our ability to meet those financial ratios can be affected by events beyond our control, and there can be no assurance that we will meet those ratios. A failure to comply with the covenants contained in our Senior Secured Credit Facilities or our other indebtedness could result in an event of default under the facilities or the existing agreements, which if not cured or waived, could have a material adverse effect on our business, financial condition and results of operations. In the event of any default under our Senior Secured Credit Facilities or our other indebtedness, the lenders thereunder:
| • | will not be required to lend any additional amounts to us; |
| • | could elect to declare all borrowings outstanding, together with accrued and unpaid interest and fees, to be due and payable and terminate all commitments to extend further credit; or |
| • | require us to apply all of our available cash to repay those borrowings. |
Such actions by the lenders could cause cross defaults under our other indebtedness. If we are unable to repay those amounts, the lenders and noteholders under our Senior Secured Credit Facilities and the Notes could proceed against the collateral granted to them to secure that indebtedness.
Difficult and volatile conditions in the overall economy and in the capital, credit and commodities markets could materially adversely affect our financial position, results of operations and cash flows, and we do not know if these conditions will improve in the near future.
Our financial position, results of operations and cash flows could be materially adversely affected by continuation of difficult global economic conditions and significant volatility in the capital, credit and commodities markets and in the overall economy. These factors, combined with low levels of business and
15
Table of Contents
consumer confidence and increased unemployment, have precipitated a slow recovery from the global recession and concern about a return to recessionary conditions. The difficult conditions in these markets and the overall economy affect our business in a number of ways. For example:
| • | weak economic conditions, especially in our key markets in North America and Europe, could reduce demand for our products, impacting our revenues and margins; |
| • | as a result of the recent volatility in commodity prices, we may encounter difficulty in achieving sustained market acceptance of past or future price increases, which could have a material adverse effect on our financial position, results of operations and cash flows; |
| • | under difficult market conditions, there can be no assurance that borrowings under our revolving credit facility would be available or sufficient, and in such a case, we may not be able to successfully obtain additional financing on reasonable terms, or at all; |
| • | in order to respond to market conditions, we may need to seek waivers from various provisions in our Senior Secured Credit Facilities, and there can be no assurance that we can obtain such waivers at a reasonable cost, if at all; and |
| • | market conditions could result in our key customers experiencing financial difficulties and/or electing to limit spending, which in turn could result in decreased sales and earnings for us. |
We do not know if market conditions or the state of the overall economy will improve in the near future. In particular, a significant portion of our revenues are generated in Europe and in Euro. As a result, we could be adversely affected by the current economic crisis in Europe, particularly if such crisis worsens. We could also be affected if some or all European countries exit the Euro.
Our ability to obtain additional capital on commercially reasonable terms may be limited, which could reduce funds available for our operations and place us at a competitive disadvantage.
Although we believe that our cash, cash equivalents and short-term investments, as well as future cash from operations and availability under our revolving credit facility, will provide adequate resources to fund ongoing operating requirements, we may need to seek additional financing to compete effectively. Our debt ratings affect both our ability to raise capital and the cost of that capital. Future downgrades of our debt ratings may increase our borrowing costs and affect our ability to access the debt or equity markets on terms and in amounts that would be satisfactory to us.
If we are unable to obtain capital on commercially reasonable terms, it could:
| • | reduce funds available to us for purposes such as working capital, capital expenditures, research and development, strategic acquisitions and other general corporate purposes; |
| • | restrict our ability to introduce new products or capitalize on business opportunities; |
| • | increase our vulnerability to economic downturns and competitive pressures in the markets in which we operate; and |
| • | place us at a competitive disadvantage. |
We are dependent upon our lenders for financing to execute our business strategy and meet our liquidity needs. If our lenders are unable to fund borrowings under their credit commitments or we are unable to borrow, our business could be negatively impacted.
During periods of volatile credit markets, there is a risk that lenders, even those with strong balance sheets and sound lending practices, could fail or refuse to honor their credit commitments and obligations, including but not limited to extending credit up to the maximum permitted by a credit facility and otherwise accessing capital
16
Table of Contents
and/or honoring loan commitments. If our lenders are unable to fund borrowings under their revolving credit commitments or if we are unable to borrow, it could be difficult to replace our revolving credit facility on similar terms.
An increase in energy costs, in particular natural gas costs, or a disruption in the supply of energy for our operations may significantly increase operational costs or adversely affect production.
The main energy sources used in our operations are natural gas and electricity. Natural gas in particular represents a significant part of our raw material and consumables expenses and any increase in the price of natural gas would significantly increase our costs and reduce our operating margin. See “Management’s Discussion and Analysis of Financial Condition and Results of Operations—Key Drivers of Our Business—Raw Materials.”
Fluctuations in energy costs may be market-driven or government-driven. We do not hedge our natural gas costs. If we are not able to increase the prices we charge as a result of increases in natural gas and electricity prices, or if we are unable to pass on the full increase in electricity costs to our wholesale customers, our business and results of operations may be materially adversely affected. Although our financial conditions have not been materially impacted by recent fluctuations in natural gas prices, we may be negatively impacted by future price increases.
In addition, any disruption in the supply of energy may impair our ability to conduct our business and meet customer demands and may have a material adverse effect on our results of operations. Since the number of energy suppliers is generally limited, we may not be able to negotiate favorable terms when our energy supply agreements are up for renewal and we may be required to accept significant increases in the costs of our energy purchases. In Germany and the United States, we are dependent on monopolist and/or government-controlled companies for a significant portion of our electricity needs. Unexpected changes in a government’s policy of electricity supply may occur from time to time. Such changes may negatively impact our production capacity or our operating expenses and may materially adversely affect our business and results of operations.
Our production facilities can also be disrupted due to maintenance and routine shutdowns.
We derive a significant portion of our revenue from sales to several large customers, including chemical distributors, and significant reductions of sales to one or more of these customers could harm our business, financial condition and results of operations.
We derive a substantial amount of revenue from sales to several large customers, with our top 10 customers accounting for approximately 37% of our total revenue in the Pro Forma LTM Period. Such loss of revenue could have an adverse impact on our future revenues. For more information, please see “—Risks Relating to Our Industry—We may face increasing competition, which could have a material adverse effect on our business and results of operations.” See “Business—Our Operations—Marketing and Sales.” The loss of, or significant reduction in demand from, one or more of these customers could have a material adverse effect on our business, financial condition and results of operations.
In addition, certain of our revenue is generated through sales to customers that are chemical distributors and that, in turn, sell our products to their customers. Sales of our products could decline if the performance of these customers deteriorates. Furthermore, because we do not have exclusive relationships with these customers, they may sell competitors’ products. There is a risk that these customers may give higher priority to the products of, or form alliances with, our competitors. If these customers do not continue to sell our products or to provide them with similar levels of promotional support as provided for our competitors’ products, our sales performance could decline and our business and results of operations could be materially adversely affected.
17
Table of Contents
We purchase our key raw materials and some of our equipment from a relatively limited number of suppliers. As a result, any disruption or delay in the supply could have a material adverse effect on our business.
We purchase methanol, ammonia, ethylene oxide and acetone from a relatively limited number of sources. See “Business—Our Operations—Raw Materials.” As a result, any disruption or delay in the supply of those materials from a particular supplier, or loss of a supplier where we are unable to find a suitable alternative, could force us to curtail our production and adversely affect our business.
Similarly, we are only able to purchase certain components of our production equipment from a limited number of contractors and suppliers. Any interruption in the operations of our suppliers and/or the inability to obtain timely delivery of key equipment of acceptable quality or significant increases in the prices of such equipment could result in material production delays, increased costs and reductions in shipments of our products, any of which could increase our operating costs, harm our customer relationships or have a material adverse effect on our business and results of operations.
We depend on a variety of raw materials, the prices of which may vary based on market conditions. Changes in raw material prices and our supply arrangement could materially adversely affect our business and results of operations.
The prices of the raw materials on which our business depends vary based on market conditions. In particular, the prices of certain raw materials, such as methanol and ammonia, are highly volatile. Increased costs of raw materials and/or their delivery that cannot be passed on to our customers through price increases impact our operating costs and liquidity and could have a material adverse effect on our cash flow, business and results of operations.
The main raw materials by volume used in the manufacture of alkylamines and their derivatives are methanol, ammonia, ethylene oxide and acetone. We depend upon raw materials supplied by third parties by pipeline, railcar, barge or truck. We typically enter into supply agreements for terms of one year or longer. Certain of these agreements are automatically renewable each year, subject to termination by either party upon as little as 30 days’ notice. In addition, certain of our supply arrangements are not subject to written contracts and therefore can be terminated by either party at any time. If our contractual relationships with our suppliers were terminated or were insufficient to meet our needs, or if we were otherwise unable to secure these or other necessary raw materials or to acquire them at commercially reasonable prices, then our business and results of operations could be materially adversely affected. In addition, there is a risk that the regulation of the transportation of ethylene oxide and ammonia may become more stringent, which could raise the cost of the raw materials. The supply of ethylene oxide has been constrained recently, which could impact availability and pricing of ethylene oxide in the future.
In addition, some of our current contracts allow us to purchase raw materials at advantageous prices. If our counterparties suffer financial problems or are for other reasons unable to fulfill their requirements under these contracts, or if we are unable to renew these contracts on the same or similar terms, then our business and results of operations could be materially adversely affected. For example, we have a methanol supply contract that contains favorable pricing and expires in 2019, but our supplier has invoked force majeure on a number of occasions in the last several years, resulting in a reduction in the amount of methanol supplied under the contract at the favorable price, and it is possible that the supplier may do so again in the future. When force majeure is invoked, we are required to source our methanol at higher prices, adversely impacting our margins and results.
For our production of solvents, such as dimethylformamide (“DMF”), access to low cost carbon monoxide (“CO”), is essential to profitability. As DMF is by far our largest solvent product, any disruption in access to low cost CO could have a material adverse effect on our business and results of operations.
For more information, see “Management’s Discussion and Analysis of Financial Condition and Results of Operations—Key Drivers of Our Business—Raw Materials” and “Business—Our Operations—Raw Materials.”
18
Table of Contents
We may not be able to pass on the costs of raw materials, energy or other inputs to customers in future contracts, which may have a material adverse effect on our business and results of operations.
Many of our current contracts with customers allow us to pass on much of any increase in the cost of our key raw materials, energy and other inputs to those customers as part of the price of the products they purchase. See “Management’s Discussion and Analysis of Financial Condition and Results of Operations—Key Drivers of Our Business—Volume, Product Mix and Pricing.” When the terms of our current contracts with customers expire in the future, we may not be able to negotiate new contracts that allow us to pass the costs of inputs on to our customers and this may have a material adverse effect on our business and results of operations. While approximately 48% of our contracts for the Pro Forma LTM Period permit pass-throughs of key raw material increases, we have generally been able to pass along increases, subject to a time lag, in our other sales. We cannot assure you that we will be able to do so in the future. In addition, decreases in raw material costs are passed through to our customers, which may decrease our net sales.
Our new products and products under development may not prove to be commercially viable. Failure to develop commercially successful products or keep pace with our competitors could harm our business and results of operations.
The development of new and innovative products is a key driver of our growth. However, developing new products is a costly, lengthy and uncertain process, and it is difficult to estimate the commercial success of new products unproven in the marketplace.
New product candidates may appear promising in development, but may fail to reach the market or have only limited commercial success. This, for example, could be the result of efficacy or safety concerns, an inability to obtain necessary regulatory approvals in certain geographic markets, difficulty manufacturing or excessive manufacturing costs, erosion of patent terms as a result of a lengthy development period, infringement of patents or other intellectual property rights of others or an inability to differentiate the product adequately from its competitors.
A failure to develop commercially successful products or to develop additional uses for existing products could materially and adversely affect our financial results. For example, Taminizer D is a new product for which the market is unproven. If our expectations for the market performance of this product are not borne out, we may be unable to recover our development costs, which could have an adverse effect on our business and results of operations. In addition, our sales are concentrated in a few key products. As a result, failure to keep pace with the innovations of new or existing competitors could reduce demand for any of these key products and may have a material adverse effect on our business and results of operations.
We may not be able to obtain patents protecting some of our intellectual property that is the subject of applications for patents and existing rights may be challenged and will eventually expire, which could reduce our growth potential.
Our intellectual property rights are important to our business and will be critical to our ability to grow and succeed in the future. See “Business—Our Operations—Research and Product Development—Intellectual Property.” As of September 30, 2012, we had 78 patents, 153 pending patent applications and numerous registered trademarks in various jurisdictions around the world. These pending patent applications are for the products and technologies that our research and development team has developed. There can be no assurance that these pending patent applications will not be challenged by third parties or that such applications will eventually be issued by the applicable patent offices as patents. It is possible that none of the pending patent applications will result in issued patents, which may have a materially adverse effect on our business and results of operations. Even if patents do issue from our pending applications, such patents may not provide us with any competitive advantage and there is no certainty that others will not independently develop similar or alternative technologies, each of which may have a material adverse effect on our business and results of operations. Furthermore, our existing patents are subject to challenges from third parties which may result in invalidations
19
Table of Contents
and will all eventually expire after which we will not be able to prevent our competitors from using our previously patented technologies, which could materially adversely affect our competitive advantage stemming from those products and technologies.
If we are sued for infringing intellectual property rights of third parties, it will be costly and time consuming, and an unfavorable outcome in any litigation would harm our business.
We cannot assure you that our activities will not, unintentionally or otherwise, infringe on the patents and other intellectual property rights owned by others. We may spend significant time and effort and incur significant litigation costs if we are required to defend ourselves against intellectual property rights claims brought against us, regardless of whether the claims have merit. If we are found to have infringed on the patents or other intellectual property rights of others, we may be subject to substantial claims for damages, which could materially impact our cash flow, business, financial condition and results of operations. We may also be required to cease development, use or sale of the relevant products or processes, or we may be required to obtain a license on the disputed rights, which may not be available on commercially reasonable terms, if at all.
We conduct some operations through a joint venture with a third party, which we cannot operate solely for our own benefit.
We have a 50% interest in a joint venture with the MGC Group in Nanjing, China. Our ability to receive dividends, royalties and other payments from this joint venture depends not only on the joint venture’s cash flows and profits, but also upon the terms of the joint venture agreement with our partner. Due to the nature of the joint venture agreement, we do not retain complete control over all decisions with respect to its operation. Conflicts with our joint venture partner may lead to deadlock and may result in our inability to pursue our desired strategy or exit the joint venture on advantageous terms. In addition, the sale or transfer of our interest in the joint venture is generally subject to the written approval of MGC Group, to the right of first offer owed to MGC Group and to the approval of certain Chinese regulatory authorities. Furthermore, the bankruptcy, insolvency or severe financial distress of us or our joint venture partner could adversely affect the joint venture.
While we do not expect the joint venture with MGC Group to contribute materially to revenue and Adjusted EBITDA, we intend it to serve as a platform for our expansion into Asia and other emerging markets. Should it not perform as expected, our efforts to expand into those markets could be materially adversely affected.
Future acquisitions and joint ventures we pursue may present unforeseen integration obstacles and costs, increase our leverage and negatively impact our performance.
We have made acquisitions of related businesses, and entered into joint ventures in the recent past and may selectively pursue acquisitions of, and joint ventures with, related businesses as one element of our growth strategy. There can be no assurance whether we decide to pursue or will be successful in completing these acquisitions, and we cannot predict the timing of any such transaction. These acquisitions may require us to assume or incur additional debt financing, resulting in additional leverage and complex debt structures. Subject to certain limitations, the covenants governing our existing indebtedness permit us to pursue additional indebtedness as part of acquisitions or joint ventures.
Although we have not had issues integrating acquired businesses in the past, we may encounter unforeseen obstacles or costs in the integration of acquired businesses in the future. Our acquisition and joint venture strategy may not be successfully received by customers, and we may not realize any anticipated benefits from acquisitions or joint ventures.
Our competitive position and future prospects depend on our senior management’s experience and expertise and our ability to recruit and retain qualified personnel.
Our ability to maintain our competitive position and to implement our business strategy is dependent to a large degree on our senior management team. The loss or diminution in the services of members of our senior
20
Table of Contents
management team, or the inability to attract and retain additional senior management personnel, could have a material adverse effect on our business and results of operations. Competition for personnel with relevant expertise is intense due to the relatively small pool of qualified individuals, and this situation affects our ability to retain existing senior management and attract additional qualified senior management personnel. If we were to experience difficulties in recruiting or retaining qualified senior management and other personnel, it could have a material adverse effect on our business and results of operations.
Exchange rate fluctuations may have an impact on our financial results and condition.
Our operations are global. The impact of foreign currencies on our operating results, including revenue and operating expenses, includes foreign currency transaction risk and foreign currency translation risk.
We have currency exposures related to buying, selling and financing in currencies other than the local currencies of the countries in which we operate. A significant portion of our revenue for the year ended December 31, 2011 was denominated in currencies other than the U.S. Dollar, and we expect net sales from non-U.S. Dollar markets to continue to represent a significant portion of our net sales. Price increases caused by currency exchange rate fluctuations may make our products less competitive or have an adverse effect on our margins. Currency exchange rate fluctuations may also disrupt the business of our suppliers by making their purchases of raw materials more expensive and more difficult to finance. Historically, we have reduced our exposure by aligning our costs in the same currency as our revenues or, if that is impracticable, through financial instruments that provide offsets or limits to our exposures, which are opposite to the underlying transactions. However, any measures that we may implement to reduce the effect of volatile currencies and other risks of our global operations may not be effective. We cannot provide assurance that fluctuations in currency exposures will not otherwise have a material adverse effect on our financial condition or results of operations, or cause significant fluctuations in quarterly and annual results of operations.
In addition, foreign currency translation risk arises upon the translation of statement of financial position and income statement items of our foreign subsidiaries whose functional currency is a currency other than the U.S. dollar into the U.S. dollar for purposes of preparing the consolidated financial statements included elsewhere in this prospectus, which are presented in U.S. dollar. The assets and liabilities of our non-U.S. dollar denominated subsidiaries are translated at the closing rate at the date of reporting and income statement items are translated at the average rate for the period. All resulting exchange differences are recognized in a separate component of equity, “Foreign currency translation reserve” and are recorded in “Other comprehensive income.” These currency translation differences may have significant negative or positive impacts. Upon the disposal of a non-U.S. dollar denominated subsidiary, the cumulative amount of exchange differences relating to that non-U.S. dollar denominated subsidiary are reclassified from equity to profit or loss. Our foreign currency translation risk mainly relates to our operations in Europe and China. Foreign currency transaction risk arises when we or our subsidiaries enter into transactions where the settlement occurs in a currency other than the functional currency of the Company or the subsidiary. Exchange differences (gains and losses) arising on the settlement of monetary items or on translation of monetary items at rates different from those at which they were translated on initial recognition during the period or in previous financial statements are recognized in profit or loss in the period in which they arise. In order to reduce significant foreign currency transaction risk from our operating activities, we may use forward exchange contracts to hedge forecasted cash inflows and outflows. Furthermore, most non-U.S. dollar denominated debts are held by non-U.S. dollar denominated subsidiaries in the same functional currency of their operations. In certain instances, we hedge such foreign currency exposures, in which case the impact of foreign currency movement on the transaction is offset, to the extent hedged, and accounted for in the income statement concurrently with the underlying transaction.
The section “Management’s Discussion and Analysis of Financial Condition and Results of Operations—Quantitative and Qualitative Disclosure About Market Risk—Foreign Currency Risk” sets out the impact of the foreign currency transaction and translation risks for the operating periods included in this prospectus.
21
Table of Contents
Economic, regulatory, political and local business risks in developing countries could materially adversely affect our business and results of operations.
We currently operate production facilities in China and, in the future, we may expand our business and operations into other high growth emerging markets, including Asian markets and potentially including India. Our operations in those countries are subject to the risks inherent in operating in developing countries. These risks may include, but are not limited to, the following:
| • | legal rights, including intellectual property rights, may be difficult to enforce and receivables may be difficult to collect through enforcement proceedings; |
| • | withholding taxes or other taxes on our foreign income may be more likely to be imposed by these countries, or other restrictions on foreign trade or investment, including currency exchange controls, may be adopted; |
| • | export and import licenses may be difficult to obtain and maintain; |
| • | regulatory requirements, particularly those affecting product requirements and the use of raw materials and labor, and environmental, health and safety standards or regulations, may be subject to change; and |
| • | economic or political conditions in emerging markets may change rapidly and such markets may be subject to greater risks of inflation and fluctuations in exchange rates and interest rates. |
If any of the risks described above materialize, our business, financial condition and results of operations may be materially adversely affected.
We are subject to risks inherent in foreign operations, including changes in social, political and economic conditions that could negatively impact our business prospects or operations.
We have operations in the United States, Europe, Latin America and Asia, and generate a portion of our sales in foreign countries, primarily in Europe. Similar to other companies with foreign operations and sales, we are exposed to market risks relating to fluctuations in interest rates and foreign currency exchange rates. We are also exposed to risks associated with changes in the laws and policies governing foreign investments in these countries and, to a lesser extent, changes in United States laws and regulations relating to foreign trade and investment. While such changes in laws, regulations and conditions have not had a material adverse effect on our business or financial condition, we cannot assure you as to the future effect of any such changes.
We are subject to the U.S. Foreign Corrupt Practices Act and other anti-corruption laws, as well as other laws governing our operations. If we fail to comply with these laws, we could be subject to civil or criminal penalties, other remedial measures, and legal expenses, which could adversely affect our business, financial condition and results of operations.
Our operations are subject to anti-corruption laws, including the U.S. Foreign Corrupt Practices Act (“FCPA”), the UK Bribery Act, and other anti-corruption laws that apply in countries where we do business. The FCPA, UK Bribery Act and these other laws generally prohibit us and our employees and intermediaries from bribing, being bribed or making other prohibited payments to government officials or other persons to obtain or retain business or gain some other business advantage. We operate in a number of jurisdictions that pose a high risk of potential FCPA/UK Bribery Act violations, and we participate in joint ventures and relationships with third parties whose actions could potentially subject us to liability under the FCPA, UK Bribery Act or local anti-corruption laws. In addition, we cannot predict the nature, scope or effect of future regulatory requirements to which our international operations might be subject or the manner in which existing laws might be administered or interpreted.
We are also subject to other laws and regulations governing our international operations, including regulations administered by the U.S. Department of Commerce’s Bureau of Industry and Security, the U.S.
22
Table of Contents
Department of Treasury’s Office of Foreign Asset Control, and various non-U.S. government entities, including applicable export control regulations, economic sanctions on countries and persons, customs requirements, currency exchange regulations and transfer pricing regulations (collectively, the “Trade Control laws”).
However, there is no assurance that we will be completely effective in ensuring our compliance with all applicable anticorruption laws, including the FCPA, the UK Bribery Act, or other legal requirements, including Trade Control laws. If we are not in compliance with the FCPA, the UK Bribery Act and other anti-corruption laws or Trade Control laws, we may be subject to criminal and civil penalties, disgorgement and other sanctions and remedial measures, and legal expenses, which could have an adverse impact on our business, financial condition, results of operations and liquidity. Likewise, any investigation of any potential violations of the FCPA, the UK Bribery Act, other anti- corruption laws or Trade Control laws by U.S. or foreign authorities could also have an adverse impact on our reputation, business, financial condition and results of operations.
If we are unable to continue to obtain government authorizations regarding the export of our products, or if current or future export laws limit or otherwise restrict our business, we could be prohibited from shipping our products to certain countries, which would harm our ability to generate revenue.
We must comply with U.S. and foreign laws regulating the export of our products. In certain cases, we are required to obtain a license from the U.S. federal government and foreign governments to export certain of our products. We cannot be sure of our ability to obtain any licenses required to export our products or to receive government authorizations for international sales. Moreover, the export regimes and the governing policies applicable to our business are subject to change. We cannot assure you of the extent that such export authorizations will be available to us, if at all, in the future. If we cannot obtain required government approvals under applicable regulations in a timely manner or at all, we would be delayed or prevented from selling our products in international jurisdictions, which could adversely affect our business and financial results.
We are subject to risks from litigation that may materially impact our operations.
We face an inherent business risk of exposure to various types of claims and lawsuits. We are involved in various legal proceedings that arise in the ordinary course of our business. Although it is not possible to predict with certainty the outcome of every pending claim or lawsuit or the range of probable loss, we believe these pending lawsuits and claims will not individually or in the aggregate have a material adverse impact on our results of operations. However, we could in the future be subject to various lawsuits, including intellectual property, product liability, personal injury, product warranty, environmental or antitrust claims, among others, and incur judgments or enter into settlements of lawsuits and claims that could have a material adverse effect on our results of operations in any particular period.
Tax audits and changes in tax law may adversely affect our cash flows.
The application of the tax laws of the various tax jurisdictions in which we operate are subject to interpretation. Tax audits in these jurisdictions could adversely affect our cash flows. In addition, changes in the tax laws of these jurisdictions could increase our tax expense and as a consequence reduce our cash flows.
Risks Relating to Our Industry
We may face increasing competition, which could have a material adverse effect on our business and results of operations.
Although the alkylamine industry is highly consolidated, we may face increased competition from existing and new foreign and domestic amines and derivatives producers. Competition within the alkylamines industry depends on regional market dynamics and varies significantly according to the specific products and applications involved. In addition, competition within the markets for our products is affected by a variety of factors, including but not limited to demand, product prices, reliability of product supply, relevant production capacity, customer service, product quality and availability to the markets of potential substitute materials. We cannot
23
Table of Contents
guarantee that we will be able to compete effectively against our current and future competitors. Increased competition from our competitors or the entrance of new competitors into the markets in which we operate could have a material adverse effect on our business and results of operations. See “Industry Overview.”
Some of our international competitors may also have better process management and may utilize more advanced technology than we do or may open new facilities that increase their installed capacity and ability to produce more products that compete with ours.
Our competitors in any particular market may also benefit from raw material suppliers or production facilities that are closer to such markets, which provide them with competitive advantages in terms of cost and proximity to customers. For example, much of the future growth in global demand for methylamines and methylamine derivatives, especially various types of solvents and choline chloride, is expected to originate in China. China’s small producers may be able to better capture this growth due to their proximity to certain industrial and agricultural customers in that region. In addition, there may be new market entrants that would increase the level of competition we face.
Our business and financial condition may be negatively impacted by new production methods or ingredients that offer alternatives to our products.
We believe our alkylamines and alkylamine derivatives are sustainable and key building blocks that are generally difficult to substitute in the production of the various chemical products which currently use alkylamines and alkylamine derivatives. However, our competitors and customers may develop new methods of producing the chemical products that currently rely on the use of alkylamines or develop new ingredients that are viable alternatives to our products. For example, one of our products used in the production of herbicides, MIPA, has been substituted for other derivatives used in glyphosate formulations. The successful development of such new production methods or ingredients that offer an alternative to or substitute for alkylamines could cause our sales to decrease, which would materially adversely affect our business, financial condition and results of operation.
We are subject to product registration and authorization regulations in many of the jurisdictions in which we operate and/or distribute our products, including the United States and member states of the European Union. Such regulations may lead to governmental restrictions or cancellations of, or refusal to issue, certain registrations or authorizations, or cause us or our customers to make product substitutions in the future. Such regulations may also lead to increased third party scrutiny and personal injury or product liability claims.
We are subject to regulations related to testing, manufacturing, labeling, registration and safety analysis in order to lawfully distribute many of our products, including, for example, in the U.S., the federal Toxic Substances Control Act, federal Insecticide, Fungicide, and Rodenticide Act and U.S. state and local pesticide laws, and, in the European Union (“E.U.”), the Regulation on Registration, Evaluation, Authorization and Restriction of Chemical Substances (“REACH”). We are also subject to similar requirements in many of the other jurisdictions in which we operate and/or distribute our products. In some cases, such registrations are subject to periodic review by relevant authorities. Compliance with these regulations can be difficult, costly and time consuming and liabilities or costs relating to such regulations could have a material adverse effect on our business, financial condition and results of operations.
Currently, three of our products are classified under REACH as carcinogenic, mutagenic or toxic to reproduction (“CMR”). These CMR classifications could result in increased costs to us, marketing and use restrictions in other jurisdictions, additional authorization requirements, or product substitutions, each of which could have a material adverse effect on our business, financial condition and results of operations.
In addition, REACH could require a costly and time-consuming authorization process for any chemical deemed a Substance of Very High Concern (“SVHC”), and listed by the European Commission in Annex XIV to REACH, to remain on the market. Currently, our products NMP and DMAC are each listed as a SVHC and certain of our other products may be listed in the future. This and future listings could result in increased costs,
24
Table of Contents
product substitution by customers, marketing or use restrictions, or potential product bans without European Commission authorization, each of which could have a material adverse effect on our business, financial condition and results of operations. It is possible that the REACH authorization process or other marketing and use restrictions could be imposed on some chemicals that we use as raw materials or that are manufactured and/or imported into the E.U. by ourselves or our suppliers. If this were to occur, this could have a material adverse effect on our business, financial condition and results of operations.
Further, the CMR classifications and SVHC listings under REACH as well as any future classifications or listings of our products may result in increased third party scrutiny and personal injury or product liability litigation. Any such scrutiny or litigation could have a material adverse effect on our business, financial condition and results of operations.
Also in the E.U., our plant protection products require approval under Article 28 of Regulation 1107/2009 (the “EU PPPR”) by each Member State where they are sold. Other of our products must have E.U. level approval pursuant to the Biocidal Product Regulation (EU) No. 528/2012 (the “EU BPR”) concerning the placing of biocidal products on the market in order for us to market and sell them for particular uses. We are currently seeking European Commission authorization for two of our products to be marketed as biocidal products, which as of January 2013, had not yet been granted. We cannot assure you that these authorizations will be granted. In addition, as existing authorizations expire, we may be unable to obtain reauthorization for such products. In such case, we would be unable to market and sell any such plant protection or biocidal product not reauthorized in the E.U. going forward. The failure to obtain these authorizations or reauthorizations could have a material adverse effect on our business, financial condition and results of operations.
Our permits, licenses, registrations or authorizations and those of our customers or distributors may be modified, suspended, terminated or revoked before their expiration or we and/or they may be unable to renew them upon their expiration. We may bear liability for failure to obtain, maintain or comply with required authorizations.
We are required to obtain and maintain, and may be required to obtain and maintain in the future, various permits, licenses, registrations and authorizations for the ownership or operation of our business, including the manufacturing, distribution, sale and marketing of our products and importing of raw materials. See “Business—Our Operations—Environmental, Health and Safety Matters.” These permits, licenses, registrations and authorizations could be modified, suspended, terminated or revoked or we may be unable to renew them upon their expiration for various reasons, including for non-compliance. These permits, licenses, registrations and authorizations can be difficult, costly and time consuming to obtain and could contain conditions that limit our operations. Our failure to obtain, maintain and comply with necessary permits, licenses, registrations or authorizations for the conduct of our business could result in fines or penalties, which may be significant. Additionally, any such failure could restrict or otherwise prohibit certain aspects of our operations, which could have a material adverse effect on our business, financial condition and results of operations.
Many of our customers and distributors require similar permits, licenses, registrations and authorizations to operate. If a significant customer, distributor or group thereof were to have an important permit, license, registration or authorization revoked or such permit, license, registration or authorization was not renewed, forcing them to cease or reduce their business, our sales could decrease, which would have a material adverse effect on our business, financial condition and results of operations.
We are subject to stringent environmental, health and safety laws and regulations across multiple jurisdictions, which could become more stringent in the future and increase our operating expenses. Failure to comply with these laws and regulations could result in fines and penalties, injunctions and other enforcement action.
Similar to other chemical producers, we are subject to increasingly stringent environmental, health and safety laws and regulations in all of the jurisdictions in which we operate, including those governing pollution;
25
Table of Contents
protection of the environment; air emissions; greenhouse gas emissions; energy efficiency; water supply, use and discharges; construction and operation of sites; the use, generation, handling, transport, treatment, recycling, presence, release and threatened release, management, storage and disposal of and exposure to hazardous substances, materials or waste; public health and safety and the health and safety of our employees; product safety; noise, odor, mold, dust and nuisance; the investigation and remediation of contaminated soil and groundwater; the protection and restoration of plants, wildlife and natural resources; and cultural and historic resources, land use and other similar matters as well as numerous related reporting and record keeping requirements. See “Business—Our Operations—Environmental, Health and Safety Matters.”
In addition, we are required to comply with environmental, health and safety laws and regulations in relation to our production and distribution processes, and the relevant regulatory authorities carry out regular inspections to ascertain our compliance with applicable laws, regulations and permits. The demands of compliance may require us to incur substantial costs, fines or penalties and/or may restrict our ability to conduct our operations, or to do so profitably, and therefore could have a material adverse effect on our business, financial condition and results of operations. Failure to comply with applicable laws and regulations may also lead to public reprimand, fines and penalties, enforcement actions, injunctions, loss of sales and damage to our goodwill and reputation. Further, such laws and regulations, and the interpretation or enforcement thereof, are subject to change and may become more stringent in the future, each of which may result in substantial future capital expenditure requirements or compliance costs. See “Business—Our Operations—Environmental, Health and Safety Matters.”
We cannot assure you that our costs of complying with current and future environmental health and safety laws, and our liabilities arising from past or future releases of, or exposure to, hazardous substances will not materially adversely affect our business, financial condition or results of operations.
Our operations or products may impact the environment or cause or contribute to contamination or exposure to hazardous substances, which could result in material liabilities for us.
Our operations generate substantial air emissions, water discharges and hazardous waste requiring treatment or disposal. We could become subject to investigation or clean-up obligations, related third-party personal injury or property damage claims or other liabilities in connection with emissions, spills and releases of hazardous materials at current or former properties or at off-site locations. For example, under certain U.S. environmental laws, current and former property owners and operators, as well as hazardous waste generators, arrangers and transporters, can be held liable for investigation and clean-up costs at properties where there has been a “release” or “threatened release” of hazardous substances. Some of these laws can also require so-called “potentially responsible parties” to fund the restoration of damaged natural resources or agree to restrictions on future uses of impacted properties. Liability under such laws can be strict, joint, several and retroactive. Accordingly, we could incur liability, whether as a result of government enforcement or private claims, for known or unknown liabilities at, or caused by migrations from or hazardous waste transported from, any of our current or former facilities or properties, including those owned or operated by predecessors or third parties. We could also incur liability under common law or state law theories, including, for example, nuisance theories for noise, odor or vibration caused by our operations. We are subject to similar laws in other jurisdictions where we operate. See “Business—Our Operations—Environmental, Health and Safety Matters.” In addition, we occasionally evaluate various strategic alternatives with respect to our facilities, including possible dispositions or closures. Investigations undertaken in connection with these activities may lead to discoveries of contamination that must be remediated, and closures of facilities may trigger remediation requirements that are not currently applicable to our operating facilities.
Certain contamination at several of our properties is currently being directly addressed by third parties at their expense in accordance with contractual obligations and a governmental order. See “Business—Our Operations—Environmental, Health and Safety Matters—Contamination and Hazardous Substance Risks.” There can be no assurances that these third parties will continue to honor these obligations in the future. If third parties refuse to or are unable in the future to perform or pay in accordance with contractual or other obligations, if their contractual or other obligations expire, or if certain contamination or other liability for which we are or become
26
Table of Contents
obligated is not subject to an indemnity, we may be responsible for cleanup of contamination and could incur significant unanticipated costs. It is possible that we will not be able to recover a substantial portion, if any, of the costs that we may incur. Although costs incurred by us in connection with contamination matters to date have not been material, future cleanup costs could have a material adverse effect on our business, financial condition and results of operations.
Furthermore, exposure of our employees, the environment, neighbors and others to risks connected with the manufacturing of our products may result in claims. In connection with contaminated properties, as well as with our operations generally, we could be subject to claims by government authorities, individuals and other third parties seeking damages for alleged personal injury or property damage resulting from hazardous substance contamination or exposure caused by our operations, facilities or products. Our insurance may not be sufficient to cover any of these exposure, product, injury or damage claims.
We are subject to federal regulations aimed at increasing the security of chemical manufacturing facilities and the transportation of hazardous materials. If the costs of complying with these and future regulations increase, our business and results of operations may be negatively impacted.
The U.S. Department of Homeland Security issued regulations aimed at decreasing the risk, and effect, of potential terrorist attacks on chemical plants located within the United States. Our facilities in the United States are subject to these regulations, including the Chemical Facility Anti-Terrorism Standard as well as regulations regarding the transportation of chemicals in the United States. In addition, local and state governmental authorities have instituted various regulatory processes that could lead to new regulations impacting the security of chemical plant locations and the transportation of hazardous chemicals. We are a participant in certain voluntary supply chain programs, such as the U.S. Customs and Border Protections’ Customs–Trade Partnership Against Terrorism (“C–TPAT”) program and the E.U. Authorized Economic Operator (“AEO”) program. It is possible that growth of our production facilities may trigger new regulation and that future legislation or other related legislation may require a substantial increase in costs attributable to complying with such new regulations, which could have a material adverse effect on our business, financial condition and results of operations.
We are exposed to fluctuations in supply and demand for our products, which could decrease our net sales.
Fluctuations in the supply and demand for alkylamines and derivatives in our primary markets may trigger fluctuations in the average selling prices of our products. For example, recent low natural gas prices in the United States have impacted new investments for shale gas exploration and, by extension, demand for certain of our Specialty Amines products. The fluctuations in the average selling prices of our products are primarily caused by market competition, changes in raw material costs and other macroeconomic factors that are beyond our control. For more information about the price fluctuations of our raw materials, see “Business—Our Operations—Raw Materials.”
A number of macroeconomic factors drive demand for chemicals, including changes in world population, availability of arable land per capita and income growth. See “Industry Overview—Markets for Our Products.” Negative trends in any one of these factors may result in a decrease in demand for our products and could have a material adverse effect on our business and results of operations.
As a result of fluctuations in supply and demand for our products, we may experience volatile or declining average selling prices for our products in the future or our average selling prices may not remain at consistent levels. This may result in pressure on our operating margins as average selling prices fall but fixed costs remain constant. Any decrease in the demand for alkylamines and derivatives in our primary markets or any other factor which negatively impacts upon our ability to sell our alkylamines and derivatives could have a material adverse effect on our business and results of operations.
27
Table of Contents
Our business, reputation and products may be affected by product liability claims, complaints or adverse publicity in relation to our products.
Our products involve an inherent risk of injury that may result from tampering by unauthorized third parties or from product contamination or degeneration, including through the presence of foreign contaminants, chemicals, substances or other agents or residues during the various stages of the procurement, production, transportation and storage process. We cannot guarantee that our products will not cause any health related illness or injury in the future or that we will not be subject to claims or lawsuits relating to such matters. Although we carry customary third-party liability and product liability insurance, in the event that a product liability or third-party liability claim is brought against us, we cannot guarantee that we will be successful in making an insurance claim under our policies or that the claimed proceeds will be sufficient to compensate the actual damages suffered. For more information, see “Business—Insurance.”
We may be required to recall our products in certain jurisdictions if they fail to meet relevant quality or safety standards. We cannot guarantee that product liability claims will not be asserted against us as a result. A product liability judgment against us or a product recall could have a material adverse effect on our business and results of operations. In addition, we could be required to increase our debt or divert resources from other investments in our business to discharge any such claims. In addition, adverse publicity in relation to our products could have a significant affect on future sales, which could result in a material adverse affect on the profitability of our operations.
Poor weather conditions could have a material adverse effect on our business.
Poor weather conditions can reduce our sales, particularly in the Crop Protection segment. Sales of our Crop Protection products are affected by weather patterns because crop harvests, and decisions about whether to plant crops, vary according to whether the growing season is excessively wet or dry. Undesirable weather conditions lead to smaller harvests and, accordingly, less demand for our products. The effects of poor weather conditions may have a delayed impact on our results of operations as we sell our products to distributors who may have excess supply, or buy raw materials from suppliers who may have reduced supply, after a poor growing season, resulting in lower order volume the following season. For example, poor weather conditions negatively impacted our volumes in early 2009, which resulted in the loss of two suppliers of our raw materials and, ultimately, a decrease in gross profit margin for 2010.
A variety of force majeure events and the volatile nature of our chemical products could have a material adverse effect on our business. In addition, our production facilities are subject to significant operating hazards and shutdowns.
Our manufacturing operations may be disrupted by a variety of risks and hazards that are beyond our control, such as environmental hazards, strikes and certain catastrophic events, including fires, inclement weather conditions or events, major equipment failures, natural disasters, terrorist strikes and other accidents or events causing stoppages which could lead to shutdowns in operations. Any damage to our facilities, including our information systems, causing short-term disruptions or prolonged delay in the operations of the facilities and distribution and logistics services for repairs or other reasons could have a material adverse effect on our business and results of operations. Additionally, similar risks faced by our suppliers may result in force majeure events under our supply contracts that disrupt our production or increase our costs or both. For example, in 2010, an explosion at the plant of a methanol supplier in Leuna and a catalyzation problem at another methanol supplier for our Pace facility disrupted contracted-for supply for approximately one month and two months, respectively. While we were able to source replacement methanol on the market during those periods, there is no guarantee that in the future we could do so. Additionally, market rates for methanol purchased during a force majeure event have been higher than under contract. In addition, we experienced a power outage at the Ghent facility and a plant outage following difficulties with an ethylene oxide scrubber at the St. Gabriel facility in the summer of 2011. While we were able to correct these problems, we cannot assure you that in the future, similar outages will not take place, or that the impact will be effectively contained if they do. Such disruptions or cost increases could have a material adverse effect on our business and results of operations.
28
Table of Contents
We use, manage, process, manufacture, store, transport and dispose of substantial quantities of chemicals, hazardous raw materials and liquid and solid wastes at our chemical facilities. Some of these materials are very volatile and could be harmful if handled or disposed of improperly. See “Industry Overview.” Accidents involving these substances, which are often subject to high pressures and temperatures during the production process, storage and transport, could cause severe damage or injury to property, the environment and human health, as well as possible disruptions, restrictions or delays in production. Any injuries or damage to persons, equipment or property or other disruption in the production or distribution of our products could result in a significant decrease in operating revenue and significant increase in costs to replace or repair and insure our assets, which could materially adversely affect our business and results of operations. It could also have legal consequences, such as violations of regulatory requirements and/or lawsuits for personal injuries, property damage or diminution, and similar claims.
Our insurance policies may not cover, or fully cover, us against natural disasters, global conflicts, environmental risk or the inherent hazards of our operations and products.
We currently have insurance policies for certain operating risks, which include certain property damage, including certain aspects of business interruption for certain sites, operational and product liability, marine stock, transit, directors’ and officers’ liability, pollution legal liability and industrial accident insurance. See “Business—Insurance.” However, we may become subject to liability (including in relation to pollution, occupational illnesses, injury resulting from tampering, product contamination or degeneration or other hazards) against which we have not insured or cannot fully insure.
For example, military action, terrorist attacks or hurricanes may affect our facilities. In particular, the failure of our information systems as a result of breakdown, malicious attacks, unauthorized access, viruses or other factors could severely impair several aspects of operations, including, but not limited to, logistics, sales, customer service and administration. See “Business—Information Technology.” In the past, hurricanes have caused some damage to our facilities in Florida and Louisiana and have affected our ability to deliver products on time. In addition, in the event that a product liability or third-party liability claim is brought against us, we may be required to recall our products in certain jurisdictions if they fail to meet relevant quality or safety standards, and we cannot guarantee that we will be successful in making an insurance claim under our policies or that the claimed proceeds will be sufficient to compensate the actual damages suffered.
Should we suffer a major uninsured loss, a product liability judgment against us or a product recall, future earnings could be materially adversely affected. We could be required to increase our debt or divert resources from other investments in our business to discharge product related claims. In addition, adverse publicity in relation to our products could have a significant effect on future sales, and, insurance may not continue to be available at economically acceptable premiums. As a result, our insurance coverage may not cover the full scope and extent of claims against us or losses that we incur, including, but not limited to, claims for environmental or industrial accidents, occupational illnesses, pollution and product liability and business interruption. See “Business—Insurance.”
We are subject to the risk of labor relations actions which may disrupt our operations.
Approximately 35% of our workforce is part of a trade union. There can be no assurance that our operations will not be affected by labor relations actions in the future, and there can be no assurance that work stoppages or other labor-related developments will not materially adversely affect our business and results of operations in the future. Future labor contracts may be on terms that result in higher labor costs to us, which also could adversely affect our business.
29
Table of Contents
Risks Relating to This Offering and Ownership of Our Common Stock
An active trading market for our common stock may not develop.
Prior to this offering, there has been no public market for our common stock. The initial public offering price for our common stock will be determined through negotiations between us and the underwriters, and market conditions, and may not be indicative of the market price of our common stock after this offering. If you purchase shares of our common stock, you may not be able to resell those shares at or above the initial public offering price. We cannot predict the extent to which investor interest in the Company will lead to the development of an active trading market or how liquid that market might become. An active public market for our common stock may not develop or be sustained after the offering. If an active public market does not develop or is not sustained, it may be difficult for you to sell your shares of common stock at a price that is attractive to you, or at all.
Our stock price may be volatile or may decline regardless of our operating performance, and you may not be able to resell your shares at or above the initial public offering price.
After this offering, the market price for our common stock is likely to be volatile, in part because our shares have not been traded publicly. In addition, the market price of our common stock may fluctuate significantly in response to a number of factors, many of which we cannot control, including those described under “—Risks Relating to Our Business” and the following:
| • | changes in financial estimates by any securities analysts who follow our common stock, our failure to meet these estimates or failure of those analysts to initiate or maintain coverage of our common stock; |
| • | downgrades by any securities analysts who follow our common stock; |
| • | future sales of our common stock by our officers, directors and significant stockholders; |
| • | market conditions or trends in our industry or the economy as a whole; |
| • | investors’ perceptions of our prospects; |
| • | announcements by us or our competitors of significant contracts, acquisitions, joint ventures or capital commitments; and |
| • | changes in key personnel. |
In addition, the stock markets have experienced extreme price and volume fluctuations that have affected and continue to affect the market prices of equity securities of many companies. The changes frequently appear to occur without regard to the operating performance of the affected companies. Hence, the price of our common stock could fluctuate based upon factors that have little or nothing to do with us, and these fluctuations could materially reduce our share price.
Apollo controls us and its interests may conflict with or differ from your interests as a stockholder.
After the consummation of this offering, funds affiliated with Apollo will beneficially own approximately % of our common stock, assuming the underwriters do not exercise their option to purchase additional shares, or % if the underwriters exercise their option in full. In addition, representatives of Apollo comprise 5 of our 9 directors and funds affiliated with Apollo have the power to elect all of our directors. As a result, Apollo will continue to have the ability to prevent any transaction that requires the approval of our board of directors or stockholders, including the approval of significant corporate transactions such as mergers and the sale of substantially all of our assets.
The interests of Apollo could conflict with or differ from your interests as a holder of our common stock. For example, the concentration of ownership held by funds affiliated with Apollo could delay, defer or prevent a change of control of us or impede a merger, takeover or other business combination that you as a stockholder
30
Table of Contents
may otherwise view favorably. Apollo is in the business of making or advising on investments in companies and holds, and may from time to time, in the future, acquire interests in or provide advice to businesses that directly or indirectly compete with certain portions of our business or are suppliers or customers of ours. They may also pursue acquisitions that may be complementary to our business, and, as a result, those acquisition opportunities may not be available to us.
Our certificate of incorporation will provide that we expressly renounce any interest or expectancy in any business opportunity, transaction or other matter in which Apollo or any of its members, directors, employees or other affiliates (the “Apollo Group”) participates or desires or seeks to participate in, even if the opportunity is one that we would reasonably be deemed to have pursued if given the opportunity to do so. The renouncement does not apply to any business opportunities that are presented to an Apollo Group member solely in such person’s capacity as a member of our board of directors and with respect to which no other member of the Apollo Group independently receives notice or otherwise identifies such business opportunity prior to us becoming aware of it, or if the business opportunity is initially identified by the Apollo Group solely through the disclosure of information by or on behalf of us.
So long as funds affiliated with Apollo continue to beneficially own a significant amount of our equity, even if such amount is less than 50%, it may continue to be able to strongly influence or effectively control our decisions.
Following the offering, we will be classified as a “controlled company” and, as a result, we will qualify for, and intend to rely on, exemptions from certain corporate governance requirements. You will not have the same protections afforded to stockholders of companies that are subject to such requirements.
Upon the closing of this offering, funds affiliated with Apollo will continue to control a majority of our common stock. As a result, we will be a “controlled company” within the meaning of the applicable stock exchange corporate governance standards. Under the rules, a company of which more than 50% of the outstanding voting power is held by an individual, group or another company is a “controlled company” and may elect not to comply with certain stock exchange corporate governance requirements, including:
| • | the requirement that a majority of the board of directors consists of independent directors; |
| • | the requirement that we have a nominating/corporate governance committee that is composed entirely of independent directors; |
| • | the requirement that we have a compensation committee that is composed entirely of independent directors; and |
| • | the requirement for an annual performance evaluation of the nominating/corporate governance and compensation committees. |
Following this offering, we intend to utilize these exemptions. As a result, we will not have a majority of independent directors and our nominating/corporate governance and compensation committees will not consist entirely of independent directors and we will not be required to have an annual performance evaluation of the nominating/corporate governance and compensation committees. Accordingly, you will not have the same protections afforded to stockholders of companies that are subject to all of the stock exchange corporate governance requirements.
If you purchase shares of common stock sold in this offering, you will incur immediate and substantial dilution.
If you purchase shares of common stock in this offering, you will incur immediate and substantial dilution in the amount of $ per share because the initial public offering price of $ is substantially higher than the pro forma net tangible book value per share of our outstanding common stock. This dilution is due in large part
31
Table of Contents
to the fact that our earlier investors paid substantially less than the initial public offering price when they purchased their shares. In addition, you may also experience additional dilution upon future equity issuances or the exercise of stock options to purchase common stock granted to our employees, consultants and directors under our stock option and equity incentive plans. See “Dilution.”
Because we do not anticipate paying dividends on our common stock in the foreseeable future, you should not expect to receive dividends on shares of our common stock.
We have no present plans to pay dividends to our stockholders and, for the foreseeable future, intend to retain all of our earnings for use in our business. The declaration of any future dividends by us is within the discretion of our board of directors and will be dependent on our earnings, financial condition and capital requirements, as well as any other factors deemed relevant by our board of directors. Accordingly, if you purchase shares in this offering, realization of a gain on your investment will depend on the appreciation of the price of our common stock, which may never occur.
We may be restricted from paying cash dividends on our common stock in the future.
We are a holding company that does not conduct any business operations of our own. As a result, we are largely dependent upon cash dividends and distributions and other transfers from our subsidiaries to make dividend payments on our common stock. The amounts available to us to pay cash dividends may be restricted by law, regulation, or any debt agreements entered into by us or our subsidiaries. For example, our Senior Secured Credit Facilities contain covenants limiting the payment of cash dividends without the consent of the lenders and the indentures governing our Notes contain covenants limiting the payment of cash dividends without the consent of the holders of the Notes. We cannot assure you that these agreements or the agreements governing any future indebtedness of us or our subsidiaries, or applicable laws or regulations, will permit us to pay dividends on our common stock or otherwise adhere to any dividend policy we may adopt in the future.
Future sales of our common stock, or the perception in the public markets that these sales may occur, may depress our stock price.
Sales of substantial amounts of our common stock in the public market after this offering, or the perception that these sales could occur, could adversely affect the price of our common stock and could impair our ability to raise capital through the sale of additional shares. Upon completion of this offering, we will have shares of common stock outstanding. The shares of common stock offered in this offering will be freely tradable without restriction under the Securities Act of 1933, as amended (the “Securities Act”) except for any shares of our common stock that may be held or acquired by our directors, executive officers and other affiliates, as that term is defined in the Securities Act, which will be restricted securities under the Securities Act. Restricted securities may not be sold in the public market unless the sale is registered under the Securities Act or an exemption from registration is available.
We, each of our officers and directors and certain other security holders have agreed, subject to certain exceptions, with the underwriters not to dispose of or hedge any of the shares of common stock or securities convertible into or exchangeable for shares of common stock during the period from the date of this prospectus continuing through the date that is 180 days after the date of this prospectus, except, in our case, for the issuance of common stock upon exercise of options under existing option plans. The underwriters may, in their sole discretion, release any of these shares from these restrictions at any time without notice. See “Underwriting.”
After this offering, subject to any lock-up restrictions described above with respect to certain holders, holders of approximately shares of our common stock will have the right to require us to register the sales of their shares under the Securities Act, under the terms of an agreement between us and the holders of these securities.
32
Table of Contents
In the future, we may also issue our securities in connection with investments or acquisitions. The amount of shares of our common stock issued in connection with an investment or acquisition could constitute a material portion of our then-outstanding shares of our common stock.
As a public company, we will become subject to additional financial and other reporting and corporate governance requirements that may be difficult for us to satisfy and may divert management’s attention from our business.
As a public company, we will be required to file annual and quarterly reports and other information pursuant to the Securities Exchange Act of 1934, as amended (the “Exchange Act”), with the SEC. We will be required to ensure that we have the ability to prepare financial statements that comply with SEC reporting requirements on a timely basis. We will also be subject to other reporting and corporate governance requirements, including the applicable stock exchange listing standards and certain provisions of the Sarbanes-Oxley Act and the regulations promulgated thereunder, which impose significant compliance obligations upon us. Specifically, we will be required to:
| • | prepare and distribute periodic reports and other stockholder communications in compliance with our obligations under the federal securities laws and applicable stock exchange rules; |
| • | create or expand the roles and duties of our board of directors and committees of the board; |
| • | institute compliance and internal audit functions that are more comprehensive; |
| • | evaluate and maintain our system of internal control over financial reporting, and report on management’s assessment thereof, in compliance with the requirements of Section 404 of the Sarbanes-Oxley Act (“Section 404”) and the related rules and regulations of the SEC and the Public Company Accounting Oversight Board; |
| • | enhance our investor relations function; |
| • | maintain internal policies, including those relating to disclosure controls and procedures; and |
| • | involve and retain outside legal counsel and accountants in connection with the activities listed above. |
As a public company, we will be required to commit significant resources and management time and attention to the above-listed requirements, which will cause us to incur significant costs and which may place a strain on our systems and resources. As a result, our management’s attention might be diverted from other business concerns. In addition, we might not be successful in implementing these requirements. The cost of preparing and filing annual and quarterly reports, proxy statements and other information with the SEC and furnishing audited reports to stockholders will cause our expenses to be higher than they would be if we remained a privately held company. Our management and other personnel will need to devote a substantial amount of time to comply with these rules and regulations.
In addition, the Sarbanes-Oxley Act requires that we maintain effective disclosure controls and procedures and internal control over financial reporting. To maintain and improve the effectiveness of our disclosure controls and procedures, significant resources and management oversight will be required. We will be implementing additional procedures and processes for the purpose of addressing the standards and requirements applicable to public companies. We expect to incur certain additional annual expenses related to these activities and, among other things, additional directors’ and officers’ liability insurance, director fees, reporting requirements, transfer agent fees, hiring additional accounting, legal and administrative personnel, increased auditing and legal fees and similar expenses.
Failure to design, implement and maintain effective internal controls could have a material adverse effect on our business and stock price.
As a public company, we will have significant requirements for enhanced financial reporting and internal controls. The process of designing and implementing effective internal controls is a continuous effort that
33
Table of Contents
requires us to anticipate and react to changes in our business and the economic and regulatory environments and to expend significant resources to maintain a system of internal controls that is adequate to satisfy our reporting obligations as a public company. If we are unable to establish or maintain appropriate internal financial reporting controls and procedures, it could cause us to fail to meet our reporting obligations on a timely basis, result in material misstatements in our financial statements and harm our operating results. In addition, we will be required, pursuant to Section 404, to furnish a report by management on, among other things, the effectiveness of our internal control over financial reporting for the first fiscal year beginning after the effective date of this offering. This assessment will need to include disclosure of any material weaknesses identified by our management in our internal control over financial reporting, as well as a statement that our auditors have issued an attestation report on effectiveness of our internal controls. Testing and maintaining internal controls may divert our management’s attention from other matters that are important to our business. We may not be able to conclude on an ongoing basis that we have effective internal control over financial reporting in accordance with Section 404 or our independent registered public accounting firm may not issue a favorable assessment. If either we are unable to conclude that we have effective internal control over financial reporting or our independent registered public accounting firm is unable to provide us with an unqualified report, investors could lose confidence in our reported financial information, which could have a material adverse effect on the trading price of our stock.
Our organizational documents may impede or discourage a takeover, which could deprive our investors of the opportunity to receive a premium of their shares.
Provisions of our certificate of incorporation and bylaws may make it more difficult for, or prevent a third party from, acquiring control of us without the approval of our board of directors. These provisions include:
| • | having a classified board of directors; |
| • | establishing limitations on the removal of directors; |
| • | empowering only the board to fill any vacancy on our board of directors, whether such vacancy occurs as a result of an increase in the number of directors or otherwise; |
| • | authorizing the issuance of “blank check” preferred stock without any need for action by stockholders; |
| • | prohibiting stockholders from acting by written consent or calling a special meeting if less than 50.1% of our outstanding common stock is beneficially owned by funds affiliated with Apollo; and |
| • | establishing advance notice requirements for nominations for election to our board of directors or for proposing matters that can be acted on by stockholders at stockholder meetings. |
Our issuance of shares of preferred stock could delay or prevent a change in control of us. Our board of directors has the authority to cause us to issue, without any further vote or action by the stockholders, shares of preferred stock, par value $0.001 per share, in one or more series, to designate the number of shares constituting any series, and to fix the rights, preferences, privileges and restrictions thereof, including dividend rights, voting rights, rights and terms of redemption, redemption price or prices and liquidation preferences of such series. The issuance of shares of our preferred stock may have the effect of delaying, deferring or preventing a change in control without further action by the stockholders, even where stockholders are offered a premium for their shares.
In addition, as long as funds affiliated with Apollo beneficially own a majority of our outstanding common stock, Apollo will be able to control all matters requiring stockholder approval, including the election of directors, amendment of our certificate of incorporation and certain corporate transactions. Together, these charter, bylaw and statutory provisions could make the removal of management more difficult and may discourage transactions that otherwise could involve payment of a premium over prevailing market prices for our common stock. Furthermore, the existence of the foregoing provisions, as well as the significant common stock beneficially owned by funds affiliated with Apollo and its rights to nominate a specified number of directors in
34
Table of Contents
certain circumstances, could limit the price that investors might be willing to pay in the future for shares of our common stock. They could also deter potential acquirers of us, thereby reducing the likelihood that you could receive a premium for your common stock in an acquisition. For a further discussion of these and other such anti-takeover provisions, see “Description of Capital Stock—Certain Corporate Anti-takeover Provisions.”
We will have broad discretion in how we use the proceeds of this offering and we may not use these proceeds effectively. This could affect our results of operations and cause the price of our common stock to decline.
Our management team will have considerable discretion in the application of the net proceeds of this offering, and you will not have the opportunity, as part of your investment decision, to assess whether we are using the proceeds appropriately. We currently intend to use the net proceeds that we receive from this offering for repayment of indebtedness and other general corporate purposes. We may use the net proceeds for corporate purposes that do not improve our results of operations or which cause our stock price to decline.
If securities or industry analysts do not publish research or publish inaccurate or unfavorable research about our business, our stock price and trading volume could decline.
The trading market for our common stock will depend in part on the research and reports that securities or industry analysts publish about us or our business. We do not currently have and may never obtain research coverage by securities and industry analysts. If no securities or industry analysts commence coverage of the Company, the trading price for our common stock would be negatively impacted. If we obtain securities or industry analyst coverage and if one or more of the analysts who covers us downgrades our common stock or publishes inaccurate or unfavorable research about our business, our stock price would likely decline. If one or more of these analysts ceases coverage of us or fails to publish reports on us regularly, demand for our common stock could decrease, which could cause our stock price and trading volume to decline.
35
Table of Contents
CAUTIONARY STATEMENT REGARDING FORWARD-LOOKING STATEMENTS
Any statements made in this prospectus that are not statements of historical fact, including statements about our beliefs and expectations, are forward-looking statements within the meaning of the federal securities laws, and should be evaluated as such. Forward-looking statements include information concerning possible or assumed future results of operations, including descriptions of our business plan and strategies. These statements often include words such as “anticipate,” “expect,” “suggests,” “plan,” “believe,” “intend,” “estimates,” “targets,” “projects,” “should,” “could,” “would,” “may,” “will,” “forecast,” and other similar expressions. These forward-looking statements are contained throughout this prospectus, including the sections entitled “Prospectus Summary,” “Risk Factors,” “Capitalization,” “Management’s Discussion and Analysis of Financial Condition and Results of Operations” and “Business.” We base these forward-looking statements or projections on our current expectations, plans and assumptions that we have made in light of our experience in the industry, as well as our perceptions of historical trends, current conditions, expected future developments and other factors we believe are appropriate under the circumstances and at such time. As you read and consider this prospectus, you should understand that these statements are not guarantees of performance or results. The forward-looking statements and projections are subject to and involve risks, uncertainties and assumptions and you should not place undue reliance on these forward-looking statements or projections. Although we believe that these forward-looking statements and projections are based on reasonable assumptions at the time they are made, you should be aware that many factors could affect our actual financial results or results of operations and could cause actual results to differ materially from those expressed in the forward-looking statements and projections. Factors that may materially affect such forward-looking statements and projections include:
| • | increases in energy costs, in particular natural gas costs, or a disruption in the supply of energy for our operations; |
| • | the price and availability of raw materials, energy and equipment, and our ability to pass on increased costs to customers; |
| • | loss of major customers; |
| • | commercial viability of our new products and products under development; |
| • | changes in macroeconomic conditions; |
| • | inability to secure or protect intellectual property rights; |
| • | conduct of our operations through a joint venture with a third party; |
| • | loss of senior management expertise or inability to recruit and retain qualified personnel; |
| • | exchange rate fluctuations; |
| • | economic, regulatory, political and local business risks in developing countries; |
| • | the impact of the U.S. Foreign Corrupt Practices Act and other anti-corruption laws, as well as other laws governing our operations, and our compliance therewith; |
| • | inability to obtain government authorizations regarding the export of our products, or limitation or restrictions on our business imposed by current or future export laws; |
| • | increased competition; |
| • | inability to obtain, modify and/or renew permits, licenses, registrations or other regulatory authorizations; |
| • | the impact of environmental, health and safety laws and regulations, including those relating to greenhouse gas emissions, and compliance therewith; |
| • | costs associated with environmental contamination and/or exposure to hazardous substances, including natural resource damages; |
| • | refusal by or inability of third parties to perform or pay under indemnification or similar agreements; |
36
Table of Contents
| • | fluctuations in supply and demand for our products; |
| • | product liability claims, complaints or adverse publicity in relation to our products; |
| • | adverse weather conditions affecting sales or events of force majeure; |
| • | inadequacy of insurance coverage; |
| • | labor relations actions or other litigation; |
| • | our debt obligations and ability to raise additional financing in the future; |
| • | our ability to generate sufficient cash to service our debt and to control and finance our capital expenditures and operations; and |
| • | other factors discussed in more detail under “Risk Factors.” |
These cautionary statements should not be construed by you to be exhaustive and are made only as of the date of this prospectus. We undertake no obligation to update or revise any forward-looking statements, whether as a result of new information, future events or otherwise. If we do update one or more forward-looking statements, there should be no inference that we will make additional updates with respect to those or other forward-looking statements.
37
Table of Contents
MARKET, RANKING AND OTHER INDUSTRY DATA
In this prospectus we rely on and refer to information and statistics regarding our industry, the size of certain markets and our position within the sectors in which we compete. Some of the market and industry data contained in this prospectus are based on independent industry publications or other publicly available information, including data from a report issued by Arthur D. Little Benelux S.A./N.V. that we commissioned in October 2012, while other information is based on our good faith estimates, which are derived from our review of internal surveys, as well as independent sources listed in this prospectus, and our management’s knowledge and experience in the markets in which we operate. Our estimates have also been based on information obtained from our customers, suppliers and other contacts in the markets in which we operate. While we are not aware of any misstatements regarding any industry data presented herein, our estimates, in particular as they relate to market share and our general expectations, involve risks and uncertainties and are subject to change based on various factors, including those discussed under “Risk Factors,” “Cautionary Statement Regarding Forward-Looking Statements” and “Management’s Discussion and Analysis of Financial Condition and Results of Operations” in this prospectus.
ADL conducted its analysis and prepared its report utilizing reasonable care and skill in applying methods of analysis consistent with normal industry practice. All results are based on information available at the time of review. Changes in factors upon which the review was based could affect the results. Forecasts are inherently uncertain because of events or combinations of events that cannot reasonably be foreseen, including the actions of government, individuals, third parties and competitors.
In this prospectus, references to market position and ranking information are based on volume or installed capacity unless otherwise indicated.
38
Table of Contents
Assuming an initial offering price of $ per share, which is the midpoint of the offering price range set forth on the front cover page of this prospectus, we estimate that the net proceeds to us from the sale of the shares of our common stock in this offering will be $ (or $ if the underwriters exercise in full their option to purchase additional shares of common stock from us), after deducting estimated underwriting discounts and offering expenses.
We intend to use the net proceeds from this offering to repay certain of our indebtedness and for other general corporate purposes.
39
Table of Contents
We do not currently anticipate paying dividends on our common stock following this offering. Any declaration and payment of future dividends to holders of our common stock will be at the discretion of our board of directors and will depend on many factors, including our financial condition, earnings, capital requirements, level of indebtedness, statutory and contractual restrictions applying to the payment of dividends and other considerations that our board of directors deems relevant. Because we are a holding company and have no direct operations, we will only be able to pay dividends from our available cash on hand and any funds we receive from our subsidiaries. The terms of our indebtedness may restrict us from paying dividends, or restrict our subsidiaries from paying dividends to us. Under Delaware law, dividends may be payable only out of surplus, which is our net assets minus our liabilities and our capital, or if we have no surplus, out of our net profits for the fiscal year in which the dividend is declared and/or the preceding fiscal year. See “Description of Indebtedness” and “Description of Capital Stock.”
40
Table of Contents
The following table sets forth our cash and cash equivalents, indebtedness and our capitalization as of September 30, 2012:
| • | on an actual basis; and |
| • | on a pro forma basis giving effect to the issuance of the PIK Toggle Notes and this offering at an assumed initial public offering price of $ , which represents the midpoint of the range on the cover page of this prospectus, and our expected use of the net proceeds of this offering. |
You should read the following table in conjunction with our financial statements and the related notes thereto, “Management’s Discussion and Analysis of Financial Condition and Results of Operations,” “Use of Proceeds” and “Description of Indebtedness” included elsewhere in this prospectus.
| As of September 30, 2012 | ||||||||
| (In millions) | Actual | Pro Forma(3) | ||||||
| (Unaudited) | ||||||||
| Cash and cash equivalents |
$ | 58 | $ | |||||
|
|
|
|
|
|||||
| Debt: |
||||||||
| Capital leases |
8 | |||||||
| Revolving credit facility(1) |
— | |||||||
| Term loan credit facility—USD |
348 | |||||||
| Term loan credit facility—EUR |
154 | |||||||
| 9.750% Second-priority senior secured notes due 2020 |
400 | |||||||
| 9.125%/9.875% Senior PIK toggle notes due 2017(4) |
— | 247 | ||||||
| Total debt |
$ | 910 | $ | |||||
| Equity: |
||||||||
| Stockholders’ equity |
— | |||||||
| Common stock, $0.001 par value, shares authorized and shares issued(2) |
— | |||||||
| Additional paid-in capital |
540 | |||||||
| Retained earnings (deficit) |
(29 | ) | ||||||
| Accumulated other comprehensive income (loss) |
(10 | ) | ||||||
|
|
|
|
|
|||||
| Total equity |
501 | |||||||
|
|
|
|
|
|||||
| Total capitalization |
$ | 1,411 | $ | |||||
|
|
|
|
|
|||||
| (1) | As of September 30, 2012, there were no borrowings outstanding under this facility, which has capacity of $194 million; however, $3 million of the total capacity was utilized to support outstanding letters of credit. |
| (2) | We expect to complete a for one stock split of our common stock prior to the completion of this offering. All share amounts will be retroactively adjusted to give effect to this stock split at the time of its effectiveness. |
| (3) | A $1.00 increase (decrease) in the assumed initial public offering price of $ per share, which represents the midpoint of the range set forth on the cover page of this prospectus, would increase (decrease) each of cash, additional paid-in capital and total capitalization by $ , assuming the number of shares offered by us, as set forth on the cover page of this prospectus, remains the same and after deducting the estimated underwriting discounts and commissions and estimated expenses payable by us. |
| (4) | The PIK Toggle Notes were issued at a discount of 99% of face value, or approximately $247 million, on December 18, 2012. |
41
Table of Contents
If you invest in our common stock, your ownership interest will be immediately diluted to the extent of the difference between the initial public offering price per share of our common stock and the net tangible book value per share of our common stock after this offering. Dilution results from the fact the initial public offering price per share of the common stock is substantially in excess of the book value per share of common stock attributable to the existing stockholders for the presently outstanding shares of common stock.
Our net tangible book value (deficit) as of , 2013 was $ million, or $ per share of common stock. Net tangible book value per share represents the amount of our total tangible assets (which for the purpose of this calculation excludes capitalized debt issuance costs) less total liabilities, divided by the basic weighted average number of shares of common stock outstanding.
After giving effect to the sale of the shares of common stock offered by us in this offering at an assumed initial public offering price of $ , which is the midpoint of the price range set forth on the cover of this prospectus, less estimated underwriting discounts and commissions and estimated offering expenses, our pro forma net tangible book value (deficit) as of , 2013 would have been approximately $ million, or $ per share of common stock. This represents an immediate increase in net tangible book value to our existing stockholders of $ per share and an immediate dilution to new investors in this offering of $ per share. The following table illustrates this pro forma per share dilution in net tangible book value to new investors.
| Assumed initial public offering price per share |
$ | |||||||
| Net tangible book value (deficit) per share before this offering |
$ | |||||||
| Increase per share attributable to new investors in this offering |
||||||||
|
|
|
|
|
|||||
| Pro forma net tangible book value (deficit) per share after this offering |
||||||||
| Dilution per share to new investors |
$ | |||||||
|
|
|
A $1.00 increase (or decrease) in the assumed initial public offering price of $ per share, the mid-point of the price range set forth on the cover of this prospectus, would increase (or decrease) our pro forma net tangible book value by $ million, or $ per share, and would increase (or decrease) the dilution per share to new investors by $ based on the assumptions set forth above.
The following table summarizes as of , 2013, on an as adjusted basis, the number of shares of common stock purchased, the total consideration paid and the average price per share paid by existing and by new investors, based upon an assumed initial public offering price of $ per share (the mid-point of the initial public offering price range) and before deducting estimated underwriting discounts and commissions and offering expenses:
| Shares Purchased | Total Consideration | Average Price Per Share |
||||||||||||||||
| Number | Percent | Amount | Percent | |||||||||||||||
| Existing stockholders |
% | $ | % | $ | ||||||||||||||
| Investors in this offering |
||||||||||||||||||
|
|
|
|
|
|
|
|
|
|
||||||||||
| Total |
100 | % | 100 | % | $ | |||||||||||||
|
|
|
|
|
|
|
|
|
|
||||||||||
Except as otherwise indicated, the discussion and tables above assume no exercise of the underwriters’ option to purchase additional shares and no exercise of any outstanding options. If the underwriters’ option to purchase additional shares is exercised in full, our existing stockholders would own approximately % and our new investors would own approximately % of the total number of shares of our common stock outstanding after this offering. If the underwriters exercise their option to purchase additional shares in full, the pro forma net tangible book value per share after this offering would be $ per share, and the dilution in the pro forma net tangible book value per share to new investors in this offering would be $ per share.
42
Table of Contents
The tables and calculations above are based on shares of common stock outstanding as of and assume no exercise by the underwriters of their option to purchase up to an additional shares from us. This number excludes, as of , 2013, an aggregate of shares of common stock reserved for issuance under our equity incentive plan that we intend to adopt in connection with this offering. To the extent that any outstanding options are exercised, new investors will experience further dilution.
43
Table of Contents
UNAUDITED PRO FORMA FINANCIAL INFORMATION
The following pro forma statement of operations data for the year ended December 31, 2011, the nine months ended September 30, 2012 and the last twelve month period ended September 30, 2012 have been derived from our historical consolidated financial statements included elsewhere in this prospectus and have been prepared to give effect to the Acquisition, assuming that the Acquisition and the issuance of the PIK Toggle Notes occurred on January 1, 2011.
The unaudited pro forma statement of operations for the year ended December 31, 2011, the nine months ended September 30, 2012 and the last twelve-month period (“LTM”) ended September 30, 2012 have been adjusted to exclude material non-recurring items as well as the increase of certain expenses directly attributable to the Acquisition and the issuance of the PIK Toggle Notes and reflect:
| • | additional depreciation and amortization that resulted from changes in the preliminary estimated fair value of assets and liabilities, as discussed in more detail below; |
| • | incremental operating expenses, representing the annual management fee to be paid by the Company to Apollo; |
| • | elimination of transaction fees related to the Acquisition totaling $42 million; |
| • | reduction of interest expense resulting from new indebtedness incurred in connection with the Acquisition; |
| • | elimination of incremental share-based compensation expense incurred in connection with the Acquisition triggering vesting of certain outstanding share-based compensation; and |
| • | incremental interest expense associated with the PIK Toggle Notes. |
The pro forma statement of operations for the nine months ended September 30, 2012 and the last twelve-month period ended September 30, 2012 include a $22 million fair value step up in inventory resulting from the Acquisition. This step up has temporarily increased our cost of sales in the period subsequent to the Acquisition until such inventory is sold, as reflected in our historical statement of operations for the nine months ended September 30, 2012.
Pro Forma LTM Period refers to the twelve-month period ended September 30, 2012 and includes the results for both the Predecessor Period and Successor Period. The unaudited pro forma income statement for the LTM Period is calculated as follows: (i) the income statement for the year ended December 31, 2011, less (ii) the unaudited income statement for the nine months ended September 30, 2011, plus (iii) the unaudited combined income statement for the nine months ended September 30, 2012.
In addition, the unaudited pro forma statement of operations does not give effect to certain of the adjustments reflected in our Adjusted EBITDA, as presented under “Management’s Discussion and Analysis of Financial Condition and Results of Operations—Key Performance Indicators—Adjusted EBITDA.”
Assumptions underlying the pro forma adjustments are described in the accompanying notes, which should be read in conjunction with this pro forma statement of operations.
Management believes that the assumptions used to derive the pro forma statement of operations are reasonable given the information available; however, such assumptions are subject to change and the effect of any such change could be material. For instance, the Company has made preliminary estimates of the values of the assets acquired and liabilities assumed. Accordingly, the Company believes that the initial estimates of fair value of assets and liabilities could be subsequently revised and any such revision could be material. The pro forma combined statement of operations has been provided for informational purposes only and is not necessarily indicative of the results of future operations or the actual results that would have been achieved had the Acquisition occurred on the date indicated.
44
Table of Contents
On December 18, 2012, we issued the PIK Toggle Notes. The interest associated with the PIK Toggle Notes may be paid in cash, through an increase in the principal amount of the PIK Toggle Notes or by issuing new PIK Toggle Notes to satisfy the obligation. Interest expense is calculated at a rate of 9.125% for cash payments or 9.875% for payments made through an increase in the principal amount of PIK Toggle Notes outstanding, respectively. The net proceeds of the offering of approximately $243 million were distributed to the shareholders of the Company as a return of capital. This transaction resulted in an increase to long term debt of $247 million, an increase to deferred financing costs of $4 million and a decrease to shareholders equity of $243 million.
45
Table of Contents
Taminco Global Chemical Corporation
Unaudited Pro Forma Statement of Operations
For the year ended December 31, 2011
| (In millions, except share information) | Predecessor | Acquisition related adjustments |
Pro forma Acquisition |
PIK Toggle Notes related adjustments |
Pro forma | |||||||||||||||||||
| Net sales |
$ | 1,123 | $ | — | $ | 1,123 | $ | — | $ | 1,123 | ||||||||||||||
| Cost of sales |
906 | 57 | (a) | 963 | — | 963 | ||||||||||||||||||
|
|
|
|
|
|
|
|
|
|
|
|||||||||||||||
| Gross profit |
217 | (57 | ) | 160 | — | 160 | ||||||||||||||||||
| Selling, general and other administrative expenses |
49 | — | 49 | — | 49 | |||||||||||||||||||
| Research and development expenses |
12 | — | 12 | — | 12 | |||||||||||||||||||
| Other operating expenses |
16 | 4 | (c) | 20 | — | 20 | ||||||||||||||||||
|
|
|
|
|
|
|
|
|
|
|
|||||||||||||||
| Operating income |
140 | (61 | ) | 79 | — | 79 | ||||||||||||||||||
| Interest expense (income), net |
75 | (8 | ) | (d) | 67 | 24 | (h) | 91 | ||||||||||||||||
| Other non-operating expense, net |
1 | — | 1 | — | 1 | |||||||||||||||||||
|
|
|
|
|
|
|
|
|
|
|
|||||||||||||||
| Income before income taxes, equity in earnings |
64 | (53 | ) | 11 | (24 | ) | (13 | ) | ||||||||||||||||
| Income tax expense |
32 | (23 | ) | (e) | 9 | (9 | ) | (e) | — | |||||||||||||||
|
|
|
|
|
|
|
|
|
|
|
|||||||||||||||
| Income before equity in earnings |
32 | (30 | ) | 2 | (15 | ) | (13 | ) | ||||||||||||||||
| Equity in losses of unconsolidated entities |
2 | — | 2 | — | 2 | |||||||||||||||||||
|
|
|
|
|
|
|
|
|
|
|
|||||||||||||||
| Net income (loss) |
$ | 30 | $ | (30 | ) | $ | — | $ | (15 | ) | (15 | ) | ||||||||||||
|
|
|
|
|
|
|
|
|
|
|
|||||||||||||||
| Net income (loss) per common share: |
||||||||||||||||||||||||
| Basic |
$ | 0.03 | $ | — | $ | (2.78 | ) | |||||||||||||||||
| Diluted |
$ | 0.03 | $ | — | $ | (2.78 | ) | |||||||||||||||||
| Number of common shares: |
||||||||||||||||||||||||
| Basic |
1,000,000,000 | 5,396,056 | 5,396,056 | |||||||||||||||||||||
| Diluted |
1,000,000,000 | 5,396,056 | 5,396,056 | |||||||||||||||||||||
46
Table of Contents
Taminco Global Chemical Corporation
Unaudited Pro Forma Statement of Operations
For the nine months ended September 30, 2012
| Predecessor(1) | Successor(2) | |||||||||||||||||||||||||||||||
| (In millions, except share information) |
Period from January 1 through February 14, 2012 |
Nine
months ended September 30, 2012 |
Acquisition related Adjustments |
Pro Forma Acquisition |
PIK
Toggle Notes related adjustments |
Pro forma | ||||||||||||||||||||||||||
| Net sales |
$ | 144 | $ | 711 | $ | — | $ | 855 | $ | — | $ | 855 | ||||||||||||||||||||
| Cost of sales |
111 | 598 | (f) | 7 | (a) | 716 | — | 716 | ||||||||||||||||||||||||
|
|
|
|
|
|
|
|
|
|
|
|
|
|||||||||||||||||||||
| Gross profit |
33 | 113 | (7 | ) | 139 | — | 139 | |||||||||||||||||||||||||
| Selling, general and other administrative expenses |
66 | 29 | (60 | ) | (b) | 35 | — | 35 | ||||||||||||||||||||||||
| Research and development expenses |
1 | 7 | — | 8 | — | 8 | ||||||||||||||||||||||||||
| Other operating expenses |
1 | 44 | (41 | ) | (c) | 4 | — | 4 | ||||||||||||||||||||||||
|
|
|
|
|
|
|
|
|
|
|
|
|
|||||||||||||||||||||
| Operating income |
(35 | ) | 33 | 94 | 92 | — | 92 | |||||||||||||||||||||||||
| Interest expense (income), net |
8 | 50 | 1 | (d) | 59 | 18 | (h) | 77 | ||||||||||||||||||||||||
| Other non-operating expense, net |
2 | 8 | — | 10 | — | 10 | ||||||||||||||||||||||||||
|
|
|
|
|
|
|
|
|
|
|
|
|
|||||||||||||||||||||
| Income before income taxes, equity in earnings |
(45 | ) | (25 | ) | 93 | 23 | (18 | ) | 5 | |||||||||||||||||||||||
| Income tax expense (benefit) |
9 | 2 | 7 | (e) | 18 | (7 | ) | (e) | 11 | |||||||||||||||||||||||
|
|
|
|
|
|
|
|
|
|
|
|
|
|||||||||||||||||||||
| Income before equity in earnings |
(54 | ) | (27 | ) | 86 | 5 | (11 | ) | (6 | ) | ||||||||||||||||||||||
| Equity in losses of unconsolidated entities |
— | 2 | — | 2 | — | 2 | ||||||||||||||||||||||||||
|
|
|
|
|
|
|
|
|
|
|
|
|
|||||||||||||||||||||
| Net income (loss) |
$ | (54 | ) | $ | (29 | ) | $ | 86 | $ | 3 | $ | (11 | ) | $ | (8 | ) | ||||||||||||||||
|
|
|
|
|
|
|
|
|
|
|
|
|
|||||||||||||||||||||
| Net income (loss) per common share: |
||||||||||||||||||||||||||||||||
| Basic |
$ | (0.05 | ) | $ | (5.37 | ) | $ | 0.56 | $ | (1.48 | ) | |||||||||||||||||||||
| Diluted |
$ | (0.05 | ) | $ | (5.37 | ) | $ | 0.56 | $ | (1.48 | ) | |||||||||||||||||||||
| Number of common shares: |
||||||||||||||||||||||||||||||||
| Basic |
1,000,000,000 | 5,396,056 | 5,396,056 | 5,396,056 | ||||||||||||||||||||||||||||
| Diluted |
1,000,000,000 | 5,396,056 | 5,396,056 | 5,396,056 | ||||||||||||||||||||||||||||
| (1) | Taminco Group Holdings S.à r.l. |
| (2) | Taminco Global Chemical Corporation |
47
Table of Contents
Taminco Global Chemical Corporation
Unaudited Pro Forma Statement of Operations
For the twelve month period ended September 30, 2012
| (In millions, except share information) | LTM | (g) | Acquisition related adjustments |
Pro Forma Acquisition |
PIK
Toggle Notes related adjustments |
Pro Forma | ||||||||||||||||||||
| Net sales |
$ | 1,110 | $ | — | $ | 1,110 | $ | — | $ | 1,110 | ||||||||||||||||
| Cost of sales |
922 | (f) | 21 | (a) | 943 | — | 943 | |||||||||||||||||||
|
|
|
|
|
|
|
|
|
|
|
|||||||||||||||||
| Gross profit |
188 | (21 | ) | 167 | — | 167 | ||||||||||||||||||||
| Selling, general and other administrative expenses |
105 | (60 | ) | (b) | 45 | — | 45 | |||||||||||||||||||
| Research and development expenses |
11 | — | 11 | — | 11 | |||||||||||||||||||||
| Other operating expenses |
51 | (40 | ) | (c) | 11 | — | 11 | |||||||||||||||||||
|
|
|
|
|
|
|
|
|
|
|
|||||||||||||||||
| Operating income |
21 | 79 | 100 | — | 100 | |||||||||||||||||||||
| Interest expense (income), net |
76 | — | (d) | 76 | 24 | (h) | 100 | |||||||||||||||||||
| Other non-operating expense, net |
9 | — | 9 | — | 9 | |||||||||||||||||||||
|
|
|
|
|
|
|
|
|
|
|
|||||||||||||||||
| Income before income taxes, equity in earnings |
(64 | ) | 79 | 15 | (24 | ) | (9 | ) | ||||||||||||||||||
| Income tax expense |
15 | 7 | (e) | 22 | (9 | ) | (e) | 13 | ||||||||||||||||||
|
|
|
|
|
|
|
|
|
|
|
|||||||||||||||||
| Income before equity in losses |
(79 | ) | 72 | (7 | ) | (15 | ) | (22 | ) | |||||||||||||||||
| Equity in losses of unconsolidated entities |
3 | — | 3 | — | 3 | |||||||||||||||||||||
|
|
|
|
|
|
|
|
|
|
|
|||||||||||||||||
| Net income (loss) |
$ | (82 | ) | $ | 72 | $ | (10 | ) | $ | (15 | ) | $ | (25 | ) | ||||||||||||
|
|
|
|
|
|
|
|
|
|
|
|||||||||||||||||
| Net income (loss) per common share: |
||||||||||||||||||||||||||
| Basic |
$ | (15.20 | ) | $ | (1.85 | ) | $ | (4.63 | ) | |||||||||||||||||
| Diluted |
$ | (15.20 | ) | $ | (1.85 | ) | $ | (4.63 | ) | |||||||||||||||||
| Number of common shares: |
||||||||||||||||||||||||||
| Basic |
5,396,056 | 5,396,056 | 5,396,056 | |||||||||||||||||||||||
| Diluted |
5,396,056 | 5,396,056 | 5,396,056 | |||||||||||||||||||||||
48
Table of Contents
Notes to Unaudited Pro Forma Statement of Operations
(In millions)
| (a) | Reflects the incremental depreciation and amortization expense resulting from the preliminary estimated fair value adjustments for purchase accounting. |
| For the year ended December 31, 2011 |
January 1 through February 14, 2012 |
October
1, 2011 through February 14, 2012 |
||||||||||
| Depreciation of: |
||||||||||||
| Land and improvements |
$ | — | $ | — | $ | — | ||||||
| Building, structures and related improvements |
5 | — | 2 | |||||||||
| Plant, machinery and equipment |
54 | 6 | 19 | |||||||||
| Furniture and vehicles |
1 | — | — | |||||||||
| Construction-in-process |
— | — | — | |||||||||
| Software |
1 | — | — | |||||||||
|
|
|
|
|
|
|
|||||||
| Total estimated amortization expense |
61 | 6 | 21 | |||||||||
| Elimination of previously recorded amortization |
44 | 4 | 15 | |||||||||
|
|
|
|
|
|
|
|||||||
| Pro forma adjustment to depreciation |
$ | 17 | $ | 2 | $ | 6 | ||||||
|
|
|
|
|
|
|
|||||||
| For the year ended December 31, 2011 |
January 1 through February 14, 2012 |
October 1, 2011 through February 14, 2012 |
||||||||||
| Amortization of: |
||||||||||||
| Regulatory costs |
$ | 11 | $ | 1 | $ | 1 | ||||||
| Customer relationships |
27 | 3 | 11 | |||||||||
| Technology, patents and license costs |
5 | 1 | 4 | |||||||||
| Various contracts |
24 | 3 | 9 | |||||||||
|
|
|
|
|
|
|
|||||||
| Total estimated amortization expense |
67 | 8 | 25 | |||||||||
| Elimination of previously recorded amortization |
27 | 3 | 10 | |||||||||
|
|
|
|
|
|
|
|||||||
| Pro forma adjustment to amortization |
$ | 40 | $ | 5 | $ | 15 | ||||||
|
|
|
|
|
|
|
|||||||
| (b) | Reflects the elimination of incremental share-based compensation expense of $60 million recorded for the period from January 1 to February 14, 2012 directly as a result of the Acquisition. |
| (c) | Reflects (i) incremental operating expenses, representing the annual management fee to be paid by the Company to Apollo for the year ended December 31, 2011, for the period from January 1, 2012 through February 14, 2012 and the Pro Forma LTM Period in the amount of $4 million, $1 million and $2 million, respectively, and (ii) the elimination of the transaction fees in the amount of $42 million recorded during the period for the nine months ended September 30, 2012 directly in relation to the Acquisition, which were comprised mainly of professional fees. |
49
Table of Contents
| (d) | Represents the net change in interest expense related to the indebtedness incurred in connection with the Acquisition compared to the interest expense previously recorded: |
| For the year ended December 31, 2011 |
January 1 through February 14, 2012 |
October 1, 2011 through February 14, 2012 |
||||||||||
| Estimated interest expense for USD Term Loan Credit Facility (5.25%) |
$ | 19 | $ | 3 | $ | 8 | ||||||
| Estimated interest expense for EUR term loan credit facility (5.50%) |
9 | 1 | 3 | |||||||||
| Estimated interest expense for second-priority senior secured notes (9.75%) |
39 | 5 | 15 | |||||||||
|
|
|
|
|
|
|
|||||||
| Total estimated interest expense |
67 | 9 | 26 | |||||||||
| Eliminate interest expense for subordinated capitalized bonds, Facility A, B, C and D |
(75 | ) | (8 | ) | (26 | ) | ||||||
|
|
|
|
|
|
|
|||||||
| Net change in interest expense |
$ | (8 | ) | $ | 1 | $ | — | |||||
|
|
|
|
|
|
|
|||||||
| (e) | Reflects the estimated tax effect resulting from the pro forma adjustments (except for the adjustment of share based compensation expense and certain transaction costs) at the statutory rate for the relevant tax jurisdiction. The primary jurisdictions are the United States (39%) and Belgium (34%). No pro forma tax benefit was assumed for the non-cash share-based compensation expense and a portion of the transaction expenses since the amounts are not deductible in the local jurisdictions and therefore represent permanent items. |
| (f) | Historical results for the period from February 15, 2012 to September 30, 2012 include incremental expense of $22 million in cost of goods sold related to the sale of inventory that was subject to a fair value step up for purchase accounting at the date of the Acquisition. |
50
Table of Contents
| (g) | The unaudited combined income statement for the LTM period is calculated as follows: (A) the audited income statement for the year ended December 31, 2011, less (B) the unaudited income statement for the nine months ended September 30, 2011, plus (C) the unaudited income statement for the period from January 1 through February 14, 2012, plus (D) the unaudited income statement for the nine months ended September 30, 2012: |
| (In millions, except share information) | For the year ended December 31, 2011 (A) |
For the nine months ended September 30, 2011 (B) |
For the period from January 1 through February 14, 2012 (C) |
For the nine months ended September 30, 2012 (D) |
LTM Period |
|||||||||||||||
| Net sales |
$ | 1,123 | $ | 868 | $ | 144 | $ | 711 | $ | 1,110 | ||||||||||
| Cost of sales |
906 | 693 | 111 | 598 | 922 | |||||||||||||||
|
|
|
|
|
|
|
|
|
|
|
|||||||||||
| Gross profit |
217 | 175 | 33 | 113 | 188 | |||||||||||||||
| Selling, general and administrative expense |
49 | 39 | 66 | 29 | 105 | |||||||||||||||
| Research and development expense |
12 | 9 | 1 | 7 | 11 | |||||||||||||||
| Other operating expense |
16 | 10 | 1 | 44 | 51 | |||||||||||||||
|
|
|
|
|
|
|
|
|
|
|
|||||||||||
| Operating income |
140 | 117 | (35 | ) | 33 | 21 | ||||||||||||||
| Interest expense (income), net |
75 | 57 | 8 | 50 | 76 | |||||||||||||||
| Other non-operating (income) expense, net |
1 | 2 | 2 | 8 | 9 | |||||||||||||||
|
|
|
|
|
|
|
|
|
|
|
|||||||||||
| Income (loss) before income taxes and results from companies consolidated under equity method |
64 | 58 | (45 | ) | (25 | ) | (64 | ) | ||||||||||||
| Income tax expense (benefit) |
32 | 28 | 9 | 2 | 15 | |||||||||||||||
|
|
|
|
|
|
|
|
|
|
|
|||||||||||
| Income from continuing operations before earnings from equity method investments |
32 | 30 | (54 | ) | (27 | ) | (79 | ) | ||||||||||||
| Loss from companies consolidated under equity method |
2 | 1 | — | 2 | 3 | |||||||||||||||
|
|
|
|
|
|
|
|
|
|
|
|||||||||||
| Net income (loss) for the period |
$ | 30 | $ | 29 | $ | (54 | ) | $ | (29 | ) | $ | (82 | ) | |||||||
|
|
|
|
|
|
|
|
|
|
|
|||||||||||
| Earnings per share: |
||||||||||||||||||||
| Basic |
$ | 0.03 | $ | 0.03 | $ | (0.05 | ) | $ | (5.37 | ) | $ | (15.20 | ) | |||||||
| Diluted |
$ | 0.03 | $ | 0.03 | $ | (0.05 | ) | $ | (5.37 | ) | $ | (15.20 | ) | |||||||
| Number of common shares: |
||||||||||||||||||||
| Basic |
1,000,000,000 | 1,000,000,000 | 1,000,000,000 | 5,396,056 | 5,396,056 | |||||||||||||||
| Diluted |
1,000,000,000 | 1,000,000,000 | 1,000,000,000 | 5,396,056 | 5,396,056 | |||||||||||||||
| (h) | Refers to: (i) additional interest expense in connection with the PIK Toggle Notes issued on December 18, 2012, calculated at a rate of 9.125%, which assumes cash interest payments. If at our election, future interest payments are paid with PIK interest as opposed to cash interest, the interest rate will increase to 9.875% and interest expense will increase accordingly. The pro forma adjustment for the additional interest expense assuming cash interest is $24 million, $18 million and $24 million for the year ended December 31, 2011, the nine-months period ended September 30, 2012 and the Pro Forma LTM Period, respectively; (ii) amortization of original issue discount of $3 million; and (iii) amortization of $4 million of debt issuance costs in relation with the offering of the PIK Toggle Notes in the amount of $1 million, $1 million and $1 million for the year ended December 31, 2011, the nine-months period ended September 30, 2012 and the Pro Forma LTM Period, respectively. |
51
Table of Contents
SELECTED HISTORICAL FINANCIAL INFORMATION
The following table sets forth our selected historical financial information. The selected historical balance sheet data as of December 31, 2010 and 2011, and historical statement of operations data for the years ended December 31, 2009, 2010 and 2011, have been derived from our audited financial statements included elsewhere in this prospectus. The selected historical balance sheet data as of December 31, 2007, 2008 and 2009, and historical statement of operations data for the period from January 1, 2007 through August 31, 2007 (predecessor to acquisition by the previous sponsor), the period from September 1, 2007 through December 31, 2007, and the year ended December 31, 2008 have been derived from our unaudited financial statements not included in this prospectus. The selected historical balance sheet data as of September 30, 2012, has been derived from our unaudited condensed consolidated financial statements included elsewhere in this prospectus. The consolidated financial statements for the nine months ended September 30, 2012 are presented for two periods: January 1 through February 14, 2012 and the nine months ended September 30, 2012, which relate to the period immediately preceding and succeeding the Acquisition, respectively. The Acquisition was consummated on February 15, 2012 and the results of the Successor Period include the results of operations of Taminco Group Holdings S.à r.l. beginning on February 15, 2012. The results of the Successor Period are not comparable to the results of the Predecessor Period due to the difference in the basis of presentation of purchase accounting as compared to historical cost. The consolidated statement of operations data for the period January 1, 2012 to February 14, 2012 are derived from the unaudited financial statements of the Predecessor Period included elsewhere in this prospectus, and the consolidated statement of operations data for the nine months ended September 30, 2012 are derived from the unaudited financial statements of the Successor Period included elsewhere in this prospectus. Prior to the Acquisition, Taminco Global Chemical Corporation had no operations or activity other than transaction costs related to the Acquisition.
The selected historical financial information and operating statistics presented below should be read in conjunction with “Management’s Discussion and Analysis of Financial Condition and Results of Operations” and our financial statements and related notes thereto included elsewhere in this prospectus. Historical results are not necessarily indicative of results that may be expected for any future period.
| Predecessor(1) | Predecessor(2) | Successor(3) | ||||||||||||||||||||||||||||||||||||
| Year ended December 31, | ||||||||||||||||||||||||||||||||||||||
| (In millions, other than per share information) |
January 1 through August 31, 2007 |
September 1 through December 31, 2007 |
2008 | 2009 | 2010 | 2011 | Nine months ended September 30, 2011 |
January 1 through February 14, 2012 |
Nine months ended September 30, 2012 |
|||||||||||||||||||||||||||||
| Statement of Operations Data: |
||||||||||||||||||||||||||||||||||||||
| Net sales |
$ | 535 | $ | 313 | $ | 1,024 | $ | 825 | $ | 951 | $ | 1,123 | $ | 868 | $ | 144 | $ | 711 | ||||||||||||||||||||
| Net income |
36 | (28 | ) | (18 | ) | 1 | 22 | 30 | 29 | (54 | ) | (29 | ) | |||||||||||||||||||||||||
| Earnings per share: |
||||||||||||||||||||||||||||||||||||||
| Basic |
60 | (0.03 | ) | (0.02 | ) | — | 0.02 | 0.03 | 0.03 | (0.05 | ) | (5.37 | ) | |||||||||||||||||||||||||
| Diluted |
60 | (0.03 | ) | (0.02 | ) | — | 0.02 | 0.03 | 0.03 | (0.05 | ) | (5.37 | ) | |||||||||||||||||||||||||
| As of December 31, | As of September 30, |
|||||||||||||||||||||||
| (In millions) | 2007 | 2008 | 2009 | 2010 | 2011 | 2012 | ||||||||||||||||||
| Balance Sheet Data: |
||||||||||||||||||||||||
| Total assets |
$ | 1,384 | $ | 1,385 | $ | 1,374 | $ | 1,327 | $ | 1,348 | $ | 1,824 | ||||||||||||
| Long-term debt |
1,129 | 1,121 | 1,174 | 1,124 | 1,102 | 904 | ||||||||||||||||||
| Total liabilities |
1,398 | 1,465 | 1,444 | 1,382 | 1,380 | 1,323 | ||||||||||||||||||
| (1) | Taminco BVBA (formerly Taminco NV) |
| (2) | Taminco Group Holdings S.à r.l. |
| (3) | Taminco Global Chemical Corporation |
52
Table of Contents
MANAGEMENT’S DISCUSSION AND ANALYSIS OF FINANCIAL CONDITION
AND RESULTS OF OPERATIONS
The following discussion and analysis should be read in conjunction with our consolidated financial statements and accompanying notes thereto included elsewhere herein. This Management’s Discussion and Analysis of Financial Condition and Results of Operations contains forward-looking statements. See “Cautionary Statement Regarding Forward-Looking Statements” and “Risk Factors” for a discussion of the uncertainties, risks and assumptions associated with these statements. Actual results may differ materially from those contained in any forward-looking statements.
Overview
We are the world’s largest pure play producer of alkylamines and alkylamine derivatives according to the ADL Report. Our products are used by our customers in the manufacturing of everyday products primarily for the agriculture, water treatment, personal & home care, animal nutrition and oil & gas end-markets. Our products provide these goods with a variety of ancillary characteristics required for optimal performance, such as neutralizing acidity, and removing contaminants. We have an extensive offering of differentiated value-added products that typically represent a small portion of our customers’ overall costs and are sold into diversified, global end-markets that benefit from favorable underlying economic and population growth trends. We currently operate in 19 countries with seven production facilities and, as of September 30, 2012, had an installed production capacity of 1,302 kt. According to the ADL Report, we hold the #1 or #2 market position globally in the vast majority of the chemicals we produce, including an approximately 50% and 75% share of certain products in North America and Europe. During the Pro Forma LTM Period, eight of our products accounted for more than 57% of our revenue, with six of the eight products holding a leading global market position. During the Pro Forma LTM period, through our worldwide network of production facilities, we sold 48% of our volume in North America, 36% of our volume in Europe, and 16% of our volume in the emerging markets (7% in Latin America and 9% in Asia). Furthermore, we expect to increase the portion of our volume from the Americas and Asia with our recent capital investments. As a result of our leading market positions, attractive end-markets, and significant recent capital investments, we believe we are well positioned for significant growth over the coming years. In the Pro Forma LTM Period, we generated revenue of $1,110 million, Adjusted EBITDA of $234 million, and Adjusted EBITDA margin of over 21%. See “Prospectus Summary—Summary Historical Consolidated Financial Information” for a discussion and reconciliation of Adjusted EBITDA and Adjusted EBITDA margin.
We currently operate seven plants worldwide dedicated to the production of alkylamines and alkylamine derivatives, including two larger facilities in each of the United States and Europe that are among the world’s largest methylamine and higher alkylamines production facilities, a joint-venture facility with the MGC Group in China, and two other 100% Taminco owned facilities in China.
We are also in the process of pursuing numerous growth projects to further bolster our global footprint and leverage our strategic advantages. Our currently budgeted future investments include significantly extending production capacity at our Pace, Florida methylamine facility by the end of 2014 and further development of other derivative capacity. In total, we have spent $116 million in growth capital expenditures over the past three years, which is more than we have spent in any similar historical period. We expect to realize significant growth in our financial results from these investments.
We are organized into three segments: Functional Amines, Specialty Amines, and Crop Protection.
| • | Functional Amines. This segment serves the needs of external customers that use our alkylamines products as the integral element in their chemical processes for the production of formulated products applied in a variety of end-markets such as agriculture, personal & home care, animal nutrition, and oil & gas. Through this segment, we also produce basic amines, which are captively used as building blocks to produce our downstream derivatives through our Specialty Amines and Crop Protection segments, serving a variety of attractive, non-cyclical end-markets. Approximately 30% of the |
53
Table of Contents
| Functional Amines production is used internally and forms the basis of our vertically integrated model. In the Pro Forma LTM Period, the Functional Amines segment accounted for 50% of Adjusted EBITDA. |
| • | Specialty Amines. This segment sells alkylamine derivatives for use in the water treatment, personal & home care, oil & gas and animal nutrition end-markets, and specialty additives for use in the pharmaceutical, industrial coatings and metal working fluid end-markets. This segment is downstream from the Functional Amines segment and uses that segment’s production as one of its key raw materials. The Specialty Amines segment’s customers are typically large, multinational enterprises who are leading players in their industry. In the Pro Forma LTM Period, the Specialty Amines segment accounted for 33% of Adjusted EBITDA. |
| • | Crop Protection. This segment sells alkylamine derivatives, active ingredients and formulated products for use in the agriculture and crop protection end-markets. The majority of the segment’s customers range from multinational crop protection and agricultural enterprises to large local farms. In the Pro Forma LTM Period, the Crop Protection segment accounted for 17% of Adjusted EBITDA. |
Share Purchase Agreement with an Affiliate of Apollo
On December 15, 2011, Taminco Group Holdings S.à r.l. and Taminco Inc. entered into an Agreement for the Sale of the Share Capital of Taminco Group Holdings S.à r.l. and Taminco Inc. (the “Share Purchase Agreement”) with Taminco Finance Corporation, which is an entity controlled by the Apollo Funds. Under the Share Purchase Agreement, Taminco Finance Corporation acquired all of the issued and outstanding share capital of Taminco Global Holdings S.à.r.l. and Taminco Inc. (the “Acquisition”). The Acquisition was consummated on February 15, 2012.
Basis of Presentation
The consolidated statements of operations and cash flows are presented for two periods: January 1 through February 14, 2012 (the “Predecessor Period”), which relates to the period immediately preceding the Acquisition, and the nine months ended September 30, 2012 (the “Successor Period”). Prior to the Acquisition, Taminco Global Chemical Corporation had no activity other than transaction costs related to the Acquisition. The pro forma results for the nine months ended September 30, 2012 represent the addition of the Predecessor and Successor Periods as well as the pro forma adjustments to reflect the Acquisition as if it had occurred prior to the beginning of the period presented (“pro forma”), in accordance with Article 11 of Regulation S-X and included in “Unaudited Pro Forma Financial Information.” The consolidated financial statements for the Successor Period reflect the acquisition of Taminco under the purchase method of accounting. The results of the Successor Period are not comparable to the results of the Predecessor Period due to the difference in the basis of presentation of purchase accounting as compared to historical cost. The pro forma results do not reflect the actual results we would have achieved had the Acquisition been completed as of the beginning of the year and are not indicative of our future results of operations.
Key Performance Indicators
Adjusted EBITDA
We present Adjusted EBITDA to enhance a prospective investor’s understanding of our results of operations and financial condition. EBITDA consists of profit for the period before interest, taxation, depreciation and amortization. Adjusted EBITDA consists of EBITDA and eliminates (i) transaction costs, (ii) restructuring charges, (iii) foreign exchange gains/losses, (iv) sponsor management and director fees and expenses (Successor Period only) and (v) share-based compensation expense. We believe that making such adjustments provides investors meaningful information to understand our operating results and ability to analyze financial and business trends on a period-to-period basis. Adjusted EBITDA for the pro forma nine months ended September 30, 2012 is calculated in the same manner as Adjusted EBITDA. See “Unaudited Pro Forma Financial Information.”
54
Table of Contents
We believe Adjusted EBITDA is useful as supplemental measure in evaluating the performance of our operating businesses and provides greater transparency into our consolidated results of operations. Adjusted EBITDA is a measure used by our management, including our chief operating decision maker, to perform such evaluation, and is a factor in measuring compliance with debt covenants relating to certain of our borrowing arrangements, including our Senior Secured Credit Facilities and the indenture governing our Notes.
You should not consider Adjusted EBITDA in isolation or as an alternative to (a) operating profit or profit for the period (as reported in accordance with U.S. GAAP), (b) cash flows from operating, investing and financing activities as a measure to meet our cash needs or (c) any other measures of performance under generally accepted accounting principles. You should exercise caution in comparing Adjusted EBITDA as reported by us to similar measures of other companies. In evaluating Adjusted EBITDA, you should be aware that we are likely to incur expenses similar to the adjustments in this presentation in the future and that certain of these items could be considered recurring in nature. Our presentation of Adjusted EBITDA should not be construed as an inference that our future results will be unaffected by non-recurring items. For a discussion of additional limitations of Adjusted EBITDA as well as a reconciliation from profit for the period to EBITDA and Adjusted EBITDA, see “Prospectus Summary—Summary Historical Consolidated Financial Information,” respectively. For a discussion of trends affecting Adjusted EBITDA, see “—Results of Operations.”
The following table presents our net sales and Adjusted EBITDA for the periods presented. See “—Basis of Presentation” for an explanation on the Predecessor Period and Successor Period and “—Results of Operations” below for a discussion of trends affecting Adjusted EBITDA for the periods presented.
| Year ended December 31, | Nine months ended September 30, 2011 |
January 1 through February 14, 2012 |
Nine months ended September 30, 2012 |
Pro forma nine months ended September 30, 2012 |
||||||||||||||||||||||||
| 2009 | 2010 | 2011 | ||||||||||||||||||||||||||
| (In millions) | ||||||||||||||||||||||||||||
| Net sales |
$ | 825 | $ | 951 | $ | 1,123 | $ | 868 | $ | 144 | $ | 711 | $ | 855 | ||||||||||||||
| Adjusted EBITDA |
196 | 203 | 227 | 184 | 30 | 161 | 191 | |||||||||||||||||||||
Significant Factors Affecting Our Results of Operations
Volume, Product Mix and Pricing
Volume and our ability to control margins by passing the cost of raw materials onto customers through our pricing strategy are important variables in explaining our financial performance. We believe we occupy strong positions in growing niche markets with a relatively small group of suppliers. We enjoy positive gross profit across most of our product portfolio. In addition, a substantial portion of our sales is made pursuant to cost pass through contracts (“CPT Contracts”) under which the prices we receive for our products are automatically adjusted on a quarterly basis to reflect changes in key raw material prices. An equally substantial portion of our sales are made pursuant to contracts under which sales prices are renegotiated quarterly, generally permitting us to incorporate any increases in key raw material costs in revised sales prices. With respect to both types of contracts, however, price adjustments are made based on the experience of the previous quarter. Accordingly, changes to selling prices will lag behind changes in key raw material costs incurred. This means that in an environment of rising key raw material prices, we will not recover our increased key raw material costs in full until prices stabilize or fall. Conversely, in an environment of falling key raw materials prices, the sales prices we achieve may generate high gross profit and Adjusted EBITDA until prices stabilize or increase. Product mix also significantly impacts our results of operations as the average selling price and gross margin associated with our products varies significantly. For instance, due to the different cost structure and market prices, the selling prices in our Functional Amines business are significantly lower than prices in our Specialty Amines and Crop Protection businesses. On a volume basis for 2011, Functional Amines represents approximately 55% of total volume, Specialty Amines represents approximately 35% and Crop Protection represents approximately 10%. Changes in the share by segment will impact the average selling price and, consequently, gross margin. As a
55
Table of Contents
result, although we may experience significant top line growth, the ultimate profitability of our operations will be dependent upon our efforts to promote our higher margin products or increase volumes associated with those that produce lower margins.
Raw Materials
The majority of our operating expenses are comprised of costs for key raw materials and consumables. Our most significant raw materials, in order of importance based on volume, are methanol, ammonia, ethylene oxide and acetone. Energy, primarily natural gas, also represents a material operating expense to us. Generally, all of our main raw materials are readily available commodity chemicals with multiple suppliers, and are bought in low volumes relative to total global capacities. Prices fluctuate widely, and our key raw materials and consumables expenses are highly variable from year to year. As discussed above, the contracts under which we sell our products help to insulate us, via CPT Contracts and quarterly repricing provisions, from the negative impact of fluctuations in key raw material prices.
Results of Operations
The following table presents our consolidated results for the periods presented:
| Year ended December 31, | Predecessor | Successor | Pro forma(1) | |||||||||||||||||||||||||||||
| 2009 | 2010 | 2011 | Nine months ended September 30, 2011 |
January 1 through February 14, 2012 |
Nine months ended September 30, 2012 |
Nine months ended September 30, 2012 |
||||||||||||||||||||||||||
| (In millions) | ||||||||||||||||||||||||||||||||
| Net sales |
$ | 825 | $ | 951 | $ | 1,123 | $ | 868 | $ | 144 | $ | 711 | $ | 855 | ||||||||||||||||||
| Cost of sales |
651 | 757 | 906 | 693 | 111 | 598 | 716 | |||||||||||||||||||||||||
| Selling, general and administrative expense |
48 | 52 | 49 | 39 | 66 | 29 | 35 | |||||||||||||||||||||||||
| Research and development expense |
12 | 13 | 12 | 9 | 1 | 7 | 8 | |||||||||||||||||||||||||
| Other operating expense |
13 | 2 | 16 | 10 | 1 | 44 | 4 | |||||||||||||||||||||||||
| Interest expense (income), net |
80 | 74 | 75 | 57 | 8 | 50 | 77 | |||||||||||||||||||||||||
| Other non-operating (income) expense, net |
4 | (2 | ) | 1 | 2 | 2 | 8 | 10 | ||||||||||||||||||||||||
| Income tax expense (benefit) |
16 | 33 | 32 | 28 | 9 | 2 | 11 | |||||||||||||||||||||||||
| Equity in loss of unconsolidated entities |
— | — | 2 | 1 | — | 2 | 2 | |||||||||||||||||||||||||
|
|
|
|
|
|
|
|
|
|
|
|
|
|
|
|||||||||||||||||||
| Net income (loss) |
$ | 1 | $ | 22 | $ | 30 | $ | 29 | $ | (54 | ) | $ | (29 | ) | $ | (8 | ) | |||||||||||||||
|
|
|
|
|
|
|
|
|
|
|
|
|
|
|
|||||||||||||||||||
| (1) | Pro forma nine months ended September 30, 2012 gives effect to the Acquisition and the PIK Toggle Notes as if they had occurred on January 1, 2011. See “Unaudited Pro Forma Financial Information.” |
Pro Forma Nine Months Ended September 30, 2012 vs. Nine Months Ended September 30, 2011
Net Sales
Net sales were $855 million for the pro forma nine months ended September 30, 2012, a decrease of $13 million, or 1.5%, compared to $868 million in the nine months ended September 30, 2011. The decrease was related to declining raw material prices that are contractually tied to, or passed through under, a significant share of our contracts offset by a change in product mix. The proportion of volumes in the Specialty Amines segment increased while the proportion in Functional Amines decreased. Average selling price is lower in the Functional Amines segment due to the different cost structure and the related market prices.
56
Table of Contents
Cost of Sales
Cost of sales was $716 million for the pro forma nine months ended September 30, 2012, an increase of $23 million, or 3.3%, compared to $693 million in the nine months ended September 30, 2011. This increase was primarily related to the higher cost of sales due to the inventory step-up to fair value, partially offset by changes in product mix and decreased volume within our Crop Protection segment. Margins in the pro forma nine months ended September 30, 2012 were 16.3% compared to 20.2% in the previous year. Excluding the inventory step up, margins in the pro forma nine months ended September 30, 2012 were 18.8%. This decline compared to the previous year was due to the higher depreciation and amortization related to the step up in asset value related to the Acquisition.
Selling, General and Administrative Expense
Selling, general and administrative expense was $35 million for the pro forma nine months ended September 30, 2012, a decrease of $4 million, or 10.3%, compared to $39 million in the nine months ended September 30, 2011. The decrease was due to the shutdown of the Brazilian operation.
Other Operating Expense
Other operating expense was $4 million for the pro forma nine months ended September 30, 2012, a decrease of $6 million, or 60%, compared to $10 million for the nine months ended September 30, 2011. Other operating expense for prior years included costs of shutting down our Brazil operation.
Interest Expense
Interest expense was $77 million for the pro forma nine months ended September 30, 2012, an increase of $20 million, or 35.1%, compared to $57 million for the nine months ended September 30, 2011. The change was primarily related to increased interest costs on the new credit facilities.
Other Non-Operating Expense
Other non-operating expense for the pro forma nine months ended September 30, 2012 was $10 million, an increase of $8 million, compared to $2 million for the nine months ended September 30, 2011. This increase was primarily attributable to expenses related to the currency swap entered into for the Acquisition and impact of foreign exchange rates.
Income Tax Expense
Income tax expense was $11 million for the pro forma nine months ended September 30, 2012, a decrease of $17 million compared to $28 million for the nine months ended September 30, 2011. The change was primarily related to lower income before taxes.
Period from January 1, 2012 to February 14, 2012 (Predecessor Period) and Nine Months Ended September 30, 2012 (Successor Period) vs. Nine Months Ended September 30, 2011
Net sales were $144 million for the Predecessor Period and $711 million for the Successor Period, compared to $868 million for the nine months ended September 30, 2011.
Cost of sales was $111 million for the Predecessor Period and $598 million for the Successor Period, compared to $693 million for the nine months ended September 30, 2011. Raw materials as a percentage of cost of sales for the Predecessor Period, Successor Period and nine months ended September 30, 2011 represented 57.3%, 59.1% and 67.2%, respectively. The gross profit margin derived from these periods was 22.9%, 15.9%
57
Table of Contents
and 20.2%, respectively. Gross profit margin was negatively impacted in the Successor Period by additional depreciation and amortization by approximately 2.1% as well as the adjustment to record existing inventory at fair value resulting from the Acquisition by approximately 3.1%.
Selling, general and administrative expense was $66 million for the Predecessor Period and $29 million for the Successor Period, compared to $39 million for the nine months ended September 30, 2011. The selling, general and administrative expenses for the Predecessor Period have been impacted by a one-time management compensation expense, which was accounted for upon the sale of the Company by the former management stockholders of approximately $60 million. This expense resulted from the agreements entered into by certain management members in August 2007, in connection with the acquisition of our predecessor at that time. These agreements related to stock options granted to management, subordinated loans and shares of the Company, all of which were contingent on continuing employment of management until the occurrence of a sale of the Company, change in control or an initial public offering (the “Exit Event”). The grant date fair value of the stock options ($8 million), the fair value of the subordinated loans plus accrued interest ($49 million) on the Exit Event, and the fair value of the shares at the investment date ($3 million) were recorded as compensation expense upon the Exit Event on February 14, 2012.
Other operating expense for the Predecessor Period was $1 and other operating expense was $44 million for the Successor Period, compared to $10 million for the nine months ended September 30, 2011. The amount during the Successor Period was related to the Acquisition and included fees paid to Apollo, legal fees and general advisory fees.
Interest expense was $8 million for the Predecessor Period and $50 million for the Successor Period, compared to $57 million for the nine months ended September 30, 2011.
Other non-operating expense was $2 million for the Predecessor Period and $8 million for the Successor Period, compared to $2 million for the nine months ended September 30, 2011.
Segment Level Financial Results
The following table presents the results of each of our reportable segments for the periods presented:
| Net Sales | ||||||||||||||||||||
| Predecessor | Successor | Pro forma(1) | ||||||||||||||||||
| Nine months ended September 30, 2011 |
January 1 through February 14, 2012 |
Nine months ended September 30, 2012 |
Nine months ended September 30, 2012 |
|||||||||||||||||
| (In millions) | ||||||||||||||||||||
| Functional Amines |
$ | 393 | $ | 64 | $ | 318 | $ | 382 | ||||||||||||
| Specialty Amines |
355 | 61 | 302 | 363 | ||||||||||||||||
| Crop Protection |
120 | 19 | 91 | 110 | ||||||||||||||||
|
|
|
|
|
|
|
|
|
|||||||||||||
| Total Company |
$ | 868 | $ | 144 | $ | 711 | $ | 855 | ||||||||||||
|
|
|
|
|
|
|
|
|
|||||||||||||
| (1) | Pro forma nine months ended September 30, 2012 gives effect to the Acquisition and the PIK Toggle Notes as if they had occurred on January 1, 2011. See “Unaudited Pro Forma Financial Information.” |
58
Table of Contents
| Adjusted EBITDA | ||||||||||||||||||||
| Predecessor | Successor | Pro forma(1) | ||||||||||||||||||
| Nine months ended September 30, 2011 |
January 1 through February 14, 2012 |
Nine months ended September 30, 2012 |
Nine months ended September 30, 2012 |
|||||||||||||||||
| (In millions) | ||||||||||||||||||||
| Functional Amines |
$ | 88 | $ | 15 | $ | 81 | $ | 96 | ||||||||||||
| Specialty Amines |
61 | 9 | 53 | 62 | ||||||||||||||||
| Crop Protection |
35 | 6 | 27 | 33 | ||||||||||||||||
|
|
|
|
|
|
|
|
|
|||||||||||||
| Total Adjusted EBITDA |
$ | 184 | $ | 30 | $ | 161 | $ | 191 | ||||||||||||
|
|
|
|
|
|
|
|
|
|||||||||||||
| Reconciliation: |
||||||||||||||||||||
| Transaction costs |
(2 | ) | — | (68 | ) | (27 | ) | |||||||||||||
| Restructuring charges |
(8 | ) | — | — | — | |||||||||||||||
| Foreign exchange gains (losses) |
(2 | ) | — | (3 | ) | (3 | ) | |||||||||||||
| Sponsor management and director fees and expenses |
— | — | (3 | ) | (3 | ) | ||||||||||||||
| Share-based compensation expense |
— | (60 | ) | — | — | |||||||||||||||
| Depreciation and Amortization |
(58 | ) | (7 | ) | (64 | ) | (78 | ) | ||||||||||||
| Interest expense, net |
(57 | ) | (8 | ) | (50 | ) | (77 | ) | ||||||||||||
| Income tax expense |
(28 | ) | (9 | ) | (2 | ) | (11 | ) | ||||||||||||
|
|
|
|
|
|
|
|
|
|||||||||||||
| Net income (loss) |
$ | 29 | $ | (54 | ) | $ | (29 | ) | $ | (8 | ) | |||||||||
|
|
|
|
|
|
|
|
|
|||||||||||||
| (1) | Pro forma nine months ended September 30, 2012 gives effect to the Acquisition and the PIK Toggle Notes as if they had occurred on January 1, 2011. See “Unaudited Pro Forma Financial Information.” |
Pro Forma Nine Months Ended September 30, 2012 vs. Nine Months Ended September 30, 2011
Net Sales
Net sales derived from the Functional Amines segment was $382 million for the pro forma nine months ended September 30, 2012, a decrease of $11 million, or 2.8%, compared to $393 million for the nine months ended September 30, 2011. Decreased volumes resulted in a decrease of $19 million, which were offset by an increase in pricing and product mix of $8 million. Product mix within the Functional Amines segment was impacted by an increase in the percentage of higher amines and solvents volumes as compared to methylamines and salts volumes. Higher amines and solvents maintain a higher average selling price due to their cost structure and market pricing.
Net sales derived from the Specialty Amines segment was $363 million for the pro forma nine months ended September 30, 2012, an increase of $8 million, or 2.3%, compared to $355 million for the nine months ended September 30, 2011. The increase was due to the startup of the DIMLA plant in the U.S. and increased sales to the water treatment and personal & home care end-markets.
Net sales derived from the Crop Protection segment was $110 million for the pro forma nine months ended September 30, 2012, a decrease of $10 million, or 8.3%, compared to $120 million for the nine months ended September 30, 2011. This decrease was primarily related to adverse economic and weather conditions in the south of Europe, weak performance in the rubber chemicals industry and delays in orders from Latin America.
Adjusted EBITDA
Adjusted EBITDA derived from the Functional Amines segment was $96 million for the pro forma nine months ended September 30, 2012, an increase of $8 million, or 9.1%, compared to $88 million.
59
Table of Contents
Adjusted EBITDA derived from the Specialty Amines segment was $62 million for the pro forma nine months ended September 30, 2012, an increase of $1 million, or 1.6%, compared to $61 million for the nine months ended September 30, 2011.
Adjusted EBITDA derived from the Crop Protection segment was $33 million for the pro forma nine months ended September 30, 2012, a decrease of $2 million, or 5.7%, compared to $35 million for the nine months ended September 30, 2011. This decrease was primarily related to lower volumes due to unfavorable economic and weather conditions.
Adjusted EBITDA for the pro forma nine months ended September 30, 2012 was $191 million, compared to $184 million in the corresponding period of 2011, which represented an increase of $7 million or 3.8%. The increase was mainly due to improved product/customer mix, pricing discipline, addition of new derivative capacities in the U.S. and a strong season in the herbicide amines.
Period from January 1, 2012 to February 14, 2012 (Predecessor Period) and Nine Months Ended September 30, 2012 (Successor Period) vs. Nine Months Ended September 30, 2011
Net Sales
Net sales derived from the Functional Amines segment were $64 million for the Predecessor Period and $318 million for the Successor Period, compared to $393 million for the nine months ended September 30, 2011. Net sales derived from the Specialty Amines segment were $61 million for the Predecessor Period and $302 million for the Successor Period, compared to $355 million for the nine months ended September 30, 2011. Net sales derived from the Crop Protection segment were $19 million for the Predecessor Period and $91 million for the Successor Period, compared to $120 million for the nine months ended September 30, 2011.
Adjusted EBITDA
Adjusted EBITDA derived from the Functional Amines segment was $15 million for the Predecessor Period and $81 million for the Successor Period, compared to $88 million for the nine months ended September 30, 2011. Adjusted EBITDA derived from the Specialty Amines segment was $9 million for the Predecessor Period and $53 million for the Successor Period, compared to $61 million for the nine months ended September 30, 2011. Adjusted EBITDA derived from the Crop Protection segment was $6 million for the Predecessor Period and $27 million for the Successor Period, compared to $35 million for the nine months ended September 30, 2011.
Year Ended December 31, 2011 vs. Year Ended December 31, 2010
Net Sales
Net sales were $1,123 million for the year ended December 31, 2011, an increase of $172 million, or 18.1%, compared to $951 million in the corresponding period of 2010. Approximately $146 million of this increase was due to price increases including those experienced under our CPT Contracts as well as product mix. The proportion of volumes in the Specialty Amines segment increased while the proportion in Functional Amines decreased. In general, Specialty Amines volumes recognize higher average selling price due to their cost structure and market prices. Additionally approximately $26 million of this increase was due to increased demand. This demand was primarily driven by increased sales of water treatment products of approximately 500 metric tons, which were primarily utilized within developing countries. We were also able to utilize increased capacity at our St. Gabriel facility to capture additional market share. Ultimately this resulted in increased sales of approximately 4,100 metric tons of products utilized by manufacturers of fabric softeners and oil and gas products. We also experienced increased Crop Protection volumes of 2,700 metric tons due to a strong fungicide and soil fumigation season.
60
Table of Contents
Cost of Sales
Cost of sales was $906 million for the year ended December 31, 2011, an increase of $149 million, or 19.7%, compared to $757 million in the corresponding period of 2010. The change was primarily related to the higher sales volumes representing approximately $21 million or 14.0% of the increase. The remaining increase of $128 million or 86.0% related to increased cost for key raw materials, such as acetone, ammonia and ethanol as well as product mix due to higher sales of Specialty Amines products which have a higher cost base. Raw materials as a percentage of cost of sales totaled 57.2% and 66.7% for the years ended December 31, 2010 and 2011, respectively. However, given the pass through of raw material costs, the gross profit margin was not affected. The gross profit margin was 20.4% and 19.3% for the years ended December 31, 2010 and 2011, respectively.
Other Operating Expense
Other operating expenses primarily represent legal and other third-party advisory fees as well as restructuring expenses. Other operating expense was $16 million for the year ended December 31, 2011, an increase of $14 million, compared to $2 million in the corresponding period of 2010. This increase was primarily due to our decision and commitment to a restructuring plan associated with our Brazilian operations as well as increased third-party vendor costs leading up to the Acquisition. Other operating expense represented approximately 0.2% and 1.4% of net sales for the years ended December 31, 2010 and 2011, respectively.
Interest Expense/Income
Interest expense was $75 million for the year ended December 31, 2011, an increase of $1 million, or 1.4%, compared to $74 million in the corresponding period of 2010. The change was primarily related to increased interest costs on Euro-denominated debt.
Other Non-operating (Income) Expense
Other non-operating (income) expense for the year ended December 31, 2011 was $1 million, a decrease of $3 million, or 150.0%, compared to other non-operating income of $2 million in the corresponding period of 2010. This decrease was related to foreign exchange rate movements related to our operations.
Income Tax Expense
Income tax expense was $32 million for the year ended December 31, 2011, a decrease of $1 million, or 3.0%, compared to $33 million in the corresponding period of 2010. The Company’s annual effective tax rate was 60.6% and 50.2% for the year ended December 31, 2010 and 2011, respectively while the statutory tax rate was 28.59 % for both fiscal years. The primary drivers of the high effective tax rate relate to foreign tax rate differentials and to an increase in the valuation allowance against deferred tax assets in certain jurisdictions due to uncertainty regarding the Company’s ability to realize the assets. The increase in the effective tax rate from foreign tax rate differentials is driven by jurisdictions where the statutory tax rate in those jurisdictions is higher than the statutory tax rate in Luxembourg, primarily in Belgium and the United States.
Year Ended December 31, 2010 vs. Year Ended December 31, 2009
Net Sales
Net sales were $951 million for the year ended December 31, 2010, an increase of $126 million, or 15.3%, compared to $825 million in the corresponding period of 2009. Approximately $89 million of this increase was due to increased demand. The change was primarily related to increased sales to our customers within the water treatment end-market. The increase in net sales was further driven by an increased demand of approximately 900 metric tons of our fungicide products during the season, partially offset by challenges related to adverse weather
61
Table of Contents
conditions and herbicide reformulations. Additionally approximately $37 million of this increase was due to price increases including those experienced under our CPT Contracts as well as product mix resulting from an increased proportion of Specialty Amines sales, which was offset by a decrease within Functional Amines. In general, Specialty Amines products recognize higher pricing due to higher costs and due to the current market prices.
Cost of Sales
Cost of sales was $757 million for the year ended December 31, 2010, an increase of $106 million, or 16.3%, compared to $651 million in the corresponding period of 2009. The change was primarily related to the higher sales volumes representing approximately $71.2 million or 67.0% of the increase. The remaining increase of $34.8 million or 33.0% was due to increased cost of key raw materials such as acetone and butanol and product mix. Raw materials as a percentage of cost of sales totaled 46.8% and 57.2% for the years ended December 31, 2009 and 2010, respectively. The gross profit margin derived from these periods was 21.1% and 20.4% for the years ended December 31, 2009 and 2010, respectively.
Other Operating Expense
Other operating expenses primarily represent legal and other third party advisory fees as well as restructuring expenses. Other operating expense was $2 million for the year ended December 31, 2010, a decrease of $11 million, or 84.6%, compared to $13 million in the corresponding period. This decrease was due to expenses associated with our abandoned equity offering within the Belgian markets of approximately $9 million as well as a commitment to a restructuring plan associated with our Riverview, Michigan operations totaling $4 million recorded during 2009. Other operating expense represented approximately 0.2% and 1.6% of net sales for the years ended December 31, 2010 and 2009, respectively.
Interest Expense
Interest expense was $74 million for the year ended December 31, 2010, a decrease of $6 million, or 7.5%, compared to $80 million in the corresponding period of 2009. The change was primarily related to lower variable interest rates in Euro- and U.S. Dollar-denominated debt and reduced borrowings.
Other Non-operating (Income) Expense
Other non-operating income was $2 million for the year ended December 31, 2010, a decrease of $6 million, compared to other non-operating expense of $4 million in the corresponding period of 2009. This decrease was related to foreign exchange movements related our operations.
Income Tax Expense
Income tax expense was $33 million for the year ended December 31, 2010, an increase of $17 million, or 106.3%, compared to $16 million in the corresponding period of 2009. The change was primarily related to our profitable operations as income from operations before income taxes increased from $17 million for the year ended December 31, 2009 to $55 million for the year ended December 31, 2010. The Company’s annual effective tax rate was 90.5% and 60.6% for the year ended December 31, 2009 and 2010, respectively while the statutory tax rate was 28.59 % for both fiscal years. The high effective tax rate mainly results from valuation allowances which were recorded against net operating losses in certain jurisdiction to the extent that the related deferred tax assets are not recoverable. The effective tax rate is also increased due to jurisdictions where the statutory tax rate in those jurisdictions is higher than the statutory tax rate in Luxembourg, primarily in Belgium and the United States. Income tax expense in 2009 is partially offset by the release of tax accruals of approximately $2 million due to the expiration of the statute of limitations.
62
Table of Contents
Segment Level Financial Results
The following table presents the results of each of our reportable segments for the periods presented:
| Net Sales | ||||||||||||
| Year ended December 31, | ||||||||||||
| 2009 | 2010 | 2011 | ||||||||||
| (In millions) | ||||||||||||
| Functional Amines |
$ | 411 | $ | 465 | $ | 515 | ||||||
| Specialty Amines |
294 | 357 | 460 | |||||||||
| Crop Protection |
120 | 129 | 148 | |||||||||
|
|
|
|
|
|
|
|||||||
| Total Company |
$ | 825 | $ | 951 | $ | 1,123 | ||||||
|
|
|
|
|
|
|
|||||||
| Adjusted EBITDA | ||||||||||||
| Year ended December 31, | ||||||||||||
| 2009 | 2010 | 2011 | ||||||||||
| (In millions) | ||||||||||||
| Functional Amines |
$ | 111 | $ | 106 | $ | 108 | ||||||
| Specialty Amines |
54 | 57 | 78 | |||||||||
| Crop Protection |
31 | 40 | 41 | |||||||||
|
|
|
|
|
|
|
|||||||
| Total Adjusted EBITDA |
$ | 196 | $ | 203 | $ | 227 | ||||||
|
|
|
|
|
|
|
|||||||
| Reconciliation: |
||||||||||||
| Transaction costs |
(9 | ) | (2 | ) | (5 | ) | ||||||
| Restructuring charges |
(4 | ) | — | (11 | ) | |||||||
| Foreign exchange (gains) losses |
(4 | ) | 2 | (2 | ) | |||||||
| Depreciation and amortization |
(82 | ) | (74 | ) | (72 | ) | ||||||
| Interest expense, net |
(80 | ) | (74 | ) | (75 | ) | ||||||
| Income tax benefit |
(16 | ) | (33 | ) | (32 | ) | ||||||
|
|
|
|
|
|
|
|||||||
| Net income |
$ | 1 | $ | 22 | $ | 30 | ||||||
|
|
|
|
|
|
|
|||||||
Net Sales
Net sales derived from the Functional Amines segment were $515 million for the year ended December 31, 2011, an increase of $50 million, or 10.8%, compared to $465 million for the corresponding period in 2010. Approximately $65 million of this increase was due to price increases, including those experienced under our CPT Contracts as well as changes in product mix resulting from an increased proportion of Specialty Amines sales, which was offset by a decrease within Functional Amines. In general, Specialty Amines products recognize higher pricing due to higher costs and due to the current market prices. This increase was offset by a reduction in volume resulting in a reduction in revenue of $15 million. Net sales derived from the Functional Amines segment were $465 million for the year ended December 31, 2010, an increase of $54 million, or 13.1%, compared to $411 million for the corresponding period of 2009. Approximately $35 million of this increase was due to increased demand. Additionally, approximately $19 million of this increase was due to price increases, including those experienced under our CPT Contracts which were offset by changes in product mix resulting from a reduction in the proportion of volumes in the higher amines and solvents markets.
Net sales derived from the Specialty Amines segment were $460 million in the year ended December 31, 2011, an increase of $103 million, or 28.9%, compared to $357 million for the corresponding period in 2010. Approximately $58 million of this increase was due to price increases, including those experienced under our CPT Contracts as well as changes in product mix which was a result of an increase in specialty intermediate volumes in proportion to performance products. Specialty intermediates have a higher average selling price due
63
Table of Contents
to their cost structure and market pricing. Additionally approximately $45 million of this increase was due to increased demand in the water treatment and oil & gas end-markets. Net sales derived from the Specialty Amines segment were $357 million in the year ended December 31, 2010, an increase of $63 million, or 21.4%, compared to $294 million for the corresponding period in 2009. Approximately $50 million of this increase was due to increased demand in the water treatment end-market. Additionally, approximately $13 million of this increase was due to price increases, including those experienced under our CPT Contracts as well as changes in product mix as a result of an increase in proportion of specialty intermediates versus performance products. In general, specialty intermediates products have a higher average selling price due to their cost structure and market pricing.
Net sales derived from the Crop Protection segment for the year ended December 31, 2011 were $148 million, an increase of $19 million, or 14.7%, compared to $129 million for the corresponding period in 2010. Approximately $7 million of this increase was due to increased demand. The increase was primarily related to a strong fungicide and soil fumigant season. Additionally, approximately $12 million of this increase was due to price increases, including those experienced under our CPT Contracts. Net sales derived from the Crop Protection segment for the year ended December 31, 2010 were $129 million, an increase of $9 million, or 7.5%, compared to $120 million for the corresponding period in 2009. Approximately $7 million of this increase was due to increased demand. The increase was primarily related to a strong fungicide season. Additionally, approximately $2 million of this increase was due to price increases, including those experienced under our CPT Contracts.
Adjusted EBITDA
Adjusted EBITDA derived from the Functional Amines segment was $108 million in the year ended December 31, 2011, an increase of $2 million, or 1.9%, compared to $106 million for the corresponding period in 2010. This increase was primarily related to increased net sales of $50 million, offset by increased cost of sales of $54 million inclusive of higher raw material costs, which increased from 57.2% of cost of sales in 2010 to 66.2% of cost of sales in 2011. The increase in cost of sales was offset by savings in selling, general and administrative and research and development expenses. Adjusted EBITDA derived from the Functional Amines segment was $106 million in the year ended December 31, 2010, a decrease of $5 million, or 4.5%, compared to $111 million for the corresponding period in 2009. This decrease was primarily related to raw material costs.
Adjusted EBITDA derived from the Specialty Amines segment was $78 million in the year ended December 31, 2011, an increase of $21 million, or 36.8%, compared to $57 million for the corresponding period in 2010. This increase was primarily related to increased demand in the water treatment and oil & gas end-markets that increased net sales by $103 million, partially offset by the related cost of sales of $79 million to maintain margins. Adjusted EBITDA for the Specialty Amines segment was $57 million in the year ended December 31, 2010, an increase of $3 million, or 5.6%, compared to $54 million for the corresponding period in 2009. This increase was primarily related to higher sales volumes and increasing net sales of $63 million, partially offset by the related cost of sales of approximately $59 million to maintain margins.
Adjusted EBITDA derived from the Crop Protection segment was $41 million in the year ended December 31, 2011, an increase of $1 million or 2.5%, compared to $40 million for the corresponding period in 2010. This increase was primarily related to higher sales volume and increasing net sales of $19 million. Adjusted EBITDA for the Crop Protection segment was $40 million in the year ended December 31, 2010, an increase of $9 million, or 29.0%, compared to $31 million for the corresponding period in 2009. This increase was primarily related to higher sales volumes and net sales of $9 million at strong margins.
Liquidity and Capital Resources
Our principal sources of liquidity are cash from operations and short- and long-term borrowings. We also make use of an off-balance sheet, non-recourse factoring facility (the “Non-recourse Factoring Facility”) to help manage our liquidity position. The Non-recourse Factoring Facility has a limit of $129.3 million, the U.S. Dollar
64
Table of Contents
equivalent of the €100 million commitment amount, and applies solely to the accounts receivable of Taminco BVBA (formerly Taminco NV) and Taminco Inc. Financing for each borrower is limited to a maximum of 15% of the amount of approved outstanding accounts receivable for all borrowers assigned to the bank acting as factor with the exception of certain agreed upon borrowers, the financing for whom is limited to 30% of the amount of approved outstanding accounts receivable. The Non-recourse Factoring Facility is committed until July 1, 2015 with a provision for indefinite extension and a notice period prior to termination of one year. Financing was approved on 85% of the relevant outstanding accounts receivable.
The costs associated with the Non-recourse Factoring Facility consist of a commission fee on the factored receivables and an interest charge on the amount drawn under the facility. The commission fee and interest charge for the nine months ended September 30, 2012 were $0.6 million and $0.3 million, respectively. The commission fee is included in selling, general and administrative expense on the income statement and the interest charge is included in interest expense on the income statement. The Non-recourse Factoring Facility is an off-balance sheet obligation, and is not included in calculations of our indebtedness. The amount drawn under the Non-recourse Factoring Facility was $97 million at September 30, 2012 and $75 million at December 31, 2011. For additional information, please see “Description of Indebtedness—Non-recourse Factoring Facility Agreement.”
We also have senior secured credit facilities totaling $696 million (the “Senior Secured Credit Facilities”), consisting of a $194 million revolving credit facility, none of which was drawn as of September 30, 2012, and a $348 million USD term loan facility and €120 million EUR term loan facility, $400 million in aggregate principal amount outstanding of 9.75% second-priority senior secured notes due 2020 (the “2020 Notes”), and $250 million in aggregate principal amount outstanding of 9.125%/9.875% Senior PIK Toggle Notes due 2017 (the “PIK Toggle Notes” and, together with the 2020 Notes, the “Notes”). The Senior Secured Credit Facility and the indentures governing the Notes contain customary covenants. We may be required to comply with a specific financial ratio under our revolving credit facility. Under the revolving credit facility, if we have indebtedness under the revolving credit facility or if more than $20 million of letters of credit that are not cash-collateralized are outstanding, we must maintain a maximum net first lien coverage ratio of 3.75 to 1.00, tested quarterly and upon each credit extension. As of September 30, 2012, there were no amounts drawn under our revolving credit facility and we had a net first lien coverage ratio of 1.9 to 1.00, which would have been in compliance with the ratio requirement if we were under an obligation to comply. This restriction may affect our ability to operate our business and may limit our ability to take advantage of potential business opportunities as they arise. For a description of the covenants and material terms under the indentures governing the Notes and the Senior Secured Credit Facilities, see “Description of Indebtedness” and “Note 9—Short and Long Term Debt” of our unaudited condensed consolidated financial statements included elsewhere in this prospectus.
Future Cash Needs
Our primary future cash needs will be to meet debt service requirements, working capital requirements, capital commitments and capital expenditures. Capital expenditures in 2013 are expected to be approximately $86 million (of which $66 million are for growth capital expenditures). We may also pursue strategic acquisition opportunities, which may impact our future cash requirements. We believe that our cash flows from operations, combined with availability under our revolving credit facility and our factoring facility, will be sufficient to meet our presently anticipated future cash needs. We may, from time to time, increase borrowings under our revolving credit facility or issue securities, if market conditions are favorable, to meet our future cash needs or to reduce our borrowing costs.
We or our affiliates may from time to time seek to retire the Notes or loans through cash purchases and/or exchanges for equity securities, in open market purchases, privately negotiated transactions, tenders or otherwise. Such repurchases or exchanges, if any, will depend on prevailing market conditions, our liquidity requirements, contractual restrictions and other factors. The amounts involved may be material.
65
Table of Contents
Cash Flows
Cash and cash equivalents decreased from $131 million at December 31, 2011 to $58 million at September 30, 2012. This decrease was primarily attributable to refinancing upon the closing of the Acquisition, including related Acquisition costs. Cash and cash equivalents increased from $111 million at December 31, 2010 to $131 million at December 31, 2011. Similarly, cash and cash equivalents increased from $91 million at December 31, 2009 to $111 million at December 31, 2010. These increases were primarily attributable to increased cash generation from our operating activities, partially offset by cash used in investing and financing activities. Of the total cash balance, the majority is in the United States and Belgium, which is where the cash needs are. Management believes the cash is located in the regions needed.
Cash flows from operating, investing and financing activities are presented in the following table:
| Predecessor | Successor | |||||||||||||||||||||||||
| Year ended December 31, |
||||||||||||||||||||||||||
| 2009 | 2010 | 2011 | Nine months ended September 30, 2011 |
January 1 through February 14, 2012 |
Nine months ended September 30, 2012 |
|||||||||||||||||||||
| (In millions) | ||||||||||||||||||||||||||
| Cash provided by (use in): |
||||||||||||||||||||||||||
| Operating activities |
$ | 133 | $ | 112 | $ | 117 | $ | 109 | $ | 44 | $ | (8 | ) | |||||||||||||
| Investing activities |
(51 | ) | (68 | ) | (75 | ) | (52 | ) | (6 | ) | (195 | ) | ||||||||||||||
| Financing activities |
(7 | ) | (22 | ) | (19 | ) | (10 | ) | — | 266 | ||||||||||||||||
| Effects of change in exchange rates on cash and cash equivalents |
1 | (2 | ) | (3 | ) | (2 | ) | 2 | (5 | ) | ||||||||||||||||
|
|
|
|
|
|
|
|
|
|
|
|
|
|||||||||||||||
| Net change in cash and cash equivalents |
$ | 76 | $ | 20 | $ | 20 | $ | 45 | $ | 40 | $ | 58 | ||||||||||||||
|
|
|
|
|
|
|
|
|
|
|
|
|
|||||||||||||||
Net cash flows from operating activities consist of profit after tax adjusted for changes in net working capital and non-cash items such as depreciation, amortization and write-offs, and movements in provisions and pensions. For the nine months ended September 30, 2012, cash used in operating activities was $8 million, compared to $109 million of cash generated in operations in the corresponding period in 2011 primarily as a result of the transaction costs of $44 million and a decrease in our net working capital position of $1 million, driven by inventory increases, partially offset by positive operating income excluding transaction costs. Adjusted for the transaction costs, cash from operating activities for the nine months ended September 30, 2012 would have been $36 million. For the year ended December 31, 2011, we generated $117 million of cash flow from operating activities, following strong cash flow from operating activities, partially offset by $26 million working capital increase primarily related to higher inventory associated with increased raw material prices. For the year ended December 31, 2010, we generated $112 million of cash flow from operating activities, following strong operating results for the period, partially offset by a $35 million working capital increase primarily related to higher inventory associated with increased raw material prices. For the year ended December 31, 2009, we generated $133 million of cash flow from operating activities, primarily reflecting strong cash profitability and a $2 million decrease in working capital.
66
Table of Contents
The following table presents our trade working capital and trade working capital margin as of the periods presented:
| As of the year ended December 31, | As of the nine months ended September 30, |
|||||||||||||||
| 2009 | 2010 | 2011 | 2012 | |||||||||||||
| (In millions, except percentages) | ||||||||||||||||
| Trade receivables |
$ | 64 | $ | 91 | $ | 90 | $ | 88 | ||||||||
| Inventories |
78 | 87 | 117 | 136 | ||||||||||||
| Trade payables |
68 | 69 | 72 | 90 | ||||||||||||
|
|
|
|
|
|
|
|
|
|||||||||
| Trade working capital(1) |
74 | 109 | 135 | 134 | ||||||||||||
|
|
|
|
|
|
|
|
|
|||||||||
| (1) | Trade working capital represents trade receivables plus inventories less trade payables. |
Trade Working Capital
Trade working capital at September 30, 2012 was $134 million, down by $1 million from $135 million at the end of 2011, mainly as a result of lower trade receivables. The increase in inventories was offset in part by an increase in accounts payable.
Trade Receivables
Trade receivables at September 30, 2012 were $88 million, a decrease of $2 million from $90 million at the end of 2011. The decrease was due to the drawing of the Non-recourse Factoring Facility.
Inventories
Inventories at September 30, 2012 were $136 million, an increase of $19 million from $117 million at the end of 2011. This increase was mainly due to an increase in finished goods related to an upcoming outage in our European facility with a smaller increase in raw materials.
Non-current Interest-bearing Loans and Borrowings
Interest-bearing loans and borrowings decreased by $221 million to $910 million between December 31, 2011 and September 30, 2012, reflecting a new debt structure subsequent to the Acquisition. Interest-bearing loans and borrowings decreased by $22 million to $1,102 million between December 31, 2010 and December 31, 2011 due to principal payments made and currency fluctuations.
Cash used in investing activities was $195 million for the nine months ended September 30, 2012 primarily due to the new DIMLA unit at our Pace, Florida facility, in addition to major maintenance and growth projects, as well as the Acquisition. Cash used in investing activities for the year ended December 31, 2011 was $75 million, also related to initial spending on the new DIMLA unit, as well as the investment in a new DMAPA unit at our St. Gabriel, Louisiana facility. Cash used in investing activities was $68 million for the year ended December 31, 2010, primarily due to increased capital expenditures on our new DMAPA units in the United States, major maintenance projects with respect to our production units and the initial payment for the acquisition of our interest in the joint venture in China. Cash used in investing activities was $51 million for the year ended December 31, 2009, primarily consisting of capital expenditures associated with the addition of new capacity at St. Gabriel and a co-generation unit at Ghent.
67
Table of Contents
The table below sets forth information with respect to our capital expenditures for the periods presented.
| Predecessor | Successor | |||||||||||||||||||||||||
| Year ended December 31, |
||||||||||||||||||||||||||
| 2009 | 2010 | 2011 | Nine months ended September 30, 2011 |
January 1 through February 14, 2012 |
Nine months ended September 30, 2012 |
|||||||||||||||||||||
| (In millions) | ||||||||||||||||||||||||||
| Tangible capital expenditures |
$ | 41 | $ | 62 | $ | 54 | $ | 34 | $ | 6 | $ | 33 | ||||||||||||||
|
|
|
|
|
|
|
|
|
|
|
|
|
|||||||||||||||
| Growth and optimization |
21 | 54 | 41 | 25 | 5 | 26 | ||||||||||||||||||||
| Capital improvements |
20 | 8 | 13 | 9 | 1 | 7 | ||||||||||||||||||||
| Intangible capital expenditures |
10 | 5 | 7 | 4 | 0 | 4 | ||||||||||||||||||||
|
|
|
|
|
|
|
|
|
|
|
|
|
|||||||||||||||
| Total capital expenditures |
$ | 51 | $ | 67 | $ | 61 | $ | 38 | $ | 6 | $ | 37 | ||||||||||||||
|
|
|
|
|
|
|
|
|
|
|
|
|
|||||||||||||||
Generally, our capital expenditures are directed to one of three main categories of tangible assets: growth projects, optimization projects and capital improvements. A relatively small part of our capital expenditures are spent on intangible assets, including information and communications technology and toxicological and regulatory studies in connection with product registrations and re-registrations.
Cash generated in financing activities in the nine months ended September 30, 2012 was $266 million, as a result of the refinancing upon the closing of the Acquisition, which included the unwinding of the outstanding interest rate swaps, as well as the debt premium and debt issuance cost of $56 million. The corresponding period of 2011 had cash used from financing activities of $10 million. Cash used in financing activities for the year ended December 31, 2011, 2010 and 2009 was $19 million, $22 million and $7 million, respectively, consisting of repayments on our Senior Credit Facilities.
Contractual Obligations and Commitments
The following table sets forth, by major category of commitment and obligation, our material contractual obligations and their maturity as of December 31, 2011:
| 2012 | 2013 | 2014 | 2015 | 2016 | Thereafter | Total | ||||||||||||||||||||||
| (In millions) | ||||||||||||||||||||||||||||
| Related party second lien notes |
$ | — | $ | — | $ | — | $ | — | $ | — | $ | 373 | $ | 373 | ||||||||||||||
| Term facilities - € loan |
13 | 15 | 21 | 99 | 110 | 155 | 413 | |||||||||||||||||||||
| Term facilities - $ loan |
15 | 18 | 20 | 142 | 142 | — | 337 | |||||||||||||||||||||
| Interest expense |
70 | 69 | 68 | 62 | 51 | 33 | 353 | |||||||||||||||||||||
| Operating leases |
10 | 9 | 9 | 8 | 8 | 12 | 56 | |||||||||||||||||||||
| Capital leases |
1 | 1 | 1 | 1 | 1 | 3 | 8 | |||||||||||||||||||||
| Purchase commitments(a) |
4 | 5 | 4 | 4 | 4 | 19 | 40 | |||||||||||||||||||||
|
|
|
|
|
|
|
|
|
|
|
|
|
|
|
|||||||||||||||
| Total |
$ | 113 | $ | 117 | $ | 123 | $ | 316 | $ | 316 | $ | 595 | $ | 1,580 | ||||||||||||||
|
|
|
|
|
|
|
|
|
|
|
|
|
|
|
|||||||||||||||
| (a) | We are a party to certain obligations to purchase products and services, principally related to the purchase of raw materials. These commitments are designed to assure sources of supply and historically have not and are not expected to be in excess of our manufacturing requirements. Under a limited number of these obligations, which are structured as take-or-pay contracts, we are obligated to make minimum payments whether or not we take the contractual minimum. The amounts disclosed in the above table represent these minimum payments to be made in accordance with the contracts in place. We have historically always required the minimum levels in each of these contracts. |
68
Table of Contents
The following table sets forth, by major category of commitment and obligation, our material contractual obligations and their maturity as of September 30, 2012:
| 2012 | 2013 | 2014 | 2015 | 2016 | Thereafter | Total | ||||||||||||||||||||||
| (In millions) | ||||||||||||||||||||||||||||
| Senior Secured Credit Facilities |
||||||||||||||||||||||||||||
| Revolving credit facility |
$ | — | $ | — | $ | — | $ | — | $ | — | $ | — | $ | — | ||||||||||||||
| USD term loan credit facility |
1 | 4 | 4 | 4 | 4 | 331 | 348 | |||||||||||||||||||||
| EUR term loan credit facility |
— | 2 | 2 | 2 | 2 | 146 | 154 | |||||||||||||||||||||
| Second-priority senior secured notes |
— | — | — | — | — | 400 | 400 | |||||||||||||||||||||
| Interest expense |
7 | 65 | 65 | 65 | 65 | 190 | 457 | |||||||||||||||||||||
| Operating leases |
2 | 9 | 9 | 8 | 8 | 12 | 48 | |||||||||||||||||||||
| Capital leases |
— | 1 | 1 | 1 | 1 | 3 | 7 | |||||||||||||||||||||
| Purchase commitments(a) |
1 | 5 | 4 | 4 | 4 | 19 | 37 | |||||||||||||||||||||
|
|
|
|
|
|
|
|
|
|
|
|
|
|
|
|||||||||||||||
| Total |
$ | 11 | $ | 86 | $ | 85 | $ | 84 | $ | 84 | $ | 1,101 | $ | 1,451 | ||||||||||||||
|
|
|
|
|
|
|
|
|
|
|
|
|
|
|
|||||||||||||||
| (a) | We are a party to certain obligations to purchase products and services, principally related to the purchase of raw materials. These commitments are designed to assure sources of supply and historically have not and are not expected to be in excess of our manufacturing requirements. Under a limited number of these obligations, which are structured as take-or-pay contracts, we are obligated to make minimum payments whether or not we take the contractual minimum. The amounts disclosed in the above table represent these minimum payments to be made in accordance with the contracts in place. We have historically always required the minimum levels in each of these contracts. |
Off-Balance Sheet Arrangements
Our primary off-balance sheet commitment is the Non-recourse Factoring Facility described above under “—Liquidity and Capital Resources.”
Critical Accounting Policies
“Management’s Discussion and Analysis of Financial Condition and Results of Operations” discusses our consolidated financial statements, which have been prepared in accordance with GAAP.
Use of Estimates
The preparation of our consolidated financial statements requires management to make estimates and assumptions that affect the reported amounts of assets and liabilities at the date of the consolidated financial statements, as well as revenues and expenses during the reported periods.
On an on-going basis, management evaluates its estimates and judgments regarding impairment on goodwill, pension benefits, share-based compensation and income taxes. Management bases its estimates and judgments on historical experience and on various other factors that are believed to be reasonable under the circumstances. The results from this evaluation form the basis for making judgments about the carrying values of assets and liabilities that are not readily apparent from other sources. Under different assumptions or conditions, alternative estimates and judgments could be derived which would differ from the estimates being used by management. Actual results could differ from any or all of these estimates.
Impairment on Goodwill
We assess goodwill for impairment annually, or more frequently if circumstances indicate impairment may have occurred. We perform our required annual impairment testing in the fourth quarter of each year subsequent to completing our annual forecasting process. Each of our operating segments represents a reporting unit.
69
Table of Contents
We assess goodwill for impairment by first comparing the carrying value of each reporting unit to its fair value using the present value of expected future cash flows. If the fair value is less than the carrying value, then we would perform a second test for that reporting unit to determine the amount of impairment loss, if any. We determine the fair value of our reporting units utilizing our best estimate of future revenues, operating expenses, cash flows, market and general economic conditions as well as assumptions that we believe marketplace participants utilize, including discount rates, cost of capital and long term growth rates. When available and as appropriate, we use comparable market multiples and other factors to corroborate the discounted cash flow results. During our 2011 assessment, we noted that an increase of the weighted average cost of capital, a key assumption, of 1%, with the other key assumptions being unchanged, would not result in impairment of any of the units. As a result of the Acquisition, the fair value of the current reporting units equals the recorded value.
Pension Benefits
The costs of the granted pension plans and the current value of the pension liabilities are determined using an actuarial valuation. The actuarial valuation involves making assumptions about the discount rate, expected yield of the pension funds, future increases in compensations, mortality tables and future pension increases. Due to the long-term nature of these plans, such estimates are subject to uncertainty. The net pension liability was $13 million at December 31, 2011 and $17 million at September 30, 2012.
We believe the current assumptions used to estimate obligations and pension expense are appropriate in the current economic environment. However, as economic conditions change, we may change some of our assumptions, which could have a material impact on our financial condition and results of operations.
The following table presents the sensitivity of our project pension benefit obligation (“PBO”), accumulated benefit obligation (“ABO”), deficit (“Deficit”) and 2011 pension expense to the following changes in key assumptions:
| Increase/(Decrease) at December 31, 2011 | Increase/(Decrease) | |||||||||||||||
| PBO | ABO | Deficit | 2011 Expense | |||||||||||||
| Assumptions: |
||||||||||||||||
| Increase in discount rate of 0.5% |
$ | (1 | ) | $ | (1 | ) | $ | (1 | ) | $ | — | |||||
| Decrease in discount rate of 0.5% |
$ | 1 | $ | 1 | $ | 1 | $ | — | ||||||||
| Increase in estimated return on assets of 1.0% |
N/M | N/M | N/M | $ | — | |||||||||||
| Decrease in estimated return on assets of 1.0% |
N/M | N/M | N/M | $ | — | |||||||||||
Share-Based Compensation
The Company uses the Black-Scholes option pricing model to estimate the fair value of time vested stock options and a lattice based valuation model to estimate the fair value of performance-based awards on the date of grant which requires certain estimates by management including the expected volatility and expected term of the option. The fair value of the performance vesting options was determined using the Monte Carlo model.
Management also makes decisions regarding the risk-free interest rate used in the models and makes estimates regarding forfeiture rates. Fluctuations in the market that affect these estimates could have an impact on the resulting compensation cost. For non-performance based employee stock awards, the fair value of the compensation cost is recognized on a straight-line basis over the requisite service period of the award. Compensation cost for restricted stock (non-vested stock) is recorded based on its market value on the date of grant and is expensed in the Company’s consolidated statements of operations ratably over the vesting period. For a description of the assumptions used in our fair value determination of share based compensation, see “Note 10— Share-Based Compensation” of our unaudited condensed consolidated financial statements included elsewhere in this prospectus.
70
Table of Contents
In April 2012, the Compensation Committee of our Board of Directors granted approximately 143,000 time vested stock options and approximately 220,000 performance-based awards to certain management employees. Our expected volatility for these options is based on the average volatility rates of similar actively traded companies. The expected holding period of the time vested options was initially calculated based on the simplified method and extended to eight years based upon certain provisions where the Company may repurchase shares acquired through the exercise of the options at the lesser of cost or fair value. The risk-free rate is derived from the U.S. Treasuries, the period of which relates to the grant’s holding period. If these factors change and we employ different assumptions, the fair value of future awards and resulting stock-based compensation expense may differ significantly from what we have estimated historically.
The estimate of the intrinsic value of the time vested and performance-based options (share value at the time of issuance less exercise price) was contemporaneously determined and based on the common share value agreed upon between two unrelated third parties, namely CVC Capital Partners and Apollo, during Apollo’s acquisition of the Company. As the Acquisition occurred approximately one month prior to the grant of the above stock options and the Company operations and structure remained unchanged during this time, management as well as our third party specialist believes this value best represents the fair value of the Company’s common shares in the absence of having a quoted market price on an active exchange.
The below table details the April 2012 grant prices and grant totals:
| Type of Grant |
Number of options granted |
Estimated share value used for fair value calculation |
Fair value of each option at grant date |
Option exercise price |
||||||||||||
| Time Vested |
143,000 | $ | 100.00 | $ | 44.29 | $ | 100.00 | |||||||||
| Performance-Based |
||||||||||||||||
| Tranche A |
73,300 | $ | 100.00 | $ | 15.14 | $ | 100.00 | |||||||||
| Tranche B |
73,300 | $ | 100.00 | $ | 10.52 | $ | 100.00 | |||||||||
| Tranche C |
73,400 | $ | 100.00 | $ | 6.78 | $ | 100.00 | |||||||||
Based upon an estimated offering price of $ per share, which is the midpoint of the offering price range set forth on the cover page of this prospectus, the options would have an intrinsic value of approximately $ million.
Income Taxes
Our provision for income taxes is determined using the asset and liability method, under which deferred tax assets and liabilities are calculated based upon the temporary differences between the financial statement and income tax bases of assets and liabilities using currently enacted tax rates and operating loss and tax credit carryforwards.
Our deferred tax assets are recorded net of a valuation allowance when, based on the weight of available evidence, it is more likely than not that all or some portion of the recorded deferred tax balances will not be realized in future periods. The amount of deferred tax assets considered realizable could be reduced in the near period if estimates of future taxable income in the carryforward period are reduced.
ASC 740-10 requires the recognition of a tax benefit when it is more likely than not, based on the technical merits, that the position would be sustained upon examination by a taxing authority. The amount to be recognized is measured as the largest amount of tax benefit that is greater than 50% likely of being realized upon settlement with a taxing authority.
71
Table of Contents
We record interest and penalties accrued related to unrecognized tax benefits as income tax expense.
The Company’s deferred tax assets are recorded, net of valuation allowance, when, based on the weight of available evidence, it is more likely than not that all or some portion of the recorded deferred tax balances will not be realized in future periods. Decreases to the valuation allowance are recorded as deductions to the Company’s provision for income taxes and increases to the valuation allowance result in an additional provision for income taxes.
Quantitative and Qualitative Disclosure About Market Risk
Foreign Currency Risk
We operate on a global basis and face foreign exchange risk arising from various currency exposures, primarily with respect to U.S. Dollar and Euro. We are exposed to currency risks from our investing, financing and operating activities. We intend to utilize a hedging strategy to mitigate the cash flow impact of foreign currency exchange risk.
We frequently enter into transactions with third parties that are settled in currencies other than our current functional currencies. This risk is partially mitigated by matching the currency of third party transactions with the currency denomination of our indebtedness and intercompany loans. To the extent that such matching is insufficient to ameliorate exchange risk, we may consider entering into swap or other hedging contracts to provide additional protection from foreign exchange fluctuations.
We intend, among other things, to effectuate our general policy to reduce this risk:
| • | by funding working capital and capital expenditures in the currency in which they generate the majority of their operational cash flows; and |
| • | through otherwise strategically denominated borrowings in the functional currencies of our companies, principally either U.S. Dollar or Euro. |
Currency risks from investing activities
Foreign-currency risks arise in the area of investing activities, such as from the acquisition and disposal of non-U.S. Dollar denominated investments. We may hedge these risks, however, this risk has not historically affected our company.
Currency risks from financing activities
Foreign currency risks in the financing area arise from our financial liabilities vis-à-vis third parties in foreign currencies and from intercompany loans denominated in foreign currencies that are extended between our companies for financing purposes. We intend to convert financial obligations and intercompany loans denominated in foreign currencies into our functional currency or a currency that otherwise offsets related risk.
Currency risks from operating activities
Foreign currency risks in the operating area result from transactions with third parties that are not denominated in the functional currency of the respective group company. Some of our group companies with the Euro as the functional currency do experience significant U.S. Dollar denominated cash flows. However, currency risks resulting from operating activities in non-functional currencies are naturally hedged by matching the denomination of loans to and from our companies and third parties to the denomination of operating cash flows in non-functional currencies.
72
Table of Contents
Cash flow and fair value interest rate risk
Our interest rate risk arises from external borrowings. Borrowings issued at variable rates expose us to cash flow interest rate risk. Borrowings issued at fixed rates expose us to fair value interest rate risk. Approximately one-half of our borrowings are variable rate indebtedness. We currently do not intend to employ interest rate hedges.
We assess our market risk based on changes in interest rates utilizing a sensitivity analysis. The sensitivity analysis measures the potential impact on earnings, fair values and cash flows based on a hypothetical 10% change (increase and decrease) in interest rates. A hypothetical 10% increase in our interest rate would have resulted in $78 million and $55 million in interest expense for the year ended December 31, 2011 and the nine-month period ended September 30, 2012, respectively.
Credit risk
Credit risk arises from cash, cash equivalents and deposits with banks and financial institutions, as well as credit exposures to customers, including outstanding receivables. Our internal policies require that credit exposures with banks and other financial institutions be regularly measured and actively managed and that results reported to senior management to ensure relevancy in volatile credit markets. Credit risks related to trade receivables are systematically analyzed, monitored and managed. We have policies in place to ensure that sales of products and services on credit are made to customers with an appropriate credit history.
Change in Accountants
On June 21, 2012, the audit committee of our board of directors approved the decision to dismiss Ernst & Young Bedrijfsrevisoren BCVBA (the “Former Auditors”) and appoint PricewaterhouseCoopers LLP as our independent registered public accounting firm. We were not an SEC filer at the time of the Former Auditors’ replacement by PricewaterhouseCoopers LLP. The Former Auditors’ audit reports on our consolidated financial statements for the years ended December 31, 2010 and 2011 did not contain any adverse opinion or disclaimer of opinion, and were not qualified or modified as to uncertainty, audit scope or accounting principles.
During the subsequent interim period on or prior to replacement, there were no disagreements between us and the Former Auditors on any matter of accounting principles or practices, financial statement disclosure, or auditing scope or procedures, which disagreements, if not resolved to the satisfaction of the Former Auditors, would have caused the Former Auditors to make reference to the subject matter of the disagreement in connection with its report.
During the years ended December 31, 2010 and 2011 and the subsequent interim period from January 1, 2012 through February 14, 2012, we did not consult with PricewaterhouseCoopers LLP regarding the application of accounting principles to a specified transaction, either completed or proposed, or any of the matters or events set forth in Item 304(a)(2) of Regulation S-K.
73
Table of Contents
Description of our products
Alkylamines are organic compounds produced through the reaction of an alcohol with ammonia. The largest alkylamine product category by volume consists of methylamines, where the alcohol used is methanol. Higher alkylamines are produced when alcohols containing chains of two or more carbon atoms are used instead of methanol. International and regional competition in the alkylamine industry can be affected by the cost and logistical difficulties involved in the shipping of alkylamine building blocks. Alkylamine derivatives production tends to be regional to minimize shipping costs. As a result of these factors, production in the industry is generally regional.
We believe that our extensive expertise and technology, our existing investments in profitable, vertically integrated manufacturing facilities, and our current set of product registrations from environmental, health and safety regulatory authorities give us a significant advantage over our competitors and new entrants. We also find it advantageous that some of our competitors have chosen to enter into certain downstream products that we do not manufacture and that compete directly with their customers.
Over the past decade, producers in the alkylamine industry that compete in our geographies have consolidated significantly. Key consolidation events include Air Products’s UK closure of a 50 kt production line in 2004, Chinook Canada’s closure of a 68 kt production line in 2004 and sale of contracts to DuPont, our purchase of Air Products’s North American and Latin American amines business in 2006, Akzo Nobel’s Netherlands closure of a 22 kt production line in 2006 and sale of contracts to us and Balchem’s purchase of Akzo Nobel’s 18 kt Italian operations in 2007.
The largest alkylamine building block product by volume is methylamines, followed by higher alkylamines. Methylamines are manufactured by combining methanol with ammonia in a catalytic reactor. Three different methylamine isomers are produced: mono methylamine (“MMA”), di methylamine (“DMA”) and tri methylamine (“TMA”). The proportion in which these three isomers are produced depends upon pressure, temperature and the specific catalyst present in the catalytic reactor. If an excess of any isomer is produced, it is returned to the catalytic reactor and recycled. The isomers are then distilled and used as raw materials for the production of alkylamine derivatives, or in other manufacturing processes.
The term higher alkylamines refers to the C2-C6 alkylamines, that is, ethyl, n butyl, n propyl, isopropyl and cyclohexyl amines. The manufacturing process for higher alkylamines is similar to that for methylamines, as ammonia is combined with various alcohols in catalytic reactors and subsequently distilled. The use of different alcohols results in the creation of different higher alkylamines.
According to the ADL Report, consumption of methylamines accounted for 74% of global consumption of alkylamines by volume. Higher alkylamines made up the remainder of global consumption, with ethylamines accounting for 7%, isopropylamines, which include MIPA, for 13% and butylamines for 2% of total global consumption by volume.
The three producers of methylamines in North America are Taminco, DuPont and BASF, with Taminco having the largest share of production capacity at 49% in 2011 according to the ADL Report and DuPont having the next largest share. The two producers of higher alkylamines in North America are Taminco and U.S. Amines, with Taminco’s share of production capacity at 75% in 2011. The European methylamine producers are Taminco, BASF, Balchem and CEPSA, with Taminco having the largest share of European production capacity at 52% and BASF having the majority of the remaining capacity share. In Asia, the significant methylamine producers include Zheijiang Jiangshu, Shandong Huala Hengsheng, Luxi Chemical Corp. and Taminco, with Taminco’s share representing 4% of Asian production capacity in 2011.
In general, because alkylamines are key intermediates in numerous end-market products, there is a reduced threat of substitution by other products. In addition, although there has recently been increasing interest in the use
74
Table of Contents
of renewable-based precursors, such as biomethanol, bioethanol and bioammonia, in the production of alkylamines, we believe our production facilities, equipment and production processes would be able to readily adapt to such developments. For example, bioethanol is already used as feedstock in ethylamine production in the United States. We are also in the process of developing new amines produced from renewable precursors, which are intended for products in the personal care and agricultural end-markets.
Methylamines are expensive to transport in gaseous form due to their volatile nature and logistical complexity. As such, supply and demand for methylamines is typically matched on a regional basis. Competition in higher alkylamines production is generally regional. With few exceptions, producers tend to focus on producing a small number of higher alkylamines, which results in a limited number of producers of each type of higher alkylamine in each region.
Methylamines and higher alkylamines are the principal building blocks that can, following reaction with various other chemical compounds, be used for the manufacture of a wide range of specialty alkylamine derivatives.
Markets for Our Products
We are the world’s largest pure play producer of alkylamines and alkylamine derivatives according to the ADL Report. Our products are used by our customers in the manufacturing of everyday products primarily for the agriculture, water treatment, personal & home care, animal nutrition and oil & gas end-markets. Our products provide these goods with a variety of ancillary characteristics required for optimal performance, such as neutralizing acidity, and removing contaminants. We have an extensive offering of differentiated value-added products that typically represent a small portion of our customers’ overall costs and are sold into diversified, global end-markets that benefit from favorable underlying economic and population growth trends. We currently operate in 19 countries with seven production facilities and, as of September 30, 2012, had an installed production capacity of 1,302 kt. According to the ADL Report, we hold the #1 or #2 market position globally in the vast majority of the chemicals we produce, including an approximately 50% and 75% capacity share of certain products, respectively, in North America and Europe. During the Pro Forma LTM Period, eight of our products accounted for more than 57% of our revenue, with six of the eight products holding a leading global market position. During the Pro Forma LTM period, through our worldwide network of production facilities, we sold 48% of our volume in North America, 36% of our volume in Europe, and 16% of our volume in the emerging markets (7% in Latin America and 9% in Asia). Furthermore, we expect to increase the portion of our volume from the Americas and Asia with our recent capital investments. As a result of our leading market positions, attractive end-markets, and significant recent capital investments, we believe we are well positioned for significant growth over the coming years. In the Pro Forma LTM Period, we generated revenue of $1,110 million, Adjusted EBITDA of $234 million, and Adjusted EBITDA margin of over 21%. See “Prospectus Summary—Summary Historical Consolidated Financial Information” for a discussion and reconciliation of Adjusted EBITDA and Adjusted EBITDA margin.
Agriculture (28% of Pro Forma LTM Period Volumes)
The total market for agricultural chemicals is estimated at $49 billion, having grown by 7% per annum between 2005 and 2009, and by over 5% per annum between 2009 and 2011. According to the ADL Report, the market is projected to increase at approximately 6% per annum from 2012 to 2016. The top global producers in this market include Syngenta, Bayer, BASF, Dow, Monsanto and DuPont. We believe demand for agricultural chemicals will be driven by numerous factors, including the need for increased agricultural yields to serve a growing world population as arable surface area available for agricultural production is limited; rising disposable incomes among a growing middle class in emerging markets being spent on more high quality food; increased use of biofuels which is diverting more agriculture away from food supply; and desire among governments to increase food supply in order to limit domestic food price volatility.
We expect that increasing yield from existing land will require more productive plants, and crop protection products, such as fungicide, soil fumigation and plant growth regulators will be key components to achieving
75
Table of Contents
greater yield with minimal crop loss. We also expect demand for agricultural yields to drive growth in the market for herbicide systems, particularly in developing countries, albeit at a slower rate than certain other agricultural chemicals, and that this growth will be partially offset by increasingly commoditized pricing, as low cost producers in China and elsewhere enter the market. According to the ADL Report, on average, amines and their derivatives account for approximately 15% of the end product cost structure for those products.
In the Pro Forma LTM Period, products serving the agriculture end-market represented approximately 28% of our total volume. We serve this end-market through our Crop Protection segment, which produces active ingredients and formulated products that are used to control pests such as fungi, insects, worms and weeds that would detrimentally impact the health and productivity of useful crops. We also serve this end-market through our Functional Amines segment, which sells a variety of intermediate alkylamines that are used as building blocks or formulation aids in a variety of other agricultural chemicals.
Water Treatment (12% of Pro Forma LTM Period Volumes)
According to the ADL Report, the total market for water treatment chemicals is estimated at $24 billion in 2011 and is projected to increase at approximately 6% per annum from 2012 to 2016. The top global producers by sales in the water treatment industry include Ashland, BASF, Ecolab, GE Water, Kemira and SNF Florger. We believe demand for water treatment will continue to grow as increased water consumption will require greater sanitizing and higher water recycling rates to combat overall water scarcity. Key drivers of demand include the increasing scarcity of potable water and water used for agriculture and industry; rising urban populations, particularly in emerging markets such as China and India, which are placing greater stress on aging water treatment facilities; enhanced environmental standards across the globe; increasing demand from the expanding middle class for products that require higher water intensity in their production process, such as food; and an increasing backlog of undeveloped water treatment facilities, particularly in China, as governments try to undo much of the environmental degradation that resulted from their recent rapid economic expansion. According to the ADL Report, amines and their derivatives account for approximately 15% of the end product cost structure for water treatment products on average.
In the Pro Forma LTM Period, products serving the water treatment end-market represented approximately 12% of our total volume. We serve this end-market through our Specialty Amines segment, which mainly produces the building blocks for water sanitation chemicals and active water treatment ingredients. We produce advanced chemicals for use in preventing corrosion and scaling, processing in recycling facilities and sanitizing with agents to prevent microbial and algae proliferation, which will become increasingly important in the treatment of water around the world as sources of fresh water become increasingly scarce.
Personal & Home Care (9% of Pro Forma LTM Period Volumes)
According to the ADL Report, the total market for personal & home care is estimated at $200 billion in 2011, including $52 billion of functional ingredients, and is projected to increase at approximately 7% per annum from 2012 to 2016. Significant producers of personal & home care products include Colgate, Henkel, Kao, Lever, Procter & Gamble and Unilever. We believe the personal & home care industry will grow strongly over the near term driven by many factors, including increasing demand from emerging markets such as Asia, as purchasing power among a growing middle class in these regions continues to advance; product innovation designed to meet the diverse range of needs of different consumers; and an increased focus on environmental sustainability, which is driving new products to incorporate “green chemistry.” According to the ADL Report, amines and their derivatives account for less than 10% of the end product cost structure for products in the personal & home care end-market on average.
In the Pro Forma LTM Period, products serving the personal & home care end-market represented approximately 9% of our total volume. We serve this end-market through our Specialty Amines segment, which primarily produces building blocks for surfactants, key ingredients in the development of milder cleaning agents
76
Table of Contents
and aroma chemicals, as well as skin-sensitive product formulations such as baby shampoos and foam baths. We also produce intermediate alkylamines that constitute building blocks for surfactants used in other personal & home care products.
Animal Nutrition (13% of Pro Forma LTM Period Volumes)
According to the ADL Report, the total market for animal nutrition is estimated at $810 billion in 2011 and is projected to increase at approximately 5% per annum from 2012 to 2016. Important players in the animal nutrition end-market include ADM, Cargill, CP Group Thailand, New Hope Group China and Nutreco. We believe demand for animal nutrition will be driven by many factors, including increasing world population; global dietary habits shifting toward higher meat consumption, particularly white meat, as a result of rising incomes; increasing adoption of modern farming practices, particularly in Asia, leading to an increase in feed additive usage; and the desire among governments to increase food supply in order to limit domestic food price volatility and import dependency.
The animal nutrition end-market encompasses both compounded feed (often corn and soy byproducts from agricultural processing) and feed additives. Feed additives supplement the food for animals, enhancing conversion yields while positively contributing to animal health, contributing to higher overall productivity. One of the primary feed additives is choline chloride, and we expect the market for this additive to grow steadily over the near term. According to the ADL Report, on average, amines and their derivatives account for less than 1% of the end product cost structure for animal nutrition products.
In the Pro Forma LTM Period, products serving the animal nutrition end-market represented approximately 13% of our total volume. We serve this end-market mainly through our Specialty Amines segment, which mainly produces feed additives based on choline chloride, a vitamin commonly incorporated into feed for poultry and swine that helps achieve higher feed conversion yields while reducing animal morbidity. We also serve this end-market through our Functional Amines segment selling the amine used to produce feed additives as well as functional ingredients such as vitamins and amino acids and processing aids that facilitate the storage of animal feed.
Oil & Gas (5% of Pro Forma LTM Period Volumes)
According to the ADL Report, the total market for chemicals used in oil & gas exploration and production is estimated at $7.5 billion in 2011 and is projected to increase at approximately 8% per annum from 2012 to 2016. The top oil & gas service companies include Baker Hughes International, Halliburton, Schlumberger and Weatherford International. Chemicals used in the exploration and production of oil & gas include desulphurization solutions for absorbing and removing sulphur contaminants, consisting of blends of various amines, drilling muds containing various ingredients for the cooling and lubrication of drilling heads, dispersion of rock fragments and prevention of pressure blow-outs, and enhanced recovery systems consisting of complex surfactant blends for facilitating recovery of oil & gas in reservoirs. According to the ADL Report, amines and their derivatives account for approximately 4% of the end product cost structure for these oil & gas products, on average.
Demand for oil & gas exploration and production chemicals has grown steadily in recent years, and we expect that trend to continue, driven by increasing demand for oil & gas, particularly in rapidly growing emerging markets, such as China; rising energy prices; decreasing quality of oil & gas deposits; and increasing oil & gas prices, leading producers to seek minerals from more complex reservoirs and requiring additional chemical inputs for extraction, such as in the nascent shale gas fracturing market. We estimate that in 2011, global demand for choline chloride for fracturing was approximately 25 kt, and that up to 65% of natural gas wells drilled in the next decade will require hydraulic fracturing.
In the Pro Forma LTM Period, products serving the oil & gas exploration and production market represented approximately 5% of our total volume. We serve this end-market through our Specialty Amines segment.
77
Table of Contents
Our Company
We are the world’s largest pure play producer of alkylamines and alkylamine derivatives according to the ADL Report. Our products are used by our customers in the manufacturing of everyday products primarily for the agriculture, water treatment, personal & home care, animal nutrition and oil & gas end-markets. Our products provide these goods with a variety of ancillary characteristics required for optimal performance, such as neutralizing acidity, and removing contaminants. We have an extensive offering of differentiated value-added products that typically represent a small portion of our customers’ overall costs and are sold into diversified, global end-markets that benefit from favorable underlying economic and population growth trends. We currently operate in 19 countries with seven production facilities and, as of September 30, 2012, had an installed production capacity of 1,302 kt. According to the ADL Report, we hold the #1 or #2 market position globally in the vast majority of the chemicals we produce, including an approximately 50% and 75% capacity share of certain products, respectively, in North America and Europe. During the Pro Forma LTM Period, eight of our products accounted for more than 57% of our revenue, with six of the eight products holding a leading global market position. During the Pro Forma LTM period, through our worldwide network of production facilities, we sold 48% of our volume in North America, 36% of our volume in Europe, and 16% of our volume in the emerging markets (7% in Latin America and 9% in Asia). Furthermore, we expect to increase the portion of our volume from the Americas and Asia with our recent capital investments. As a result of our leading market positions, attractive end-markets, and significant recent capital investments, we believe we are well positioned for significant growth over the coming years. In the Pro Forma LTM Period, we generated revenue of $1,110 million, Adjusted EBITDA of $234 million, and Adjusted EBITDA margin of over 21%. See “Prospectus Summary—Summary Historical Consolidated Financial Information” for a discussion and reconciliation of Adjusted EBITDA and Adjusted EBITDA margin.
Alkylamines are organic compounds produced through the reaction of an alcohol with ammonia. The immediate results of these processes are the production of methylamines and higher alkylamines, which can then be further reacted with other chemicals to produce alkylamine derivatives. Our products are primarily used in the agriculture, water treatment, personal & home care, animal nutrition, pharmaceutical and oil & gas end-markets, which combined accounted for approximately 70% of our volume during the Pro Forma LTM Period. Our end-markets tend to be non-cyclical and benefit from strong underlying fundamentals such as increasing global population, urbanization of emerging markets and rising income levels.
We currently operate seven plants worldwide dedicated to the production of alkylamines and alkylamine derivatives, including two larger facilities in each of the United States and Europe that are among the world’s largest methylamine and higher alkylamines production facilities, a joint-venture facility with the MGC Group in China, and two other 100% Taminco-owned facilities in China.
We are also in the process of pursuing numerous growth projects to further bolster our global footprint and leverage our strategic advantages. Our currently budgeted future investments include significantly extending production capacity at our Pace, Florida methylamine facility by the end of 2014 and further development of other derivative capacity. In total, we have spent $116 million in growth capital expenditures over the past three years, which is more than we have spent in any similar historical period. We expect to realize significant growth in our financial results from these investments.
We are organized into three segments: Functional Amines, Specialty Amines, and Crop Protection.
78
Table of Contents
Our segments are organized as follows:
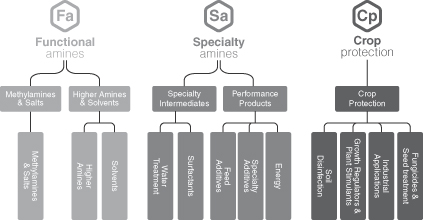
| • | Functional Amines. This segment serves the needs of external customers that use our alkylamines products as the integral element in their chemical processes for the production of formulated products applied in a variety of end-markets such as agriculture, personal & home care, animal nutrition, and oil & gas. Through this segment, we also produce basic amines, which are captively used as building blocks to produce our downstream derivatives through our Specialty Amines and Crop Protection segments, serving a variety of attractive, non-cyclical end-markets. Two of this segment’s products, DMA (water treatment and household cleaners) and MIPA (herbicides), contributed to more than 10% of our consolidated net sales. DMA accounted for 15%, 10% and 9% for the years ended December 31, 2009, 2010 and 2011, respectively. MIPA accounted for 10%, 10% and 9% for the years ended December 31, 2009, 2010 and 2011, respectively. Approximately 30% of the Functional Amines production is used internally and forms the basis of our vertically integrated model. In the Pro Forma LTM Period, the Functional Amines segment accounted for 50% of Adjusted EBITDA. |
| • | Specialty Amines. This segment sells alkylamine derivatives for use in the water treatment, personal & home care, oil & gas and animal nutrition end-markets, and specialty additives for use in the pharmaceutical, industrial coatings and metal working fluid end-markets. This segment is downstream from the Functional Amines segment and uses that segment’s production as one of its key raw materials. One of this segment’s products, DMAE (water treatment), contributed 11%, 12% and 11% to our consolidated net sales for the years ended December 31, 2009, 2010 and 2011, respectively. The Specialty Amines segment’s customers are typically large, multinational enterprises who are leading players in their industry. In the Pro Forma LTM Period, the Specialty Amines segment accounted for 33% of Adjusted EBITDA. |
| • | Crop Protection. This segment sells alkylamine derivatives, active ingredients and formulated products for use in the agriculture and crop protection end-markets. The majority of the segment’s customers range from multinational crop protection and agricultural enterprises to large local farms. In the Pro Forma LTM Period, the Crop Protection segment accounted for 17% of Adjusted EBITDA. |
Please see “Note 17—Segment Information” to our audited consolidated financial statements and unaudited condensed consolidated financial statements included elsewhere in this prospectus for financial information by segments and geography.
79
Table of Contents
Our Strengths
We believe the following competitive strengths, in addition to our industry leading alkylamine production technology, have been instrumental to our success and position us well for future growth and strong financial performance.
Serve strong end-markets with attractive global growth prospects
Our products are used by our customers in the manufacturing of everyday products primarily for the agriculture, water treatment, personal & home care, animal nutrition and oil & gas end-markets. Our products provide these goods with a variety of ancillary characteristics required for optimal performance, such as neutralizing acidity, and removing contaminants. Our products are generally sold into large end-markets with attractive global growth prospects. We develop products mainly for use in the agriculture, water treatment, personal & home care, animal nutrition, and oil & gas end-markets. These targeted end-markets, which have been relatively resistant to economic downturns, represent over $1.0 trillion in market value as of 2011 and are projected by ADL to grow by an average of 6% per year from 2012 to 2016. Specifically, ADL projects that the agriculture, water treatment, personal & home care, animal nutrition and oil & gas end-markets will grow by 6%, 6%, 7%, 5% and 8%, respectively, per annum from 2012 to 2016.
Our key earnings drivers are generally macroeconomic trends created through non-discretionary spending by industries and consumers. A steadily increasing world population, rising income levels (particularly in the emerging markets), increasing global urbanization and an aging global population are expected to help continue driving strong demand in our key end-markets. We believe we can achieve growth rates above these industry estimates as a result of our commitment to develop high value-add products alongside our blue-chip customers, our continued investment in very accretive capacity additions, and our demonstrated operational expertise that allows each new growth stage to be done more efficiently. In the Pro Forma LTM Period, approximately 70% of our volume was generated from these key end-markets and we expect that to increase over the next few years.
Market leader in global amines industry targeting niche markets with very few competitors
We focus exclusively on the production of alkylamines and alkylamine derivatives and have not entered into the production of other chemical products. We are the only amines producer that pursues this strategy and we believe it is a key differentiator of our success. According to the ADL Report, we are the world’s largest pure play producer of alkylamines and alkylamine derivatives, as we hold the #1 position in alkylamine and methylamine production in North America and the #2 position in alkylamine and methylamine production in Europe. We achieved these market positions due to our ongoing commitment to balance growing our profitability while achieving significant scale. We believe we have been a market leader in the alkylamines industry and its derivatives for our entire existence.
We benefit from long-standing relationships with blue-chip, industry-leading companies in each of our key end-markets, as well as from low customer churn (our average customer relationship among our top 10 customers is thirteen years). Some of our blue-chip customers include Arkema, Dow Agro Sciences, Procter & Gamble, SNF and Syngenta. We develop products alongside each of these key customers. Overall, we believe our market position provides us with a stable and flexible platform for profitable operation and positions us to capitalize on growth opportunities quickly. In addition, our customer base is diverse both in terms of industries and geographies, all of which contribute to protection in economically challenging environments.
We believe that our extensive expertise and technology, our existing investments in profitable, vertically integrated manufacturing facilities, and our current set of product registrations from environmental, health and safety regulatory authorities give us a significant advantage over our competitors and new entrants. We also find it advantageous that some of our competitors have chosen to enter into certain downstream products that we do not manufacture and that compete directly with their customers.
80
Table of Contents
Significant room for near-term growth due to recent capital investments
Our vertically integrated business model is one of our key strengths, differentiating us from almost all of our competitors. Through our vertical integration we gain significant operational efficiencies, which enhances the overall profitability of our products. As we have succeeded with this model in Europe, we recently completed our vertically integrated production model in the United States, which we believe ideally positions us to capture growth in several attractive end-markets, including oil & gas (driven by shale gas demand), water treatment, feed additives, and crop protection. These recent investments in derivative capacity in the United States (AAA, DIMLA, and DMAPA) have large growth potential. These investments increased our U.S. derivatives capacity by 11% and further distanced ourselves from the nearest competitor in each of these product lines.
In addition, as a result of our competitive cost position, recent capacity additions at our United States-based plants and our Latin America-based sales force, we believe we are well positioned to fully serve the Latin American market, which has limited local competition. On a relative basis, we do not believe our peers have this competitive advantage.
Going forward, there are a variety of accretive, global growth projects to further expand our footprint, product portfolio, and customer base. We will continue to evaluate these on a systematic basis with a strong focus on ensuring a rapid payback and sustained earnings stream. We have a dedicated group focused on evaluating these opportunities on a regular basis.
Demonstrated financial resilience through various economic environments
For the past several years, our revenue, gross profit and Adjusted EBITDA have been growing throughout various economic environments. Due to our resilient end-markets, diverse customer base and the integral nature of alkylamines and their derivatives to our customers, we are less vulnerable to economic cycles. In addition, we benefit from being able to grow sales volume with a limited addition of fixed costs as a result of our vertically integrated global production model. Also, we have relatively low maintenance capital expenditure requirements, which allow us to easily maintain high cash flow conversion rates in any economic environment.
As an example of our resilient end-markets, during the 2008 to 2009 economic downturn, our volume declined only 7%, compared to an average decline of 20% for the specialty chemical industry according to the ADL Report, and our Adjusted EBITDA grew 19% in that same time period. Similarly, our European originated sales continue to do well despite the challenging economic environment in Europe. For the quarter ended September 30, 2012, volumes were up 12% versus the comparable period in the previous year. We strongly believe that our end-markets will continue to grow in various economic environments given their resilient nature, which we believe makes us a unique specialty chemical company.
Ability to pass through raw material price increases
We believe one of the key reasons for our historical success is our ability to manage fluctuating raw material prices by passing through the majority of price changes to our customers through both CPT Contracts and through diligent management of pricing with customers. During the Pro Forma LTM Period, our top four raw materials (methanol, ethylene oxide, ammonia and acetone) accounted for 39% of our total cost of sales. Our main raw materials are readily available commodity chemicals. Approximately half of our total revenue for the Pro Forma LTM Period is generated from CPT Contracts.
We play an important role in our customers’ value chains (providing a variety of ancillary characteristics required for optimal performance, such as neutralizing acidity, and removing contaminants) but our products represent a relatively small percentage of our customers’ overall cost structures. Because of the value of our products, for the portion of sales that are not generated under CPT Contracts, we are often able to pass through raw material price increases to our customers through market-based sales contracts that are typically renegotiated
81
Table of Contents
quarterly. Positive market dynamics and our relative insulation from raw material price volatility have historically enabled us to maintain profitability in each of our segments. We have also deployed a strategic sourcing approach for critical raw materials, which, coupled with our CPT Contracts and market-based contracts, significantly mitigates the impact of raw material volatility on our margin. Going forward, we continue to evaluate the impact of raw materials on our business through a significant focus on mitigating volatility from raw material costs as new capacity additions come online.
Attractive product pipeline with significant value creation opportunities
We have a strong track record of identifying and exploiting growth opportunities for new applications of our existing products. We also have expertise in new product development and we are the preferred partner for many of our key customers to jointly develop new amine-based derivative products. Our current pipeline includes several products covering each of our key end-markets that we expect will reach the market in the next few years and represents significant incremental revenue opportunities. We have a suite of products in development that are nearing realization, such as the expected launch in mid-2013 of Tenaz, a proprietary formulation of bio available silicate that is used as a plant fortifier. Our research and development is focused on five key application areas: surfactants, water treatment, oil & gas, feed additives and crop protection. Our patent portfolio is actively managed and contains 78 patents as of September 30, 2012.
Past achievements in the Crop Protection segment include Banguard fungicide, used to control banana diseases, which was first introduced in Asia in 2009 and is being introduced into Central and Latin America. In the Specialty Amines segment, we have introduced formulations of MDEA for use in refineries and gas plants as solvents for sulfur and carbon dioxide extraction. We have also introduced a new feed additive, Taminizer C, in 2009, which is a new version of dry choline chloride that is very pure and concentrated, leading to transportation cost savings and higher food safety standards. We believe we are the most technologically advanced amines producer.
Well-positioned to continue exploiting fast growing emerging markets in partnership with blue-chip customer base
With manufacturing operations and sales operations in China, sales offices in several Latin American countries and manufacturing operations in North America which can serve Latin America cost effectively, we believe we have a strong platform for further growth in these regions. Our joint venture with the MGC Group in Nanjing provides us with a base for expanding high value-added amine derivative products in China in the coming years. According to the ADL Report, Brazil is one of the largest markets in the world for crop protection and herbicide systems, and our operations in the region are positioned towards serving that growing agriculture market. In addition, recent expansion at our U.S. operations provide us with fully-vertically integrated amine derivatives manufacturing facilities that will help meet demand for our higher value-added products in Latin America. We have a number of strong relationships as a trusted supplier to global industry leaders within our key developed end-markets. We will continue to leverage these relationships in order to grow alongside our customers in these and other emerging markets. We are focused on only pursuing geographical expansion that we believe will be highly accretive to Taminco, which we believe exists in a number of countries through new and existing customer relationships.
Industry leading margins and cash flow generation
We believe we have been maintaining industry leading margins and strong cash flow generation throughout economic cycles as a result of our low cost position, leadership role in niche markets, and scalable fixed cost structure. Our ability to mitigate raw material pricing fluctuations provides stability to our margins. Our EBITDA margin has averaged approximately 22% over the period from 2007 to 2011, compared to approximately 17.8% for our industry peers over the same period according to the ADL Report. As a testament to our competitive strength, our cash flow conversion, measured by EBITDA minus capital expenditures divided by EBITDA, has
82
Table of Contents
averaged 73% over the period from 2007 to 2011 compared to approximately 60% for our industry peers according to the ADL Report. Our cost structure and limited maintenance capital expenditures allows us to be very nimble in economically challenging environments.
Proven management and employee culture with meaningful employee equity ownership
We believe that our management team is among the deepest and most experienced in the chemical industry. On average, the tenure of our executive management team is 15 years with the Company and 18 years in the chemical industry. Our management team has been responsible for developing and executing our strategy that has generated consistent year-over-year sales and Adjusted EBITDA growth. We believe our employees have developed a unique culture in which each employee throughout the entire company is aligned, focused and holds each other accountable to achieve goals that drive value creation for all of our stakeholders. Our employee ownership pool is deep with approximately 42 individual employees owning equity in the Company. As of September 30, 2012, employees owned over 10% of the shares in our Company on a fully diluted basis before giving effect to this offering.
Our Strategy
Our long-term growth drivers revolve around our continued ability to work closely with market industry leaders and to further expand into emerging markets through the principal strategies outlined below.
Capitalize on key fundamental drivers of our end-markets
The primary end-markets we serve have strong exposure to numerous positive, non-cyclical macroeconomic trends. According to ADL, key factors, including a steadily increasing world population, a growing middle class in emerging markets, clean water scarcity, and enhanced oil & gas recovery techniques (especially driven by the shale gas demand in the United States), will continue to drive strong demand for agriculture, water treatment, personal & home care, animal nutrition and oil & gas products. ADL projects that the agriculture, water treatment, personal & home care, animal nutrition and oil & gas end-markets will grow by 6%, 6%, 7%, 5% and 8%, respectively, per annum from 2012 to 2016, or an average of 6%. We believe we are well positioned and intend to utilize our best-in-class business optimization and manufacturing processes to meet our customers’ increased supply needs in light of this anticipated growth in end-market demand.
Continue to partner with industry leaders to provide foundation for future growth
We currently have strong positions in each of our key end-markets, which we have achieved in part due to our strong customer relationships with leading global companies in each of those markets. A fundamental element of our strategy is to continue to work directly with our core customers to develop new products and new applications for our existing products that address their specific needs. In addition, we deploy a more customer-focused marketing approach, rather than a more traditional product-based approach. Our specialized sales force includes 29 professionals and six marketing managers with individual responsibility for particular end user markets in various regions. In addition, we employ approximately 35 other commercial professionals, including divisional managers, product managers and new business development specialists. We believe that a deeper understanding of customer needs will better enable our marketing professionals to identify future sources of demand for our products and, working in close cooperation with our research and development function, address that demand through product innovation. As a result, we believe our customer-focused approach will make us a more attractive partner and allow us to achieve greater penetration of our end-markets.
Examples of successful products we have developed with our customers include: (i) Amietol M201, a gas sweetening solution based on methylamines that helps with CO2 removal in natural gas plants and oil refineries, which we co-developed with Shell and (ii) Banguard, a formulation to cure a banana disease (Black Sikatoka), which we developed in partnership with Dole and Delmonte for use in the Philippines and is now rolling out in Latin America.
83
Table of Contents
Leverage platform to expand emerging market presence
We have strong, leading positions in our product markets in North America and Europe as a result of our commitment to strategic capital investments and selective acquisitions. We expect to leverage this success to capture a significant portion of our future growth in demand from Asia and Latin America. One of our strategic priorities is to position ourselves for profitable growth in these markets. We currently have two production facilities in China serving the animal nutrition end-market as well as a joint venture with the MGC Group to manufacture amines and amine derivatives. We plan to use our facilities, including our joint venture, as a platform for further expansion in Asia, including potentially in the fast-growing markets of Malaysia, Indonesia, India and Vietnam, and become a partner of choice for our customers in that region by leveraging our high-quality products, standards and technical expertise and moving closer to end users. We plan to capture global growth through our continuous investment in the U.S., which also serves as a platform for export to Latin America. In addition, our joint venture with the MGC group is expected to capture growth in Asia, primarily in China. We believe our technological and process knowledge should give us a significant advantage over our competitors in that region. As we grow in Asia, we are very focused on pursuing growth opportunities and selective acquisitions that are attractive from a margin profile.
In Latin America, we hold a strong market position in the agricultural chemicals, including crop protection and herbicides, that we sell and we seek to continue developing our presence in that region. We believe our competitive cost position in the United States and our network of sales offices in Latin America provide us with a strong platform for organic growth, and we will also aim to build strategic partnerships in Latin America and work with our global customers to develop business in that region. We will also continue to invest in our vertically integrated production capability in the United States and strategically pursue acquisitions, which we believe will facilitate further expansion of our derivative products for end-markets such as personal & home care and oil & gas in both North and South America.
Further expand our vertically integrated model
Our vertically integrated business model is one of our key strengths, differentiating us from almost all of our competitors. Our vertically integrated model focuses on both the alkylamine and their associated derivatives, versus just focusing on the alkylamines, which some of our competitors do. By having a fully integrated value-chain we are able to maintain a sustainable low cost position, benefiting from energy optimization, limited recycling needs, optimized logistics, and a limited number of well positioned world-scale production units.
A cornerstone of our expansion strategy is the extension of our vertically integrated business and production approach to all our operations around the world. We are already vertically integrated to a high degree in our European operations, in particular at our facility in Ghent and more recently in the United States, where we have completed new derivative units at our St. Gabriel and Pace facilities. We have announced significant methylamine capacity expansion at Pace to be completed by the end of 2014 that will further increase our leadership in North America.
Furthermore, through our joint venture with the MGC Group, we produce amine derivatives in China to pursue profitable growth downstream. Equally important to our performance is the continuous pursuit of production efficiencies and regular debottlenecking projects, which yield significant benefits in exchange for modest capital expenditures. As part of the philosophy behind our vertically integrated business model, we will continue to seek and implement best-in-class process optimization and efficiency gains within each of our facilities and apply that expertise throughout our global operations.
Continue to develop new processes, markets and products to enhance growth and profitability
Another key element of our strategy is to capitalize on our technological leadership to develop new processes, new products and new applications for our existing products. Working closely with our customers to better understand our end-markets and our customers’ individual requirements, we will seek to continue
84
Table of Contents
developing new products that increase the overall value of our customers’ offerings. We will also focus on providing more efficient alternatives to existing formulations, using a wide range of technologies including green technologies for our solvents, plant physiologies for our agriculture products and genomics screening for our feed additives. In addition, we will seek to maintain and improve our knowledge of market trends and developments in order to find new and innovative applications for our existing products. Our product pipeline currently includes developments which we expect to reach our customers in the next few years in each of our key end-markets. We are focused on developing products which provide improved performance and, in most cases, represent safer, non-toxic and “greener” alternatives to existing chemicals.
History and Development
Our business originated with the formation of Taminco N.V., a Belgian public limited liability company, through the carve-out from Union Chimique Belge (“UCB”) in 2003. We entered the U.S. market in 2006 through the acquisition of certain assets of Air Products Americas. Taminco Group N.V. was incorporated in 2007 as a vehicle to effect the acquisition by funds advised by the previous sponsor. On December 15, 2011, an affiliate of Apollo Global Management, LLC entered into a share purchase agreement pursuant to which Taminco Finance Corporation acquired all of the issued share capital of Taminco Group Holdings S.à r.l., the parent of Taminco Group NV, and its subsidiaries.
In addition to increasing our production capabilities through acquisitions, we have also selectively acquired various supply contracts to increase the capacity at each of our plants. In 2004, we acquired Air Products’ European methylamines and derivatives customer portfolio and in 2006, we acquired Akzo Nobel’s customer portfolio following the closure of their Delfzijl plant. In 2007, we acquired Arkema’s U.S. methylamine and higher alkylamines ethoxylated derivatives business, which added 15 new products to our portfolio for both methylamine and higher alkylamines. We also acquired patented technology relating to plant growth regulators for use in cereals and formulations of chlorocholine chloride from Mandops UK in 2007. In 2008, we opened a more energy efficient, fourth generation methylamine unit in Ghent. In 2009, we closed our Riverview facility as the first step in integrating our production in the United States, and in 2010, we completed the transfer of its equipment to our plant at St. Gabriel, Louisiana. Also in 2010, we launched a joint venture in Nanjing, China with the MGC Group and acquired the remaining shares in our Yixing facility from our joint venture partner at that facility, in order to take advantage of continuing growth opportunities in that market and the rest of Asia. Under the joint venture agreement with MGC Group, we have a 50% interest in the joint venture and are responsible, jointly along with MGC Group, for all activities related to the business of the joint venture. We also have shared power with MGC Group to appoint the board of directors and other management members. The term of the joint venture agreement is indefinite and may be terminated if circumstances arise where the operation of the joint venture is no longer practical, such as the revocation of its business license or occurrence of an event that materially discriminates against foreign investors. For additional information, see “Note 6—Other Investments” to our audited consolidated financial statements and “Note 3—Equity Method Investments” to our unaudited condensed consolidated financial statements included elsewhere in this prospectus.
Our Primary End-Markets
We are an amines company and our principal products consist of basic amines, including methylamines and higher alkylamines, solvents, specialty amine derivatives, and other intermediate chemicals. We evaluate our business in terms of the end-markets we serve with these chemicals, namely the agriculture, water treatment, personal & home care, animal nutrition and oil & gas end-markets, as well as various other niche markets. We divide our business into three primary segments, Functional Amines, Specialty Amines and Crop Protection. Our Functional Amines segment focuses on methylamines and salts, higher alkylamines and solvents. Our Specialty Amines segment focuses mainly on alkylamine derivatives for the water treatment, personal & home care, animal nutrition and oil & gas end-markets. Our Crop Protection segment focuses mainly on the agriculture and crop protection end-markets. All segments also serve certain additional niche industrial and other end-markets.
85
Table of Contents
Functional Amines
Segment Overview
Our Functional Amines segment produces amines through the reaction of primary alcohols with ammonia. The products generated from this reaction are methylamines and higher alklylamines, the key building blocks that are used in the production of specialty chemicals and active ingredients for an array of widely applicable chemical products in diversified end-markets. Our Functional Amines segment had net sales and Adjusted EBITDA of $515 million and $108 million, respectively, in the year ended December 31, 2011, and $505 million and $117 million, respectively, for the Pro Forma LTM Period.
Methylamines and Salts
We produce several basic amines, including methylamines (mono-, di- and tri-methylamine) and higher alkylamines that are used as intermediates in more than 200 different downstream applications across many growing end-markets. We are the largest global producer of methylamines, by installed capacity, with approximately 25% market share. Our amines businesses differ from region to region. In Europe, we manufacture methylamines but not higher alkylamines; in the United States, we manufacture both methylamines and higher alkylamines. We also have a presence in China through a joint venture producing methylamines and solvents.
Our products include MMA, DMA and TMA (methylamines) and DEA, TEA, MNPA, DIPA, N-Butyls and Iso-Butyls and Amylamines (higher alkylamines). We are the top global producer by volume of MMA, DMA, TMA, TEA and DEA. These products are available as gases and solutions, and are packaged in various forms including rail trucks and ISO tanks. Several of the products produced by our Functional Amines segment, including DMA, DMAc and TMA, have applications in the animal nutrition and agriculture end-markets and are sold to customers, including Dow, Nufarm, Balchem and Nutrinova. We are also developing new products through customer partnerships, as with Choline Agro Grade, a neutralizing amine that allows different herbicides to perform better together.
The customer base for our amines products is broad, comprising a wide array of customers, both large and small. In Europe and in the United States, our most significant competitor in methylamines is BASF. We enjoy very strong market positions in our amines business in all of the regions in which we operate. In Europe we have shifted our focus toward increased integrated production of higher-value specialty derivatives using our own amines, ensuring a secured outlet for our basic amines products through our integrated production model and partially/incrementally insulating our amines business from competition.
Solvents
Our Functional Amines segment produces a number of solvents for industrial and professional uses for a diverse set of customers in the global market, with a focus on Europe, including manufacturers of textile fibers, artificial leather and electronics, which include C-base, NMP, DMF and DMAc. Our overall solvents business is considerably smaller than our methylamines and higher amines business, and is decreasing in relative importance over time. We are estimated to be the fourth-largest global producer of DMF (a solvent used predominately in the production of artificial leather, electronics and acrylic fibers) by installed capacity, with a market share of approximately 9%, and have a market leading position in Europe. Our most significant competitor in the European solvents market is BASF. We do, however, compete with Chemanol and Chinese producers in the DMF market. We expect that demand for our solvents products will continue to grow.
Higher Alkylamines
We also supply higher alkylamines. The agriculture end-market is the largest single outlet for our products as they are primarily used in the formulation of major herbicide amines, including MIPA and MEA, key ingredients in glyphosate and atrazine. In the Pro Forma LTM Period, 28% of our total volume was attributable to products developed for the agriculture end-market.
86
Table of Contents
We are one of the leading global producers of MIPA by installed capacity and the largest global producer of MEA by installed capacity, which are used in the production of herbicides, and have a global market share by volume of approximately 30% in each product with only one primary competitor in the U.S. The market for MIPA in North America is relatively concentrated, consisting of large crop protection companies. We sell most of the MEA we produce to one such company, Syngenta, with which we have a long-standing relationship, and which we supply by pipeline from a facility neighboring our St. Gabriel plant. We compete with only one other major supplier of these products, U.S. Amines, and, to a lesser extent, with the increasing Chinese presence in the glyphosate market. Another large manufacturer, Oxea, mainly produces out of Europe. Our large and highly flexible manufacturing capabilities allow us to serve our customers in a timely manner and to accommodate seasonal demand effectively, despite the short growing season. Although alternatives to these products are available, our customers would be required to seek re-registration of the herbicides they produce in order to effect a substitution. For all of these reasons, our competitive position in the North American market is very strong. Our customer base consists of local affiliates of major international crop companies and local formulators.
Specialty Amines
Segment Overview
Our Specialty Amines segment produces amine derivatives and other chemical intermediates, the building blocks that are used in the production of specialty chemicals and active ingredients for the water treatment, personal & home care, oil & gas and animal nutrition end-markets, as well as for industrial and other applications. This segment, through our integration model, sources its raw materials from the Functional Amines segment and other chemical companies. Our Specialty Amines segment had net sales and Adjusted EBITDA of $460 million and $78 million, respectively, in the year ended December 31, 2011, and $468 million and $78 million, respectively, for the Pro Forma LTM Period.
We produce many specialty amine derivative products, and we expect the market for these products, in particular the water treatment, personal & home care and oil & gas end-markets, to experience additional growth over the near term. We believe we hold strong market positions in Europe, where we produce several specialty derivatives, and in the United States, where we have been actively investing in expanding our specialty derivatives capacity. Led by our DIMLA and DMAPA products, which are used in the production of detergents and other personal & home care products, we believe we can continue to reinforce our market position in the United States and therefore grow our business above the underlying market growth rate. In particular, we plan to capture growth in the water treatment and personal & home care end-markets in Latin America through our low-cost production facilities in the United States and significant sales force in Latin America. We also plan to expand our presence in China, introducing specialty derivatives as a way to counteract the growing competition among simpler amine products. In China, we are currently focused on growing our business and gaining market share. We plan to capitalize on ongoing investment in the new AAA unit with a planned capacity of 30 kt at our joint venture facility in Nanjing, targeting rapidly growing water treatment, personal & home care and oil & gas markets in Asia. We also plan to invest in developing a local platform in China for surfactant intermediates.
Originally in Europe, but for also for the last several years in North America, we have been increasingly focused on building an integrated production of higher-value specialty derivatives using our own amines, ensuring a secured outlet for our basic amines products through our integrated production model and partially insulate our amines business from competition. In total, we have spent $116 million in growth capital expenditures over the past three years to enhance our footprint and product mix.
Water Treatment
We serve the water treatment end-market primarily through specialty derivatives such as DMAE (Amietol M21), DEAE and DEHA, and other derivatives. Our products primarily include intermediates for coagulants and flocculants used to eliminate particles and impurities from liquids in industrial applications, to treat municipal
87
Table of Contents
wastewater and boiler water, and to prevent corrosion and scaling in closed circuits. We also supply basic methylamines, including MMA, DMA and TMA, and higher alkylamines, including DEA, TNPA and TNBA, to customers in the water treatment end-market. In the Pro Forma LTM Period, 12% of our total volume was derived from the water treatment end-market.
The key markets for water treatment products are the United States and Europe, where living standards are higher and regulatory requirements stricter. In both of these markets, the customer base for our water treatment intermediates is highly concentrated, comprising a small group of major chemicals manufacturers with whom we have long-standing and ongoing relationships, including Nalco, General Electric, SNF Floerger and Arkema. We and BASF are the two most significant suppliers of precursors for cationic monomers used in water treatment products with Taminco having a 45% market share. In addition, we are the largest global producer, by installed capacity, of DMAE, which is primarily used as a precursor for water treatment chemicals. Due to increasing demands placed upon global water supply systems, growth in demand for our water treatment products has historically been strong, proving resilient even under challenging macroeconomic conditions. Our products are used in the most efficient water treatment technologies, which we believe will increase their growth in emerging markets. Our presence in Asia is still limited but certain of our key customers are moving into Asia, and our objective is to grow with them and secure our position in that market. Water is becoming an increasingly scarce resource in many parts of the world as economies develop and populations grow. Demand for our water treatment products is expected to grow in line with the expected growth rate for the global water treatment products market of 4% per annum.
Personal & Home Care
We serve the personal & home care end-market primarily through a type of specialty amine derivative that is used as a chemical intermediate in the production of surfactants. These chemicals are key building blocks for use in the production of fabric softeners, detergents, biocides and personal & home care products such as shampoos. In the Pro Forma LTM Period, 9% of our total volume was attributable to the personal & home care industry.
Our two main derivative products are DMAPA, which is used in personal & home care products and DIMLA, which is used in the production of detergents and biocides. We are also developing next generation products, such as an “enabling” molecule that increases the compatibility of surfactants with different characteristics to create new products. We are one of the top three global producers of DIMLA, by installed capacity. We are the second-largest global producer of DMAPA, by installed capacity, following our U.S. capacity expansion. We are also expanding our DIMLA capacity in the United States, and a substantial portion of our new U.S. DMAPA capacity has already been committed. We are a growing participant in the two largest markets, the United States and Europe. The customer base for our surfactant products is relatively concentrated, dominated by larger consumer products companies such as Procter & Gamble, and chemical manufacturers such as Huntsman, Evonik Industries and Stepan. In Europe, we are one of three major producers of DMAPA, along with Albemarle, BASF and Huntsman, and compete with a number of producers of DIMLA, including Kao and Clariant. Our primary market is Europe, where we believe our position is strong as a result of our long-term stable relationships with certain key customers and bolstered by our position as a “neutral” player in the market, meaning that we do not produce the same products as our customers and therefore do not compete with them. Our presence in the North American surfactants market is growing, and we believe that we are well positioned to increase our share in this market by leveraging our global customer relationships. In 2011 we began operation of a new DMAPA unit at our St. Gabriel facility, and in June 2012 we began operation of a new DIMLA unit at our Pace facility. Growth in demand for our surfactant products is expected to outpace the expected growth rate of approximately 6% per annum for the global amine-based surfactants market, driven by increasing demand in Eastern Europe, Russia, the Middle East and the United States. We are also accompanying the move of certain large customers, such as SNF Floerger, into emerging markets.
88
Table of Contents
Oil & Gas
We serve the oil & gas end-market primarily through a range of basic methylamines, such as MMA, DMA and TMA, higher alkylamines, such as DEA, TEA, MNBA, DNBA and TNBA, and specialty derivatives, such as Amietol M12, ACT M12, MDEA and choline chloride, which are used in refineries and off-shore production facilities to remove impurities from crude oil and natural gas, principally, hydrogen sulphide and carbon dioxide, and referred to as oil & gas “sweeteners.” We also supply basic methylamines and higher alkylamines to customers in the oil & gas end-market for use in offshore oil & gas treatment as well as natural gas fracturing fluids such as choline chloride. In the Pro Forma LTM Period, 5% of our total volume was attributable to the oil & gas end-market.
Currently, Europe and the Middle East are the key markets for our oil & gas treatment chemicals, and there is a broad customer base for our products in both regions. Customers in these regions include Baker Petrolite, Ineos and Shell. The two markets differ in that European customers typically place recurrent orders with a chosen supplier, while customers in the Middle East generally supply a larger portion of their needs through tender processes. In Europe and the Middle East, we compete with a number of suppliers of alkylamine-based oil & gas treatment products, primarily large chemicals companies such as BASF, Dow, Huntsman, Balchem and Ineos. We are the second-largest global producer of MDEA, which is used in the manufacturing of fabric softners and in the oil & gas end-market, by installed capacity, with approximately 30% market share. We are the second-largest global producer of choline chloride, by installed capacity. We also have strong relationships with many key customers, and our alkylamines systems are based on an advanced technology that we believe is superior to traditional ethanolamines currently in use. In 2010, we commenced production of oil & gas treatment products including MDEA at our plant in St. Gabriel and we believe that this will enable us to establish a presence within this end-market in North America. Generally, the demand for oil & gas treatment products is increasing, both as a result of global growth in energy demand and because an increasing proportion of the oil & gas fields now being tapped have higher impurity levels than traditional oil & gas assets, requiring greater use of sweeteners. We are developing a new product, Amietol M43, to help these fields. In China, we are continuing to develop relationships with customers and increasing product penetration as the domestic oil & gas market develops. We will be able to serve this end-market from the AAA unit being constructed at our joint venture facility in Nanjing. Growth in demand for our products is expected to grow at a rate of approximately 6% per annum from 2012 to 2016 for the global oil & gas market.
Animal Nutrition
We serve the animal nutrition end-market primarily through choline chloride, a methylamine derivative also known as vitamin B4. Choline chloride is chiefly used in poultry feed, swine, fish and pet feed to allow better nutrient conversion and therefore reduce overall feed costs for the industry’s customers. In the Pro Forma LTM Period, 13% of our total volume was attributable to the animal nutrition end-market. Our strategy going forward is to develop safer substitutes, such as Taminizer C, for existing products, and to develop new products corresponding to unmet market demand, such as Taminizer D. Taminizer C is a patented solid form of concentrated choline chloride used in premium feed additives, containing almost double the amount of choline compared to other commonly used products. Taminizer D is a patented feed additive based on amines rather than choline chloride, which provides a more efficient metabolism of lipids, and therefore higher food conversion yields. It is currently undergoing field trials and has been approved by regulatory authorities in Brazil, Mexico and Europe.
We operate primarily in Europe, where our customers include MIAVIT and C.P. Group and our main competitors are Balchem, BASF and Be-Long. We expect the global market for choline chloride to grow steadily over the near term, and we believe we will be able to grow our volumes in line with or above the overall market. In addition, we believe our presence in China gives us a good platform to capitalize on increased demand for feed additives and expand our operations in that region. As a result, we expect our growth within this end-market will be driven by volume gains over the near term while we expect our gross profit margins to remain relatively flat or decline slightly due to potential declines in unit prices. In Asia, we plan to increase our market share through investment in existing production facilities.
89
Table of Contents
We are the second-largest producer of choline chloride by installed capacity, with a global market share of approximately 17% in 2011. Our European customer base consists of a number of major integrated meat companies that purchase choline chloride in liquid form and spray it directly onto poultry and swine feed. In Asia, our customers are primarily small, specialized feed mills, to whom we sell choline chloride applied to a carrier (typically corn cobs). Our competitors include a large number of local producers. The demand for our choline chloride is expected to grow in line with the expected growth rate of approximately 3% per annum for the global choline chloride market, driven by increasing demand for poultry as it forms a growing part of the diet in emerging markets.
Specialty Additives
Pharmaceuticals
Our products for the pharmaceuticals end-market include a variety of basic methylamines, higher alkylamines and solvents, as well as specialty amine derivative products, each with their own specific properties and particular market dynamics. These products include DMA HCl and 2-Pyrrolidone. We believe we have strong market positions in small niches within Europe. Our pharmaceuticals end-market customers include UCB, Merck and Sanofi Aventis.
Other Specialty Derivative Products
Our Specialty Amines segment also supplies a number of specialty products for use in coatings and metalworking fluids, fuel additives and polymer additives to manufacturers and other industrial customers. Among these products, our chemicals developed for use in coatings, Advantex, Vantex T, Amietol M21 and Amietol M12, and metalworking fluids are the largest by a significant margin. Chemicals used in fuel additives include specialty additives used to enhance the properties of fuel and chemicals used in polymer additives, Terminator P and AN/FMI. Polymer additives are special additives used to enhance the properties of plastics. Both our polymer additives and fuel additives product lines are in the early stages of development. The markets for these specialty products are relatively small compared to products for the other end-markets served by our Specialty Amines segment. Our customers for these products include Akzo Nobel, Valspar, BASF, 3M, Sachem, Dow and Kaltex Fibers. We believe the primary driver of growth in these end-markets will be continued product and application development. We expect to continue to grow volumes for these specialty products over the near term while maintaining the high margins these products generally achieve, although we do not expect these products to comprise a substantial portion of our total revenue in the near to medium term.
Crop Protection
Segment Overview
Our Crop Protection segment produces alkylamine and alkylamine derivatives that are used directly in the agriculture and crop protection end-markets. Our Crop Protection segment had net sales and Adjusted EBITDA of $148 million and $41 million, respectively, in the year ended December 31, 2011, and $138 million and $39 million, respectively, for the Pro Forma LTM Period. Demand for our crop protection products is generally increasing as a result of growth in world population and overall wealth, coupled with the growing scarcity of arable land per person, which we believe means crop protection products are becoming increasingly important. Advances in the bio-engineering of crops are also contributing to increased demand for some of our products. We are also developing new products through customer partnerships and internally, such as a “green,” plant strengthener undergoing proof of concept trials with certain customers.
We hold leading positions in niche markets for many of our crop protection products. One of the key issues facing producers of agricultural products is the need to obtain and maintain product registrations from environmental, health and safety authorities in order to be permitted to use and sell such products. Within many of our product markets, we are one of a small number of main producers holding the required registrations. In
90
Table of Contents
addition, registrations held by our customers in many cases depend on products we supply. In addition, we believe that we have established a reputation for advanced knowledge and strict quality control in our Crop Protection segment, which has contributed to the loyalty of our customer base.
We serve the agriculture end-market by supplying several crop protection products designed to increase the yields and longevity of crops, including fungicides, soil disinfectants, plant growth regulators and formulation of third party active ingredients.
We believe that crop protection represents a key growth area for the Company, and we expect to increase volumes at or above the overall market trend by introducing new products and broadening our overall product portfolio. In 2011, we committed a majority of our total group research and development expenditures to the development of crop protection products, and we expect that trend to continue over the near term. Within our crop protection product portfolio, we expect volume growth to be driven by growth in our fungicide and growth regulator lines. We believe we can achieve volume growth without reducing our overall gross profit margins, by successfully introducing new products, maintaining our pricing strategy and broadening the range of countries in which our existing products are registered. We are continuing to develop uses for our products on new crops such as avocados, with an added focus on tropical crops, such as rice and mangoes, to capture more emerging market demand.
Fungicides
We produce three fungicide end-products for use as fungicides or seed treatment agents: Thiram, Ziram and Ferbam. The key market for these products is Europe, where we are the largest producer of Ziram and Thiram. According to the ADL Report, we have a leading position in Ziram and Thiram production. Our primary competitors in the fungicides market are Bayer and United Phosphorus. We have product registrations for fungicides in numerous countries around the world. We sell fungicides to large multinationals, which then resell them under their own brands, as well as to national distributors of leading crop protection companies, which sell them under our brand names. These products have a broad range of applications for many different crops and a long track record in the market. Over time, our fungicides have faced competition from more selective fungicides, developed for use against a narrower range of diseases. As disease resistance to these more specialized products has increased, the need for effective alternatives has enabled our fungicides to gain additional market share. We are currently exploring new “non-residue” applications for our fungicides in crops with skins that are not consumed, such as bananas. These products are also used to protect plant seeds from soil fungal disease during the early germination phase, which is achieved by coating the seed with a special form of the fungicide before planting. We expect the market for these products to grow broadly in line with the expected growth rate for the global crop protection market of 4% per annum, provided that we have all of the required registrations.
Soil Fumigation
Our soil fumigation products comprise two active ingredients, metam sodium and metam potassium, which are used prior to planting or sowing in order to clean soil of bacteria, weed seeds and nematodes, primarily in connection with growing high value fruit and vegetable crops, such as strawberries. We have product registrations for soil disinfectants in numerous countries around the world. The key markets for these products are North America and Europe. We sell soil fumigation products to a broad range of customers, both directly and through distributors of leading crop protection companies. We face a relatively limited range of competitors, two in Europe, Lainco and FMC Foret, and two large producers in North America, TKI and Amvac. We believe we are the largest global producer, by installed capacity, of metam sodium, with market share of approximately 40%, and our primary customers include Certis and Simplot. We currently sell our soil fumigation products in Europe under product registrations, which extend to 2014, and are in the process of seeking extensions for a further 10 years. Demand for our soil fumigation products is expected to grow in line with the expected growth rate for the global crop protection market of 4% per annum, provided that we have all of the required registrations.
91
Table of Contents
Formulations
Our formulations products comprise free formulation Water Dispersible Granules (“WDG”), a specific technique that we use to formulate third parties’ active ingredients. Each of the regions in which we operate is a key market for our formulations products, which are shipped globally from our production facilities in Ghent. Our customer base is highly concentrated and consists of crop protection companies seeking high-quality formulation capacity. We compete with a limited number of large formulations producers, as well as with a broader range of manufacturers who have a lower capacity and less advanced technology than ours. We have developed our own technology, which we allow crop protection companies to globally access through tolling agreements. Demand for our products is driven by a number of large companies willing to enter into tolling agreements, which has shifted volumes in our favor as manufacturers seek a technologically-advanced player with the capacity to provide high volumes of product and a willingness to share its resources through tolling arrangements. Demand for our formulations products is expected to grow in line with the expected growth rate for the global crop protection market of 4% per annum, provided that we have all of the required registrations.
Plant Growth Regulators
Our plant growth regulators comprise products such as chlormequat chloride formulations, which regulate plant hormones to strengthen root systems and stems in cereals. These products include CCC, C5, Adjust, Barlequat, Stimul, Bettaquat, Tyran/Regus and Desikote. We acquired this line of products from our Mandops acquisition, but we are expanding it with several products currently in the development phase, focusing on high-margin niches. We have product registrations for plant growth regulators in numerous countries around the world. The key market for these products is Europe, where we have a strong position. Our customer base is concentrated and consists of major crop protection companies. Competition is relatively concentrated, with two other companies, BASF and Nufarm, holding significant market positions. We participate in an industry group, the European Task Force, whose members share the costs and benefits of obtaining product registrations in this area. Demand for plant growth regulators is expected to grow above the expected growth rate for the general crop protection market of 4% per annum due to an increase in the development of specialty formulations, provided that we have all of the required registrations.
Industrial Applications
Our Crop Protection segment also produces biocides that serve a variety of industrial uses as well as rubber chemicals. These products are produced alongside our crop protection products within our Crop Protection segment because of their similar chemical properties.
Our biocides are used in industrial processes to protect products, such as sugar, paper and leather, from bacterial erosion. In addition, our biocides are used to treat cooling water. Our rubber chemicals are used in niche plastics or rubber markets and include, for example, vulcanization accelerators used to solidify rubber on a molecular level. The key market for our biocide and rubber chemicals products is Europe. We sell biocides primarily to a relatively concentrated customer group, consisting of companies that provide industrial water treatment services to large manufacturers. We have relatively few competitors, and product registrations significantly support our strong competitive position. We are the leading global producer, by volume, of Thiram, a key product in crop protection fungicide and the biocides and rubber chemicals group. We sell rubber chemicals to a relatively concentrated group comprised of major rubber producers, such as manufacturers of tires and belts. Competition in this market consists primarily of imports from Asia. Following expected near-term recovery, demand for both biocides and rubber chemicals is expected to grow thereafter in line with GDP in each of our key regions where the products are sold.
92
Table of Contents
Our Operations
Integrated Production Model
A key strength of our business is our integrated production model, which involves using the methylamines and higher alkylamines manufactured in a given plant within the same facility as inputs in manufacturing derivatives. This enables us to lower costs through heat and steam recycling within the facilities, and to redirect resources to the manufacture of those derivatives for which demand is highest. In addition, we have selectively chosen not to enter into certain downstream products that would directly compete with our key customers, which we believe is a competitive advantage. Our decision to not enter into certain downstream end-markets that compete with our customers and our specialization in amines and their derivatives are the reasons we believe we are the chosen partner for the largest and fastest growing companies in the industry.
The following chart illustrates our integrated production model:
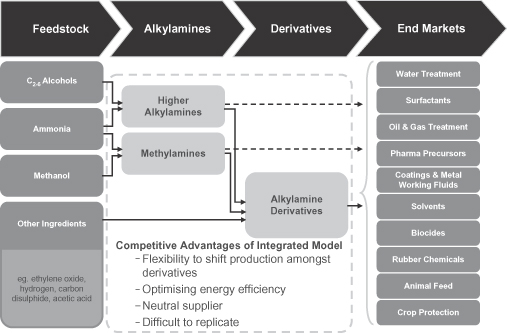
Research and Product Development
In addition to growing through acquisitions, we have also experienced significant growth in revenue and Adjusted EBITDA from organic growth in the end-markets we serve, as well as from the introduction of new products.
Research
Our research and development department focuses on product development within our key end-markets, and improving existing processes, clean technologies and energy efficiency. We operate a well-equipped lab and pilot unit, and we employ 34 full-time employees, including PhDs, lab and pilot technicians and business developers, located in Ghent. We pursue research and development according to an open innovation model, meaning that we develop products both on a stand-alone basis and in partnership with several departments of the Universities of Ghent and Leuven. We also have partnerships with the University of Prague and the University of Rostock. In 2009, 2010 and 2011, our research and development expenditures amounted to approximately $12 million, $13 million and $12 million, respectively.
93
Table of Contents
Past achievements of the department include the development of processes allowing feedstock flexibility for some of our existing products. We also improved our Thiram production process by making it cleaner and lower-cost by using an oxygen-based, low-waste process, and we believe we remain the sole producer in the world to use this production methodology.
Technology
In addition to our efforts on growth projects and improving plant efficiency, our engineering department has also pursued energy initiatives that have generated significant energy savings.
Examples include our energy-efficient, fourth-generation methylamine plant in Ghent on which we began operating in 2008, leading to approximately 50% primary energy savings compared to the previous unit with the same product mix. In 2009, we initiated a new cogeneration unit at Ghent, which produces highly efficient energy and steam and that has led to additional energy savings and a reduction in carbon dioxide emissions.
Product Development
The product development group is responsible for the development of both new and existing products. The group also provides valuable market, product and competitor intelligence to assist us in making strategic acquisitions. The team works closely with the marketing, production and engineering departments to align the objectives of product development with our general business objectives. Every new project is assigned a steering committee, which includes representatives from each of these departments and adopts a goal-oriented approach to product development. The average timeline for product development from conception to execution is three to five years.
Past achievements include the Banguard42 SC fungicide, used as an aerial spray to control certain banana diseases and the new feed additive Taminzer C, a new version of dry choline chloride that is very pure and concentrated, which results in transportation cost savings and has a unique micro-granular structure that allows it to mix well with other chemicals. The development pipeline currently includes projects within each segment. Within the Functional Amines segment, we are focused on the development of green solvents from renewable raw materials, alkylamine-based surfactants and, enhanced performance molecules for gas sweetening. Within the Specialty Amines segment, we are focused on developing products for the water treatment, personal & home care, oil & gas and feed additives end-markets. Within the Crop Protection segment, we are focused on plant physiologics, developing sustainable products that help plants overcome diseases (curative) or stimulate the plant’s strength (preventive) to become less vulnerable to pests, drought stress, salinity and other extreme weather conditions. Our other area of focus is pre- and post-harvest management, which includes improvement of the conservation of crops to overcome yield losses due to exposure to adverse weather conditions (pre-harvest), and the interruption of natural ripening or decaying processes by either a physical barrier or by triggering the reverse mechanisms of the plant (post-harvest).
Intellectual Property
We currently have 78 patents issued in various jurisdictions worldwide, covering production processes for fatty alkylamines and specialty alkylamine applications in coatings and metal working fluids, as well as new formulations for plant protection, plant biomodulators and feed additives. We have developed some of this intellectual property internally in our state of the art laboratory and pilot unit in Ghent, and have also added to our intellectual property portfolio through the Air Products, Arkema and Mandops acquisitions. The technologies in the research and development pipeline constitute significant innovations, and we strive to protect them all with patents. We currently have 153 pending patent applications relating both to products still in the development phase, including plant protection agents and feed additive products, and products and applications that are already on the market, such as basic and specialty higher alkylamines. We have pending patent applications in the United States, Canada, Brazil, Mexico, Japan, China, Korea and the European Union. In cases where we
94
Table of Contents
collaborate with universities, we have contracts in place which will give us full ownership of any intellectual property developed in the collaboration, in exchange for a fixed amount of royalties, and other compensation. In addition to patents, we have over 69 brand names and logos protected as registered trademarks, including the TAMINCO MOLECULES brand name and logo as well as names for individual products such as AMIETOL, GRANUFLO, METAM CL, METAM KLR, TAMINIZER and ZIRAM GRANUFLO.
Environmental, Health and Safety Matters
We and our operations and facilities are subject to extensive federal, state, local and foreign environmental, health and safety laws and regulations, including those governing pollution; protection of the environment; licenses and permits; air emissions; greenhouse gas emissions; energy efficiency; water supply, use and discharges; construction and operation of sites; the use, generation, handling, transport, treatment, recycling, presence, release and threatened release, management, storage and disposal of and exposure to hazardous substances, materials or waste; public health and safety and the health and safety of our employees; chemical plant security; product safety, registration, and authorization; noise, odor, mold, dust and nuisance; the investigation and remediation of contaminated soil and groundwater; the protection and restoration of plants, wildlife and natural resources; and cultural and historic resources, land use and other similar matters as well as numerous related reporting and record keeping requirements. Governmental authorities have the power to enforce compliance with their regulations and violators of environmental, health and safety laws may be subject to civil, criminal and administrative penalties, injunctions or both. In addition, private lawsuits for personal injury, property damage, diminution in value or similar claims may be initiated as a result of our operations. Environmental, health and safety laws and regulations, and the interpretation or enforcement thereof, are subject to change and may become more stringent in the future which may result in substantial future costs or capital or operating expenses. We cannot estimate the impact of increased and more stringent regulation on our operations, future capital expenditure requirements or the cost of compliance.
Chemical Product Registration Requirements. We must comply with regulations related to the testing, manufacturing, labeling, registration and safety analysis of our products in order to distribute many of our products, including, for example, in the U.S., the federal Toxic Substances Control Act, federal Insecticide, Fungicide, and Rodenticide Act and U.S. state and local pesticide laws, and in the European Union, the Regulation on Registration, Evaluation, Authorization and Restriction of Chemical Substances (“REACH”). Currently, three of our products are classified under REACH as carcinogenic, mutagenic or toxic to reproduction (“CMR”). As a result of this CMR classification, these products may be subject to restrictions in other jurisdictions, may require additional authorization or may be substituted in the future by other products. In addition, our products NMP and DMAC are each listed as a Substance of Very High Concern (“SVHC”) under REACH and certain of our other products may be listed in the future. This designation may require us to apply for the European Chemical Agency’s authorization to continue to use or place these substances on the market. Alternatively, the European Commission could instead impose marketing and use restrictions under REACH or other E.U. directives to address risks posed by an SVHC.
Also in the E. U., plant protection products require approval under Article 28 of Regulation 1107/2009 (the “EU PPPR”) by each Member State where they are sold. Other of our products must have E.U. level approval pursuant to the Biocidal Product Regulation (EU) No. 528/2012 (the “EU BPR”) concerning the placing of biocidal products on the market in order for us to market and sell them for particular uses. We are currently seeking European Commission authorization pursuant to the EU BPR for two of our products to be marketed as biocidal products, which as of January 2013, were not yet permitted. In addition, as existing authorizations under the EU PPPR and EU BPR expire, we may be unable to obtain reauthorizations for such products. In such case, we would be unable to market and sell any such plant protection or biocidal product not reauthorized in the E.U. going forward.
Air Emissions. The U.S. federal Clean Air Act (the “CAA”) and comparable U.S. state and foreign statutes and regulations, regulate emissions of various air pollutants and contaminants into the air. Certain of the CAA’s
95
Table of Contents
regulatory programs are the subject of ongoing review and/or are subject to ongoing litigation, such as the rules establishing new Maximum Achievable Control Technology for industrial boilers, and significant emissions control expenditures may be required to meet these current and emerging standards. Regulatory agencies can also impose administrative, civil and criminal penalties for non-compliance with air permits or other legal requirements regarding air emissions. In addition, some states do, and further states may, choose to set more stringent air emissions rules than those in the CAA.
There has been a broad range of proposed or promulgated state, national and international laws focusing on greenhouse gas (“GHG”) reductions. In the U.S., the Environmental Protection Agency (“EPA”) has promulgated federal GHG regulations under the CAA affecting certain sources. In addition, a number of state, local and regional GHG initiatives are also being developed or are already in place. In the European Union, implementation of the Kyoto Protocol requirements regarding GHG emission reductions consists of energy efficiency regulations, carbon dioxide emissions allowances trading and renewable energy requirements.
Waste Management. Our operations are subject to statutes and regulations addressing the remediation, removal, treatment, storage, disposal, remediation and transportation of solid and hazardous wastes and hazardous substances. In the U.S., the Comprehensive Environmental Response, Compensation and Liability Act of 1980, as amended, (“CERCLA”), also known as the “Superfund” law, and comparable state laws, generally impose joint, strict and several liability for costs of investigation and remediation, natural resources damages, and certain health studies, on potentially responsible parties (“PRPs”). All such PRPs (or any one of them) can be required to bear all of such costs regardless of fault, the legality of the original disposal or ownership of the disposal site. Accordingly, we may become subject to liability under CERCLA for cleanup costs or investigation or clean up obligations or related third-party claims in connection with releases of hazardous substances at or from our current or former sites or offsite waste disposal facilities, including those caused by predecessors or relating to divested properties or operations. The Federal Resource Conservation and Recovery Act, as amended, (“RCRA”) and comparable state laws regulate the treatment, storage, disposal, remediation and transportation of solid and hazardous wastes by imposing management requirements on generators and transporters of such wastes and on the owners and operators of treatment, storage and disposal facilities. It is possible that our operations may generate wastes that are subject to RCRA and comparable state statutes.
We are or may be required to comply with a number of additional foreign, federal, state and local environmental, health, safety and similar laws and regulations in addition to those discussed above, including those addressing discharges to surface and groundwater, emergency planning, chemical plant security, notice to governmental authorities, and occupational health and safety.
We have incurred and expect to continue to incur significant costs to maintain compliance with environmental, health and safety laws and regulations. We expect to incur approximately $11.5 million in capital expenditures relating to environmental, health and safety regulations in 2012. We estimate that our capital expenditures relating to environmental, health and safety regulations will be $18.5 million in 2013 and $8-$14 million per year through 2016; however, these estimates are subject to change given the uncertainty of future environmental, health and safety laws and regulations and the interpretation and enforcement thereof, as further described in this prospectus. Our environmental capital expenditure plans cover, among other things, the currently expected costs associated with known permit requirements relating to plant improvements.
Contamination and Hazardous Substance Risks
Certain U.S. and foreign environmental laws (including CERCLA discussed above) assess liability on current or previous owners or operators of real property for the cost of removal or remediation of hazardous substances. Contamination has been identified at several of our properties, including our Ghent, Leuna, Yixing, and Camaçari, Bahia, Brazil sites. We are, however, the beneficiary of certain environmental indemnities (including an indemnity contained in a governmental order) and contractual obligations of third parties received in connection with certain past transactions. Pursuant to some of these indemnities and obligations, third parties
96
Table of Contents
are currently conducting remediation at our Ghent and Leuna sites, respectively. There is currently no indemnification coverage applicable to the Yixing or Camaçari, Bahia, Brazil sites. There can be no assurances that these and the other third parties will be able to or will otherwise agree to continue to perform under these indemnities or obligations, or that these indemnities or obligations, as drafted, will cover other remedial obligations at these or other sites that may arise in the future.
In addition to cleanup obligations, we could also be held liable for any and all consequences arising out of human exposure to hazardous substances or other environmental damage, which liability may not be covered by the above described indemnities or insurance we may have.
Environmental Reserves, Asset Retirement Obligations and Financial Assurance
Following our decision in August 2011 to close our production facility located in Camaçari, Bahia, Brazil, Brazilian authorities required us to conduct environmental sampling and analysis at the site, which identified some localized soil contamination. The estimated cost to remediate the identified contamination is less than $1 million which is accrued for on the balance sheet.
We have an asset retirement obligation (“ARO”) relating to the future closure of our Pace site at the end of our long-term lease in 2056. The lease provides that at the end of the term or upon earlier termination, we shall, among other obligations, return the premises in the condition in which we agreed in the lease to maintain them, subject to normal wear and tear, and remove certain improvements to the premises.
We maintain a letter of credit in the amount of $1,116,937 for closure and post-closure care of solid waste sludge impoundments under RCRA at our plant in St. Gabriel, Louisiana.
Workplace Health and Safety
We are committed to manufacturing safe products and achieving a safe workplace. Our Quality, Safety, Health and Environment department specializes in the health and safety aspects of our production. To protect employees, we have established health and safety policies, programs and processes at all our manufacturing sites, including the creation of a global best practice exchange program that seeks to optimize our safety policies and procedures. Our safety management is founded on safe design of production processes, governed by hazard and operability analysis (“HAZOP”) and layer of protection analysis (“LOPA”) techniques to analyze safety hazards in the operation of chemical plants. Likewise, all process changes are governed by “management of change” procedures which are based on guidelines to manage mechanical or operational changes in chemical plants. An external health and safety audit is performed at each of our plants on a yearly basis, in accordance with local health and safety standards. In addition, we have an internal health and safety audit system, with an internal committee that reports on health and safety issues on a monthly basis on each of our seven manufacturing plants.
Raw Materials
Our key raw materials are methanol, ethylene oxide, ammonia and acetone. The main raw materials required for the production of methylamines and higher alkylamines are ammonia, methanol and acetone. The key raw materials used in the production of derivative products include ethylene oxide, acrylonitrile and acetic acid, in combination with methylamines and higher alkylamines. All of our main raw materials are readily available commodity chemicals, and we purchase them in relatively low volumes compared to total global capacity. Specifically, we source a significant portion of our methanol requirements through a long term contract. We have a secure supply of key raw materials, which are provided by truck, railcar, barge and pipeline from a relatively limited number of suppliers. Our key sources of energy are electricity, steam and natural gas. All of our energy is readily available and supplied by local producers. As we engage in CPT Contracts for approximately 50% of revenues for the Pro Forma LTM Period, we can largely pass raw material price increase through to customers. For information on how raw material and energy costs influence our results of operations, see “Management’s Discussion and Analysis of Financial Condition and Results of Operations—Key Drivers of Our Business—Raw Materials.”
97
Table of Contents
Our Production Facilities and Properties
Total Production Capacity by Plant Facility as of September 30, 2012 (in kT)
| Methylamines | Derivatives | Higher Alkylamines |
Taminco | |||||||||||||
| Pace |
145 | 50 | 30 | 225 | ||||||||||||
| St. Gabriel |
— | 80 | 140 | 220 | ||||||||||||
|
|
|
|
|
|
|
|
|
|||||||||
| America |
145 | 130 | 170 | 445 | ||||||||||||
| Shanghai |
— | 6 | — | 6 | ||||||||||||
| Yixing |
— | 15 | — | 15 | ||||||||||||
| Nanjing |
35 | 83 | — | 118 | ||||||||||||
|
|
|
|
|
|
|
|
|
|||||||||
| Asia |
35 | 104 | — | 139 | ||||||||||||
|
|
|
|
|
|
|
|
|
|||||||||
| Ghent |
90 | 438 | — | 528 | ||||||||||||
| Leuna |
90 | 100 | — | 190 | ||||||||||||
|
|
|
|
|
|
|
|
|
|||||||||
| Europe |
180 | 538 | — | 718 | ||||||||||||
| Total |
360 | 772 | 170 | 1,302 | ||||||||||||
|
|
|
|
|
|
|
|
|
|||||||||
We currently have seven plants worldwide dedicated to the production of alkylamines and derivatives, consisting of two larger facilities in each of the United States (Pace, Florida and St. Gabriel, Louisiana) and Europe (Ghent, Belgium and Leuna, Germany), a joint venture facility with MGC Group (Nanjing, China) and two other facilities in China (Fengxian and Yixing, China). We have a total annual global production capacity of approximately 1,302 kt, with capacity in North America, Asia and Europe at 445 kt, 139 kt and 718 kt, respectively. Each plant is a large complex, housing alkylamine processing areas in open air chemical production units, storage tank farms, loading areas, wastewater treatment units, a control room and administrative unit, and rail and road infrastructure.
A key element of our strategy is the integrated production model, through which methylamines and higher alkylamines manufactured in a given plant are used within the same facility as a raw material in manufacturing derivatives. This enables us to lower costs through heat and steam recycling within the facilities and to direct resources to the manufacture of key amines and derivatives. Currently, Ghent is our most integrated plant, producing both methylamines and methylamine derivative products. We are currently in the process of integrating our other key plants, including both energy and production integration. In 2010, the St. Gabriel plant was substantially expanded in order to manufacture three derivative products, including basic AAA, specialty AAA and DEHA. Generally, our plants are designed and equipped as stand-alone facilities, sourcing raw materials and supplying customers within the regions in which they are located. This is a reflection of the nature of methylamines, which are volatile substances requiring special care and involving high costs to transport. Our plants are strategically located near ports or within existing chemical complexes to facilitate the supply of raw materials. Over time, we have built significant logistical expertise, transporting 150 different products, from bulk gaseous alkylamines to liquids, to packed materials, to 85 different countries.
In addition to the production facilities discussed above, we have corporate offices in Allentown Pennsylvania and Ghent, Belgium. We lease our corporate headquarters offices at Two Windsor Plaza, Suite 411, 7540 Windsor Drive, Allentown, Pennsylvania 18195. We own our Belgian corporate offices located at Pantserschipstraat 207, 9000 Ghent, Belgium and lease additional corporate offices at Guldensporenpark 82, 9820 Merelbeke (Ghent), Belgium.
98
Table of Contents
Marketing and Sales
Our business is organized into business units focused on a particular end use to cater directly to existing customers and easily identify new opportunities to expand. As of September 30, 2012, our global specialized sales force consisted of 29 sales people in 19 countries and 20 sales offices, each with individual responsibility for a particular end-use sector or region in which we operate and the customers within those sectors or regions. The sales force closely monitors market appetite for our products and relays the information to the Global Marketing Manager, who acts as an intermediate between the sales force and our research and development department. The Global Marketing Manager tracks market trends and identifies new opportunities, and then communicates his findings to two key persons: the Regional Product Manager, who adjusts production of products that are in high demand to ensure a consistent supply and finds new uses for existing products, and the Global Business Developer who adjusts or develops formulations to match newly identified uses or opportunities for our products. In this manner, the Global Marketing Manager directs the sales force and also communicates new opportunities to the research and development and engineering departments to focus research and adjust formulations in the manufacture of products.
Our customers are typically producers of derivative products that require alkylamines or producers of end products that require alkylamine derivatives. For the Pro Forma LTM Period, our top 10 customers accounted for approximately 37% of our revenue. For more information, please see “Management’s Discussion and Analysis of Financial Condition and Results of Operation—Key Drivers of Our Business.” The majority of our top 10 customers have contracts with more than one business unit serving different end-markets, and all have multiple contracts for different products. In addition, the stability of our revenue stream is further enhanced by the longer-term nature of our contracts, which have an average duration of two to five years, and a lack of customer concentration, as none of our customers account for more than 7% of revenue in the Pro Forma LTM Period.
Insurance
We have obtained insurance for our operations, which we believe is broadly in line with that of similar companies in the industry. Through a number of international and local insurers, we have insurance policies relating to our liability for death or injury to employees, contamination and other environmental risks, losses relating to our assets, transportation of our products, certain aspects of business interruption and product and operational accountability. Many of our insurers visit our facilities on a regular basis to audit our facilities and procedures. Over the last six years, our insurance premiums have decreased due to favorable insurance markets and appraisers’ increasing understanding of our business. However, our insurance does not cover every potential risk associated with our business or for which we may otherwise be liable, as it is not possible for companies within the industry to obtain meaningful coverage at reasonable rates for certain types of environmental hazards. For more information, see “Risk Factors—Risks Relating to Our Industry—Our insurance policies may not cover, or fully cover, us against natural disasters, global conflicts, environmental risk or the inherent hazards of our operations and products.”
Information Technology
Our core critical business systems are Microsoft products, such as Server products, Office and Windows, and the Systems, Applications and Products (“SAP”) software used for our commercial activities, including sales and marketing, finance, purchasing, plant maintenance and reporting. The SAP software system provides full financial reporting and integration among the logistics processes across our global operations. Our plants in North America, Europe and Asia run on the SAP system. We currently have several full-time, external SAP consultants on site at our plant in Ghent and strong internal knowledge in each of our plants. Furthermore, we have taken appropriate measures to secure our systems and data by using market standard IT security capability. We have a centralized back-up data storage facility at our plant in Ghent, as well as business continuity plans. We have not had any significant IT problems in the past and, when we have encountered difficulty, recovery has been smooth and rapid.
99
Table of Contents
Competition
We believe that our extensive expertise and technology, our existing investments in profitable, vertically integrated manufacturing facilities, and our current set of product registrations from environmental, health and safety regulatory authorities give us a significant advantage over our competitors and new entrants. We also find it advantageous that some of our competitors have chosen to enter into certain downstream products that we do not manufacture and that compete directly with their customers.
Over the past decade, producers in the alkylamine industry that compete in our geographies have consolidated significantly. Key consolidation events include Air Product’s UK closure of a 50 kt production line in 2004, Chinook Canada’s closure of a 68 kt production line in 2004 and sale of contracts to DuPont, our purchase of Air Product’s North American and Latin American amines business in 2006, Akzo Nobel’s Netherlands closure of a 22 kt production line in 2006 and sale of contracts to us and Balchem’s purchase of Akzo Nobel’s 18 kt Italian operations in 2007.
The largest alkylamine building block product by volume is methylamines, followed by higher alkylamines. We believe consumption of methylamines accounted for approximately 74% of global consumption of alkylamines by volume and that higher alkylamines made up the remainder of global consumption. The three producers of methylamines in North America are Taminco, DuPont and BASF, with Taminco having the largest share of production capacity at 49% in 2011 and DuPont having the next largest share. The two producers of higher alkylamines in North America are Taminco and U.S. Amines, with Taminco’s share of production capacity at 75% in 2011. The European methylamine producers are Taminco, BASF, Balchem and CEPSA, with Taminco having the largest share of European production capacity at 52% and BASF having the majority of the remaining capacity share. In Asia, the significant methylamine producers include Zheijiang Jiangshu, Shandong Huala Hengsheng, Luxi Chemical Corp. and Taminco, with Taminco’s share representing 4% of Asian production capacity in 2011.
Employee Relations
We have approximately 820 employees as of September 30, 2012 through our various subsidiaries. Approximately 35% of our employees are covered by collective bargaining agreements with our subsidiaries. Most of our employees covered by collective bargaining agreements are located in Belgium. Our collective bargaining agreements with our employees in Belgium expire on December 31, 2012. We are in ongoing discussions with our employees on this agreement and do not expect any issues to arise upon renewal of such agreements.
Legal Proceedings and Other Matters
We are not involved in any pending governmental, judicial or arbitral proceeding, including any pending or threatened proceeding of which we are aware, that we believe may have, or has had, a material effect on our financial position or profitability. We are either a plaintiff or a defendant in other pending legal matters in the normal course of business. Management believes none of these other legal matters will have a material adverse effect on our business, financial condition or cash flow upon their final disposition.
100
Table of Contents
The following table sets forth information concerning our executive officers and directors.
| Name |
Age | Position | ||||
| Laurent Lenoir |
46 | Chief Executive Officer and Director | ||||
| Kurt Decat |
47 | Chief Financial Officer and Director | ||||
| Johan De Saegher |
47 | Chief Operating Officer | ||||
| Randall Colin Gouveia |
49 | Executive Vice-President Functional Amines and Regional President North America | ||||
| Guy Wouters |
56 | Executive Vice-President Supply Chain & Purchasing & ICT | ||||
| Piet Vanneste |
50 | Executive Vice-President Strategy, R&D and M&A | ||||
| Guy Van Den Bossche |
51 | Executive Vice-President Crop Protection | ||||
| Sabine Ketsman |
35 | Executive Vice-President Specialty Amines | ||||
| Edward Yocum |
47 | Executive Vice-President and General Counsel | ||||
| Charlie Shaver |
54 | Director and Non-Executive Chairman | ||||
| Kenny Cordell |
55 | Director | ||||
| Samuel Feinstein |
29 | Director | ||||
| Scott Kleinman |
40 | Director | ||||
| Marvin Schlanger |
64 | Director | ||||
| Justin Stevens |
32 | Director | ||||
| Pol Vanderhaeghen |
65 | Director | ||||
Background of Executive Officers and Directors
Laurent Lenoir has been our Chief Executive Officer since January 2010. Prior to that, he was Group Vice-President BU Methylamines & Derivatives—Regional President Asia from 2007 to December 2009 and has served in a variety of operational and executive roles during his 21 years of service with the Company. Mr. Lenoir graduated from École Nationale Supérieure d’Agronomie de Montpellier with a degree in life sciences engineering. Due to his more than 20 years of experience in the alkylamine industry and various managerial positions within Taminco, Mr. Lenoir was elected as a member of our board of directors.
Kurt Decat joined Taminco in 2003 as Chief Financial Officer, after a career of 15 years in financial management and business management at several multinational companies. Mr. Decat studied applied economics and holds a masters degree in business administration from Katholieke Universiteit Leuven. Due to his more than 20 years of experience as a finance professional, Mr. Decat was elected as a member of our board of directors.
Johan De Saegher has been our Chief Operating Officer since February 2012. Prior to that, he was Group Vice-President Agro Sciences and Regional President Latin America and has served the Company in various operational and managerial roles since 1994. Mr. Saegher holds a PhD in chemical engineering from Universiteit Gent.
Randall Colin Gouveia has been our Executive Vice-President Functional Amines and Regional President North America since August 2012. Prior to that, Mr. Gouveia was General Manager at Dow Chemical, which he joined in 2003. Mr. Gouveia holds a Bachelor of Science degree from Norwich University and a Master of Business Administration from Villanova University.
Guy Wouters has been our Executive Vice-President Supply Chain and Purchasing and ICT since 2007. He joined Taminco in 1984 and has served in various roles at the Company. Mr. Wouters holds a degree in commercial engineering from I.C.H.E.C. Brussels.
Piet Vanneste has been our Executive Vice-President Strategy, R&D and M&A since 2004. Mr. Vanneste started his career at BASF and has served in various operational and executive roles in the chemical industry. Mr. Vanneste holds a masters degree in chemical engineering from Ghent University.
101
Table of Contents
Guy Van Den Bossche has been our Executive Vice-President Crop Protection since February 2012. Prior to that, he was Business Director Crop Protection and Feed Additives. From 2005 to 2009, Mr. Van Den Bossche was Global Product Manager Life Sciences. Mr. Van Den Bossche holds a masters degree in commercial engineering from FUCAM University Mons (Belgium).
Sabine Ketsman has been our Executive Vice-President Specialty Amines since February 2012 and is also responsible for the global sales organization. She started her career with Taminco in 2000 and has served in various executive roles with the Company. Ms. Ketsman holds a masters degree in business engineering from EHSAL University (Brussels).
Edward Yocum has been our Executive Vice-President, General Counsel, Chief Compliance Officer and Corporate Secretary since July 2012. Prior to joining us, Mr. Yocum served in senior legal positions for both publicly-traded and privately-held corporations, including Senior Vice President, General Counsel and Corporate Secretary of Journal Register Company from 2006 to 2011 and Deputy General Counsel of GrafTech International Ltd. From 2003 to 2006. He was in private practice from 2011 to 2012. He started his career with the law firm of Shearman & Sterling LLP in New York. He holds a Juris Doctorate degree from Villanova University School of Law and a degree in business administration from Temple University.
Charlie Shaver became a member of our board in February 2012. He was most recently the Chief Executive Officer and President of the TPC Group from 2004 to April 2011. Prior to that, Mr. Shaver served as Vice President and General Manager for General Chemical, a division of Gentek, Inc. (GETI), from 2001 through 2004 and as a Vice President and General Manager for Arch Chemicals, Inc. from 1999 through 2001. Mr. Shaver began his career with the Dow Chemical Company serving in a series of operational, engineering and business positions from 1980 through 1996. Mr. Shaver currently serves as Chairman of the Board for U.S. Silica and serves on the Boards of Zeachem, Inc. and EP Minerals. Mr. Shaver’s management experience in the chemical industry qualifies him to serve as a member of our board.
Kenny Cordell became a member of our board in February 2012. He currently serves on the board of Momentive Performance Chemicals, a global chemicals manufacturer, and serves on the board of Origin Agritech Limited, a Chinese producer of quality seeds. From 2010 to 2012, Mr. Cordell was a consultant to Apollo. From 2006 until 2009, Mr. Cordell was the CEO and Chairman of the Board for UAP Holdings, a distributor of crop inputs in the United States. Prior to that time, Mr. Cordell held various executive positions in FMC, BASF, and Rohm and Haas Company. Mr. Cordell holds an M.B.A. from the University of Pennsylvania. Mr. Cordell’s extensive management experience qualifies him to serve as a member of our board.
Samuel Feinstein became a member of our board in December 2011. He is a Principal of Apollo’s private equity business, which he joined in 2007. Prior to that time, Mr. Feinstein was a member of the Investment Banking Group at Morgan Stanley. Mr. Feinstein’s leadership role at Apollo and extensive financial and business experience qualify him to serve as a member of our board.
Scott Kleinman became a member of our board in December 2011. He is Lead Partner for Private Equity at Apollo, where he has worked since February 1996. Mr. Kleinman serves on the boards of directors of LyondellBasell Industries N.V., Momentive Performance Materials Holdings LLC, Verso Paper Corp and Realogy Corporation. Mr. Kleinman’s leadership role at Apollo and his extensive financial and business experience qualify him to serve as a member of our board.
Marvin Schlanger became a member of our board in February 2012. He has been a principal in the firm of Cherry Hill Chemical Investments, LLC, which has provided management services and capital to chemical and allied industries since October 1998. Prior to October 1998, Mr. Schlanger held various executive positions with ARCO Chemical Company. Mr. Schlanger is the Chairman and Chief Executive Officer of CEVA Group Plc, a director and Chairman of the Supervisory Board of LyondellBasell Industries NV, and a director of Momentive Specialty Chemical Holdings LLC, UGI Corporation, UGI Utilities Inc. and Amerigas Partners LP. Mr. Schlanger holds a degree in chemical engineering from the University of Massachusetts. Mr. Schlanger’s experience in the chemical industry qualifies him to serve as a member of our board.
102
Table of Contents
Justin Stevens became a member of our board in February 2012. Mr. Stevens is a Partner at Apollo, which he joined in 2003. Prior to that time, Mr. Stevens was a member of the Leverage Finance Group at Deutsche Bank. Mr. Stevens also serves on the board of directors of Apollo Residential Mortgage Inc., Countrywide Ltd. and Vantium Capital Inc. Mr. Stevens graduated cum laude from Cornell University with a Bachelor of Science degree in Applied Economics & Management. Mr. Steven’s leadership role at Apollo and his extensive financial and business experience qualify him to serve as a member of our board.
Pol Vanderhaeghen became a member of our board in February 2012. He joined UCB in the Specialties business unit in 1973, where he held several positions. From October 1, 2003 to December 31, 2009, he was our Chief Executive Officer. Mr. Vanderhaeghen holds an M.B.A. from INSEAD. Mr. Vanderhaeghen’s management experience with UCB and us qualify him to serve as a member of our board.
Composition of Board of Directors
Upon the closing of this offering, the Company will have directors. We intend to avail ourselves of the “controlled company” exception under the applicable stock exchange rules, which eliminates the requirements that we have a majority of independent directors on our board of directors and that we have compensation and nominating/corporate governance committees composed entirely of independent directors. We will be required, however, to have an audit committee with one independent director during the 90-day period beginning on the date of effectiveness of the registration statement filed with the SEC in connection with this offering and of which this prospectus is part. After such 90-day period and until one year from the date of effectiveness of the registration statement, we will be required to have a majority of independent directors on our audit committee. Thereafter, we will be required to have an audit committee comprised entirely of independent directors.
If at any time we cease to be a “controlled company” under the stock exchange rules, the board of directors will take all action necessary to comply with the applicable stock exchange rules, including appointing a majority of independent directors to the board of directors and establishing certain committees composed entirely of independent directors, subject to a permitted “phase-in” period.
Upon consummation of this offering, our board of directors will be divided into three classes. The members of each class will serve staggered, three-year terms, other than with respect to the initial terms of the Class I and Class II directors, which will be one and two years, respectively. Upon the expiration of the term of a class of directors, directors in that class will be elected for three-year terms at the annual meeting of stockholders in the year in which their term expires. Upon consummation of this offering:
| • | , and will be Class I directors, whose initial terms will expire at the 2013 annual meeting of stockholders; |
| • | , and will be Class II directors, whose initial terms will expire at the 2014 annual meeting of stockholders; and |
| • | , and will be Class III directors, whose initial terms will expire at the 2015 annual meeting of stockholders. |
Any additional directorships resulting from an increase in the number of directors will be distributed among the three classes so that, as nearly as possible, each class will consist of one-third of our directors. This classification of our board of directors may have the effect of delaying or preventing changes in control.
At each annual meeting, our stockholders will elect the successors to our directors. Any director may be removed from office by a majority of our stockholders. Our executive officers and key employees serve at the discretion of our board of directors. Directors may be removed for cause by the affirmative vote of the holders of a majority of our common stock.
103
Table of Contents
Director Independence
Our board of directors has determined that, under listing standards and taking into account any applicable committee standards, , and are independent directors. , and are not considered independent under any general listing standards due to their current and past employment relationships with us, and , and are not considered independent under any general listing standards due to their relationship with Apollo Funds, our largest stockholder. As funds affiliated with Apollo will continue to control a majority of our voting stock following the offering, under listing standards, we will qualify as a “controlled company” and, accordingly, are exempt from its requirements to have a majority of independent directors and a nominating and corporate governance committee and a compensation committee each composed entirely of independent directors.
Board Committees
Upon completion of this offering, our board of directors will comprise an Audit Committee, a Compensation Committee, an Executive Committee, a Nominating and Corporate Governance Committee and an Environmental, Health and Safety Committee.
Audit Committee
Following the offering, our Audit Committee will consist of (Chair), and . Our board of directors has determined that qualifies as an “audit committee financial expert” as such term is defined by the SEC and that Charles Shaver is independent as independence is defined in Rule 10A-3 of the Exchange Act. The principal duties and responsibilities of our Audit Committee are to oversee and monitor the following:
| • | the annual appointment of auditors, including the independence, qualifications and performance of our auditors and the scope of audit and non-audit assignments and related fees; |
| • | the accounting principles we use in financial reporting; |
| • | our financial reporting process and internal auditing and control procedures; |
| • | our risk management policies; |
| • | the integrity of our financial statements; and |
| • | our compliance with legal, ethical and regulatory matters. |
Compensation Committee
Following the offering, our Compensation Committee will consist of (Chair), and . The principal duties and responsibilities of our Compensation Committee will be the following:
| • | approval and recommendation to our board of directors of all compensation plans for the Chief Executive Officer of the Company, all employees of the Company and its subsidiaries who report directly to the Chief Executive Officer, and other executive officers, as well as all compensation for our board of directors; |
| • | provide oversight concerning the selection of officers, management succession planning, expense accounts and severance plans and policies of the Company; |
| • | approval and authorization of grants under the Company’s or its subsidiaries’ incentive plans, including all equity plans; and |
| • | the preparation of any report on executive compensation required by SEC rules and regulations, if any. |
104
Table of Contents
Executive Committee
Following the offering, our Executive Committee will consist of (Chair), and . The principal duties and responsibilities of our Executive Committee will be the following:
| • | the exercise of the powers and duties of the board of directors between board meetings and while the board is not in session, subject to applicable law and our organizational documents; and |
| • | the implementation of the policy decisions of our board of directors. |
Nominating and Corporate Governance Committee
Our Nominating and Corporate Governance Committee consists of (Chair), and . The principal duties and responsibilities of the Nominating and Corporate Governance Committee will be the following:
| • | implementation and review of criteria for membership on our board of directors and its committees; |
| • | recommendation of proposed nominees for election to our board of directors and membership on its committees; and |
| • | recommendations to our board of directors regarding governance and related matters. |
Environmental, Health and Safety Committee
Following the offering, our Environmental, Health and Safety Committee will consist of (Chair), and . The principal duties and responsibilities of our Environmental, Health and Safety Committee will be the following:
| • | review the overall adequacy of, and provide oversight with respect to, environmental, health and safety policies, programs, procedures and initiatives; and |
| • | review and discuss with management our compliance with environmental, health and safety laws and regulations. |
Code of Ethics
In connection with this offering, our board of directors will adopt a Code of Conduct that applies to all of our directors, officers and employees, including our chief executive officer and chief financial officer. The purpose of the Code of Conduct is to promote honest and ethical conduct, including the ethical handling of actual or apparent conflicts of interest between personal and professional relationships; to promote full, fair, accurate, timely and understandable disclosure in period reports required to be filed by the Company; and to promote compliance with all applicable rules and regulations that apply to the Company and its officers. The Code of Conduct will be posted on our website: www.taminco.com under “Investor Relations.” The information contained on our website is not part of this prospectus.
105
Table of Contents
Compensation Discussion and Analysis
The purpose of this compensation discussion and analysis section is to provide information about the material elements of compensation that are paid, awarded to, or earned by, our “named executive officers,” who consist of our principal executive officer, principal financial officer, and generally the three other most highly compensated executive officers. For fiscal year 2012, our named executive officers were:
| • | Laurent Lenoir, Chief Executive Officer; |
| • | Kurt Decat, Chief Financial Officer; |
| • | Piet Vanneste, Executive Vice-President, Strategy, R&D and M&A; |
| • | Guy Wouters, Executive Vice-President, Supply Chain & Purchasing & ICT; and |
| • | Sabine Ketsman, Executive Vice-President, Specialty Amines. |
Historical Compensation Decisions
Our compensation approach is necessarily tied to our stage of development. Prior to this offering, we were a privately-held company. As a result, we have not been subject to any stock exchange listing or SEC rules requiring a majority of our board of directors to be independent or relating to the formation and functioning of board committees, including audit, compensation and nominating committees. Most, if not all, of our prior compensation policies and determinations, including those made for fiscal year 2012, have been the product of negotiations between the named executive officers and our Chief Executive Officer and/or board of directors.
Compensation Philosophy and Objectives
Upon completion of this offering, our compensation committee will review and approve the compensation of our named executive officers and oversee and administer our executive compensation programs and initiatives. As we gain experience as a public company, we expect that the specific direction, emphasis and components of our executive compensation program will continue to evolve. Accordingly, the compensation paid to our named executive officers for fiscal year 2012 is not necessarily indicative of how we will compensate our named executive officers after this offering.
We have strived to create an executive compensation program that balances short-term versus long-term payments and awards, cash payments versus equity awards and fixed versus contingent payments, and that awards in ways that we believe are most appropriate to motivate our executive officers. Our executive compensation program is designed to:
| • | attract and retain talented and experienced executives in our industry; |
| • | reward executives whose knowledge, skills and performance are critical to our success; |
| • | align the interests of our executive officers and stockholders by motivating executive officers to increase stockholder value and rewarding executive officers when stockholder value increases; |
| • | ensure fairness among the executive management team by recognizing the contributions each executive makes to our success; |
| • | foster a shared commitment among executives by aligning their individual goals with the goals of the executive management team and our company; and |
| • | compensate our executives in a manner that incentivizes them to manage our business to meet our long-range objectives. |
106
Table of Contents
To achieve these objectives, the board of directors expects to implement new compensation plans and maintain our current compensation plans in order to tie a substantial portion of the executives’ overall compensation to key strategic financial and operational goals.
We seek to ensure that all incentives are aligned with our stated compensation philosophy of providing compensation commensurate with performance, while targeting pay at approximately the 50th percentile of the competitive market. To ensure we maintain our position to market, it has been our historical practice to review benchmark data on an annual basis to ensure executive compensation remains commensurate with the targeted percentile noted above by comparing total direct compensation with compensation surveys. To this end, our Human Resources Department has engaged the Hay Group to assist in our benchmarking analysis and prepare compensation surveys that reflect how our executive compensation practices relate to the market. The Hay Group did not performance any services for the Company or the board of directors during 2012, other than the executive compensation services described above. Since we were a private company during fiscal year 2012, the companies against which we compared our compensation consisted of approximately 120 companies across a range of both public and private companies active in the chemical industry. However, this is not a selected peer group, but a general market comparison with companies in the chemical industry. In order to compare the compensation of our executives against the compensation of executives in our industry, the Hay Group utilizes the Hay Group Methodology to weigh various factors, including size of the company, revenue, and ownership, to create a relevant comparison. Based upon this analysis, we anticipate that total direct compensation will meet the targeted median of the competitive market for 2012, which we expect will be primarily attributable to us achieving our target performance for each of our annual bonus metrics. However, because actual performance under our annual bonus plan will not be determined until the end of the first quarter once our financial statements are certified, the exact relationship to our peer group cannot be determined as of the date of this filing.
We anticipate that our compensation committee will more formally benchmark executive compensation against a peer group of comparable companies in the future and engage its own compensation consultant to assist in benchmarking compensation. We also anticipate that our compensation committee may make adjustments in executive compensation levels in the future as a result of this more formal benchmarking process.
Compensation Procedures
In connection with this offering, our board of directors will form a compensation committee to oversee and administer our compensation arrangements, including the Taminco Acquisition Corporation 2012 Equity Incentive Plan (described below). The compensation committee will meet outside the presence of all of our executive officers, including our named executive officers, to consider appropriate compensation for our Chief Executive Officer. For all other named executive officers, the compensation committee will meet outside the presence of all executive officers except our Chief Executive Officer. We expect that following this offering, our Chief Executive Officer will review annually each other named executive officer’s performance with the compensation committee and recommend appropriate base salary, cash performance awards and grants of long-term equity incentive awards for all other executive officers. Based upon the recommendations of our Chief Executive Officer and in consideration of the objectives described above and the principles described below, the compensation committee will approve the annual compensation packages of our executive officers other than our Chief Executive Officer. We also expect that the compensation committee will annually analyze our Chief Executive Officer’s performance and determine his base salary, cash performance awards and grants of long-term equity incentive awards based on its assessment of his performance with input from any consultants engaged by the compensation committee.
The Company has determined that any risks arising from its compensation programs and policies are not reasonably likely to have a material adverse effect on the Company. The Company’s compensation programs and policies mitigate risk by combining performance-based, long-term compensation elements with payouts that are highly correlated to the value delivered to stockholders. The combination of performance measures for annual
107
Table of Contents
bonuses and the equity compensation programs for executive officers, as well as the multiyear vesting schedules for equity awards encourage employees to maintain both a short- and a long-term view with respect to Company performance.
Elements of Compensation
Our current executive compensation program, consists of the following components:
| • | base salary; |
| • | annual cash incentive awards linked to our overall performance; |
| • | periodic grants of long-term equity-based compensation; |
| • | other executive benefits and perquisites; and |
| • | employment agreements, which contain termination benefits. |
We combine these elements in order to formulate compensation packages that provide competitive pay, reward the achievement of financial, operational and strategic objectives and align the interests of our executive officers and other senior personnel with those of our stockholders.
Pay Mix
We utilize the particular elements of compensation described above because we believe that it provides a well-proportioned mix of secure compensation, retention value and at-risk compensation which produces short-term and long-term performance incentives and rewards. By following this approach, we provide the executive a measure of security in the minimum expected level of compensation, while motivating the executive to focus on business metrics that will produce a high level of short-term and long-term performance for the Company and long-term wealth creation for the executive, as well as reducing the risk of recruitment of top executive talent by competitors. The mix of metrics used for our annual performance bonus and long-term incentive program likewise provides an appropriate balance between short-term financial performance and long-term financial and stock performance.
Base Salary
The primary component of compensation of our executive officers is base salary. The base salary established for each of our executive officers is intended to reflect each individual’s responsibilities, experience, prior performance and other discretionary factors deemed relevant by our Chief Executive Officer and/or board of directors. Base salary is also designed to provide our executive officers with steady cash flow during the course of the fiscal year that is not contingent on short-term variations in our corporate performance. Our Human Resources Department, with the assistance of the Hay Group, generally determines market level compensation for base salaries with reference to the base salaries of similarly situated executives in other companies in our general industry. This determination is based primarily on a review of relevant competitive market data provided by the Hay Group. In connection with the Acquisition, the base salaries of each of our named executive officers were reviewed by our board of directors and increased in order to align their total direct compensation with the 50th percentile of the competitive market. As a result, the base salaries for each of Messrs. Lenoir, Decat, Vanneste, and Wouters and Ms. Ketsman were increased to €282,200, €219,996, €170,172, €154,200 and €135,604, respectively (having been increased from €235,000, €200,000, €141,807, €145,470 and €103,908, respectively). The base salaries actually paid to our named executive officers in fiscal year 2012 are set forth in the Summary Compensation Table below.
Upon the completion of this offering, the compensation committee will take a more significant role in this annual review and decision-making process.
108
Table of Contents
Bonus
Our Chief Executive Officer and/or board of directors have authority to award annual cash bonuses to our executive officers. The annual cash bonuses are intended to offer incentive compensation by rewarding the achievement of specified corporate performance objectives. Generally, at the commencement of an executive officer’s employment with us, our Chief Executive Officer and/or board of directors typically sets a target level of bonus compensation that is structured as a percentage of such executive officer’s annual base salary. In this regard, the employment agreements specifically provide that the sum of the annual bonus is targeted at 40% of the executive’s annual base compensation for each of Messrs. Decat, Vanneste and Wouters and 50% of the executive’s annual base compensation for Mr. Lenoir.
For our 2012 fiscal year, annual cash bonuses for our named executive officers were based on the following corporate performance metrics: 80% of the annual bonus was based on specified EBITDA targets and 20% of the annual bonus based on achievement of specified Working Capital targets where target EBITDA was equal to $246 million and target Working Capital was equal to 15%. To the extent actual results with respect to one of the foregoing metrics for the performance year were less than 70% of applicable performance target the executive would receive a zero bonus payout with respect to that metric and, to the extent actual performance exceeded 125% of the applicable performance target, the annual bonus was capped at 125% of the target bonus payout. These corporate performance objectives are designed to be challenging but achievable. We expect that for the 2012 fiscal year we will meet each of the foregoing performance metrics and our named executive officers will be entitled to receive an annual bonus commensurate with target performance. However, actual achievement of the performance metrics will not be determined until our financial statements are complete later in our first quarter.
At this time, we are not disclosing the specific performance targets because disclosure of the specific targets would signal areas of strategic focus and give competitors harmful insight into the direction of our business. We are committed to the long-term success and growth of our enterprise and disclosing short-term objectives would run counter to both our compensation and business philosophy of focusing on long-term goals and, as a result, could result in confusion for investors. As we gain experience as a public company and expand, we will continue to assess whether the disclosure of specific performance metrics will cause us competitive harm.
Our board of directors has the discretion to determine whether and in what amounts such bonuses are paid based upon their quantitative evaluation of the impact of their performance on overall corporate objectives. In addition, our Chief Executive Officer and/or board of directors may adjust bonuses due to extraordinary or nonrecurring events, such as significant financings, equity offerings or acquisitions. We believe that establishing cash bonus opportunities helps us attract and retain qualified and highly skilled executives. These annual bonuses are intended to reward executive officers who have a positive impact on corporate results. Upon the completion of this offering, the compensation committee will take a more significant role in this annual review and decision-making process.
Long-Term Equity-Based Compensation
Our Chief Executive Officer and/or board of directors believe that equity-based compensation is an important component of our executive compensation program and that providing a significant portion of our executive officers’ total compensation package in equity-based compensation aligns the incentives of our executives with the interests of our stockholders and with our long-term corporate success. Additionally, our Chief Executive Officer and/or board of directors believe that equity-based compensation awards enable us to attract, motivate, retain and adequately compensate executive talent. To that end, we have awarded equity-based compensation in the form of stock options because our board of directors believes that appreciation awards, rather than full value awards such as restricted stock, most closely aligns our executive’s interests with the interests of our stockholders. Our Chief Executive Officer and/or board of directors believe equity awards provide executives with a significant long-term interest in our success by rewarding the creation of stockholder value over time.
109
Table of Contents
Following the Acquisition, our NEOs were each granted stock options under our 2012 Incentive Plan (described below). One-third of the options granted are subject to time-based vesting criteria and two-thirds of the options are subject to specified performance-based vesting criteria. Specifically, the time-vesting options will vest in five equal installments on each of the first five anniversaries of the grant date, subject to the executive’s continued service on each such vesting date. The time-vesting options will also fully vest on a Realization Event (which generally means either a liquidation of the Company or a change in control transaction). The performance-vesting options are divided into three equal tranches that vest based upon specified performance criteria after a Realization Event, subject to the executive’s continued service on such date as follows:
(i) one-third of the performance-vesting options will vest if either (a) the Sponsor (which generally means the investment funds managed by Apollo Management VII, L.P.) internal rate of return or “IRR” equals or exceeds 17% and the Sponsor receives cash proceeds equal to 1.5 times its investment or (b) the Sponsor receives cash proceeds equal to 2.0 times its investment;
(ii) two-thirds of the performance-vesting options will vest if either (a) the Sponsor IRR equals or exceeds 20% and the Sponsor receives cash proceeds equal to 1.75 times its investment or (b) the Sponsor receives cash proceeds equal to 2.5 times its investment; and
(iii) all of the performance-vesting options will vest if either (a) the Sponsor IRR equals or exceeds 25% and the Sponsor receives cash proceeds equal to 2.0 times its investment or (b) the Sponsor receives cash proceeds equal to 3.0 times its investment.
In the event of the executive’s termination of service, any unvested options will be forfeited, except in the event of an executive’s termination of service by the Company without “cause” (as defined) on or after the fifth anniversary of the date of grant then the option will remain outstanding through the ten year term of the option and be eligible to vest in accordance with the foregoing performance conditions. The Company also has the right to repurchase shares acquired pursuant to the exercise of an option: (i) for fair market value, if the executive is a “Good Leaver,” (ii) 50% for fair market value and 50% for the lesser of cost or fair market value, if the executive is a “Medium Leaver” and (iii) for the lesser of cost and fair market value if the executive is a “Bad Leaver.” Under the option agreements, (I) “Good Leaver” generally means (a) a termination of employment without cause, (b) a termination of employment for good reason, (c) the employee’s death, serious illness or permanent disability, or (d) the employee’s retirement on or following the third anniversary of the date of grant; (II) “Medium Leaver” generally means (a) the employee’s voluntary resignation on or following the third anniversary of the date of grant for any reason, other than a Good Leaver termination or (b) the employee’s retirement prior to the third anniversary of the date of grant; and (III) “Bad Leaver” generally means (a) a termination of employment for cause, or (b) the employee’s voluntary resignation prior to the third anniversary of the date of grant, other than a Good Leaver or a Medium Leaver termination.
The combination of time and performance based vesting of the options is designed to compensate executives for long term commitment to us, while motivating sustained increases in our financial performance and helping ensure the stockholders have received an appropriate return on their invested capital.
2012 Equity Incentive Plan
Prior to this offering, the board of directors adopted the Taminco Acquisition Corporation 2012 Equity Incentive Plan, or the “2012 Incentive Plan.” The 2012 Incentive Plan provides for grants of stock options, restricted stock, and restricted stock units or “RSUs.” The purpose of the 2012 Incentive Plan is to provide incentives that will attract, retain and motivate high performing officers, directors, employees and consultants by providing them a proprietary interest in our long-term success or compensation based on their performance in fulfilling their responsibilities to our company. Set forth below is a summary of the material terms of the 2012 Incentive Plan. For further information about the 2012 Incentive Plan, we refer you to the complete copy of the 2012 Incentive Plan, which we will file as an exhibit to the registration statement.
110
Table of Contents
Administration. The 2012 Incentive Plan is administered by a committee consisting of either the board of directors or the compensation committee of the board of directors. The committee has full authority to administer and interpret the 2012 Incentive Plan, to grant awards under the 2012 Incentive Plan, and to make all other determinations in connection with the 2012 Incentive Plan and the awards thereunder as the committee deems necessary or desirable and to delegate authority under the 2012 Incentive Plan to our executive officers.
Available Shares. The aggregate number of shares of common stock which may be issued or used for reference purposes under the 2012 Incentive Plan or with respect to which awards may be granted may not exceed 442,234 shares. The number of shares available for issuance under the 2012 Incentive Plan is subject to adjustment in the event of a stock split, corporate transaction or similar change in our corporate structure. Generally, if awards under the 2012 Incentive Plan are for any reason cancelled, or expire or terminate unexercised, the shares covered by such awards may again be available for the grant of awards under the 2012 Incentive Plan.
Eligibility for Participation. Members of our board of directors, as well as employees of, and consultants to, us or any of our subsidiaries are eligible to receive awards under the 2012 Incentive Plan.
Award Agreement. Awards granted under the 2012 Incentive Plan are evidenced by award agreements that provide additional terms, conditions, restrictions or limitations covering the grant of the award.
Stock Options. The committee may grant nonqualified stock options and incentive stock options to purchase shares of our common stock only to eligible employees. The committee will determine the number of shares of our common stock subject to each option, the term of each option, the exercise price, the vesting schedule, if any, and the other material terms of each option. The exercise price for nonqualified stock options will be determined by the committee in its discretion. The exercise price for incentive stock options will be equal to the fair market value on the date of grant except, in the case of an incentive stock option granted to a 10% or greater stockholder, the exercise price will not be less than 110% of fair market value. Options will be exercisable at such time or times and subject to such terms and conditions as determined by the committee at grant. A stock option may be exercised by (i) the payment of cash or personal or certified check or (ii) with the consent of the committee, the withholding of shares having a fair market value equal to the aggregate exercise price. The 2012 Incentive Plan provides that in connection with a change in control, at least five days prior to the consummation of the change in control transaction, the Company will (i) notify optionholders of the change in control, (ii) provide that each option that would vest in connection with such change in control will be exercisable immediately prior to the change in control, and (iii) permit optionholders to elect to exercise each outstanding vested option prior to such change in control. The committee may also provide for vested options that are not exercised to be cancelled immediately following the consummation of the change in control.
Restricted Stock. The committee may award shares of restricted stock. Except as otherwise provided by the committee upon the award of restricted stock, the recipient generally will have the rights of a stockholder with respect to the shares, including the right to receive ordinary cash dividends and the right to vote the shares of restricted stock. Dividends and other distributions, other than ordinary cash dividends, will generally be deferred until the expiration of the applicable restriction period. Recipients of restricted stock will be required to enter into a restricted stock agreement that states the restrictions to which the shares are subject.
Restricted Stock Units. The committee may, subject to limitations under applicable law, make a grant of RSUs that are payable in cash or denominated or payable in or valued by shares of our common stock. The committee will determine the terms and conditions of RSU awards at the time of grant. The committee, in its discretion, may also grant the right to receive the equivalent value, in cash or shares, of ordinary cash dividends paid with respect to the shares underlying RSUs, which may either be paid currently or deferred until the settlement of the RSUs.
Amendment and Termination. Notwithstanding any other provision of the 2012 Incentive Plan, our board of directors may at any time amend any or all of the provisions of the 2012 Incentive Plan, or suspend or terminate
111
Table of Contents
it entirely; provided, however, that, unless otherwise required by law or specifically provided in the 2012 Incentive Plan, the rights of a participant with respect to awards granted prior to any amendment, suspension or termination may not be adversely affected without the consent of the respective participants.
Transferability. Awards granted under the 2012 Incentive Plan generally will be nontransferable, other than by will or the laws of descent and distribution.
Foreign Participants. The Committee may modify awards granted to participants who are foreign nationals or employed outside the United States or establish subplans or procedures under the 2012 Incentive Plan to address differences in laws or customs of such foreign jurisdictions.
Effective Date. The 2012 Incentive Plan was adopted by the board of directors on February 15, 2012.
Other Executive Benefits and Perquisites
We provide the following benefits to our executive officers on the same basis as other eligible employees:
| • | health insurance; |
| • | pension benefits; |
| • | invalidity insurance for Belgium employees; and |
| • | vacation, personal holidays and sick days. |
We believe these benefits are generally consistent with those offered by other companies and specifically with those companies with which we compete for employees.
Employment Agreements and Severance and Change of Control Benefits
We believe that a strong, experienced management team is essential to the best interests of the Company and our shareholders. We recognize that the possibility of a change in control could arise and that such a possibility could result in the departure or distraction of members of the management team to the detriment of the Company and our shareholders. We have entered into the employment agreements with the named executive officers in order to minimize employment security concerns arising in the course of negotiating and completing a significant transaction. These benefits, which generally are payable if the executive is terminated by the Company other than due to a “Material Breach” (as defined in the agreements), are enumerated and quantified in the section captioned “Executive Compensation—Employment Agreements and Severance Benefits.”
Section 162(m) Compliance
Section 162(m) of the Internal Revenue Code limits us to a deduction for federal income tax purposes of no more than $1 million of compensation paid to certain executive officers in a taxable year. Compensation above $1 million may be deducted if it is “performance-based compensation” within the meaning of the Internal Revenue Code. Following this offering, our compensation committee will determine whether and/or how to structure our compensation arrangements so as to preserve the related federal income tax deductions. Pursuant to applicable regulations, Section 162(m) will not apply to compensation paid or equity awards granted under the compensation agreements and plans in existence prior to the completion of this offering and during the reliance transition period ending on the earlier of the date the applicable agreement or plan is materially modified and the Company’s annual stockholders meeting occurring in 2016. While we will continue to monitor our compensation programs in light of Section 162(m), the board of directors considers it important to retain the flexibility to design compensation programs that are in the best long-term interests of our company and our stockholders, particularly as we continue our transition to a publicly traded company. As a result, we have not adopted a policy requiring that all compensation be deductible and the board of directors or compensation committee may conclude that paying compensation at levels that are not deductible under Section 162(m) is nevertheless in the best interests of our company and our stockholders.
112
Table of Contents
Section 409A Considerations
Another section of the Code, Section 409A, affects the manner by which deferred compensation opportunities are offered to our employees because Section 409A requires, among other things, that “non-qualified deferred compensation” be structured in a manner that limits employees’ abilities to accelerate or further defer certain kinds of deferred compensation. We intend to operate our existing compensation arrangements that are covered by Section 409A in accordance with the applicable rules thereunder, and we will continue to review and amend our compensation arrangements where necessary to comply with Section 409A.
Section 280G Considerations
Section 280G of the Internal Revenue Code disallows a company’s tax deduction for payments received by certain individuals in connection with a change in control to the extent that the payments exceed an amount approximately three times their average annual compensation and Section 4999 of the Internal Revenue Code imposes a 20% excise tax on those payments. The board of directors and compensation committee will take into account the implications of Section 280G in determining potential payments to be made to our executives in connection with a change in control. Nevertheless, to the extent that certain payments upon a change in control are classified as excess parachute payments, such payments may not be deductible pursuant to Section 280G.
Financial Accounting Standards Board Accounting Standards Codification Topic 718 (“Topic 718”).
Topic 718 requires a public company to measure the cost of employee services received in exchange for an award of equity instruments based on the grant date fair value of the award. Our equity awards to the named executive officers are structured to comply with the requirements of Topic 718 to maintain the appropriate equity accounting treatment, and the Company takes such accounting treatment into account when designing and implementing its compensation programs.
2012 Summary Compensation Table
The following table sets forth certain information with respect to compensation for the year ended December 31, 2012 earned by, awarded to or paid to our named executive officers.
| Name and Principal Position(1) |
Year | Salary ($) |
Bonus ($) |
Stock Awards ($) |
Option Awards ($)(2) |
Non-Equity Incentive Plan Compensation ($)(3) |
Change in Pension Value and Nonqualified Deferred Compensation Earnings ($)(4) |
All Other Compensation ($)(5) |
Total ($) |
|||||||||||||||||||||||
| Laurent Lenoir |
||||||||||||||||||||||||||||||||
| Chief Executive Officer |
2012 | 361,873 | 1,276,279 | 93,053 | 133,400 | 65,376 | 1,929,981 | |||||||||||||||||||||||||
| 2011 | 304,365 | 76,091 | 125,533 | 61,820 | 567,809 | |||||||||||||||||||||||||||
| Kurt Decat |
||||||||||||||||||||||||||||||||
| Chief Financial Officer |
2012 | 285,979 | 1,160,276 | 58,076 | 105,852 | 67,033 | 1,677,215 | |||||||||||||||||||||||||
| 2011 | 259,034 | 51,807 | 88,867 | 67,400 | 467,108 | |||||||||||||||||||||||||||
| Piet Vanneste |
||||||||||||||||||||||||||||||||
| Executive Vice-President, Strategy, R&D&T and M&A |
2012 | 218,367 | 899,214 | 44,921 | 148,482 | 37,553 | 1,348,536 | |||||||||||||||||||||||||
| 2011 | 183,664 | 36,733 | 80,979 | 33,928 | 335,304 | |||||||||||||||||||||||||||
| Guy Wouters |
||||||||||||||||||||||||||||||||
| Executive Vice-President, Supply Chain, Purchasing & ICT |
2012 | 201,605 | 435,094 | 40,705 | 119,515 | 25,882 | 822,803 | |||||||||||||||||||||||||
| 2011 | 188,408 | 37,682 | 87,098 | 24,007 | 337,194 | |||||||||||||||||||||||||||
| Sabine Ketsman |
||||||||||||||||||||||||||||||||
| Executive Vice-President, Specialty Amines |
2012 | 172,405 | 269,775 | 26,847 | 47,907 | 10,861 |
|
527,796 |
| |||||||||||||||||||||||
| 2011 | 134,579 | 16,881 | 21,546 | 9,735 | 182,740 | |||||||||||||||||||||||||||
113
Table of Contents
| (1) | Messrs. Lenoir, Decat, Vanneste, Wouters, and Ms. Ketsman are located in Europe and receive compensation in Euros. The U.S. Dollar amount provided is based on the exchange rate as of December 31, 2012 of $1.3199 to every €1.00 for amounts earned in 2012 and an exchange rate as of December 31, 2011 of $1.29517 to every €1.00 for amounts earned in 2011. |
| (2) | Values in this column represent the grant date fair value of performance-based stock option awards and time-vested stock option awards computed in accordance with FASB ASC Topic 718, taking into account the value of the shares underlying the options in connection with the Acquisition. For a discussion of the vesting schedule of the Option Awards, please see the sub-section entitled “2012 Equity Incentive Plan”. The Company did not grant any options or other equity-based awards in 2011. |
| (3) | The values reflected represent 50% of the amount earned under the Company’s annual cash bonus plan, which are generally paid in April of each year, by each NEO. The other 50% is deferred pursuant to the Bonus Pension Plan, as further described in footnote 1 under the Pension Benefits Table. The NEOs’ target bonuses were computed as follows: Mr. Lenoir (50% of his base salary), Messrs. Decat, Vanneste, and Wouters (for each, 40% of his base salary) and for Ms. Ketsman (30% of her base salary). For each NEO, the target bonus under the annual bonus plan is based 80% on achievement of the EBITDA target and 20% based on the Working Capital target. The target bonus for each NEO is provided for the 2012 fiscal year because actual results will not be determined until the end of the first quarter. |
| (4) | The Company does not maintain any non-qualified defined contribution plans. The values provided in this column represent (i) the change in value under the Defined Benefit Plan over the 2012 fiscal year for each NEO plus (ii) the Accrued Pension Benefit which represents 50% of the value contributed by the Company for each NEO under the Bonus Pension Plan during the 2012 fiscal year. See “Pension Benefits” for a more detailed description of the Defined Benefit Plan and Bonus Pension Plan. |
The Defined Benefit Plan is a tax-qualified defined benefit plan. The Company’s contribution under the Defined Benefit Plan to the benefit of each NEO depends on each NEO’s current base salary, and any changes to the Company’s contribution as part of each NEO’s benefit under the Defined Benefit Plan directly corresponds to any changes in the NEO’s base salary. See Footnote 1 of the Pension Benefits Table for more information regarding the Defined Benefit Plan.
| (5) | The table below provides an itemized description of the amounts set forth in the “All Other Compensation” column: |
| Name |
Year | Directors’ Fees for Service on the Boards of the Company’s Subsidiary Companies ($) |
Value of Personal Use of the Company Car ($) (a) |
Meal Vouchers($) (b) |
Fixed Allowance($) (c) |
Employer’s Contribution to the Life Capital Benefit ($)(d) |
Employer’s Contribution for Orphan’s Pension ($)(e) |
Employer’s Contribution For Disability Annuity before Age 60 ($)(f) |
Total ($) |
|||||||||||||||||||||||||||
| Laurent Lenoir |
2012 | 47,516 | 5,402 | 6,465 | 1,515 | 4,478 | 65,376 | |||||||||||||||||||||||||||||
| 2011 | 46,626 | 4,535 | 5,309 | 1,405 | 3,945 | 61,820 | ||||||||||||||||||||||||||||||
| Kurt Decat |
2012 | 52,882 | 3,537 | 6,217 | 892 | 3,504 | 67,033 | |||||||||||||||||||||||||||||
| 2011 | 51,891 | 5,502 | 5,571 | 1,066 | 3,370 | 67,400 | ||||||||||||||||||||||||||||||
| Piet Vanneste |
2012 | 21,842 | 6,795 | 5,791 | 319 | 2,878 | 37,553 | |||||||||||||||||||||||||||||
| 2011 | 21,432 | 4,351 | 5,044 | 367 | 2,733 | 33,928 | ||||||||||||||||||||||||||||||
| Guy Wouters |
2012 | 11,087 | 5,170 | 6,878 | 198 | 2,550 | 25,882 | |||||||||||||||||||||||||||||
| 2011 | 10,879 | 4,213 | 6,140 | 299 | 2,476 | 24,007 | ||||||||||||||||||||||||||||||
| Sabine Ketsman |
2012 | 3,988 | 1,357 | 3,643 | 690 | 1,182 | 10,861 | |||||||||||||||||||||||||||||
| 2011 | 3,200 | 1,263 | 3,575 | 619 | 1,078 | 9,735 | ||||||||||||||||||||||||||||||
| (a) | The value of each NEO’s personal use of a Company-provided car, including fuel, leasing and other accompanying costs, as follows is provided in this column. The computation of the value of such Company car benefits for Belgium-based employees, the “benefit in kind,” which is governed by European law, takes into account carbon dioxide emissions that the respective car produces and the car’s catalogue value (which |
114
Table of Contents
| is defined as the catalogue price of the vehicle in new condition in case of a sale to private individuals, including options and value added tax and excluding discounts, reductions, rebates or refunds). |
| (b) | Ms. Ketsman receives electronic meal vouchers, the values of which are provided in this column, which are a common additional benefit in Belgium and may be exempt from income taxes. |
| (c) | Ms. Ketsman receives a fixed additional allowance, which is considered an up-front reimbursement for business expenses incurred during professional activities and may be deductible by the employer, the full amount of which may not be considered compensation to the NEO but is nevertheless disclosed herein. Ms. Ketsman is the only NEO who received such fixed additional allowance. |
| (d) | The Company’s annual contribution for a life capital benefit that the NEO receives in the case of death before age 60 (the “Life Capital Benefit”), which was contributed by the Company on January 1, 2012 for the 2012 fiscal year and January 1, 2011 for the 2011 fiscal year is provided in this column. |
| (e) | The Company’s annual contribution for the benefit of the respective NEO’s child, should a parent die (the “Orphan’s Pension”), which was contributed by the Company on January 1, 2012 for the 2012 fiscal year and on January 1, 2011 for the 2011 fiscal year is provided in this column. |
| (f) | The Company’s annual contribution for a disability benefit, paid out as an annuity, in the case of the NEO’s illness or private accident, which was contributed by the Company on January 1, 2012 for the 2012 fiscal year and on January 1, 2011 for the 2011 fiscal year is provided in this column. |
2012 Grants of Plan-Based Awards
The following table sets forth certain information with respect to grants of plan-based awards for the year ended December 31, 2012 with respect to our named executive officers.
| Name |
Grant Date |
Estimated Future Payouts Under Non-Equity Incentive Plan Awards(1) |
Estimated
Future Payouts Under Equity Incentive Plan Awards |
All
Other Stock Awards: Number of Shares of Stock or Units (#) |
All
Other Option Awards: Number of Securities Underlying Options (#)(2)(3) |
Exercise or Base Price of Option Awards ($/sh)(4) |
Grant Date Fair Value of Stock and Option Awards($)(5) |
|||||||||||||||||||||||||||||
| Threshold ($) |
Target ($) |
Maximum ($) |
Threshold ($) |
Target ($) |
Maximum ($) |
|||||||||||||||||||||||||||||||
| Laurent Lenoir |
2/24/12 | 65,137 | 93,053 | 116,316 | 19,362 (T1) | 54.99 | 44.29 | |||||||||||||||||||||||||||||
| 12,908 (T2) | 54.99 | 15.14 | ||||||||||||||||||||||||||||||||||
| 12,908 (T3) | 54.99 | 10.52 | ||||||||||||||||||||||||||||||||||
| 12,908 (T4) | 54.99 | 6.78 | ||||||||||||||||||||||||||||||||||
| Kurt Decat |
3/9/12 | 40,653 | 58,076 | 72,595 | 17,602 (T1) | 54.99 | 44.29 | |||||||||||||||||||||||||||||
| 11,735 (T2) | 54.99 | 15.14 | ||||||||||||||||||||||||||||||||||
| 11,735 (T3) | 54.99 | 10.52 | ||||||||||||||||||||||||||||||||||
| 11,735 (T4) | 54.99 | 6.78 | ||||||||||||||||||||||||||||||||||
| Piet Vanneste |
2/24/12 | 31,445 | 44,921 | 56,152 | 13,642 (T1) | 54.99 | 44.29 | |||||||||||||||||||||||||||||
| 9,094 (T2) | 54.99 | 15.14 | ||||||||||||||||||||||||||||||||||
| 9,094 (T3) | 54.99 | 10.52 | ||||||||||||||||||||||||||||||||||
| 9,094 (T4) | 54.99 | 6.78 | ||||||||||||||||||||||||||||||||||
| Guy Wouters |
3/9/12 | 28,494 | 40,705 | 50,881 | 6,601 (T1) | 54.99 | 44.29 | |||||||||||||||||||||||||||||
| 4,400 (T2) | 54.99 | 15.14 | ||||||||||||||||||||||||||||||||||
| 4,400 (T3) | 54.99 | 10.52 | ||||||||||||||||||||||||||||||||||
| 4,400 (T4) | 54.99 | 6.78 | ||||||||||||||||||||||||||||||||||
| Sabine Ketsman |
4/17/12 | 18,793 | 26,847 | 33,559 | 4,093 (T1) | 54.99 | 44.29 | |||||||||||||||||||||||||||||
| 2,728 (T2) | 54.99 | 15.14 | ||||||||||||||||||||||||||||||||||
| 2,728 (T3) | 54.99 | 10.52 | ||||||||||||||||||||||||||||||||||
| 2,728 (T4) | 54.99 | 6.78 | ||||||||||||||||||||||||||||||||||
| (1) | Achievement lower than 70% of target performance results in a zero bonus payout, and achievement higher than 125% of target performance results in a maximum payout of 125% of the target bonus. |
| (2) | One-third of the options granted are subject to time-based vesting criteria (representing Tranche 1, or “T1”) and two-thirds of the options are subject to specified performance-based vesting criteria (representing Tranches 2, 3 and 4, or, respectively, “T2”, “T3” and “T4”). |
| (3) | The Company did not grant options or other equity awards in 2011. |
115
Table of Contents
| (4) | In December of 2012, in connection with the payment of an extraordinary cash dividend, the exercise price of all options was reduced by $45.01 from $100 per share to $54.99 per share. |
| (5) | The grant date fair value is provided in accordance with FASB ASC Topic 718. |
Outstanding Equity Awards At 2012 Fiscal Year End
The following table sets forth certain information with respect to outstanding equity awards of our named executive officers as of December 31, 2012 with respect to the named executive officer. The market value of the shares in the following table is the fair value of such shares at December 31, 2012.
| Option Awards (1) | Stock Awards | |||||||||||||||||||||||
| Name |
Number of Securities Underlying Unexercised Options (#) Exercisable |
Number of Securities Underlying Unexercised Options (#) Unexercisable |
Equity Incentive Plan Awards: Number of Securities Underlying Unexercised Unearned Options (#)(2) |
Option Exercise Price ($)(3) |
Option Expiration Date |
Number of Shares or Units of Stock That Have Not Vested (#) |
Market Value of Shares or Units of Stock That Have Not Vested ($) |
Equity Incentive Plan Awards: Number of Unearned Shares, Units or Other Rights That Have Not Vested (#) |
Equity Incentive Plan Awards: Market or Payout Value of Unearned Shares or Other Rights That Have Not Vested ($) | |||||||||||||||
| Laurent Lenoir |
19,362 (T1) | 54.99 | 2/24/22 | |||||||||||||||||||||
| 12,908 (T2) | 54.99 | |||||||||||||||||||||||
| 12,908 (T3) | 54.99 | |||||||||||||||||||||||
| 12,908 (T4) | 54.99 | |||||||||||||||||||||||
| Kurt Decat |
17,602 (T1) | 54.99 | 3/9/22 | |||||||||||||||||||||
| 11,735 (T2) | 54.99 | |||||||||||||||||||||||
| 11,735 (T3) | 54.99 | |||||||||||||||||||||||
| 11,735 (T4) | 54.99 | |||||||||||||||||||||||
| Piet Vanneste |
13,642 (T1) | 54.99 | 2/24/22 | |||||||||||||||||||||
| 9,094 (T2) | 54.99 | |||||||||||||||||||||||
| 9,094 (T3) | 54.99 | |||||||||||||||||||||||
| 9,094 (T4) | 54.99 | |||||||||||||||||||||||
| Guy Wouters |
6,601 (T1) | 54.99 | 3/9/22 | |||||||||||||||||||||
| 4,400 (T2) | 54.99 | |||||||||||||||||||||||
| 4,400 (T3) | 54.99 | |||||||||||||||||||||||
| 4,400 (T4) | 54.99 | |||||||||||||||||||||||
| Sabine Ketsman |
4,093 (T1) | 54.99 | 2/24/22 | |||||||||||||||||||||
| 2,728 (T2) | 54.99 | |||||||||||||||||||||||
| 2,728 (T3) | 54.99 | |||||||||||||||||||||||
| 2,728 (T4) | 54.99 | |||||||||||||||||||||||
| (1) | The only outstanding equity awards are those grants made by the Company in 2012. |
| (2) | One-third of the options granted are subject to time-based vesting criteria and two-thirds of the options are subject to specified performance-based vesting criteria. Specifically, the time-vesting options will vest in five equal installments on each of the first five anniversaries of the grant date, subject to the NEO’s continued service on each such vesting date. The time vesting options will also fully vest on a Realization Event (which generally means either a liquidation of the Company or a change in control transaction). The performance-vesting options are divided into three equal tranches that vest based upon specified performance criteria after a Realization Event, subject to the NEO’s continued service on such date as follows: (i) one-third of the performance-vesting options will vest if either (a) the Sponsor internal rate of return or “IRR” equals or exceeds 17% and the Sponsor receives cash proceeds equal to 1.5 times its investment or (b) the Sponsor receives cash proceeds equal to 2.0 times its investment; (ii) two-thirds of the performance-vesting options will vest if either (a) the Sponsor IRR equals or exceeds 20% and the Sponsor receives cash proceeds equal to 1.75 times its investment or (b) the Sponsor receives cash proceeds equal to 2.5 times its investment; and (iii) all of the performance-vesting options will vest if either (a) the Sponsor |
116
Table of Contents
| IRR equals or exceeds 25% and the Sponsor receives cash proceeds equal to 2.0 times its investment or (b) the Sponsor receives cash proceeds equal to 3.0 times its investment. |
| (3) | In December of 2012, the exercise price of all options was reduced by $45.01, in connection with the payment of an extraordinary cash dividend. |
Options Exercised and Stock Vested
The following table sets forth certain information with respect to the vesting or exercise of stock options during the fiscal year ended December 31, 2012 with respect to our named executive officers.
| Option Awards(1) | Stock Awards | |||||||||||
| Name |
Number of
Shares Acquired on Exercise (#) |
Value Realized on Exercise ($) |
Number of Shares Acquired on Vesting (#) |
Value Realized on Vesting ($) | ||||||||
| Laurent Lenoir |
1,781,165 | 562,771 | ||||||||||
| Kurt Decat |
1,781,165 | 562,771 | ||||||||||
| Piet Vanneste |
1,781,165 | 562,771 | ||||||||||
| Guy Wouters |
1,781,165 | 562,771 | ||||||||||
| Sabine Ketsman |
569,970 | 180,086 | ||||||||||
| (1) | All options exercised during 2012 were exercised in connection with the Acquisition. |
Pension Benefits
The following table sets forth certain information with respect to the accrued pension benefits payable to our named executive officers for the fiscal year ended December 31, 2012.
| Name |
Plan Name(1) | Number of Years Credited Service (#)(2) |
Present Value of Accumulated Benefit ($)(3) |
Payments During Last Fiscal Year ($)(4) |
||||||||||
| Laurent Lenoir |
Defined Benefit Plan | 5.50 | 146,238 | 41,613 | ||||||||||
| Bonus Pension Plan | 5.00 | 321,006 | 91,786 | |||||||||||
| Kurt Decat |
Defined Benefit Plan | 9.17 | 189,361 | 43,359 | ||||||||||
| Bonus Pension Plan | 8.00 | 293,348 | 62,493 | |||||||||||
| Piet Vanneste |
Defined Benefit Plan | 23.25 | 417,770 | 104,172 | ||||||||||
| Bonus Pension Plan | 8.00 | 285,895 | 44,310 | |||||||||||
| Guy Wouters |
Defined Benefit Plan | 22.83 | 493,576 | 74,061 | ||||||||||
| Bonus Pension Plan | 8.00 | 280,964 | 45,454 | |||||||||||
| Sabine Ketsman |
Defined Benefit Plan | 12.33 | 73,686 | 30,353 | ||||||||||
| Bonus Pension Plan | 5.00 | 55,899 | 17,554 | |||||||||||
| (1) | Under the Defined Benefit Plan, all participants, including Belgium-based employees, are guaranteed a pension amount based on the last five (5) years of their service at the Company. The Defined Benefit Plan is financed by a collective financing fund with the Company’s insurance company, contributions by the Company of which are based on an actuarial calculation that takes into account assumptions of salary increase, inflation, interest rates, and other variables determined relevant by our actuaries. For the 2012 year, the Company’s contribution to such collective financing fund was calculated based on 8.515% of the aggregate salaries of all exempt employees multiplied by 1.1526 in order to account for taxes and other charges. The total average cost to the Company under the Defined Benefit Plan for 2012 was thus 9.8% of the respective NEO’s base salary. |
The Bonus Pension Plan behaves partly as a typical bonus plan and partly as a typical tax-qualified defined contribution plan. Each NEO receives 50% of his or her total benefit under the annual bonus plan as an annual cash bonus in April of every fiscal year following the certification of the Company’s audited financial statements. This portion of the benefit under the annual bonus plan is disclosed in the Summary
117
Table of Contents
Compensation Table. The remaining 50% of each NEO’s benefit under the annual bonus plan is deferred and accrued under the Bonus Pension Plan with interest at a rate of 3.25% in 2012 (such benefit, the “Accrued Pension Benefit”). This Accrued Pension Benefit is paid to the respective NEO upon, but not before, age 60, if such NEO is no longer employed with the Company, age 65, if such NEO opts to receive such Accrued Pension Benefit then, or at such later age as such NEO’s employment terminates with the Company, should he or she decide to continue to accrue benefits under the Bonus Pension Plan during their employment.
| (2) | For the Defined Benefit Plan, the number of years of employment equals the number of years of credited service for all NEOs. For the Bonus Pension Plan, participation is based on the individual’s grade level in the Company. |
| (3) | The normal retirement age under the Defined Benefit Plan is age 60. The Defined Benefit Plan is a Belgian plan and includes the Life Capital Benefit and the Orphan’s Pension, as previous mentioned in Footnote 5 of the Summary Compensation Table. The Life Capital Benefit is a contribution by the Company to a capital benefit that becomes payable upon the death of the NEO. The Orphan’s Pension is a contribution by the Company to a pension fund that becomes payable to the child of the NEO if such NEO has a child and the parent dies. Both the Life Capital Benefit and the Orphan’s Pension are part of the Defined Benefit Plan. The values provided in this column include (i) the accrued value that the Company has contributed under the Defined Benefit Plan as the retirement benefit for each NEO through the end of the 2012 fiscal year and (ii) the Accrued Pension Benefit under the Bonus Pension Plan, as described in Footnote 1 above. |
| (4) | The values provided in this column are the amounts that the Company paid in 2012 to finance the Defined Benefit Plan for each NEO. The calculation of such values is provided in Footnote 1 of the Pension Benefits Table. |
Employment Agreements
On December 31, 2009, we entered into employment agreements with each of our named executive officers, which provide for an indefinite term beginning on January 1, 2010. The employment agreements with each of Messrs. Lenoir, Decat, Vanneste, and Wouters (the “Executive Agreements”) provide for them to receive annual compensation equal to $372,476, $290,373, $224,610, and $203,529, respectively (having been increased on March 14, 2012 from $310,177, $263,980, $181,171 and $192,006 respectively). In addition, the executives are each eligible to earn a bonus under the Company’s annual bonus plan based on the achievement of specified business objectives, and a pension contribution under the Company’s pension scheme (to which the Company contributes an amount equal to 50% of the bonus that the respective executive earns under the annual bonus plan). The Executive Agreements specifically provide that the sum of the annual bonus and pension contribution is targeted at 40% of the executive’s annual base compensation for each of Messrs. Decat, Vanneste and Wouters and 50% of the executive’s annual base compensation for Mr. Lenoir. The Company also provides medical and other benefits to the executives under the Company’s benefits plans.
Generally, each of the Executive Agreements requires nine months’ advance written notice to terminate the agreement or payment in lieu of notice. If the Company terminates the executive without the requisite notice, the executive will be entitled to a lump sum payment on the date of termination of employment equal to the executive’s base monthly compensation for the notice period plus payments for continued coverage under the Company’s benefits plans. In the event the Executive Agreement is terminated by either party based on (i) a Material Breach (as defined in the employment agreement) that has not been cured within ten days of notice or (ii) the Company’s dissolution, bankruptcy, liquidation or insolvency or the executive’s bankruptcy or insolvency, the other party may terminate the agreement immediately without notice. Under the employment agreements, in the event that an executive suffers a disability, the Company will pay the executive his monthly base compensation and benefits for one month in addition to any benefits payable under the Company’s benefit plans.
The Executive Agreements also contain (i) a non-competition covenant that prohibits the executive from developing any activities or taking actions that are competitive to the Company’s business, (ii) a non-solicitation
118
Table of Contents
covenant that prohibits the executive from soliciting senior employees, directors or businesses similar to those being provided by the Company or inducing suppliers to cease or restrict their relationships with the Company, (iii) a confidentiality covenant that restricts the executive from using or disclosing confidential information related to the business or affairs of the Company and (iv) a covenant that prohibits the use of a trade name used by the Company. Each restrictive covenant applies during the term of the employment agreement and for two years thereafter. The Executive Agreements are governed by Belgium law.
Additionally, on September 1, 2000, we entered into an employment contract with Sabine Ketsman which provides for an indefinite term. The employment contract provides for an initial base salary of approximately $36,250 (which was equal to $172,405 for 2012) and sets forth certain restrictive covenants to which Ms. Ketsman is entitled, including restrictions on the disclosure of confidential information and assignment of work product. In addition, Ms. Ketsman’s employment contract provides that she will be subject to a 12 month non-competition covenant in exchange for an aggregate payment equal to 50% of her gross annual wages. Ms. Ketsman is also entitled to certain statutory benefits under Belgium law upon certain terminations of employment, as described in more detail under the section entitled “Termination, Change of Control and Severance Arrangements” below.
Termination, Severance and Change of Control Arrangements
The table below shows the potential severance payments for each named executive officer as of December 31, 2012. All payments are contingent on the executive’s termination of employment and/or the identified triggering events.
| Name and Triggering Event(1) |
Cash Severance Payment ($)(1) |
Accelerated Vesting of Stock-based Awards ($)(2) |
Continuation of Benefits and Perquisites ($)(3) |
Total ($) |
||||||||||||
| Laurent Lenoir |
||||||||||||||||
| Termination due to Death or Disability |
30,156 | 11,161 | 41,317 | |||||||||||||
| Termination by Company without Cause or due to Good Reason |
271,405 | 100,451 | 371,855 | |||||||||||||
| Change of Control Transaction and Termination by Company without Cause or due to Good Reason |
271,405 | 2,006,290 | 100,451 | 2,378,146 | ||||||||||||
| Change of Control Transaction without Termination |
||||||||||||||||
| Kurt Decat |
||||||||||||||||
| Termination due to Death or Disability |
23,832 | 8,873 | 32,704 | |||||||||||||
| Termination by Company without Cause or due to Good Reason |
214,484 | 79,856 | 294,340 | |||||||||||||
| Change of Control Transaction and Termination by Company without Cause or due to Good Reason |
214,484 | 1,823,954 | 79,856 | 2,118,294 | ||||||||||||
| Change of Control Transaction without Termination |
||||||||||||||||
| Piet Vanneste |
||||||||||||||||
| Termination due to Death or Disability |
18,197 | 12,425 | 30,623 | |||||||||||||
| Termination by Company without Cause or due to Good Reason |
163,775 | 111,829 | 275,604 | |||||||||||||
| Change of Control Transaction and Termination by Company without Cause |
163,775 | 1,413,515 | 111,829 | 1,689,119 | ||||||||||||
| Change of Control Transaction without Termination |
||||||||||||||||
| Guy Wouters |
||||||||||||||||
| Termination due to Death or Disability |
16,800 | 9,997 | 26,797 | |||||||||||||
| Termination by Company without Cause or due to Good Reason |
151,204 | 89,971 | 241,175 | |||||||||||||
| Change of Control Transaction and Termination by Company without Cause |
151,204 | 683,927 | 89,971 | 925,101 | ||||||||||||
| Change of Control Transaction without Termination |
||||||||||||||||
119
Table of Contents
| Name and Triggering Event |
Cash Severance Payment ($)(1) |
Accelerated Vesting of Stock-based Awards ($)(2) |
Continuation of Benefits and Perquisites ($)(3) |
Total ($) |
||||||||||||
| Sabine Ketsman |
||||||||||||||||
| Termination due to Death or Disability |
14,367 | 40,022 | 18,389 | |||||||||||||
| Termination by Company without Cause or due to Good |
215,507 | 60,330 | 275,836 | |||||||||||||
| Change of Control Transaction and Termination by Company without Cause(4) |
215,507 | 424,048 | 60,330 | 699,884 | ||||||||||||
| Change of Control Transaction without Termination |
||||||||||||||||
| (1) | For termination other than those due to Death, Disability, by the Company without Cause, Good Reason, or upon a Change in Control Transaction, NEOs will receive such benefits and payments as required by law. |
| (2) | Cash severance payments provided upon termination by the Company without Cause or due to Good Reason or upon a Change of Control transaction and termination without Cause or due to Good Reason for Messrs. Lenoir, Decat, Vanneste and Wouters, according to the Executive Agreements, represent nine (9) months of base salary payments, based on the nine (9)-month notice period, or payment in lieu thereof, required to terminate the NEOs. Cash severance payments provided upon termination due to death or disability for Messrs. Lenoir, Decat, Vanneste and Wouters, according to the Executive Agreements, represents one (1) month of base salary payments. Under Company policy, Ms. Ketsman is likewise entitled to one (1) month of base salary payments upon her death or disability. NEOs are not entitled to receive any gross-up payments upon a termination or a Change of Control. |
| (3) | The value of the accelerated vesting of stock-based awards provided for time-vesting options represents the per share fair market value of the Company’s stock on December 31, 2012 of $89.53 minus the adjusted exercise price of $54.99, multiplied by all time-vesting options held by each NEO. The value of the accelerated vesting of stock-based awards provided for performance-vesting options assumes maximum performance, (i.e., all performance-based options are assumed to vest in full). |
| (4) | The value of the continuation of benefits upon termination by the Company without Cause or due to Good Reason or upon a Change of Control transaction and termination without Cause or due to Good Reason for Messrs. Lenoir, Decat, Vanneste and Wouters represents nine (9) months of continued health and pension benefits, in accordance with the Executive Agreements. Because the value of future pension benefits is not determinable, the value of nine (9) months of continued pension benefits was calculated by taking 9/12 of the full 2012 pension benefits. The value of the continuation of benefits upon termination due to death of disability for Messrs. Lenoir, Decat, Vanneste and Wouters represents the value of one (1) month of continued health and pension benefits in accordance with the Executive Agreements. Ms. Ketsman is entitled to one (1) month of continued health and pension benefits under the Company’s general policies. Furthermore, the value of continued pension benefits provided, is based on the value of pension payments to the NEOs during the 2012 fiscal year. As provided in Footnote 5 below, Ms. Ketsman is entitled to a notice period of fifteen (15) months (or payment in lieu thereof) upon termination by the Company without Cause or due to Good Reason or upon a Change of Control transaction and termination without Cause or due to Good Reason (as part of such payments in lieu thereof, Ms. Ketsman receives continued health and pension benefits during the notice period). Such compensation during the notice period has been included in Ms. Ketsman’s termination benefits. |
| (5) | Under Belgian law, according to the Claeys Formula (described below), Ms. Ketsman is entitled to receive fifteen (15) months of notice of termination by the Company (or payment of base salary, bonus, and continued health and pension benefits in lieu thereof). The Claeys Formula takes into account the executive’s salary, the Company’s contribution to meal vouchers, pension plan, health benefits, the executive’s use of a Company car, the executive’s age and seniority and other Company-provided benefits. The value of the payments in lieu of this fifteen (15) month notice period has been provided because this benefit carries a higher value than the termination benefits provided under Ms. Ketsman’s employment agreement. Based upon the Belgian classification of employees, Ms. Ketsman is the only NEO who is entitled to statutory notice (or payment in lieu thereof) as provided by the Claeys Formula. |
120
Table of Contents
Under her employment agreement, Ms. Ketsman is entitled to half of her “gross wages” if she is terminated and if the Company chooses to enforce a one-year non-competition covenant. The Company may, however, opt to not enforce the non-competition covenant, in which case it is not obligated to pay any amount following termination of Ms. Ketsman’s employment. Ms. Ketsman would be entitled to $99,626, consisting of base salary and annual bonus. Because this amount is less than the amount that Ms. Ketsman would be provided according to the Claeys Formula, we have not included this amount in the Termination, Severance and Change in Control Arrangements table above because she is only entitled to receive the greater of such benefits.
Director Compensation
During 2012, following the Acquisition, our board of directors adopted a non-employee director compensation policy where (i) the annual retainer for each non-employee director that served on our board was equal to $40,000, and (ii) the annual retainer for the chairman was equal to $150,000. Non-employee director compensation is payable on the last business day prior to each calendar quarter during which each non-employee director serves on the board and is pro-rated for partial service during any calendar quarter.
| Name |
Fees earned or paid in cash ($) |
Stock Awards ($) |
Option Awards ($)(1) |
Non-equity incentive plan compensation ($) |
Change in pension value and nonqualified deferred compensation earnings |
All other compensation ($)(2) |
Total ($) |
|||||||||||||||
| Charles Shaver—Chairman of the BOD |
131,250 | 1,194,944 | 1,326,194 | |||||||||||||||||||
| Kenny Cordell |
35,000 | 44,290 | 79,290 | |||||||||||||||||||
| Marvin Schlanger |
35,000 | 44,290 | 79,290 | |||||||||||||||||||
| Pol Vanderhaeghen |
35,000 | 44,290 | 11,500 | 90,790 | ||||||||||||||||||
| Scott Kleinman |
44,290 | 44,290 | ||||||||||||||||||||
| Justin Stevens |
44,290 | 44,290 | ||||||||||||||||||||
| Sam Feinstein |
44,290 | 44,290 | ||||||||||||||||||||
| (1) | Mr. Shaver’s director fees, as the Chairman of the Company’s Board of Directors, is $150,000 annually. Messrs. Cordell, Schlanger and Vanderhaeghen receive an annual director fee of $40,000, and Messrs. Kleinman, Stevens and Feinstein do not receive a director fee. |
| (2) | The directors received options as follows: Kenny Cordell, Marvin Schlanger, Justin Stevens, Pol Vanderhaeghen, Scott Kleinman, Justin Stevens and Sam Feinstein each received 1,000 time-vesting options with a grant date fair value per option, computed in accordance with FASB ASC Topic 718, of $44.29; and Charlie Shaver received 26,980 time-vesting options with a grant date fair value per option of $44.29. |
| (3) | Prior to the Acquisition, Mr. Vanderhaeghen received an annual fee for his service on the board of directors of a predecessor of the Company of €50,000, which converts to $65,995 annually using the conversion rate from Euros to U.S. dollars on December 31, 2012, or $10,999, for the first two months of 2012. Mr. Vanderhaeghen additionally received the benefit of personal use of a Company-provided car, including fuel, leasing and other accompanying costs, and his benefit in kind, computation of which is described in Footnote 5 to the Summary Compensation Table, was $500.76. |
121
Table of Contents
Limitations of Liability and Indemnification Matters
We will adopt provisions in our amended and restated certificate of incorporation that limit the liability of our directors for monetary damages for breach of their fiduciary duties, except for liability that cannot be eliminated under the Delaware General Corporation Law. Delaware law provides that directors of a corporation will not be personally liable for monetary damages for breach of their fiduciary duties as directors, except liability for any of the following:
| • | any breach of their duty of loyalty to the corporation or its stockholders; |
| • | acts or omissions not in good faith or that involve intentional misconduct or a knowing violation of law; |
| • | unlawful payments of dividends or unlawful stock repurchases or redemptions as provided in Section 174 of the Delaware General Corporation Law; or |
| • | any transaction from which the director derived an improper personal benefit. |
This limitation of liability does not apply to liabilities arising under the federal securities laws and does not affect the availability of equitable remedies such as injunctive relief or rescission.
Our amended and restated certificate of incorporation and our amended and restated bylaws also will provide that we shall indemnify our directors and executive officers and may indemnify our other officers and employees and other agents to the fullest extent permitted by law. We believe that indemnification under our amended and restated bylaws covers at least negligence and gross negligence on the part of indemnified parties. Our amended and restated bylaws also permit us to secure insurance on behalf of any officer, director, employee or other agent for any liability arising out of his or her actions in this capacity, regardless of whether our amended and restated bylaws would permit indemnification.
122
Table of Contents
The following table shows information about the beneficial ownership of our common stock, as of July 23, 2012 by:
| • | each person known by us to beneficially own 5% or more of our outstanding common stock; |
| • | each of our directors and executive officers; and |
| • | all of our directors and executive officers as a group. |
For further information regarding material transactions between us and certain of our stockholders, see “Certain Relationships and Related Party Transactions.”
Upon completion of this offering, investment funds affiliated with Apollo will own, in the aggregate, approximately % of our common stock, assuming the underwriters do not exercise their option to purchase additional shares of our common stock. As a result, we will qualify as a “controlled company” within the meaning of the corporate governance rules of the .
| Common stock owned before the offering(1) |
Common stock owned after the offering | |||||||||||
| Name |
Number | Percentage | Number | Percentage | ||||||||
| Principal Stockholders: |
||||||||||||
| Apollo Funds(2) |
5,157,196 | 95.5 | % | |||||||||
| Executive Officers and Directors: |
||||||||||||
| Laurent Lenoir |
29,043 | * | ||||||||||
| Kurt Decat |
26,403 | * | ||||||||||
| Johan De Saegher |
26,403 | * | ||||||||||
| Randall Colin Gouveia |
822 | * | ||||||||||
| Guy Wouters |
19,802 | * | ||||||||||
| Piet Vanneste |
26,403 | * | ||||||||||
| Guy Van Den Bossche |
7,921 | * | ||||||||||
| Sabine Ketsman |
7,921 | * | ||||||||||
| Edward Yocum |
4,110 | * | ||||||||||
| Charlie Shaver |
5,000 | * | ||||||||||
| Kenny Cordell |
1,000 | * | ||||||||||
| Samuel Feinstein |
— | * | ||||||||||
| Scott Kleinman |
— | * | ||||||||||
| Marvin Schlanger |
1,000 | * | ||||||||||
| Justin Stevens |
— | * | ||||||||||
| Pol Vanderhaeghen |
3,000 | * | ||||||||||
| Executive Officers and Directors as a Group (16 persons) |
158,828 | 2.9 | % | |||||||||
| * | Less than 1% |
| (1) | The amounts and percentages of common stock beneficially owned are reported on the bases of regulations of the SEC governing the determination of beneficial ownership of securities. Under the rules of the SEC, a person is deemed to be a “beneficial owner” of a security if that person has or shares voting power, which includes the power to vote or direct the voting of such security, or investment power, which includes the power to dispose of or to direct the disposition of such security. Securities that can be so acquired are deemed to be outstanding for purposes of computing such person’s ownership percentage, but not for purposes of computing any other person’s percentage. Under these rules, more than one person may be deemed beneficial owner of the same securities and a person may be deemed to be a beneficial owner of securities as to which such person has no economic interest. Except as otherwise indicated in these footnotes, each of the beneficial owners has, to our knowledge, sole voting and investment power with respect to the indicated shares of common stock. |
123
Table of Contents
| (2) | The amount reported includes shares held of record by AP Taminco Global Chemical Holdings, L.P. (“Taminco Holdings”) and Taminco Co-Investors, L.P. (“Taminco Co-Investors,” together with Taminco Holdings, the “Apollo Funds”). AP Taminco Global Chemical Holdings GP, LLC (“Taminco Holdings GP”) is the general partner of Taminco Holdings, and Taminco Co-Investors GP, LLC (“Taminco Co-Investors GP”). Apollo Management VII, L.P. (“Management VII”) is the manager of each of Taminco Holdings GP and Taminco Co-Investors GP. AIF VII Management, LLC (“AIF VII LLC”) is the general partner of Management VII. Apollo Management, L.P. (“Apollo Management”) is the sole member and manager of AIF VII LLC, and Apollo Management GP, LLC (“Apollo Management GP”) is the general partner of Apollo Management. Apollo Management Holdings, L.P. (“Management Holdings”) is the sole member and manager of Apollo Management GP, and Apollo Management Holdings GP, LLC (“Management Holdings GP”) is the general partner of Management Holdings. Leon Black, Joshua Harris and Marc Rowan are the managers, as well as executive officers, of Management Holdings GP, and as such may be deemed to have voting and dispositive control over the shares of our common stock held by the Apollo Funds. The address of the Apollo Funds, Taminco Holdings GP, Taminco Co-Investors GP, Management VII, AIF VII LLC, Apollo Management, Apollo Management GP, Management Holdings and Management Holdings GP, and Messrs. Black, Harris and Rowan, is 9 West 57th Street, 43rd Floor, New York, New York 10019. The amount reported does not include shares of our common stock beneficially owned by certain of our directors, executive officers and other members of our management, for which Taminco Holdings has the power to cause the sale of such shares under certain circumstances pursuant to the management investor rights agreement. |
124
Table of Contents
CERTAIN RELATIONSHIPS AND RELATED PARTY TRANSACTIONS
Manager Investor Rights Agreement
In connection with the Acquisition, we and the Apollo Funds entered into an investor rights agreement with those members of management who co-invested alongside the Apollo Funds and/or received incentive equity awards in connection with the transaction, collectively referred to as the “Management Holders,” which govern certain aspects of the relationship between us, the Apollo Funds and the Management Holders. The investor rights agreement contains, among other matters:
| • | restrictions on the transfer of shares of our common stock and stock options by the Management Holders; |
| • | our and the Apollo Fund’s rights of first refusal to purchase our common stock within 30 days in the event of certain permitted transfers by the Management Holders; |
| • | rights of the Management Holders to participate on a proportionate basis in certain transfers of our common stock by the Apollo Funds other than to an affiliate; |
| • | agreement by the Management Holders to sell their shares of our common stock on a proportionate basis in connection with certain transfers of common stock by the Apollo Funds other than to an affiliate; |
| • | our and the Apollo Fund’s repurchase rights in the event of the termination of a Management Holder’s service relationship with us; |
| • | preemptive rights granted to the Management Holders to purchase common stock issued by us to the Apollo Funds in the amounts required to maintain each Management Holder’s percentage ownership of co-investment shares; and |
| • | right granted to Management Holders to participate on a pro rata basis in certain sales of common stock by the Apollo Funds in connection with a public offering (subject to an underwriters cutback). |
The investor rights agreement will terminate upon our dissolution or a disposition by the Apollo Funds following which a person or group other than the Apollo Funds or its affiliates possesses more than 50% of our voting power.
Management Consulting Agreement
In connection with the Acquisition, we and Taminco Finance Corporation (collectively, the “Taminco Parties”) entered into a management fee agreement (the “Management Consulting Agreement”) with Apollo Management VII, L.P. (“Apollo Management”), a subsidiary of Apollo, pursuant to which Apollo Management provides certain advisory services to us, our direct and indirect divisions and subsidiaries, parent entities and controlled affiliates (collectively, the “Company Group”). In connection with the provision of such services, Apollo Management is paid an annual fee of $3.9 million in consideration for services performed, which was prorated for the fiscal year of 2012 to cover only the period commencing on the date of the closing of the Acquisition and ending on December 31, 2012. The Management Consulting Agreement provides that Apollo Management will provide the advisory services for a twelve year period, with an automatic extension of the term for a one year period beginning at the end of such twelve year period and each year thereafter, unless notice by any party to the contrary is given. Apollo Management’s obligations to provide services under the Management Consulting Agreement will terminate automatically upon the change of control of the Company Group or a public offering of any class of equity securities of any member of the Company Group meeting certain criteria and, in each such case, Apollo Management will have the right to receive a lump-sum payment equal to the net present value of the remaining annual management fees owing and payable by the Taminco Parties until the expiration of the Management Consulting Agreement determined using an applicable discount rate. In addition, in the event that any member of the Company Group undertakes an acquisition or similar transaction, we are
125
Table of Contents
required to pay Apollo Management an additional transaction fee equal to 1.0% of the aggregate enterprise value of such transaction. Under the Management Consulting Agreement, we also agreed to indemnify Apollo Management and its affiliates and its and their respective limited partners, general partners, directors, members, officers, managers, employees, agents, advisors their directors, officers and representatives for potential losses relating to the services contemplated under the Management Consulting Agreement.
Transactions with Apollo Affiliates
We have entered into certain transactions in the normal course of business with Momentive Specialty Chemicals Inc., LyondellBassell Industries N.V. and their subsidiaries, which are owned by funds affiliated with Apollo, for the sale of our products. For the nine months ended September 30, 2012, we recognized net sales related to these transactions of $5 million comprised of approximately $4.4 million in sales to Lyondell Bassell and its subsidiaries and approximately $0.5 million to Momentive Specialty Chemicals Inc. and its subsidiaries.
Indemnification
Our officers and directors under our certificate of incorporation and bylaws are indemnified and held harmless against any and all claims alleged against any of them in their official capacities to the fullest extent authorized by the Delaware General Corporation Law (“DGCL”) as it exists today or as it may be amended but only to the extent that such amendment permits the Company to provide broader indemnification rights than previously permitted.
Policies and Procedures With Respect to Related Party Transactions
Upon completion of this offering, we intend to adopt a formal written policy for the review, approval or ratification of transactions with related persons.
126
Table of Contents
Senior Secured Credit Facilities
General
In connection with the Acquisition, our subsidiary, Taminco Finance Corporation entered into the Senior Secured Credit Facilities with Citigroup Global Markets Inc., Credit Suisse Securities (USA) LLC, Nomura Securities International, Inc., UBS Securities LLC, Deutsche Bank Securities Inc. and Goldman Sachs Lending Partners LLC, as the joint lead arrangers, and an affiliate of Citigroup Global Markets Inc., as administrative agent and collateral agent.
The Senior Secured Credit Facilities consist of a revolving credit facility and term loan facility. The term loan facility has a principal amount of $504 million, which includes a $350 million tranche in U.S. Dollars and a tranche in an amount in Euros equivalent to $154 million. As of September 30, 2012, the total outstanding amount on the term loan facility was $502 million, which included $348 million outstanding under the U.S. Dollar tranche and $154 million outstanding under the Euro tranche. The revolving credit facility has a principal amount of $194 million and includes borrowing capacity available for letters of credit and for borrowings on same-day notice, referred to as swingline loans. Subject to covenant compliance and certain conditions, our Senior Secured Credit Facilities permit additional, but uncommitted, loans of up to $163 million plus such additional amount as may be incurred without causing the net first lien leverage ratio to exceed 2.75 to 1.00. The borrowings under the revolving credit facility are U.S. Dollar or Euro-denominated, at our option. As a result, to the extent we choose to borrow in Euros, the availability under our new revolving credit facility will depend upon the prevailing exchange rate.
The revolving credit facility matures on February 15, 2017, and the term loan facility matures on February 15, 2019. To facilitate syndication, the agents are allowed to modify certain terms of our senior credit facilities within certain parameters under certain circumstances.
Commencing with the last day of the first full quarter ending after the closing of the acquisition, the term loan facility will amortize in equal quarterly installments in an amount equal to 1.00% per annum of the original principal amount thereof, with the remaining balance due at final maturity.
Under the revolving credit facility, we must maintain a maximum net first lien coverage ratio of 3.75 to 1.00, tested quarterly and upon each credit extension. The test is applicable only if we have indebtedness under the revolving credit facility or if more than $20 million of letters of credit that are not cash-collateralized are outstanding.
The obligations under the Senior Secured Credit Facilities are guaranteed by Taminco Intermediate Corporation and certain current and future direct and indirect wholly owned subsidiaries of Taminco Finance Corporation and exclude, among other subsidiaries, (i) subsidiaries designated as unrestricted, (ii) certain immaterial subsidiaries, (iii) any subsidiary that is prohibited by applicable law or contractual obligation existing on the closing date of the initial borrowing from guaranteeing the Senior Secured Credit Facilities or which would require governmental approval to provide a guarantee, unless such approval has already been received, (iv) any non-U.S. subsidiary other than non-U.S. subsidiaries that are organized under the laws of certain specific jurisdictions, (v) any subsidiary for which the providing of a guarantee could reasonably be expected to result in an adverse tax consequence to the Issuer or any of its subsidiaries, as determined in good faith by the Issuer, (vi) not-for-profit subsidiaries, if any, and (vii) any non-U.S. subsidiary for which the providing of a guarantee could reasonably be expected to result in any violation or breach of, or conflict with, fiduciary duties of such subsidiary’s officers, directors or managers. Non-U.S. guarantees will also be subject to applicable maintenance of capital, corporate benefit, financial assistance and other similar laws, rules and regulations, and subsidiaries may be excluded from guaranteeing the Senior Secured Credit Facilities if Taminco Finance Corporation and the
127
Table of Contents
administrative agent reasonably agree that the cost of providing such guarantee is excessive in relation to the value afforded thereby. The guarantors include our subsidiaries organized under the laws of Luxembourg, Belgium, Germany and the United States.
Security Interests
The borrowings under the Senior Secured Credit Facilities, all guarantees thereof and, at Taminco Finance Corporation’s option, its obligations under specified hedging agreements and certain cash management obligations provided by any lender party to the Senior Secured Credit Facilities or any of its affiliates will be secured by a first priority lien on substantially all of the assets of the borrower and each guarantor, including: (i) all of Taminco Finance Corporation’s capital stock and all of the capital stock or other equity interests held by it, Taminco Intermediate Corporation and each of Taminco Finance Corporation’s existing and future subsidiary guarantors (subject to certain exceptions as set forth in the credit agreement); and (ii) substantially all of Taminco Finance Corporation’s and Taminco Intermediate Corporation’s tangible and intangible assets and the tangible and intangible assets of each of Taminco Finance Corporation’s existing and future subsidiary guarantors, with certain exceptions as set forth in the credit agreement and other loan documents.
Interest Rates and Fees
Borrowings under the Senior Secured Credit Facilities bear interest at a rate equal to the applicable margin plus, at the borrower’s option, either: (i) a base rate determined by reference to the higher of (a) the prime lending rate announced by the administrative agent as its prime rate in effect at its principal office in New York City, (b) the federal funds rate effective from time to time plus 0.50% per annum and (c) one-month Adjusted LIBOR rate plus 1.00% per annum; or (ii) (a) the Adjusted LIBOR rate, determined by reference to the higher of (x) the rate for Eurodollar deposits for the relevant interest period and (y) a floor of 1.25% per annum or (b) in the case of revolving loans funded in Euros, the EURIBOR rate, determined by reference to the higher of (x) the rate for the relevant interest period and (y) a floor of 1.25% per annum.
The applicable margin on the U.S. Dollar tranche is 4.00% per annum for LIBOR rates loans and 3.00% per annum for base rate loans. The applicable margin on the Euro tranche is 4.25% per annum for LIBOR rates loans and 3.25% per annum for base rate loans. The applicable margin is subject to change depending on our net first lien leverage ratio.
The borrower also pays the lenders a commitment fee on the unused commitments under our revolving credit facility, which is payable quarterly in arrears. The commitment fee is 0.50% per annum, subject to change depending on the net first lien leverage ratio.
Mandatory and Optional Repayment
Subject to exceptions for reinvestment of proceeds and other exceptions and materiality thresholds, Taminco Finance Corporation is required to prepay outstanding loans under with the net proceeds of certain asset dispositions and the incurrence of certain debt (to the extent not permitted under the new senior credit facilities), and 50% of excess cash flow, subject to reduction to 25% and 0% if certain net first lien leverage ratios are met.
Taminco Finance Corporation may voluntarily prepay loans or reduce commitments under, in whole or in part, subject to minimum amounts. If Adjusted LIBOR rate loans are prepaid other than at the end of an applicable interest period, Taminco Finance Corporation is required to reimburse lenders for their losses or expenses sustained as a result of such prepayment.
Covenants
The Senior Secured Credit Facilities contain negative and affirmative covenants affecting Taminco Finance Corporation and its existing and future restricted subsidiaries, with certain exceptions set forth in the credit agreement. The negative covenants and restrictions include, among others: limitations on dispositions of assets,
128
Table of Contents
restrictions on liens, debt, dividends, distributions and other restricted payments, redemptions and stock repurchases, mergers and acquisitions, prepayments of subordinated, junior lien and certain unsecured debt, investments, loans, advances, changes in business, changes in fiscal year, restrictive agreements with subsidiaries, transactions with affiliates, sale/leaseback transactions, modifications to organizational documents and documents governing subordinated debt, junior secured debt and certain unsecured debt, passivity covenant applicable to Taminco Intermediate Corporation, and a maximum net first lien leverage ratio applicable to the revolving facility only.
The affirmative covenants include, among others: maintenance of corporate existence and rights; performance and payment of obligations; delivery of consolidated financial statements and an annual budget; delivery of notices of default, U.S. Employee Retirement Income Security Act of 1974, as amended (“ERISA”) events, material litigation and material adverse change; maintenance of properties in good working order; maintenance of books and records; maintenance of customary insurance; commercially reasonable efforts to maintain ratings, but not a specific rating; compliance with laws; inspection of books and properties; environmental; additional guarantors and additional collateral; further assurances in respect of collateral matters; use of proceeds; payment of taxes; and quarterly lender calls.
Events of Default
Events of default include, among others: nonpayment of principal, interest or other amounts; violation of covenants; incorrectness of representations and warranties in any material respect; cross default and cross acceleration; bankruptcy and similar events; material judgments; ERISA events; actual or asserted invalidity of guarantees or security documents in each case representing a material portion of the guarantees or the collateral; and change of control.
Second-Priority Senior Secured Notes
As part of the Acquisition, Taminco Finance Corporation issued $400 million aggregate principal amount of second-priority senior secured notes due 2020. The 2020 Notes mature on March 31, 2020 and bear interest at a rate of 9.750% per annum. Interest is payable semi-annually on each March 31 and September 30.
The 2020 Notes are guaranteed fully and unconditionally on a second-priority senior secured basis by Taminco Intermediate Corporation and each of Taminco Finance Corporation’s existing and future subsidiaries that guarantee the Senior Secured Credit Facilities. The 2020 Notes are secured on a second-priority basis by the assets that secure the obligations under the Senior Secured Credit Facilities, subject to certain exceptions and permitted liens.
Taminco Finance Corporation may, at its option, redeem the 2020 Notes prior to March 31, 2015 at a redemption price equal to 100% of the principal amount of the 2020 Notes redeemed plus an applicable “make-whole” premium, plus accrued and unpaid interest, if any, to the redemption date. The 2020 Notes may also be redeemed on or after March 31, 2015, in whole or in part, at the redemption price set forth in the indenture plus accrued and unpaid interest, if any, to the redemption date. In addition, upon certain events constituting a change of control, the issuer must offer to repurchase all outstanding 2020 Notes at a purchase price equal to 101% of the aggregate principal amount, plus accrued and unpaid interest to the date of purchase.
The 2020 Notes contain customary covenants including, among others: restrictions on incurrence or guarantees of additional indebtedness; restrictions on certain payments, including dividends or other distributions; restrictions on certain investments; agreements that restrict the restricted subsidiary’s ability to pay dividends; transfer or sell off of assets; transactions with affiliates; liens on assets to secure indebtedness; or merger or consolidation with or into another company. In the event the 2020 Notes receive investment grade ratings from Standard & Poor’s Rating Group and Moody’s Investors Service, Inc. and no default has occurred or is continuing under the indenture, the limitations on incurrence of indebtedness, restricted payments, dividends, asset sales, affiliate transactions and the ratio requirement of the merger and acquisition covenant will no longer be applicable.
129
Table of Contents
Senior PIK Toggle Notes
On December 18, 2012, we issued $250 million aggregate principal amount of Senior PIK Toggle Notes due 2017. The PIK Toggle Notes mature on December 15, 2017. The initial interest payment on the PIK Toggle Notes will be payable in cash (“Cash Interest”). With respect to each interest payment thereafter (other than the final interest payment made at stated maturity, which will be paid in cash), we will be required to pay interest on the PIK Toggle Notes entirely in cash unless certain conditions are satisfied, in which case we will be entitled to pay interest with respect to such interest period by increasing the principal amount of the PIK Toggle Notes or issuing new notes (such increase or issuance being referred to as “PIK Interest”). Cash Interest will accrue on the PIK Toggle Notes at the rate of 9.125% per annum, while PIK Interest will accrue at the rate of 9.875% per annum. Interest is payable semi-annually on each of June 15 and December 15.
We may, at our option, redeem the PIK Toggle Notes prior to December 15, 2013 at a redemption price equal to 100% of the aggregate principal amount of the PIK Toggle Notes to be redeemed plus the applicable “make-whole” premium, plus accrued and unpaid interest. The PIK Toggle Notes may be redeemed on or after December 15, 2013, in whole or in part, at the redemption price set forth in the indenture, plus accrued and unpaid interest. In addition, we may redeem up to 100% of the PIK Toggle Notes using the net proceeds from certain equity offerings at a redemption price of 102% of the principal amount thereof, plus accrued and unpaid interest. Upon certain events constituting a change of control, we must offer to repurchase all outstanding PIK Toggle Notes at a purchase price equal to 101% of the aggregate principal amount, plus accrued and unpaid interest to the date of purchase.
The indenture governing the PIK Toggle Notes contains customary covenants including, among others: restrictions on incurrence or guarantees of additional indebtedness; restrictions on certain payments, including dividends or other distributions; restrictions on certain investments; agreements that restrict the restricted subsidiary’s ability to pay dividends; transfer or sell off of assets; transactions with affiliates; liens on assets to secure indebtedness; or merger or consolidation with or into another company. In the event the PIK Toggle Notes receive investment grade ratings from Standard & Poor’s Rating Group and Moody’s Investors Service, Inc. and no default has occurred or is continuing under the indenture, the limitations on incurrence of indebtedness, restricted payments, dividends, asset sales, affiliate transactions and the ratio requirement of the merger and acquisition covenant will no longer be applicable.
Non-recourse Factoring Facility Agreement
We and Fortis Commercial Finance NV (“Fortis”) entered into the factoring facility agreements on July 31, 2007, effective as of August 24, 2007, to provide better security for the payment of all our existing and future receivables and to manage fluctuations in working capital. On October 24, 2012, the parties extended the initial term of the agreements to June 30, 2015. After the initial term, the agreements will automatically renew for consecutive renewal periods of one year each unless terminated by us or Fortis with a one-year notice period. Under the terms of the agreements, we assigned and transferred certain of Taminco BVBA’s accounts receivable and the accounts receivable of our U.S. subsidiaries, Taminco Inc., Taminco Methylamines Inc. and Taminco Higher Amines Inc., to Fortis, as factor. In December 2010, Taminco Inc. and Taminco Higher Amines Inc. were merged into Taminco Methylamines Inc., and the surviving entity then changed its name to Taminco Inc. The Non-recourse Factoring Facility does not apply to receivables in our subsidiaries in Germany, Italy, China, Brazil, Mexico and certain of our Belgian subsidiaries. The costs associated with the Non-recourse Factoring Facility consist of three parts: a commission fee on the factored receivables, certain start-up and registration costs and an interest charge on the amount drawn under the facility. The commission fee and interest charge for the year ended December 31, 2011 were $0.9 million and $0.6 million, respectively, and for the nine months ended September 30, 2012 were $0.6 million and $0.3 million, respectively. At September 30, 2012, $97 million was drawn under the Non-recourse Factoring Facility and $75 million was drawn at December 31, 2011.
130
Table of Contents
The following is a description of the material terms of our amended and restated certificate of incorporation and amended and restated bylaws as each will be in effect as of the consummation of this offering, and of specific provisions of Delaware law. The following description is intended as a summary only and is qualified in its entirety by reference to our amended and restated certificate of incorporation, our amended and restated bylaws and the DGCL.
General
Pursuant to our amended and restated certificate of incorporation, our capital stock will consist of authorized shares, of which shares, par value $0.001 per share, will be designated as “common stock” and shares, par value $0.001 per share, will be designated as “preferred stock.” Immediately following the completion of this offering, we will have shares of common stock outstanding. There will be no shares of preferred stock outstanding immediately following this offering.
Common Stock
Voting Rights. The holders of our common stock are entitled to one vote per share on all matters submitted for action by the stockholders.
Dividend Rights. Subject to any preferential rights of any then outstanding preferred stock, all shares of our common stock are entitled to share equally in any dividends our board of directors may declare from legally available sources.
Liquidation Rights. Upon our liquidation or dissolution, whether voluntary or involuntary, after payment in full of the amounts required to be paid to holders of any the outstanding preferred stock, all shares of our common stock are entitled to share equally in the assets available for distribution to stockholders after payment of all of our prior obligations.
Other Matters. Holders of our common stock have no preemptive or conversion rights, and our common stock are not subject to further calls or assessments by us.
Preferred Stock
Pursuant to our amended and restated certificate of incorporation, shares of preferred stock will be issuable from time to time, in one or more series, with the designations of the series, the voting rights of the shares of the series (if any), the powers, preferences and relative, participation, optional or other special rights (if any), and any qualifications, limitations or restrictions thereof as our board of directors from time to time may adopt by resolution (and without further stockholder approval), subject to certain limitations. Each series will consist of that number of shares as will be stated and expressed in the certificate of designations providing for the issuance of the stock of the series. All shares of any one series of preferred stock will be identical.
Composition of Board of Directors; Election and Removal of Directors
In accordance with our amended and restated certificate of incorporation and our amended and restated bylaws, the number of directors comprising our board of directors will be determined from time to time by our board of directors, and only a majority of the board of directors may fix the number of directors. We intend to avail ourselves of the “controlled company” exception under the rules, which exempt us from certain requirements, including the requirements that we have a majority of independent directors on our board of directors and that we have compensation and nominating and corporate governance committees composed entirely of independent directors. We will, however, remain subject to the requirement that we have an audit committee composed entirely of independent members.
131
Table of Contents
Upon the closing of this offering, it is anticipated that we will have directors. Our amended and restated bylaws will provide that our board of directors is divided into three classes of directors, with the classes to be as nearly equal in number as possible. As a result, approximately one-third of our board of directors will be elected at the annual meeting of stockholders, with such elections decided by plurality vote, each year. The classification of directors has the effect of making it more difficult for stockholders to change the composition of our board of directors. Each director is to hold office until his successor is duly elected and qualified or until his earlier death, resignation or removal. Any vacancies on our board of directors may be filled only by the affirmative vote of a majority of the remaining directors, although less than a quorum. Our amended and restated certificate of incorporation will provide that stockholders do not have the right to cumulative votes in the election of directors. At any meeting of our board of directors, except as otherwise required by law, a majority of the total number of directors then in office will constitute a quorum for all purposes.
Special Meetings of Stockholders
Our amended and restated bylaws will provide that special meetings of the stockholders may be called only by the board of directors, chairman, president or secretary, and only proposals included in the Company’s notice may be considered at such special meetings.
Certain Corporate Anti-takeover Provisions
Certain provisions in our amended and restated certificate of incorporation and amended and restated bylaws summarized below may be deemed to have an anti-takeover effect and may delay, deter or prevent a tender offer or takeover attempt that a stockholder might consider to be in its best interests, including attempts that might result in a premium being paid over the market price for the shares held by stockholders.
Preferred Stock
Our amended and restated certificate of incorporation will contain provisions that permit our board of directors to issue, without any further vote or action by stockholders, shares of preferred stock in one or more series and, with respect to each such series, to fix the number of shares constituting the series and the designation of the series, the voting rights (if any) of the shares of the series, and the powers, preference sand relative, participation, optional and other special rights, if any, and any qualifications, limitations or restrictions, of the shares of such series. See “—Preferred Stock.”
Classified Board; Number of Directors
Our amended and restated certificate of incorporation and amended and restated bylaws will provide that our board of directors is divided into three classes of directors, with the classes to be as nearly equal in number as possible, and the number of directors on our board of directors may be fixed only by the majority of our board of directors, as described above in “—Composition of Board of Directors; Election and Removal of Directors.”
Removal of Directors; Vacancies
Our stockholders will be able to remove directors only for cause upon the affirmative vote of the holders of a majority of the outstanding shares of our capital stock entitled to vote in the election of directors. Vacancies on our board of directors may be filled only by a majority of our board of directors, although less than a quorum.
No Cumulative Voting
Our amended and restated certificate of incorporation will provide that stockholders do not have the right to cumulative votes in the election of directors. Cumulative voting rights would have been available to our stockholders if our amended and restated certificate of incorporation had not negated cumulative voting.
132
Table of Contents
No Stockholder Action by Written Consent; Calling of Special Meetings of Stockholders
Our amended and restated bylaws will not permit stockholder action without a meeting by consent if less than 50.1% of our outstanding common stock is beneficially owned by Apollo Funds. Our amended and restated bylaws will also provide that special meetings of the stockholders may be called only by the board of directors, chairman, president or secretary, and only proposals included in the Company’s notice may be considered at such special meetings.
Advance Notice Requirements for Stockholder Proposals and Director Nominations
Our amended and restated bylaws will provide that stockholders seeking to bring business before an annual meeting of stockholders, or to nominate candidates for election as directors at an annual meeting of stockholders, must provide timely notice thereof in writing. To be timely, a stockholder’s notice generally will have to be delivered to and received at our principal executive offices not less than 90 days nor more than 120 days prior to the first anniversary of the preceding year’s annual meeting; provided, that in the event that the date of such meeting is advanced more than 30 days prior to, or delayed by more than 30 days after, the anniversary of the preceding year’s annual meeting of our stockholders, a stockholder’s notice to be timely will have to be so delivered not earlier than the close of business on the 120th day prior to such meeting and not later than the close of business on the later of the 90th day prior to such meeting or the 10th day following the day on which public announcement of the date of such meeting is first made. Our amended and restated bylaws will also specify certain requirements as to the form and content of a stockholder’s notice. These provisions may preclude stockholders from bringing matters before an annual meeting of stockholders or from making nominations for directors at an annual meeting of stockholders.
All the foregoing proposed provisions of our amended and restated certificate of incorporation and amended and restated bylaws could discourage potential acquisition proposals and could delay or prevent a change in control. These provisions are intended to enhance the likelihood of continuity and stability in the composition of the Board of Directors and in the policies formulated by the Board of Directors and to discourage certain types of transactions that may involve an actual or threatened change of control. These same provisions may delay, deter or prevent a tender offer or takeover attempt that a stockholder might consider to be in its best interest. In addition, such provisions could have the effect of discouraging others from making tender offers for our shares and, as a consequence, they also may inhibit fluctuations in the market price of our Class A common stock that could result from actual or rumored takeover attempts. Such provisions also may have the effect of preventing changes in our management.
Delaware Takeover Statute
Our amended and restated certificate of incorporation will provide that we are not governed by Section 203 of the DGCL which, in the absence of such provisions, would have imposed additional requirements regarding mergers and other business combinations.
Corporate Opportunity
Our amended and restated certificate of incorporation will provide that no officer or director of ours who is also an officer, director, employee, managing director or other affiliate of Apollo will be liable to us or our stockholders for breach of any fiduciary duty by reason of the fact that any such individual directs a corporate opportunity to Apollo instead of us, or does not communicate information regarding a corporate opportunity to us that the officer, director, employee, managing director or other affiliate has directed to Apollo.
Amendment of Our Certificate of Incorporation
Under Delaware law, our amended and restated certificate of incorporation will provide that it may be amended only with the affirmative vote of a majority of the outstanding stock entitled to vote thereon; provided that Apollo’s prior written consent is required for any amendment, modification or repeal of the provisions discussed above regarding the ability of Apollo-related directors to direct or communicate corporate opportunities to Apollo.
133
Table of Contents
Amendment of Our Bylaws
Our amended and restated bylaws will provide that they can be amended by the vote of the holders of shares constituting a majority of the voting power or by the vote of a majority of the board of directors.
Limitation of Liability and Indemnification
Our amended and restated certificate of incorporation will limit the liability of our directors to the maximum extent permitted by Delaware law. Delaware law provides that directors will not be personally liable for monetary damages for breach of their fiduciary duties as directors, except liability:
| • | for any breach of their duty of loyalty to the corporation or its stockholders; |
| • | for acts or omissions not in good faith or which involve intentional misconduct or a knowing violation of laws; |
| • | under Section 174 of the DGCL (governing distributions to stockholders); or |
| • | for any transaction from which the director derived an improper personal benefit. |
However, if the DGCL is amended to authorize corporate action further eliminating or limiting the personal liability of directors, then the liability of our directors will be eliminated or limited to the fullest extent permitted by the DGCL, as so amended. The modification or repeal of this provision of our amended and restated certificate of incorporation will not adversely affect any right or protection of a director existing at the time of such modification or repeal.
Our amended and restated certificate of incorporation will provide that we will, to the fullest extent from time to time permitted by law, indemnify our directors and officers against all liabilities and expenses in any suit or proceeding, arising out of their status as an officer or director or their activities in these capacities. We will also indemnify any person who, at our request, is or was serving as a director, officer or employee of another corporation, partnership, joint venture, trust or other enterprise. We may, by action of our board of directors, provide indemnification to our employees and agents within the same scope and effect as the foregoing indemnification of directors and officers.
The right to be indemnified will include the right of an officer or a director to be paid expenses in advance of the final disposition of any proceeding, provided that, if required by law, we receive an undertaking to repay such amount if it will be determined that he or she is not entitled to be indemnified.
Our board of directors may take such action as it deems necessary to carry out these indemnification provisions, including adopting procedures for determining and enforcing indemnification rights and purchasing insurance policies. Our board of directors may also adopt bylaws, resolutions or contracts implementing indemnification arrangements as may be permitted by law. Neither the amendment nor the repeal of these indemnification provisions, nor the adoption of any provision of our amended and restated certificate of incorporation inconsistent with these indemnification provisions, will eliminate or reduce any rights to indemnification relating to their status or any activities prior to such amendment, repeal or adoption.
We believe these provisions will assist in attracting and retaining qualified individuals to serve as directors.
Listing
We intend to apply to list our shares of common stock on the under the symbol “ .”
Transfer Agent and Registrar
The transfer agent and registrar for our common stock will be .
134
Table of Contents
SHARES ELIGIBLE FOR FUTURE SALE
Prior to this offering, there has been no public market for our common stock, and no predictions can be made about the effect, if any, that market sales of shares of our common stock or the availability of such shares for sale will have on the market price prevailing from time to time. Nevertheless, the actual sale of, or the perceived potential for the sale of, our common stock in the public market may have an adverse effect on the market price for the common stock and could impair our ability to raise capital through future sales of our securities. See “Risk Factors—Risks Relating to this Offering and Ownership of Our Common Stock—Future sales of our common stock, or the perception in the public markets that these sales may occur, may depress our stock price.”
Sale of Restricted Shares
Upon completion of this offering, we will have an aggregate of shares of our common stock outstanding. Of these shares, the shares of our common stock to be sold in this offering and shares will be freely tradable without restriction or further registration under the Securities Act, except for any shares which are held or may be acquired by any of our “affiliates” as that term is defined in Rule 144 under the Securities Act, which will be subject to the resale limitations of Rule 144. The remaining shares of our common stock outstanding will be restricted securities, as that term is defined in Rule 144, and may in the future be sold without restriction under the Securities Act to the extent permitted by Rule 144 or any applicable exemption under the Securities Act.
Equity Incentive Plan
After the completion of this offering, we intend to file one or more registration statements on Form S-8 under the Securities Act covering shares of our common stock reserved for issuance under our equity incentive plan. As of the date of this prospectus, we have granted options to purchase shares of our common stock, of which shares are vested and exercisable. Accordingly, shares of our common stock registered under any such registration statement will be available for sale in the open market upon exercise by the holders, subject to vesting restrictions, Rule 144 limitations applicable to our affiliates and the contractual lock-up provisions described below.
Lock-up Agreements
We and our executive officers, directors and certain of our other existing securityholders, including the Apollo Funds, have agreed not to directly or indirectly, sell or dispose of any shares of our common stock for a period of days from the date of this prospectus, subject to certain exceptions, without the prior written consent of the underwriters. See “Underwriting” for a description of these lock-up provisions.
Rule 144
In general, under Rule 144 under the Securities Act, a person, or persons whose shares are aggregated, who is not deemed to have been an affiliate of ours at any time during the three months preceding a sale, and who has beneficially owned restricted securities within the meaning of Rule 144 for at least six months, including any period of consecutive ownership of preceding non-affiliated holders, would be entitled to sell those shares, subject only to the availability of current public information about us. A non-affiliated person who has beneficially owned restricted securities within the meaning of Rule 144 for at least one year would be entitled to sell those shares without regard to the provisions of Rule 144.
A person, or persons whose shares are aggregated, who is deemed to be an affiliate of ours and who has beneficially owned restricted securities within the meaning of Rule 144 for at least six months would be entitled to sell within any three-month period a number of shares that does not exceed the greater of one percent of the
135
Table of Contents
then outstanding shares of our common stock or the average weekly trading volume of our common stock during the four calendar weeks preceding such sale. Such sales are also subject to certain manner of sale provisions, notice requirements and the availability of current public information about us.
Rule 701
In general, under Rule 701 of the Securities Act, an employee, consultants or advisors who purchases shares of our common stock from us in connection with a compensatory stock or option plan or other written agreement is eligible to resell those shares 90 days after the effective date of the registration statement of which this prospectus forms a part in reliance on Rule 144, but without compliance with some of the restrictions, including the holding period, contained in Rule 144.
Registration Rights
Pursuant to the Management Investor Rights Agreement, we have granted the Apollo Funds and certain of our Management Holders incidental registration rights, in each case, with respect to an aggregate of shares of common stock owned by them. See “Certain Relationships and Related Party Transactions—Management Investor Rights Agreement.”
136
Table of Contents
MATERIAL U.S. FEDERAL TAX CONSIDERATIONS FOR NON-U.S. HOLDERS
The following is a general discussion of material U.S. federal income tax considerations for “non-U.S. holders,” as defined below, of the ownership and disposition of shares of our common stock. This discussion deals only with shares of common stock purchased in this offering that are held as capital assets (generally, property held for investment) by a non-U.S. holder.
For purposes of this discussion, a “non-U.S. holder” means a beneficial owner of shares of our common stock that, for U.S. federal income tax purposes, is not any of the following:
| • | an individual who is a citizen or resident of the United States; |
| • | a corporation (or any other entity treated as a corporation for U.S. federal income tax purposes) created or organized in or under the laws of the United States, any state thereof or the District of Columbia; |
| • | any entity or arrangement treated as a partnership for U.S. federal income tax purposes (or an investor in such an entity or arrangement); |
| • | an estate the income of which is subject to U.S. federal income taxation regardless of its source; or |
| • | a trust if it (1) is subject to the primary supervision of a court within the United States and one or more U.S. persons have the authority to control all substantial decisions of the trust or (2) has a valid election in effect under applicable U.S. Treasury regulations to be treated as a U.S. person for U.S. federal income tax purposes. |
This discussion is based upon provisions of the U.S. Internal Revenue Code of 1986, as amended, or the “Code,” U.S. Treasury regulations promulgated under the Code, rulings and other administrative pronouncements, and judicial decisions, all as of the date hereof. These authorities are subject to different interpretations and may be changed, perhaps retroactively, so as to result in U.S. federal income tax consequences different from those summarized below. This discussion does not address all aspects of U.S. federal income taxation, nor does it address any aspects of the unearned income Medicare contribution tax enacted pursuant to the Health Care and Education Reconciliation Act of 2010. In addition, this discussion does not address all aspects of U.S. federal income taxation that may be relevant to non-U.S. holders in light of their particular circumstances or that may be applicable to non-U.S. holders that may be subject to special treatment under U.S. federal income tax laws (including a non-U.S. holder that is a U.S. expatriate, a bank or other financial institution, an insurance company, a tax-exempt organization, a broker, dealer, or trader in securities or currencies, a “controlled foreign corporation,” a “passive foreign investment company,” a person who acquired shares of our common stock as compensation or otherwise in connection with the performance of services, or a person who holds shares of our common stock as part of a straddle, hedge, conversion transaction, synthetic security or other integrated investment). Moreover, this discussion does not address U.S. federal tax laws other than those pertaining to the U.S. federal income tax, nor does it address any aspects of U.S. state or local or non-U.S. taxes. We cannot assure you that a change in law will not alter significantly the tax considerations described in this discussion.
We have not and will not seek any rulings from the U.S. Internal Revenue Service, or the “IRS,” regarding the matters discussed below. There can be no assurance that the IRS will not take positions concerning the tax consequences of the ownership or disposition of shares of our common stock that differ from those discussed below.
If any entity or arrangement treated as a partnership for U.S. federal income tax purposes holds shares of our common stock, the tax treatment of a partner generally will depend upon the status of the partner and the activities of the partner and the partnership. If you are a partner of a partnership holding shares of our common stock, you should consult your tax advisors.
This discussion is for general information only and is not intended to constitute a complete description of all U.S. federal income tax consequences for non-U.S. holders relating to the ownership and disposition
137
Table of Contents
of shares of our common stock. If you are considering the purchase of shares of our common stock, you should consult your tax advisors concerning the particular U.S. federal income tax consequences to you of the ownership and disposition of shares of our common stock, as well as the consequences to you arising under the laws of any other applicable taxing jurisdiction in light of your particular circumstances.
Dividends
In general, cash distributions on shares of our common stock held by a non-U.S. holder will constitute dividends for U.S. federal income tax purposes to the extent paid from our current or accumulated earnings and profits, as determined under U.S. federal income tax principles. To the extent any such distributions exceed both our current and our accumulated earnings and profits, they will first be treated as a return of capital reducing the non-U.S. holder’s tax basis in our common stock, but not below zero, and thereafter, will be treated as gain from the sale of stock, the treatment of which is discussed under “Gain on Disposition of Shares of Common Stock.”
As discussed under “Dividend Policy” above, we do not currently expect to pay dividends. In the event that we do pay dividends, dividends paid to a non-U.S. holder generally will be subject to a U.S. withholding tax at a 30% rate, or such lower rate as may be specified by an applicable income tax treaty. However, dividends that are effectively connected with the conduct of a trade or business within the United States by the non-U.S. holder (and, if required by an applicable income tax treaty, are attributable to a U.S. permanent establishment) generally will not be subject to such withholding tax, provided certain certification and disclosure requirements are satisfied (including providing a properly completed IRS Form W-8ECI). Instead, such dividends generally will be subject to U.S. federal income tax on a net income basis in the same manner as if the non-U.S. holder were a United States person as defined under the Code. A corporate non-U.S. holder may be subject to an additional “branch profits tax” at a 30% rate (or such lower rate as may be specified by an applicable income tax treaty) on earnings and profits attributable to such dividends that are effectively connected with its conduct of a U.S. trade or business (and, if an income tax treaty applies, are attributable to its U.S. permanent establishment).
A non-U.S. holder of shares of our common stock who wishes to claim the benefit of an applicable treaty rate and avoid backup withholding, as discussed below, for dividends will be required (a) to complete an IRS Form W-8BEN (or other applicable form) and certify under penalty of perjury that such holder is not a United States person as defined under the Code and is eligible for treaty benefits, or (b) if such holder’s shares are held through certain foreign intermediaries or foreign partnerships, to satisfy the relevant certification requirements of applicable U.S. Treasury regulations.
A non-U.S. holder of shares of our common stock who is eligible for a reduced rate of U.S. withholding tax pursuant to an income tax treaty may obtain a refund of any excess amounts withheld by timely filing an appropriate claim for refund with the IRS.
Gain on Disposition of Shares of Common Stock
Subject to the discussions below on the backup withholding tax and the FATCA legislation, any gain realized by a non-U.S. holder on the sale or other taxable disposition of shares of our common stock generally will not be subject to U.S. federal income tax unless:
| • | the gain is effectively connected with a trade or business of the non-U.S. holder in the United States (and, if required by an applicable income tax treaty, is attributable to a U.S. permanent establishment); |
| • | the non-U.S. holder is an individual who is present in the United States for 183 days or more in the taxable year of that disposition, and certain other conditions are met; or |
| • | we are or have been a United States real property holding corporation for U.S. federal income tax purposes at any time during the shorter of the five-year period ending on the date of the disposition or the period that the non-U.S. holder held shares of our common stock. |
138
Table of Contents
In the case of a non-U.S. holder described in the first bullet point above, any gain generally will be subject to U.S. federal income tax on a net income basis in the same manner as if the non-U.S. holder were a United States person as defined under the Code, and a non-U.S. holder that is a foreign corporation may also be subject to the branch profits tax equal to 30% of its effectively connected earnings and profits attributable to such gain (or, if an income tax treaty applies, at such lower rate as may be specified by the treaty on its gains attributable to its U.S. permanent establishment). Except as otherwise provided by an applicable income tax treaty, an individual non-U.S. holder described in the second bullet point above will be subject to a 30% tax on any gain derived from the sale, which may be offset by certain U.S. source capital losses, even though the individual is not considered a resident of the United States under the Code. We believe we are not and do not anticipate becoming a United States real property holding corporation for U.S. federal income tax purposes; however, no assurance can be given in this regard. You should consult your own tax advisor about the consequences that could result if we are, or become, a United States real property holding corporation.
Information Reporting and Backup Withholding
The amount of dividends paid to each non-U.S. holder, and the tax withheld with respect to such dividends, will be reported annually to the IRS and to each such holder, regardless of whether withholding was reduced or eliminated by an applicable tax treaty. Copies of the information returns reporting such dividends and withholding may also be made available to the tax authorities in the country in which the non-U.S. holder resides or is established under the provisions of an applicable income tax treaty or agreement.
A non-U.S. holder generally will be subject to backup withholding at a rate of 28% for dividends paid to such holder unless such holder certifies under penalty of perjury (usually on an IRS Form W-8BEN) that it is a non-U.S. holder (and the payor does not have actual knowledge or reason to know that such holder is a United States person as defined under the Code), or such holder otherwise establishes an exemption. Information reporting and, depending on the circumstances, backup withholding will apply to the proceeds of a sale of shares of our common stock within the United States or conducted through certain U.S.-related financial intermediaries, unless the beneficial owner certifies under penalty of perjury that it is a non-U.S. holder (and the payor does not have actual knowledge or reason to know that the beneficial owner is a United States person as defined under the Code), or such owner otherwise establishes an exemption.
Backup withholding is not an additional tax. Any amounts withheld under the backup withholding rules may be allowed as a refund or a credit against a non-U.S. holder’s U.S. federal income tax liability, provided the required information is timely furnished to the IRS.
Legislation Affecting Taxation of Common Stock Held by or Through Foreign Entities
Legislation enacted in 2010, or the “FATCA legislation,” generally imposes a withholding tax of 30% on dividend income paid on, and the gross proceeds of a disposition of, shares of stock paid after December 31, 2012 to (i) a foreign financial institution (broadly defined for this purpose, generally including an investment vehicle), unless such institution enters into an agreement with the U.S. government to collect and provide to the U.S. tax authorities substantial information regarding U.S. account holders of such institution (which would include certain equity and debt holders of such institution, as well as certain account holders that are foreign entities with U.S. owners), and (ii) a foreign entity that is not a financial institution, unless such entity certifies that it does not have any substantial U.S. owners or provides the withholding agent with a certification identifying the substantial U.S. owners of the entity, which generally includes any U.S. person who directly or indirectly owns more than 10% of the entity. Under recently finalized regulations, this new withholding tax will not apply (i) to dividend income on stock that is paid on or before December 31, 2013 or (ii) to gross proceeds from the disposition of stock paid on or before December 31, 2016. Non-U.S. holders are encouraged to consult with their own tax advisors regarding the implications of the FATCA legislation on their investment in our common stock.
139
Table of Contents
THE DISCUSSION OF MATERIAL U.S. FEDERAL INCOME TAX CONSIDERATIONS ABOVE IS INCLUDED FOR GENERAL INFORMATION PURPOSES ONLY. POTENTIAL PURCHASERS OF OUR COMMON STOCK ARE URGED TO CONSULT THEIR TAX ADVISORS TO DETERMINE THE U.S. FEDERAL, STATE AND LOCAL AND NON-U.S. TAX CONSIDERATIONS OF OWNING AND DISPOSING OF OUR COMMON STOCK.
140
Table of Contents
and are acting as representatives of each of the underwriters named below. Subject to the terms and conditions set forth in an underwriting agreement among us and the underwriters, we have agreed to sell to the underwriters, and each of the underwriters has agreed, severally and not jointly, to purchase from us, the number of shares of common stock set forth opposite its name below.
| Underwriter |
Number of Shares | |
| Citigroup Global Markets Inc. |
||
| Credit Suisse Securities (USA) LLC |
||
| Deutsche Bank Securities Inc. |
||
| Goldman, Sachs & Co. |
||
| Nomura Securities International, Inc. |
||
| UBS Securities LLC |
||
|
| ||
| Total |
||
|
|
The underwriting agreement provides that the underwriters’ obligation to purchase shares of common stock depends on the satisfaction of the conditions contained in the underwriting agreement, including:
| • | the obligation to purchase all of the shares of common stock offered hereby, other than those shares of common stock covered by their option to purchase additional shares as described below, if any of the shares are purchased; |
| • | the representations and warranties made by us to the underwriters are true; |
| • | there is no material change in our business or the financial markets; and |
| • | we deliver customary closing documents to the underwriters. |
Commissions and Expenses
The representatives have advised us that the underwriters propose initially to offer the shares to the public at the public offering price set forth on the cover page of this prospectus and to dealers at that price less a concession not in excess of $ per share. The underwriters may allow, and the dealers may re-allow, a discount not in excess of $ per share to other dealers. After the initial offering, the public offering price, concession or any other term of the offering may be changed.
The following table shows the underwriting discounts and expenses we will pay to the underwriters. The information assumes either no exercise or full exercise by the underwriters of their over-allotment option.
| Without Option | With Option | |||||||||||||||
| Per Share | Total | Per Share | Total | |||||||||||||
| Public offering price |
$ | $ | $ | $ | ||||||||||||
| Underwriting discount and commissions |
$ | $ | $ | $ | ||||||||||||
| Proceeds, before expenses, to Taminco |
$ | $ | $ | $ | ||||||||||||
The expenses of the offering, not including the underwriting discount, are estimated at $ million and are payable by us.
Over-allotment Option
We have granted an option to the underwriters to purchase up to additional shares at the public offering price, less the underwriting discount. The underwriters may exercise this option for 30 days from the date of this prospectus solely to cover any over-allotments. If the underwriters exercise this option, each will be obligated, subject to conditions contained in the purchase agreement, to purchase a number of additional shares proportionate to that underwriter’s initial amount reflected in the above table.
141
Table of Contents
Lock-Up Agreements
We, all of our directors and executive officers and certain of our other existing stockholders, including the Apollo Funds have agreed that, subject to certain exceptions, for days after the date of this prospectus, without the prior written consent of the representatives, we and they will not directly or indirectly, (1) offer for sale, sell, pledge, or otherwise dispose of, or enter into any transaction or device that is designed to, or could be expected to, result in the disposition by any person at any time in the future of, any shares of our common stock, including, without limitation, shares of our common stock that may be deemed to be beneficially owned by us or them in accordance with the rules and regulations of the SEC and shares of common stock that may be issued upon exercise of any options or warrants, or securities convertible into or exercisable or exchangeable for our common stock, (2) enter into any swap or other derivatives transaction that transfers to another, in whole or in part, any of the economic consequences of ownership of our common stock or (3) make any demand for or exercise any right or file or cause to be filed a registration statement, including any amendments thereto, with respect to the registration of any shares of our common stock or securities convertible, exercisable or exchangeable into our common stock or any of our other securities.
The -day restricted period described in the preceding paragraph will be extended if:
| • | during the last 17 days of the restricted period referred to above, we issue an earnings release or material news or a material event relating to us occurs; or |
| • | prior to the expiration of the restricted period referred to above, we announce that we will release earnings results during the 16-day period beginning on the last day of the restricted period, in which case the restrictions described in the preceding paragraph will continue to apply until the expiration of the restricted period beginning on the issuance of the earnings release or the announcement of the material news or occurrence of a material event, unless such extension is waived in writing by the representatives. |
The representatives, in their sole discretion, may release our common stock and other securities subject to the lock-up agreements described above in whole or in part at any time with or without notice. When determining whether or not to release our common stock and other securities from the lock-up agreements, the representatives will consider, among other factors, the holder’s reasons for requesting the release, the number of shares of our common stock and other securities for which the release is being requested and market conditions at the time.
Listing
We intend to apply to list our shares of common stock on the under the symbol “ .” In order to meet the requirements for listing on that exchange, the underwriters have undertaken to sell a minimum number of shares to a minimum number of beneficial owners as required by that exchange.
Determination of Offering Price
Before this offering, there has been no public market for our common stock. The initial public offering price will be determined through negotiations among us and the representatives. In addition to prevailing market conditions, the factors to be considered in determining the initial public offering price are:
| • | the value multiples of publicly traded companies that the representatives believe to be comparable to us; |
| • | our financial information; |
| • | the history of, and the prospect for, our Company and the industry in which we compete; |
| • | an assessment of our management, its past and present operations, and the prospects for, and timing of, our future revenues; |
| • | the present state of our development; and |
| • | the above factors in relation to market values and various valuation measures of other companies engaged in activities similar to ours. |
142
Table of Contents
Price Stabilization, Short Positions and Penalty Bids
Until the distribution of the shares is completed, SEC rules may limit underwriters and selling group members from bidding for and purchasing our common stock. However, the representative may engage in transactions that stabilize the price of the common stock, such as bids or purchases to peg, fix or maintain that price.
In connection with the offering, the underwriters may purchase and sell our common stock in the open market. These transactions may include short sales, purchases on the open market to cover positions created by short sales and stabilizing transactions. Short sales involve the sale by the underwriters of a greater number of shares than they are required to purchase in the offering. “Covered” short sales are sales made in an amount not greater than the underwriters’ over-allotment option described above. The underwriters may close out any covered short position by either exercising their over-allotment option or purchasing shares in the open market. In determining the source of shares to close out the covered short position, the underwriters will consider, among other things, the price of shares available for purchase in the open market as compared to the price at which they may purchase shares through the over-allotment option. “Naked” short sales are sales in excess of the overallotment option. The underwriters must close out any naked short position by purchasing shares in the open market. A naked short position is more likely to be created if the underwriters are concerned that there may be downward pressure on the price of our common stock in the open market after pricing that could adversely affect investors who purchase in the offering. Stabilizing transactions consist of various bids for or purchases of shares of common stock made by the underwriters in the open market prior to the completion of the offering.
The underwriters may also impose a penalty bid. This occurs when a particular underwriter repays to the underwriters a portion of the underwriting discount received by it because the representative has repurchased shares sold by or for the account of such underwriter in stabilizing or short covering transactions.
Similar to other purchase transactions, the underwriters’ purchases to cover the syndicate short sales may have the effect of raising or maintaining the market price of our common stock or preventing or retarding a decline in the market price of our common stock. As a result, the price of our common stock may be higher than the price that might otherwise exist in the open market. The underwriters may conduct these transactions on the , in the over-the-counter market or otherwise.
Neither we nor any of the underwriters make any representation or prediction as to the direction or magnitude of any effect that the transactions described above may have on the price of our common stock. In addition, neither we nor any of the underwriters make any representation that the representative will engage in these transactions or that these transactions, once commenced, will not be discontinued without notice.
Electronic Distribution
In connection with the offering, certain of the underwriters or securities dealers may distribute prospectuses by electronic means, such as e-mail.
Other Relationships
The underwriters and their respective affiliates are full service financial institutions engaged in various activities, which may include securities trading, commercial and investment banking, financial advisory, investment management, principal investment, hedging, financing and brokerage activities. Some of the underwriters and their affiliates have engaged in, and may in the future engage in, investment banking and other commercial dealings in the ordinary course of business with us or our affiliates. They have received, or may in the future receive, customary fees and commissions for these transactions. In the ordinary course of their various business activities, the underwriters and their respective affiliates may make or hold a broad array of investments and actively trade debt and equity securities (or related derivative securities) and financial instruments (including
143
Table of Contents
bank loans) for their own account and for the accounts of their customers and may at any time hold long and short positions in such securities and instruments. Such investment and securities activities may involve our securities and instruments. In addition, affiliates of certain of the underwriters are lenders and/or agents under the Senior Secured Credit Facilities.
Notice to Prospective Investors in the European Economic Area
In relation to each Member State of the European Economic Area which has implemented the Prospectus Directive (each, a “Relevant Member State”), with effect from and including the date on which the Prospectus Directive is implemented in that Relevant Member State (the “Relevant Implementation Date”), no offer of shares may be made to the public in that Relevant Member State other than:
| • | to any legal entity which is a qualified investor as defined in the Prospective Directive; |
| • | to fewer than 100 or, if the Relevant Member State has implemented the relevant provisions of the 2010 PD Amending Directive, 150, natural or legal persons (other than qualified investors as defined in the Prospectus Directive), as permitted under the Prospective Directive, subject to obtaining the prior consent of the representatives; or |
| • | in any other circumstances falling within Article 3(2) of the Prospectus Directive, |
provided that no such offer of shares shall require the Company or the representatives to publish a prospectus pursuant to Article 3 of such Prospectus Directive or supplement a prospectus pursuant to Article 16 of the Prospectus Directive.
Each person in a Relevant Member State (other than a Relevant Member State where there is a Permitted Public Offer) who initially acquires any shares or to whom any offer is made will be deemed to have represented, acknowledged and agreed that (A) it is a “qualified investor” within the meaning of the law in that Relevant Member State implementing Article 2(1)(e) of the Prospectus Directive, and (B) in the case of any shares acquired by it as a financial intermediary, as that term is used in Article 3(2) of the Prospectus Directive, the shares acquired by it in the offering have not been acquired on behalf of, nor have they been acquired with a view to their offer or resale to, persons in any Relevant Member State other than “qualified investors” as defined in the Prospectus Directive, or in circumstances in which the prior consent of the subscribers has been given to the offer or resale. In the case of any shares being offered to a financial intermediary as that term is used in Article 3(2) of the Prospectus Directive, each such financial intermediary will be deemed to have represented, acknowledged and agreed that the shares acquired by it in the offer have not been acquired on a nondiscretionary basis on behalf of, nor have they been acquired with a view to their offer or resale to, persons in circumstances which may give rise to an offer of any shares to the public other than their offer or resale in a Relevant Member State to qualified investors as so defined or in circumstances in which the prior consent of the representatives has been obtained to each such proposed offer or resale.
The company, the representatives and their affiliates will rely upon the truth and accuracy of the foregoing representation, acknowledgement and agreement.
This prospectus has been prepared on the basis that any offer of shares in any Relevant Member State will be made pursuant to an exemption under the Prospectus Directive from the requirement to publish a prospectus for offers of shares. Accordingly any person making or intending to make an offer in that Relevant Member State of shares which are the subject of the offering contemplated in this prospectus may only do so in circumstances in which no obligation arises for the Company or any of the underwriters to publish a prospectus pursuant to Article 3 of the Prospectus Directive in relation to such offer. Neither the Company nor the underwriters have authorized, nor do they authorize, the making of any offer of shares in circumstances in which an obligation arises for the Company or the underwriters to publish a prospectus for such offer.
For the purpose of the above provisions, the expression “an offer to the public” in relation to any shares in any Relevant Member State means the communication in any form and by any means of sufficient information
144
Table of Contents
on the terms of the offer and the shares to be offered so as to enable an investor to decide to purchase or subscribe the shares, as the same may be varied in the Relevant Member State by any measure implementing the Prospectus Directive in the Relevant Member State and the expression “Prospectus Directive” means Directive 2003/71/EC (including the 2010 PD Amending Directive, to the extent implemented in the Relevant Member States) and includes any relevant implementing measure in the Relevant Member State and the expression “2010 PD Amending Directive” means Directive 2010/73/EU.
Notice to Prospective Investors in the United Kingdom
In addition, in the United Kingdom, this document is being distributed only to, and is directed only at, and any offer subsequently made may only be directed at persons who are “qualified investors” (as defined in the Prospectus Directive) (i) who have professional experience in matters relating to investments falling within Article 19(5) of the Financial Services and Markets Act 2000 (Financial Promotion) Order 2005, as amended (the “Order”) and/or (ii) who are high net worth companies (or persons to whom it may otherwise be lawfully communicated) falling within Article 49(2)(a) to (d) of the Order (all such persons together being referred to as “relevant persons”). This document must not be acted on or relied on in the United Kingdom by persons who are not relevant persons. In the United Kingdom, any investment or investment activity to which this document relates is only available to, and will be engaged in with, relevant persons.
Notice to Prospective Investors in Switzerland
The shares may not be publicly offered in Switzerland and will not be listed on the SIX Swiss Exchange (“SIX”) or on any other stock exchange or regulated trading facility in Switzerland. This document has been prepared without regard to the disclosure standards for issuance prospectuses under art. 652a or art. 1156 of the Swiss Code of Obligations or the disclosure standards for listing prospectuses under art. 27 ff. of the SIX Listing Rules or the listing rules of any other stock exchange or regulated trading facility in Switzerland. Neither this document nor any other offering or marketing material relating to the shares or the offering may be publicly distributed or otherwise made publicly available in Switzerland.
Neither this document nor any other offering or marketing material relating to the offering, the Company, the shares have been or will be filed with or approved by any Swiss regulatory authority. In particular, this document will not be filed with, and the offer of shares will not be supervised by, the Swiss Financial Market Supervisory Authority FINMA (FINMA), and the offer of shares has not been and will not be authorized under the Swiss Federal Act on Collective Investment Schemes (“CISA”). The investor protection afforded to acquirers of interests in collective investment schemes under the CISA does not extend to acquirers of shares.
Notice to Prospective Investors in the Dubai International Financial Centre
This document relates to an exempt offer in accordance with the Offered Securities Rules of the Dubai Financial Services Authority. This document is intended for distribution only to persons of a type specified in those rules. It must not be delivered to, or relied on by, any other person. The Dubai Financial Services Authority has no responsibility for reviewing or verifying any documents in connection with exempt offers. The Dubai Financial Services Authority has not approved this document nor taken steps to verify the information set out in it, and has no responsibility for it. The shares which are the subject of the offering contemplated by this prospectus may be illiquid and/or subject to restrictions on their resale. Prospective purchasers of the shares offered should conduct their own due diligence on the shares. If you do not understand the contents of this document you should consult an authorized financial adviser.
Notice to Prospective Investors in Hong Kong
The shares may not be offered or sold by means of any document other than (i) in circumstances which do not constitute an offer to the public within the meaning of the Companies Ordinance (Cap.32, Laws of Hong Kong), or
145
Table of Contents
(ii) to “professional investors” within the meaning of the Securities and Futures Ordinance (Cap.571, Laws of Hong Kong) and any rules made thereunder, or (iii) in other circumstances which do not result in the document being a “prospectus” within the meaning of the Companies Ordinance (Cap.32, Laws of Hong Kong), and no advertisement, invitation or document relating to the shares may be issued or may be in the possession of any person for the purpose of issue (in each case whether in Hong Kong or elsewhere), which is directed at, or the contents of which are likely to be accessed or read by, the public in Hong Kong (except if permitted to do so under the laws of Hong Kong) other than with respect to shares which are or are intended to be disposed of only to persons outside Hong Kong or only to “professional investors” within the meaning of the Securities and Futures Ordinance (Cap. 571, Laws of Hong Kong) and any rules made thereunder.
Notice to Prospective Investors in Singapore
This prospectus has not been registered as a prospectus with the Monetary Authority of Singapore. Accordingly, this prospectus and any other document or material in connection with the offer or sale, or invitation for subscription or purchase, of the shares may not be circulated or distributed, nor may the shares be offered or sold, or be made the subject of an invitation for subscription or purchase, whether directly or indirectly, to persons in Singapore other than (i) to an institutional investor under Section 274 of the Securities and Futures Act, Chapter 289 of Singapore (the “SFA”), (ii) to a relevant person, or any person pursuant to Section 275(1A), and in accordance with the conditions, specified in Section 275 of the SFA or (iii) otherwise pursuant to, and in accordance with the conditions of, any other applicable provision of the SFA.
Notice to Prospective Investors in Japan
Where the shares are subscribed or purchased under Section 275 by a relevant person which is: (a) a corporation (which is not an accredited investor) the sole business of which is to hold investments and the entire share capital of which is owned by one or more individuals, each of whom is an accredited investor; or (b) a trust (where the trustee is not an accredited investor) whose sole purpose is to hold investments and each beneficiary is an accredited investor, shares, debentures and units of shares and debentures of that corporation or the beneficiaries’ rights and interest in that trust shall not be transferable for 6 months after that corporation or that trust has acquired the shares under Section 275 except: (1) to an institutional investor under Section 274 of the SFA or to a relevant person, or any person pursuant to Section 275(1A), and in accordance with the conditions, specified in Section 275 of the SFA; (2) where no consideration is given for the transfer; or (3) by operation of law. The securities have not been and will not be registered under the Financial Instruments and Exchange Law of Japan (the Financial Instruments and Exchange Law) and each underwriter has agreed that it will not offer or sell any securities, directly or indirectly, in Japan or to, or for the benefit of, any resident of Japan (which term as used herein means any person resident in Japan, including any corporation or other entity organized under the laws of Japan), or to others for re-offering or resale, directly or indirectly, in Japan or to a resident of Japan, except pursuant to an exemption from the registration requirements of, and otherwise in compliance with, the Financial Instruments and Exchange Law and any other applicable laws, regulations and ministerial guidelines of Japan.
146
Table of Contents
Kirkland & Ellis LLP, New York, New York will pass upon the validity of the common stock offered hereby on our behalf. The underwriters are represented by Davis Polk & Wardwell LLP, New York, New York.
The consolidated financial statements of Taminco Group Holdings S.à r.l. as of December 31, 2010 and 2011, and for each of the three years in the period ended December 31, 2011, appearing in this registration statement have been audited by Ernst & Young Bedrijfsrevisoren BCVBA, an independent registered public accounting firm, as set forth in their report appearing herein, and are included in reliance upon such report given on the authority of such firm as experts in accounting and auditing.
Certain information set forth in “Prospectus Summary,” “Industry Overview” and “Business” have been included in reliance upon Arthur D. Little Benelux S.A./N.V.’s authority as an expert on such matters.
WHERE YOU CAN FIND ADDITIONAL INFORMATION
We are required to file annual and quarterly reports and other information with the SEC. You may read and copy any materials we file with the SEC at the SEC’s Public Reference Room at 100 F Street, N.E., Room 1580, Washington, D.C., 20549. Please call 1-800-SEC-0330 for further information on the operation of the Public Reference Room. Our filings will also be available to the public from commercial document retrieval services and at the web site maintained by the SEC at http://www.sec.gov. Our reports and other information that we have filed, or may in the future file, with the SEC are not incorporated by reference into and do not constitute part of this prospectus.
We have filed with the SEC a registration statement under the Securities Act with respect to the shares of our common stock offered by this prospectus. This prospectus, filed as part of the registration statement, does not contain all of the information set forth in the registration statement or the exhibits and schedules thereto as permitted by the rules and regulations of the SEC. For further information about us and our common stock, you should refer to the registration statement. This prospectus summarizes provisions that we consider material of certain contracts and other documents to which we refer you. Because the summaries may not contain all of the information that you may find important, you should review the full text of those documents.
We have not authorized anyone to give you any information or to make any representations about us or the transactions we discuss in this prospectus other than those contained in this prospectus. If you are given any information or representations about these matters that is not discussed in this prospectus, you must not rely on that information. This prospectus is not an offer to sell or a solicitation of an offer to buy securities anywhere or to anyone where or to whom we are not permitted to offer or sell securities under applicable law.
147
Table of Contents
APPENDIX A: GLOSSARY OF TECHNICAL TERMS
2-Pyrrolidone: 2-Pyrolidone is an amine derivative. It is a specialty amine used in pharmaceutical production.
AAA (Amietols): AAA refers to Amietols, a group of products that are manufactured by reacting MMA and DMA with ethylene oxide in a high pressure reactor. Amietol products are used as precursors in the manufacturing of fabric softeners, as solvents for oil & gas sweetening and for hydrogen sulphide scavenging.
Advantex: Advantex is a higher alkylamino ethanol derivative obtained by etoxylation of higher amines. It is primarily used in the paints and coatings industry.
CCC (Chlormequat chloride): CCC is methylamine derivative manufactured using TMA. It is a plant growth regulator. Its key applications include the treatment of crops such as cereals (wheat, rye, barley), cotton, and ornamentals.
Choline chloride: Choline chloride, also known as vitamin B4, is a methylamine derivative manufactured using TMA, hydrochloric acid and ethylene oxide. The principal use of choline chloride is as a feed additive for poultry and swine as it plays a key role in several metabolic processes that enhance animal growth and feed conversion yields.
DEA (Diethylamine): DEA is a higher alkylamine created by chemically reacting ammonia with ethanol. Once produced, it is subsequently reacted with other raw materials to produce a wide variety of derivative products.
DIMLA: DIMLA is the trade name for Alkyl-di-methylamine, a tertiary amine manufactured by reacting DMA together with fatty alcohols. DIMLA is used for the production of detergents and biocides.
DMA (Di methylamine): DMA is one of the three forms of methylamines produced by chemically reacting methanol and ammonia. Once produced, it is subsequently reacted with other raw materials to produce a wide variety of derivative products.
DMAc (Dimethylacetamide): DMAc is a methylamine derivative produced through reactions of DMA with acetic acid (HOAc). It is an amide aprotic solvent.
DMAE (Dimethylaminoethanol): DMAE is a methylamine derivative also known as Amietol®M21. Its primary use is as precursor for water treatment chemical purposes. It also acts as a curing agent for polyurethanes and epoxy resins and is used to some extent in the coatings industry.
DMAPA (Dimethylaminopropylamine): DMAPA is a tertiary amine produced by reacting DMA with acrylonitrile (ACN) and hydrogen. DMAPA is a surfactant precursor, DMAPA is also used in the manufacture of personal & home care products (betaines).
DMF (Dimethylformamide): DMF is a methylamine derivative produced by the catalyzed reaction of DMA and carbon monoxide. DMF is used as a solvent predominantly in the production of polyurethane synthetic leather, electronics manufacture and the spinning of acrylic fibers.
DNPA (Di-n-propylamine): DNPA is a higher alkylamine and is manufactured by chemically reacting ammonia and n-propanol. In agricultural applications, DNPA is a primary product and is used in the production of herbicides (primarily Trifluralin).
Ferbam: Ferbam is a methylamine derivative manufactured from DMA, irontrichloride and carbon disulphide. It is used as a contact fungicide.
148
Table of Contents
MDEA (Monomethyldiethanolamine): MDEA is a methylamine derivative created by chemically reacting MMA and ethylene oxide. It is used in the manufacturing of fabric softeners, as solvent for oil & gas sweetening and for hydrogen sulphide scavenging.
MEA (Monoethylamine): MEA is a higher amine and is manufactured by chemically reacting ammonia and ethanol. In agricultural applications, MEA is a primary product and is used in the production of herbicides (primarily atrazine).
Metam Sodium: Metam Sodium is a methylamine derivative manufactured from MMA, caustic soda and carbon disulphide. It is used as a soil disinfectant for controlling nematodes and soil diseases and is also endowed with herbicidal properties.
MIPA (Monoisopropylamine): MIPA is a higher amine manufactured by chemically reacting ammonia and isopropanol or acetone. In agricultural applications, MIPA is a primary product and is used in the production of herbicides (primarily glyphosate and atrazine).
MMA (Mono-methylamine): MMA is one of the three forms of methylamines produced by chemically reacting methanol and ammonia. Once produced, it is subsequently reacted with other raw materials to produce a wide variety of derivative products.
NMP (N-Methylpyrrolidone): NMP is a methylamine derivative produced through reactions of MMA with gammabutyrolacetone (GBL). NMP is used as an aprotic solvent.
Synergex: Synergex is a higher alkylamine derivative. It is mainly used to enhance the performance of metal working fluids.
TEA (Triethylamine): TEA is a higher alkylamine created by chemically reacting ammonia with ethanol. Once produced, it is mainly sold as intermediate chemical to various industries.
Thiram: Thiram is a methylamine derivative manufactured from DMA and carbon disulphide. It is a dithiocarbamate contact fungicide belonging to a family of agrochemicals initially developed in the 1940s and used in selected applications such as those for stone fruits and tropical crops.
TMA (Tri-methylamine): TMA is one of the three forms of methylamines produced by chemically reacting methanol and ammonia. Once produced, it is subsequently reacted with other raw materials to produce a wide variety of derivative products.
Vantex: Vantex T is a higher alkylamine derivative used as additive for paints and coatings.
Ziram: Ziram is a methylamine derivative manufactured from DMA, zinc sulfate and carbon disulphide. It is a dithiocarbamate contact fungicide belonging to a family of agrochemicals initially developed in the 1940s and used in selected applications such as those for stone fruits and tropical crops.
149
Table of Contents
| Page | ||||
| Audited Consolidated Financial Statements of Taminco Group Holdings S.à r.l. (Predecessor) |
||||
| F-2 | ||||
| Consolidated statements of operations for the years ended December 31, 2009, 2010 and 2011 |
F-3 | |||
| Consolidated statements of comprehensive income for the years ended December 31, 2009, 2010 and 2011 |
F-4 | |||
| F-5 | ||||
| Consolidated statements of cash flows for the years ended December 31, 2009, 2010 and 2011 |
F-6 | |||
| F-7 | ||||
| F-8 | ||||
| Unaudited Condensed Consolidated Financial Statements of Taminco Group Holdings S.à r.l. (Predecessor) and Taminco Acquisition Corporation (Successor) |
||||
| F-35 | ||||
| F-36 | ||||
| Condensed consolidated balance sheets as of December 31, 2011 and September 30, 2012 |
F-37 | |||
| F-38 | ||||
| Condensed consolidated statements of equity (deficit) for the nine months ended September 30, 2012 |
F-39 | |||
| F-40 | ||||
F-1
Table of Contents
REPORT OF INDEPENDENT REGISTERED PUBLIC ACCOUNTING FIRM
The Board of Directors and Stockholders of Taminco Group Holdings S.à r.l.
We have audited the accompanying consolidated balance sheets of Taminco Group Holdings S.à r.l. as of December 31, 2011 and 2010, and the related consolidated statements of operations, comprehensive income, stockholders’ equity (deficit) and cash flows for each of the three years in the period ended December 31, 2011. Our audits also included the financial statement schedule listed in the Index at Item 16(b). These financial statements and schedule are the responsibility of the Company’s management. Our responsibility is to express an opinion on these financial statements and schedule based on our audits.
We conducted our audits in accordance with the standards of the Public Company Accounting Oversight Board (United States). Those standards require that we plan and perform the audit to obtain reasonable assurance about whether the financial statements are free of material misstatement. We were not engaged to perform an audit of the Company’s internal control over financial reporting. Our audits included consideration of internal control over financial reporting as a basis for designing audit procedures that are appropriate in the circumstances, but not for the purpose of expressing an opinion on the effectiveness of the Company’s internal control over financial reporting. Accordingly, we express no such opinion. An audit also includes examining, on a test basis, evidence supporting the amounts and disclosures in the financial statements, assessing the accounting principles used and significant estimates made by management, and evaluating the overall financial statement presentation. We believe that our audits provide a reasonable basis for our opinion.
In our opinion, the financial statements referred to above present fairly, in all material respects, the consolidated financial position of Taminco Group Holdings S.à r.l. at December 31, 2011 and 2010, and the consolidated results of their operations and their cash flows for each of the three years in the period ended December 31, 2011, in conformity with U.S. generally accepted accounting principles. Also, in our opinion, the related financial statement schedule, when considered in relation to the basic financial statements taken as a whole, present fairly in all material respects the information set forth therein.
Ghent, 3 December 2012
Ernst & Young Bedrijfsrevisoren BCVBA
Represented by
/s/ Lieve Cornelis
Lieve Cornelis
Partner
F-2
Table of Contents
TAMINCO GROUP HOLDINGS S.À R.L.
CONSOLIDATED STATEMENTS OF OPERATIONS
(In millions, except number of shares and share amounts)
| Year Ended December 31, | ||||||||||||
| 2009 | 2010 | 2011 | ||||||||||
| Net Sales |
$ | 825 | $ | 951 | $ | 1,123 | ||||||
| Cost of Sales |
651 | 757 | 906 | |||||||||
|
|
|
|
|
|
|
|||||||
| Gross Profit |
174 | 194 | 217 | |||||||||
| Selling, general and administrative expense |
48 | 52 | 49 | |||||||||
| Research and development expense |
12 | 13 | 12 | |||||||||
| Other operating expense, net |
13 | 2 | 16 | |||||||||
|
|
|
|
|
|
|
|||||||
| Operating income |
101 | 127 | 140 | |||||||||
| Interest expense, net (including related party interest expense of $30, $32 and $37 in 2009, 2010 and 2011, respectively) |
80 | 74 | 75 | |||||||||
| Other non-operating expense (income), net |
4 | (2 | ) | 1 | ||||||||
|
|
|
|
|
|
|
|||||||
| Income before income taxes and losses on unconsolidated joint ventures |
17 | 55 | 64 | |||||||||
| Income tax expense |
16 | 33 | 32 | |||||||||
|
|
|
|
|
|
|
|||||||
| Income before losses on unconsolidated joint ventures |
1 | 22 | 32 | |||||||||
| Equity losses of unconsolidated joint ventures, net |
— | — | 2 | |||||||||
|
|
|
|
|
|
|
|||||||
| Net income attributable to equity holders of the parent |
$ | 1 | $ | 22 | $ | 30 | ||||||
|
|
|
|
|
|
|
|||||||
| Net income per common share of the parent: |
||||||||||||
| Basic |
$ | — | 0.02 | $ | 0.03 | |||||||
| Diluted |
$ | — | $ | 0.02 | $ | 0.03 | ||||||
| Number of common shares |
1,000,000,000 | 1,000,000,000 | 1,000,000,000 | |||||||||
See accompanying notes to consolidated financial statements
F-3
Table of Contents
TAMINCO GROUP HOLDINGS S.À R.L.
CONSOLIDATED STATEMENTS OF COMPREHENSIVE INCOME
(In millions)
| Year ended December 31, | ||||||||||||
| 2009 | 2010 | 2011 | ||||||||||
| Net income |
$ | 1 | $ | 22 | $ | 30 | ||||||
| Other comprehensive income (loss): |
||||||||||||
| Foreign currency translation adjustments |
11 | (4 | ) | (6 | ) | |||||||
| Net pension and other postretirement benefit adjustments |
(2 | ) | (1 | ) | (2 | ) | ||||||
|
|
|
|
|
|
|
|||||||
| Other comprehensive income (loss), before tax |
9 | (5 | ) | (8 | ) | |||||||
| Income tax expense related to items of other comprehensive income |
1 | — | 1 | |||||||||
|
|
|
|
|
|
|
|||||||
| Other comprehensive income (loss), net of tax |
10 | (5 | ) | (7 | ) | |||||||
| Comprehensive income attributable to equity holders of the parent |
$ | 11 | $ | 17 | $ | 23 | ||||||
|
|
|
|
|
|
|
|||||||
See accompanying notes to consolidated financial statements
F-4
Table of Contents
TAMINCO GROUP HOLDINGS S.À R.L.
CONSOLIDATED BALANCE SHEETS
(In millions, other than share information)
| December 31, | ||||||||
| 2010 | 2011 | |||||||
| Assets |
||||||||
| Current assets: |
||||||||
| Cash and cash equivalents |
$ | 111 | $ | 131 | ||||
| Accounts receivable (net of allowance for doubtful accounts of $0.7 and $1.3 in 2010 and 2011, respectively) |
90 | 89 | ||||||
| Related party receivables |
1 | 1 | ||||||
| Inventories |
87 | 117 | ||||||
| Deferred income taxes |
8 | 7 | ||||||
| Assets held for sale |
— | 2 | ||||||
| Prepaid expenses and other current assets |
12 | 15 | ||||||
|
|
|
|
|
|||||
| Total current assets |
309 | 362 | ||||||
|
|
|
|
|
|||||
| Property, plant and equipment, net |
246 | 249 | ||||||
| Investments in unconsolidated joint ventures |
— | 12 | ||||||
| Intangibles assets, net |
201 | 175 | ||||||
| Goodwill |
558 | 540 | ||||||
| Capitalized debt issuance costs |
13 | 10 | ||||||
|
|
|
|
|
|||||
| Total assets |
$ | 1,327 | $ | 1,348 | ||||
|
|
|
|
|
|||||
| Liabilities and Equity |
||||||||
| Current liabilities: |
||||||||
| Short-term debt |
15 | 29 | ||||||
| Trade payables |
69 | 72 | ||||||
| Income tax payable |
1 | 6 | ||||||
| Other current liabilities |
48 | 44 | ||||||
|
|
|
|
|
|||||
| Total current liabilities |
133 | 151 | ||||||
|
|
|
|
|
|||||
| Long-term debt |
774 | 729 | ||||||
| Related party long-term debt |
350 | 373 | ||||||
| Other liabilities |
21 | 24 | ||||||
| Long-term pension and post employment benefit obligations |
11 | 13 | ||||||
| Deferred income taxes |
93 | 90 | ||||||
|
|
|
|
|
|||||
| Total liabilities |
1,382 | 1,380 | ||||||
|
|
|
|
|
|||||
| Stockholders’ deficit: |
||||||||
| Common stock ($0.014 par value, 1,000,000,000 shares authorized and issued) |
14 | 14 | ||||||
| Retained deficit |
(54 | ) | (24 | ) | ||||
| Accumulated other comprehensive loss |
(15 | ) | (22 | ) | ||||
|
|
|
|
|
|||||
| Total company share of stockholders’ deficit |
(55 | ) | (32 | ) | ||||
|
|
|
|
|
|||||
| Total liabilities and stockholders’ deficit |
$ | 1,327 | $ | 1,348 | ||||
|
|
|
|
|
|||||
See accompanying notes to consolidated financial statements
F-5
Table of Contents
TAMINCO GROUP HOLDINGS S.À R.L.
CONSOLIDATED STATEMENTS OF CASH FLOWS
(In millions)
| Year Ended December 31, | ||||||||||||
| 2009 | 2010 | 2011 | ||||||||||
| Operating activities |
||||||||||||
| Net income |
$ | 1 | $ | 22 | $ | 30 | ||||||
| Adjustments to reconcile net income to net cash provided by operating activities: |
||||||||||||
| Depreciation and amortization |
82 | 74 | 72 | |||||||||
| Deferred tax provision |
(7 | ) | (8 | ) | (6 | ) | ||||||
| Other non-cash adjustments: |
||||||||||||
| Loss from equity investments |
— | — | 2 | |||||||||
| Amortization of debt-related costs |
3 | 3 | 3 | |||||||||
| Accrued interest on related party loans |
30 | 32 | 37 | |||||||||
| Unrealized profit on derivatives |
(3 | ) | (6 | ) | (5 | ) | ||||||
| Net change in assets and liabilities: |
||||||||||||
| (Increase)/decrease in accounts receivable |
(8 | ) | (16 | ) | (4 | ) | ||||||
| (Increase)/decrease in inventories |
18 | (16 | ) | (31 | ) | |||||||
| (Increase)/decrease in other operating assets |
7 | 7 | (3 | ) | ||||||||
| Increase/(decrease) in accounts payable |
8 | 8 | 7 | |||||||||
| Increase/(decrease) in income tax payable |
(10 | ) | (2 | ) | 5 | |||||||
| Increase/(decrease) in other current liabilities |
16 | 22 | 3 | |||||||||
| Increase/(decrease) in other non-current liabilities |
(4 | ) | (8 | ) | 7 | |||||||
|
|
|
|
|
|
|
|||||||
| Net cash flows provided by operating activities |
133 | 112 | 117 | |||||||||
|
|
|
|
|
|
|
|||||||
| Investing activities |
||||||||||||
| Purchase of property, plant and equipment |
(41 | ) | (62 | ) | (54 | ) | ||||||
| Purchase of intangible assets |
(10 | ) | (5 | ) | (7 | ) | ||||||
| Acquisition of non-controlling interest |
— | (1 | ) | — | ||||||||
| Acquisition and investment within joint venture |
— | — | (14 | ) | ||||||||
|
|
|
|
|
|
|
|||||||
| Net cash flows used in investing activities |
(51 | ) | (68 | ) | (75 | ) | ||||||
|
|
|
|
|
|
|
|||||||
| Financing activities |
||||||||||||
| Proceeds from borrowings |
— | 1 | — | |||||||||
| Repayments of borrowings |
(7 | ) | (23 | ) | (19 | ) | ||||||
|
|
|
|
|
|
|
|||||||
| Net cash flows used in financing activities |
(7 | ) | (22 | ) | (19 | ) | ||||||
|
|
|
|
|
|
|
|||||||
| Net increase in cash and cash equivalents |
75 | 22 | 23 | |||||||||
| Net foreign exchange differences |
1 | (2 | ) | (3 | ) | |||||||
| Cash and cash equivalents, beginning of period |
15 | 91 | 111 | |||||||||
|
|
|
|
|
|
|
|||||||
| Cash and cash equivalents, end of period |
$ | 91 | $ | 111 | $ | 131 | ||||||
|
|
|
|
|
|
|
|||||||
| Supplemental Cash Flow Information: |
||||||||||||
| Interest paid |
$ | 33 | $ | 44 | $ | 41 | ||||||
| Income tax payments, net |
$ | 23 | $ | 41 | $ | 38 | ||||||
See accompanying notes to consolidated financial statements
F-6
Table of Contents
TAMINCO GROUP HOLDINGS S.À R.L.
CONSOLIDATED STATEMENTS OF STOCKHOLDERS’ EQUITY (DEFICIT)
(In millions)
| Total | Non- controlling Interests |
Total stockholders’ Deficit |
Retained Deficit |
Accumulated Other Comprehensive Income |
Common Stock |
Additional Paid In Capital |
||||||||||||||||||||||
| Balance at January 1, 2009 |
$ | (82 | ) | $ | 1 | $ | (83 | ) | $ | (77 | ) | $ | (20 | ) | $ | 14 | $ | — | ||||||||||
| Net income |
1 | — | 1 | 1 | — | — | ||||||||||||||||||||||
| Other comprehensive income (loss), net of tax |
||||||||||||||||||||||||||||
| Foreign currency translation adjustments |
11 | — | 11 | — | 11 | — | ||||||||||||||||||||||
| Net Pension and other postretirement benefit adjustments |
(1 | ) | — | (1 | ) | — | (1 | ) | — | |||||||||||||||||||
|
|
|
|
|
|
|
|
|
|
|
|
|
|
|
|||||||||||||||
| Balance at December 31, 2009 |
$ | (71 | ) | $ | 1 | $ | (72 | ) | $ | (76 | ) | $ | (10 | ) | $ | 14 | $ | — | ||||||||||
| Net Income |
22 | — | 22 | 22 | — | — | ||||||||||||||||||||||
| Other comprehensive income (loss), net of tax |
||||||||||||||||||||||||||||
| Foreign currency translation adjustments |
(4 | ) | — | (4 | ) | — | (4 | ) | — | |||||||||||||||||||
| Unrealized net gain on available for sale securities |
— | — | — | — | — | — | ||||||||||||||||||||||
| Net Pension and other postretirement benefit adjustments |
(1 | ) | — | (1 | ) | — | (1 | ) | — | |||||||||||||||||||
| Acquisition of non controlling interest |
(1 | ) | (1 | ) | — | — | — | — | ||||||||||||||||||||
|
|
|
|
|
|
|
|
|
|
|
|
|
|
|
|||||||||||||||
| Balance at December 31, 2010 |
$ | (55 | ) | $ | — | $ | (55 | ) | $ | (54 | ) | $ | (15 | ) | $ | 14 | $ | — | ||||||||||
| Net Income |
30 | — | 30 | 30 | — | — | ||||||||||||||||||||||
| Other comprehensive income (loss), net of tax |
||||||||||||||||||||||||||||
| Foreign currency translation adjustments |
(6 | ) | — | (6 | ) | — | (6 | ) | — | |||||||||||||||||||
| Net Pension and other postretirement benefit adjustments |
(1 | ) | — | (1 | ) | — | (1 | ) | — | |||||||||||||||||||
|
|
|
|
|
|
|
|
|
|
|
|
|
|
|
|||||||||||||||
| Balance at December 31, 2011 |
$ | (32 | ) | $ | — | $ | (32 | ) | $ | (24 | ) | $ | (22 | ) | $ | 14 | $ | — | ||||||||||
|
|
|
|
|
|
|
|
|
|
|
|
|
|
|
|||||||||||||||
See accompanying notes to consolidated financial statements
F-7
Table of Contents
TAMINCO GROUP HOLDINGS S.À R.L.
Notes to Consolidated Financial Statements
(Unless otherwise noted, all amounts are in millions)
1. Background and Basis of Presentation
Taminco Group Holdings S.à r.l., a limited liability company, was incorporated on August 24, 2007 under the laws of Luxemburg (collectively with its subsidiaries, “Taminco,” the “Company” or the “Group”). Its registered corporate address is 20, Avenue Monterey, L2163 Luxemburg.
At the balance sheet date, the ultimate controlling parties of Taminco Group Holdings S.à r.l. are CVC European Equity IV (AB) Limited and CVC European Equity IV (CDE) Limited as the general partners of CVC Fund IV. The general partners are 100% indirectly owned by CVC Capital Partners SICAV-FIS S.A. The controlling parties acquired the Company in 2007.
Taminco’s products are used by our customers in the manufacturing of everyday products primarily for the agriculture, water treatment, personal & homecare, animal nutrition and oil & gas end-markets. Taminco offers differentiated value-added products that are sold into diversified, global end-markets that benefit from favorable underlying economic and population trends.
Alkylamines are organic compounds produced through the reaction of an alcohol with ammonia. The immediate results of these processes are the production of methylamines and higher alkylamines, which can then be further reacted with other chemicals to produce alkylamine derivatives.
Taminco currently operates seven plants worldwide dedicated to the production of alkylamines and alkylamine derivatives, including two larger facilities in the United States and in Europe, a joint venture facility with Mitsubishi Gas Chemical Company and certain of its affiliates (the “MGC Group”) in China, and two other 100% Taminco-owned facilities in China.
The accompanying financial statements comprise the consolidated financial statements of Taminco Group Holdings S.à r.l. and its subsidiaries. The consolidated financial statements of the Company have been prepared in accordance with accounting principles generally accepted in the United States of America.
2. Summary of Significant Accounting Policies
PRINCIPLES OF CONSOLIDATION AND PRESENTATION
All majority owned or controlled subsidiaries of Taminco are included in the consolidated financial statements and intercompany transactions are eliminated upon consolidation.
Subsidiaries are those enterprises that are controlled by Taminco. Control exists when Taminco has the power, directly or indirectly, to govern the financial and operating policies of an enterprise so as to obtain benefits from its activities. The financial statements of subsidiaries are prepared for the same reporting year as those of the parent company, using consistent accounting policies. Subsidiaries are consolidated from the date on which control is transferred to Taminco and cease to be consolidated from the date on which control is transferred to a person or entity outside the control of Taminco. A change in ownership interest of a subsidiary, without a change in control, is accounted for as an equity transaction.
Historically, the Company has one non-controlling interest within the Company in relation to Taminco Yixing Choline Chloride Factory, where the Company held 67.5% of the shares. In June 2010, the Company purchased an additional 32.5% of Taminco Yixing Choline Chloride Factory, increasing its ownership interest to 100%. A consideration of $1.4 million was paid to the non-controlling interest shareholder, and since completion of this transaction, there are no non-controlling interests within the Company. The net income attributable to non-controlling interests amounted to $0.14 million and $0.02 million for the years ended December 31, 2009 and 2010, respectively.
F-8
Table of Contents
INVESTMENTS IN UNCONSOLIDATED JOINT VENTURES
Investments in unconsolidated joint ventures are included at cost plus its equity in undistributed earnings in accordance with the equity method of accounting and reflected as investments in unconsolidated joint ventures in the consolidated balance sheets.
USE OF ESTIMATES
The preparation of consolidated financial statements in conformity with U.S. generally accepted accounting principles requires management to make estimates and assumptions that affect the amounts reported in the consolidated financial statements and accompanying notes. Management believes the most complex and sensitive judgments, because of their significance to the consolidated financial statements, result primarily from the need to make estimates about the effects of matters that are inherently uncertain. Actual results could differ from those estimates. Some of the most significant estimates used in the preparation of the consolidated financial statements are related to allowance for doubtful accounts, inventory reserve, goodwill, pension and post-retirement benefits, asset retirement obligation and income taxes. Allocation methods are described in the notes to these consolidated financial statements where appropriate.
FOREIGN CURRENCY TRANSLATION
The consolidated financial statements are reported in U.S. Dollars. The functional currency for each subsidiary is their respective local currency. Adjustments resulting from translating foreign functional currency assets and liabilities into U.S. dollars are recorded in a separate component of shareholders’ equity. Gains or losses resulting from transactions in other than the functional currency are reflected in the consolidated statements of income.
The accumulated foreign currency translation adjustment recognized in accumulated other comprehensive income amounted to $13.2 million and $18.5 million at December 31, 2010 and 2011, respectively.
REVENUE RECOGNITION
Sales of products are recorded (i) upon shipment if title passes to the customer upon shipment, or upon delivery if title passes to the customer upon delivery, (ii) when persuasive evidence of an arrangement exists with the customer, (iii) when the sales price is fixed and determinable, and (iv) when the collectability of the sales price is reasonably assured. Revenue is recognized net of discounts and allowances, which are comprised of trade allowances, cash discounts and sales returns and value added tax. The company accounts for rebates in accordance with Accounting Standards Codification (“ASC”) 605-50. Accordingly, consideration given by the Company to a customer is characterized as a reduction of net sales. Freight costs and any directly related costs of shipping finished product to customers are recorded as “cost of sales”. Billings to customers for shipping fees are included in net sales in accordance with ASC 605-45. Handling costs are incurred from the point the product is removed from inventory until it is provided to the shipper and generally include costs to store, move and prepare the products for shipment. Handling costs are recorded in cost of sales in the Consolidated Statements of Operations.
CASH AND CASH EQUIVALENTS
Cash and cash equivalents include cash on hand, cash with banks and short term investments (maximum original maturities of 3 months) that are readily convertible to known amounts of cash and that are subject to an insignificant risk of change in value.
TRANSFERS OF FINANCIAL INSTRUMENTS
The Company accounts for sales and transfers of financial instruments under Accounting Standards Codification (“ASC”) 860. ASC 860 states that a transfer of financial assets (either all or a portion of a financial asset) in which
F-9
Table of Contents
the transferor surrenders control over those financial assets shall be accounted for as a sale to the extent that consideration other than beneficial interests in the transferred assets is received in exchange. The Company sells receivables to a bank which qualify as financial assets since they are associated with the sale of products by the subsidiaries of the Company and accepted by the Company’s customers in the ordinary course of business. For all receivables sold to the bank, the risks of collection of such receivables reside with the bank. Therefore, upon sale of the receivables to the bank, the appropriate reversal of any accounts receivable or applicable allowances are recorded by the Company.
ALLOWANCE FOR DOUBTFUL ACCOUNTS
Outstanding trade receivables are regularly monitored and any shipments to major customers are generally covered by letters of credit or other forms of credit insurance. Analysis is performed regularly to estimate the allowance necessary to provide for uncollectible receivables. This analysis is based on historical experience, combined with a review of current developments and includes specific accounts for which payment has become unlikely. The process by which the Company calculates the allowance begins in the individual subsidiaries where specific problem accounts are identified and reserved primarily based upon the age and risk profile of the receivables and specific payment issues.
INVENTORY
Inventories are stated at lower of cost or market using the first-in, first-out method. Costs include direct material, direct labor and applicable manufacturing overheads, which are based on normal production capacity. Abnormal manufacturing costs are recognized as period costs and fixed manufacturing overheads are allocated based on normal production capacity. An allowance is provided for excess and obsolete inventories based on management’s review of inventories on-hand compared to the estimated future usage and sales.
PROPERTY, PLANT AND EQUIPMENT
Property, plant and equipment (including leasehold improvements and software costs) are recorded at cost, net of accumulated depreciation and amortization. Major renewals and betterments are capitalized, maintenance, repairs and minor renewals are expensed as incurred. Depreciation, recorded as a component of cost of sales or as a component of selling, general and administrative expenses on the Consolidated Statements of Operations, is computed utilizing the straight-line method over the estimated useful lives of the related assets. Amortization of leasehold improvements is recorded as a component of cost of sales, and is computed utilizing the straight-line method over the estimated benefit period of the related assets or the lease term, if shorter. Useful lives are 15 years for buildings, from 5 to 15 years for plant, machinery and equipment, and from 3 to 15 years for furniture and vehicles.
The Company capitalizes the costs of software developed for internal use, which is entirely comprised of external costs. The Company amortizes software developed or obtained for internal use on a straight-line basis, for 5 years, when such software is substantially ready for use. The net carrying value of software developed or obtained for internal use was $3 million and $2 million at December 31, 2010 and 2011, respectively.
The Company records asset retirement obligations as liabilities on a discounted basis and accretes them over time for the change in present value. Costs associated with the liabilities are capitalized and amortized over the estimated remaining useful life of the asset.
INTANGIBLE ASSETS
Intangible assets mainly include regulatory registration costs, customer relationships, patents and licenses, various contracts and software costs.
F-10
Table of Contents
Regulatory costs
Certain products primarily within the Group’s Crop Protection segment need to be registered before they can be sold/offered to the market (phyto-pharmaceuticals, biocides, etc). Costs related to such registration, such as toxicological studies and registration costs made to third parties, as well as re-registration costs, are included in intangible assets as they represent transferrable assets that have a future value. These intangibles are amortized over a period of 3 years.
Patents and licenses
Acquired patents and licenses are measured on initial recognition at cost. Following initial recognition, they are carried at cost less any accumulated amortization and any accumulated impairment losses. They are amortized on a straight-line basis over the useful economic life and assessed for impairment whenever there is an indication that the intangible asset may be impaired.
Software costs
Costs for software license fees purchased from third parties are recorded as intangible assets and amortized over a period of 5 years.
Other intangible assets
Other intangible assets mainly include customer relationships and raw material purchase contracts resulting from purchase accounting on historical acquisitions. These customer relationships recognized on the CVC acquisition in 2007 originates from a very strong customer base with low attrition and high entrance barriers for new competitors, further reducing the churn rate of the customer base. Other intangible assets were stated at fair value at acquisition and amortized using the straight-line method over their estimated useful lives (or over the term of the related agreement, if shorter).
Costs incurred to renew or extend the term of a recognized intangible asset are expensed.
IMPAIRMENT OF GOODWILL, INTANGIBLE ASSETS AND OTHER LONG-LIVED ASSETS
The Company assesses goodwill for impairment annually, or more frequently if circumstances indicate impairment may have occurred. The Company performs its required annual impairment testing in the fourth quarter of each year subsequent to completing its annual forecasting process. Each of the Company’s reporting segments represents a reporting unit.
The Company assesses goodwill for impairment by first comparing the carrying value of each reporting unit to its fair value using the present value of expected future cash flows. If the fair value is less than the carrying value, then the Company would perform a second test for that reporting unit to determine the amount of impairment loss, if any. The Company determines the fair value of its reporting units utilizing the Company’s best estimate of future revenues, operating expenses, cash flows, market and general economic conditions as well as assumptions that it believes marketplace participants would utilize, including discount rates, cost of capital, and long term growth rates. When available and as appropriate, the Company uses comparative market multiples and other factors to corroborate the discounted cash flow results.
We performed an annual impairment test at December 31, 2011, based on cash flow projections which were derived from the most current financial budgets covering a five-year period, as approved by the Board of Directors. The budgets and projected cash flows were updated based on an assessment of the main parameters described above. The cash flows beyond the five-year period were compiled using a 2% volume growth rate. The projected cash flows do not include restructuring activities that the Company has not yet committed to, or significant future investments that will enhance the performance of the reporting units. There were no goodwill impairments recorded for the years ended December 31, 2009, 2010 and 2011.
F-11
Table of Contents
The Company evaluates the recoverability of its other long-lived assets, including amortizable intangible assets, if circumstances indicate an impairment may have occurred. This analysis is performed by comparing the respective carrying values of the assets to the current and expected future cash flows, on an undiscounted basis, to be generated from such assets. Property and equipment is evaluated separately within each business unit. If such analysis indicates that the carrying value of these assets is not recoverable, then the carrying value of such assets is reduced to fair value through a charge to the Company’s Consolidated Statements of Operations. There were no impairments recorded relating to other long-lived assets, including amortizable intangible assets, for the years ended 2009, 2010 or 2011.
LEASES
We lease land and fixed assets for use in our operations. All lease agreements are evaluated and classified as either an operating lease or a capital lease. A lease is capitalized as a capital lease if any of the following criteria are met: transfer of ownership to the lessee by the end of the lease term; the lease contains a bargain purchase option; the lease term is equal to 75% or greater of the asset’s useful economic life; or the present value of the future minimum lease payments is equal to or greater than 90% of the asset’s fair market value. Capital leases are capitalized at the lower of the net present value of the total amount of rent payable under the leasing agreement (excluding finance charges) or fair market value of the leased asset. Capital lease assets are depreciated on a straight-line basis, over a period consistent with our normal depreciation policy for tangible fixed assets, but not exceeding the lease term. Operating lease expense is recognized ratably over the entire lease term.
CONTINGENCIES
The Company records liabilities for loss contingencies, including environmental remediation costs, arising from claims, assessments, litigation, fines and penalties and other sources when it is probable that a liability has been incurred and the amount of the assessment and/or remediation can be reasonably estimated.
PENSIONS AND OTHER POST-RETIREMENT BENEFITS
All post-retirement benefits are accounted for on an accrual basis using actuarial assumptions. Post-retirement pension benefits are provided for substantially all employees of Taminco NV and Taminco Germany GmbH, through plans specific to each of these legal entities. The costs of the benefits provided through plans of the Company are included in the accompanying consolidated financial statements and summarized in detail along with other information pertaining to these plans in Note 12. These actuarial calculations include making assumptions about discount rates, expected rates of return on plan assets, future salary increases, future health care costs, mortality rates and future pension increases. Due to the long-term nature of these plans, estimates are subject to uncertainty. Plans are primarily concentrated in Belgium and Germany. Employees of Taminco Inc. have a 401k plan.
The Company is also required to measure a defined benefit plan’s assets and obligations that determine its funded status as of the end of the employer’s fiscal year, and recognize changes in the funded status of a defined benefit post-retirement plan in comprehensive income in the year in which the changes occur.
Additionally, the Company offers to its Belgian employees, executives and blue collar workers the opportunity to enter into an early retirement scheme, as agreed in a collective employment agreement at the level of the Belgian Chemicals Industry sector. The employee benefits of this early retirement scheme are partly paid by the Company and partly paid by the Belgian Government. This early retirement scheme is unfunded and is recorded in the non-current liabilities section of the consolidated balance sheets. The amounts accrued in the Financial Statements are derived from an actuarial calculation and represent the current and future liabilities from the Company to fund its obligations in this early retirement scheme.
F-12
Table of Contents
DERIVATIVE INSTRUMENTS
The Company uses derivative financial instruments such as interest rate swaps to manage its risk associated with interest rate fluctuations. Such financial instruments are recorded at fair value. The fair value of the interest rate swaps is determined by estimating the present value of amounts to be paid under the agreement offset by the net present value of expected cash inflows based on market rates. See note 14 for further details regarding these instruments.
ADVERTISING EXPENSE
Advertising costs are expensed in the period incurred. Advertising expenses, recorded within the Selling, general and administrative line item on the Consolidated Statement of Operations, were approximately $0.2 million, $0.4 and $0.5 million for the years ended December 31, 2009, 2010 and 2011 respectively.
RESEARCH, DEVELOPMENT AND ENGINEERING EXPENSES
Research, development and engineering costs are expensed as incurred.
INCOME TAXES
The Company’s provision for income taxes is determined using the liability method, under which deferred tax assets and liabilities are calculated based upon the temporary differences between the financial statement and income tax bases of assets and liabilities using currently enacted tax rates and net operating loss and tax credit carryforwards.
The Company’s deferred tax assets are recorded net of a valuation allowance when, based on the weight of available evidence, it is more likely than not that all or some portion of the recorded deferred tax balances will not be realized in future periods. The amount of deferred tax assets considered realizable could be impacted in the near period if there are changes in estimates of future taxable income in the carryforward period.
The Company recognizes a tax benefit when it is more likely than not, based on the technical merits, that the position would be sustained upon examination by a taxing authority. The amount to be recognized is measured as the largest amount of tax benefit that is greater than 50% likely of being realized upon settlement with a taxing authority. The Company records interest and penalties accrued in relation to unrecognized tax benefits as income tax expense.
EARNINGS PER SHARE
Basic net income / (loss) per basic and diluted share has been computed using the number of the company’s common shares outstanding. A basic earnings per share is computed using the weighted average number of shares outstanding during the period.
RECENTLY ISSUED ACCOUNTING STANDARDS
In May 2011, the Financial Accounting Standards Board (FASB) issued authoritative guidance on fair value measurements and disclosures which becomes effective for interim and annual periods beginning after December 15, 2011. The new guidance enhances disclosures and refines certain aspects of fair value measurement that primarily affect financial instruments. The adoption of this guidance is not expected to have a material effect on the Company’s consolidated financial statements.
In June 2011, the FASB issued amendments to the presentation of comprehensive income, which becomes effective for interim and annual periods beginning after December 15, 2011, with retrospective application. The
F-13
Table of Contents
amendments eliminate the current reporting option of displaying components of other comprehensive income within the statement of changes in stockholders’ equity. Under the new guidance, the Company has presented an operating statement immediately followed by a statement of comprehensive income for all years presented.
3. Accounts Receivable
The Company has a Non-Recourse Factoring Facility with BNP Paribas Fortis Factor NV, which we use to manage fluctuations in our trade working capital. The Factoring Facility has a limit of $129 million (the U.S. Dollar equivalent of the €100 million commitment amount as of December 31, 2011) and applies to the eligible accounts receivable of Taminco NV and Taminco, Inc. It does not apply to receivables in our subsidiaries in Germany, Italy, China or Brazil. The arrangement contains limitations as to the amount of eligible receivables that any one debtor can be factored at any moment in time. The limit is usually 15% of the amount of outstanding eligible receivables with the exception of certain specific debtors, where this limit is 30%. The total amount of eligible receivables insured by BNP Paribas Fortis Factor NV sold during 2009, 2010 and 2011 were $375.5 million, $480.3 million and $710.3 million, respectively. The Non-recourse Factoring Facility was initially committed until July 1, 2015 with a provision for indefinite extension and a notice period prior to termination of one year, but was modified subsequent to financial year 2012. The Company sells the receivables at face value but receives actual funding net of a deposit account (approximately 85%) until collections are received from customers for the receivables sold.
The costs associated with the Non-recourse Factoring Facility consist of a commission fee on the factored receivables and an interest charge on the amount drawn under the facility. The commission fee and interest charge for 2009, 2010 and 2011 were $1.8 million, $1.4 million and $1.5 million, respectively. The commission fee was $1.2 million, $1.2 million and $0.9 million for 2009, 2010 and 2011, respectively, and is included in the line item “Selling, general and administrative expense” of the Consolidated Statement of Operations while the interest charge is included in the line item “Interest expense” and amounted to $0.6 million, $0.2 million and $0.6 million, respectively The sold receivables are removed from the accounts receivables in accordance with guidance under ASC topic 860, Transfers and Servicing. The amount drawn under the Non-recourse Factoring Facility was $57.3 million, $66.0 million and $75.4 million at December 31, 2009, 2010 and 2011, respectively.
As part of the program, the Company continues to service the receivables. The fair value of the receivables sold equals the carrying value at the time of the sale, and no gain or loss was recorded. The Company estimates the fair value using Level 3 inputs based on historical and anticipated performance of similar receivables, including historical and anticipated credit losses. The Company is exposed to credit losses of factored/sold receivables up to the amount of the deposit amount. Credit losses for receivables sold and past due amounts outstanding for the years ended December 31, 2010 and 2011 were both immaterial.
Allowances for doubtful accounts were $0.7 million and $1.3 million at December 31, 2010 and 2011, respectively, and mainly related to the receivables not sold. For the years ended December 31, 2009, 2010 and 2011, the expense charged for uncollectable accounts was $0.1 million, $(0.1) million and $0.7 million.
4. Inventories
Inventories consisted of the following components at December 31:
| For the Year Ended December 31, | ||||||||
| 2010 | 2011 | |||||||
| Finished goods and work-in-progress |
$ | 65 | $ | 93 | ||||
| Raw materials and supplies |
22 | 24 | ||||||
|
|
|
|
|
|||||
| Total inventories |
$ | 87 | $ | 117 | ||||
|
|
|
|
|
|||||
F-14
Table of Contents
Total inventories are presented net of an allowance for excess and obsolete inventory of $2.1 million and $1.5 million at December 31, 2010 and 2011, respectively. For the years ended December 31, 2009, 2010 and 2011, the expense charged for excess and obsolete inventory was $0.4 million, $0.7 million and $0.2 million, respectively.
5. Property, Plant and Equipment
Property, plant and equipment, at cost, and the related accumulated depreciation were as follows at December 31:
| For the Year Ended December 31, | ||||||||
| 2010 | 2011 | |||||||
| Land and improvements |
$ | 12 | $ | 12 | ||||
| Buildings, structures and related improvements |
25 | 19 | ||||||
| Plant, machinery and equipment |
344 | 363 | ||||||
| Furniture and vehicles |
4 | 5 | ||||||
| Construction-in-process |
13 | 37 | ||||||
| Software |
6 | 6 | ||||||
|
|
|
|
|
|||||
| Less accumulated depreciation |
158 | 193 | ||||||
|
|
|
|
|
|||||
| Total Property, plant and equipment, net |
$ | 246 | $ | 249 | ||||
|
|
|
|
|
|||||
In 2011, the Company decided to close the production facility of Taminco Comércio e Industría de Aminas Ltda. located in Camaçari, Bahia, Brazil. The closure of the plant did not meet the criteria as a discontinued operation due to continuance of the business through other production facilities in the United States. The assets, relating predominantly to land and buildings, plant and machinery, have been presented separately on the face of the balance sheet as assets held for sale amounting to $ 2.1 million. Management believes the net assets are recoverable.
Total capitalized interests amounted to $0.2 million, $0.5 million and $0.4 million for the years ended December 31, 2009, 2010 and 2011. Total depreciation expense for the years ended December 31, 2009, 2010 and 2011 was $52.1 million, $47.3 million and $43.9 million, respectively.
CAPITAL LEASES
| (In millions) | 2010 | 2011 | ||||||||||||||||||||||
| Cost | Accumulated Amortization |
Net | Cost | Accumulated Amortization |
Net | |||||||||||||||||||
| Plant, machinery and equipment |
$ | 12 | $ | 2 | $ | 10 | $ | 11 | $ | 3 | $ | 8 | ||||||||||||
|
|
|
|
|
|
|
|
|
|
|
|
|
|||||||||||||
| Total capital lease assets |
$ | 12 | $ | 2 | $ | 10 | $ | 11 | $ | 3 | $ | 8 | ||||||||||||
|
|
|
|
|
|
|
|
|
|
|
|
|
|||||||||||||
We lease our co-generating equipment under long-term capital leases. The amortization expense of assets recorded under capital leases are included with the depreciation expense and for the years ended December 31, 2009, 2010 and 2011 was $0.8 million, $1.1 million and $1.2 million, respectively.
The aggregate future estimated payments under these commitments are:
| 2012 |
$ | 1 | ||
| 2013 |
1 | |||
| 2014 |
1 | |||
| 2015 |
1 | |||
| 2016 |
1 | |||
| Thereafter |
3 | |||
|
|
|
|||
| Total capital lease |
$ | 8 | ||
|
|
|
F-15
Table of Contents
The future interest payments are $0.4 million for 2012 and 2013, $0.3 million for 2014 and 2015 and $0.2 million for 2016 and thereafter.
OPERATING LEASES
We lease office facilities, railcars, vehicles and other equipment under long-term non-cancelable operating leases
The aggregate future estimated payments under these commitments are:
| 2012 |
$ | 10 | ||
| 2013 |
9 | |||
| 2014 |
9 | |||
| 2015 |
8 | |||
| 2016 |
8 | |||
| Thereafter |
8 | |||
|
|
|
|||
| Total minimum lease payment |
$ | 52 | ||
|
|
|
Rental expense for the years ended December 31, 2009, 2010 and 2011 was $12.7 million, $12.6 million and $13.9 million, respectively.
ASSET RETIREMENT OBLIGATIONS
The Company has a contractual obligation to remove certain assets constructed on leased land. The fair value of the future retirement obligation is recorded as a liability on a discounted basis when they are incurred and an equivalent amount is capitalized to property and equipment. The initial recorded obligation is discounted using the Company’s credit adjusted risk free-rate and is reviewed periodically for changes in the estimated future costs underlying the obligation. The Company amortizes the initial amount capitalized to property and equipment as depreciation expense, and recognizes accretion expense in connection with the discounted liability over the estimated remaining useful life of the leased assets in the line cost of sales in the consolidated Statement of Operations.
In August 2007, an asset retirement obligation of $1.7 million was established representing the discounted cost of the Company’s estimate of the obligations to remove any equipment at the end of the lease term at one of its production facilities. The estimate was developed with the assistance of a third party contractor familiar with the site.
During the years ended December 31, 2010 and 2011, the asset retirement obligations amounted to $2.4 million and $2.6 million, respectively. During both years, there was an accretion of discount amount to $0.2 million.
F-16
Table of Contents
6. Other Investments
At December 31, 2011, the Company has one equity method investment. The Company and MGC Group entered into a joint venture agreement for the Chinese company Te An Ling Tian, in which the Company has acquired a 50% interest. Total investment in the joint venture amounts to $ 6.5 million of which $ 2.5 million was paid in March 2011 and $ 4.0 million was paid in September 2011. In April 2011, the joint venture partners agreed on an equal capital increase in which the Group contributed $2.5 million. In September 2011 the partners agreed to further finance the venture in equal amounts, in which the Company provided a subordinated shareholder loan of $5.0 million.
| Year Ended December 31, 2011 |
||||
| Beginning balance |
$ | — | ||
| Loss from equity investments |
(2 | ) | ||
| Contributions to joint venture |
14 | |||
|
|
|
|||
| Ending Balance |
$ | 12 | ||
|
|
|
|||
7. Goodwill and Intangible Assets
On July 4, 2007, CVC Capital Partners, through its subsidiary Taminco Group Holdings S.à r.l. (a Luxembourg legal entity), entered into a share purchase agreement with Alpinvest Partners Direct Investment 2003 CV (a Dutch legal entity) and Stichting Executives Taminco (a Dutch legal foundation) to acquire 100% of the shares in Taminco NV. Taminco Group Holdings S.à r.l. acquired control of the shares of Taminco NV on August 31, 2007 for a total purchase price of €601 million ($820 million). The acquisition was accounted for using the purchase method of accounting and purchase price was allocated based on the estimated fair value of the assets acquired and liabilities assumed, and gave rise to a goodwill of €418 million ($540 million valued at $/€ exchange rate as of December 31, 2011).
Goodwill by reporting unit, which is consistent with our reporting segments and changes in the carrying amounts are as follows:
| Functional Amines |
Specialty Amines |
Crop Protection |
Total | |||||||||||||
| Balance at January 1, 2009 |
$ | 151 | $ | 187 | $ | 245 | $ | 583 | ||||||||
| Foreign Currency Translation |
6 | 5 | 8 | 19 | ||||||||||||
| Balance at December 31, 2009 |
157 | 192 | 253 | 602 | ||||||||||||
| Foreign Currency Translation |
(12 | ) | (14 | ) | (18 | ) | (44 | ) | ||||||||
| Balance at December 31, 2010 |
145 | 178 | 235 | 558 | ||||||||||||
| Foreign Currency Translation |
(5 | ) | (6 | ) | (7 | ) | (18 | ) | ||||||||
|
|
|
|
|
|
|
|
|
|||||||||
| Balance at December 31, 2011 |
$ | 140 | $ | 172 | $ | 228 | $ | 540 | ||||||||
|
|
|
|
|
|
|
|
|
|||||||||
F-17
Table of Contents
Intangible assets consisted of the following components:
| As of December 31, 2010 | As of December 31, 2011 | |||||||||||||||||||||||||||
|
Weighted |
Weighted |
Cost | Accumulated Amortization |
Net | Cost | Accumulated Amortization |
Net | |||||||||||||||||||||
| Land leasehold |
44 years | 49 years | $ | 4 | $ | — | $ | 4 | $ | 4 | $ | — | $ | 4 | ||||||||||||||
| Regulatory costs |
1.5 years | 3 years | 11 | 4 | 7 | 9 | 2 | 7 | ||||||||||||||||||||
| Customer relationships |
11 years | 13 years | 183 | 47 | 136 | 177 | 59 | 118 | ||||||||||||||||||||
| Technology, patents and license costs |
2 years | 10 years | 10 | 8 | 2 | 11 | 9 | 2 | ||||||||||||||||||||
| Various Contracts |
8 years | 15 years | 70 | 19 | 51 | 68 | 24 | 44 | ||||||||||||||||||||
| Software License costs |
3 years | 5 years | 2 | 1 | 1 | 2 | 2 | — | ||||||||||||||||||||
|
|
|
|
|
|
|
|
|
|
|
|
|
|||||||||||||||||
| Total intangible assets |
10 years | 13 years | $ | 280 | $ | 79 | $ | 201 | $ | 271 | $ | 96 | $ | 175 | ||||||||||||||
|
|
|
|
|
|
|
|
|
|
|
|
|
|||||||||||||||||
Intangible asset amortization expense for the years ended December 31, are as follows:
| For the Year Ended December 31, | ||||||||||||
| 2009 | 2010 | 2011 | ||||||||||
| Land leasehold |
$ | — | $ | — | $ | — | ||||||
| Regulatory costs |
— | 4 | 4 | |||||||||
| Customer relationships |
15 | 14 | 15 | |||||||||
| Technology, patents and license costs |
7 | 2 | 2 | |||||||||
| Various contracts |
6 | 6 | 6 | |||||||||
| Software license |
1 | — | — | |||||||||
|
|
|
|
|
|
|
|||||||
| Total amortization expense |
$ | 29 | $ | 26 | $ | 27 | ||||||
|
|
|
|
|
|
|
|||||||
Estimated annual intangible amortization expense for 2012 through 2016 is $27 million.
8. Other Current Liabilities
Other Current Liabilities consisted of the following components:
| For the Year Ended December 31, | ||||||||
| 2010 | 2011 | |||||||
| Payroll and benefits |
$ | 10 | $ | 10 | ||||
| Taxes other than income taxes |
3 | 5 | ||||||
| Deferred income |
13 | 14 | ||||||
| Accrued charges |
18 | 15 | ||||||
| Other |
4 | — | ||||||
|
|
|
|
|
|||||
| Total other current liabilities |
$ | 48 | $ | 44 | ||||
|
|
|
|
|
|||||
F-18
Table of Contents
9. Restructuring
The following table sets forth the changes in the restructuring reserve:
| Total | ||||
| Balance as of January 1, 2009 |
$ | — | ||
| Incurred and charged to expense |
4 | |||
|
|
|
|||
| Balance as of December 31, 2009 |
$ | 4 | ||
|
|
|
|||
| Incurred and charged to expense |
$ | — | ||
| Cash payments |
(4 | ) | ||
|
|
|
|||
| Balance as of December 31, 2010 |
$ | — | ||
|
|
|
|||
| Incurred and charged to expense |
$ | 11 | ||
| Cash payments |
1 | |||
|
|
|
|||
| Balance as of December 31, 2011 |
$ | 10 | ||
|
|
|
|||
During the year ended December 31, 2009, the Company decided to close their Riverview plant in the U.S. The assets which could be recovered from this restructuring process were transferred to the St. Gabriel, Louisiana operating unit. As a result, the Company incurred restructuring costs for an amount of $4 million, which was principally composed of one-time termination benefits. The 2009 restructuring affected the Functional Amines and Specialty Amines segments.
The restructuring costs for financial year 2009 can be broken down as follows:
| One-time termination benefits |
4 | |||
| Total |
$ | 4 |
In 2011 the Company recognized restructuring expenses reported in the Other Operating Expense of the Consolidated Statement of Operations for a total amount of $ 11 million primarily related to a restructuring provision following the decision in August 2011 to close the MIPA (monoisopropylamine) production facility of Taminco Comércio e Industría de Aminas Ltda. located in Camaçari, Bahia, Brazil. The provision is an estimate for all costs related to the closure such as employee termination indemnities, early termination indemnity of raw material and utilities supply contracts and cleaning costs to make the site available for sale. The operating business of the MIPA facility has moved to the production facility in St. Gabriel, Louisiana. The MIPA business is now managed through the North American entity, Taminco Inc. The 2011 restructuring affected the Functional Amines segment.
The 2011 restructuring provision can be broken down as follows:
| Supplier termination expenses |
$ | 6 | ||
| Other expenditures |
2 | |||
| Severance liabilities |
3 | |||
|
|
|
|||
| Total |
$ | 11 | ||
|
|
|
F-19
Table of Contents
10. Short and Long-Term Debt
Total Indebtedness is as follows:
| For the Year Ended December 31, |
||||||||
| 2010 | 2011 | |||||||
| Capital and financing lease obligations |
$ | 10 | $ | 8 | ||||
| Subordinated capitalization bonds(1) |
350 | 373 | ||||||
| Term facility—€ loan |
435 | 413 | ||||||
| Term facility—$ loan |
344 | 337 | ||||||
|
|
|
|
|
|||||
| Total |
1,139 | 1,131 | ||||||
| Less current maturities |
15 | 29 | ||||||
|
|
|
|
|
|||||
| Total long-term and related party debt |
$ | 1,124 | $ | 1,102 | ||||
|
|
|
|
|
|||||
| (1) | Subordinated capitalization bonds are related party debt. See note 15 for more information. |
Aggregate maturities of debt for long-term borrowings are as follows:
| 2013 |
$ | 35 | ||
| 2014 |
39 | |||
| 2015 |
243 | |||
| 2016 |
253 | |||
| Thereafter |
532 | |||
|
|
|
|||
| Total aggregate maturities of debt |
$ | 1,102 | ||
|
|
|
The Company entered into a EUR 440 million and USD 357 million Senior Facility Agreement with Rabobank dated August 31, 2007. The Senior Facility Agreement includes a number of smaller loan facilities with floating interest rates (Libor or Euribor + margin) which have been partially swapped into fixed interest rates via various interest rate swap contracts (see note 14). USD denominated loan agreements are mainly recorded by the US entity Taminco Inc. and a small portion by Taminco NV; whereas the EUR loan agreements are contracted by Taminco NV and Taminco Germany entities having EUR as functional currency. In 2010 following a US restructuring whereas Taminco North America Inc., Taminco Higher Amines Inc. and Taminco Inc. merged into Taminco Methylamines Inc., the USD denominated loan agreements recorded by Taminco North America Inc. were transferred to Taminco Methylamines Inc. This merger had no impact on the outstanding bank debt. In 2011 Taminco Methylamines Inc. was renamed into Taminco Inc.
Interest rates and maturities on Rabobank Senior facility agreements were as follows:
| Interest Rate% |
Maturity Date | |||
| Facility A—$ loan |
LIBOR +2.00 | August 31, 2014 | ||
| Facility A—€ loan |
EURIBOR +2.00 | August 31, 2014 | ||
| Facility B—$ loan |
LIBOR +2.00 | August 31, 2015 | ||
| Facility B—€ loan |
EURIBOR +2.00 | August 31, 2015 | ||
| Facility C—$ loan |
LIBOR +3.25 | August 31, 2016 | ||
| Facility C—€ loan |
EURIBOR +3.25 | August 31, 2016 | ||
| Facility D—$ loan |
LIBOR +4.25 | August 31, 2017 |
The costs related to the issuance of debt are capitalized and amortized over the life of the related debt. The Company has a balance of $13 million and $10 million related to deferred financing costs included in the non-current assets of the Consolidated Balance Sheets as of December 31, 2010 and 2011, respectively. A total of $2.7 million, $2.6 million and $2.9 million was amortized during the years ended December 31, 2009, 2010 and 2011, respectively, and included in interest expense of the Consolidated Statements of Operations.
F-20
Table of Contents
The Senior Facility Agreement contains terms and provisions (including representations, covenants and conditions) customary for credit agreements of this type. There are three primary financial covenants. The interest over covenant is a test which requires the consolidated EBITDA should be more than 1.8 times the consolidated total net cash interest expense. The leverage ratio is a leverage test which requires Total Net Debt, as defined, not exceeding 7 times the consolidated EBITDA. The cash flow cover requires that total consolidated cash flow is both positive and larger than the total net cash interest expense and all repayments of borrowings on consolidated basis. As of December 31, 2011, we were in compliance with all debt covenants.
The Senior Facility Agreement with Rabobank has been secured through:
| • | Pledges of the shares of Taminco NV, Taminco South NV, Taminco North BVBA, Taminco Germany GmbH, Taminco do Brasil Comércio & Industria de Aminas Ltda, Taminco Do Brasil Produtos Quimicos LTDA and Taminco Inc. amounting to $1.2 billion; |
| • | Mortgages and pledges on the business of Taminco NV amounting to $662 million and; |
| • | Pledges on the receivables of Taminco NV, Taminco North BVBA and Taminco South NV amounting to $203 million. |
11. Share-Based Compensation
STOCK OPTIONS
In August 2007 certain management members (“Beneficiaries”) entered into an agreement (the “Option Agreement”) whereby stock options were granted to management that are exercisable into shares of Taminco International S.à r.l. (which was the direct holding company of Taminco Group Holdings S.à r.l. until February 14, 2012). In accordance with the Option Agreement, the options are exercisable only upon the occurrence of a sale of the Company, change in control, or initial public offering (the “Exit Event”). The number of exercisable options is determined on the basis of the internal rate of return achieved by the investors in Taminco International S.à r.l. upon the Exit Event. All options lapse if the option holders cease to remain employees of the Company through the Exit Event. Since the stock options only become exercisable upon an Exit Event, management determined that it is not probable that such options will vest until the Exit Event occurs.
The maximum number of stock options to be granted to the Beneficiaries upon the agreement in 2007 amounted to 165 million with an exercise price of $0.01 per option. The maximum number of stock options which potentially could vest upon an Exit Event remained unchanged at 165 million for the years ended December 31, 2009, 2010 and 2011.
The grant date fair value of the options was $8 million and was calculated using the Monte Carlo model. The following table summarizes the significant assumptions used for the grant in 2007.
| Assumption |
||||
| Risk-free interest rate |
4.56 | % | ||
| Expected equity volatility |
55 | % | ||
| Expected time to exit event |
3 Years |
The risk free interest rate is based on the yield of a 3 year Euro Swap rate. Equity volatility is based upon the stock price return of publicly traded comparable companies.
For the years ended December 31, 2009, 2010 and 2011, these stock options have had no impact on cash flow or income statement.
An Exit Event occurred on February 14, 2012 and consequently certain stock options became exercisable and were converted into shares. As the vesting of such options was not probable until the Exit Event, the Company recorded a non-cash compensation charge during the period from January 1, 2012 through February 14, 2012 (Predecessor period). The charge represented the fair value of the options as determined on the date of grant.
F-21
Table of Contents
OTHER SHARE-BASED ARRANGEMENT
In connection with the acquisition of the Company in August 2007, certain agreements were entered into whereby management invested $36 million in Taminco International S.à r.l., which was comprised of $33 million in subordinated loans and $3 million in shares. The subordinated loans bear a fixed compounded interest rate of 10%. Under the terms of the agreements, the loans and the shares required that management provide service to the Company through the Exit Event. If management were to terminate employment at its own discretion or by the Company for cause prior to the Exit Event, the entire investment and accrued interest with respect to the subordinated loans would be forfeited. As a result, the arrangement is accounted for as compensatory and expense is pushed down from Taminco International S.à r.l. to the financial statements of the Company.
Since the loans are cash settled, it is treated as a liability award, and compensation expense will be recognized when it is probable that the Exit Event will occur in an amount equal to the actual amount paid to management at the Exit Event. The shares are an equity award as settlement is required in shares. Therefore, the Company determined the fair value of the shares on the grant date and compensation expense will be recognized when it is probable that the Exit Event will occur. The fair value of the shares on the grant date is equal to $3 million.
An Exit Event occurred on February 14, 2012 and consequently the actual amount paid to management under the terms of the loan, and the grant date fair value of the shares, will be expensed in the period from January 1, 2012 through February 14, 2012 (Predecessor period).
12. Commitments and Contingencies
COMMITMENTS
At December 31, 2011 the Company had capital expenditure commitments of $1.9 million, mainly related to the new production unit in the US which is expected to be completed by the end of 2012, compared to $3.5 million as at December 31, 2010, which had been accrued for the construction of a waste water treatment installation. Refer to note 5 for our lease commitments.
CONTINGENCIES
The Company is, from time to time, subject to a variety of litigation and similar proceedings incidental to its business. These legal matters primarily involve claims for damages arising out of the use of the Company’s products and services and claims relating to intellectual property matters, employment matters, tax matters, commercial disputes, competition and sales and trading practices, personal injury and insurance coverage. The Company may also become subject to lawsuits as a result of past or future acquisitions or as a result of liabilities retained from, or representations, warranties or indemnities provided in connection with, divested businesses. Some of these lawsuits may include claims for punitive and consequential, as well as compensatory damages. Based upon the Company’s experience, current information and applicable law, it does not believe that these proceedings and claims will have a material adverse effect on its consolidated results of operations, financial position or liquidity.
13. Pensions and Other Long-Term Post-Employment Benefits
The Company offers pensions and various other long-term benefit plans to its employees. Where permitted by applicable law, the Company reserves the right to change, modify or discontinue the plans.
F-22
Table of Contents
The Company recognizes liabilities in its consolidated balance sheets a liability for the long-term pension and post employment benefit obligations. These amounted to $11 million and $13 million as at December 31, 2010 and 2011, respectively. The following table presents the significant components of the long-term liability for employee benefits:
| 2010 | 2011 | |||||||
| Defined benefit pension plans in Belgium |
$ | 5 | $ | 7 | ||||
| Compensation career termination—early retirement in Belgium |
4 | 5 | ||||||
| Other long-term employee benefits in Belgium |
1 | 1 | ||||||
| Long-term employee compensation in other entities |
1 | — | ||||||
|
|
|
|
|
|||||
| Total long-term liability for employee benefits |
$ | 11 | $ | 13 | ||||
|
|
|
|
|
|||||
DEFINED BENEFIT PLANS BELGIUM
The Company funds two major defined benefit pension plans in Belgium, covering approximately 85 senior management members and 116 employees. Both plans are financed through a group insurance product at AXA Belgium NV.
The following table provides a reconciliation of projected benefit obligations, plan assets and the funded status of these defined benefit plans:
| For the Year Ended December 31, | ||||||||
| 2010 | 2011 | |||||||
| Change in benefit obligation: |
||||||||
| Benefit obligation, beginning of period |
$ | 15 | $ | 16 | ||||
| Service cost |
1 | 1 | ||||||
| Interest cost |
1 | 1 | ||||||
| Actuarial loss in year |
1 | 2 | ||||||
| (Benefits paid)/transfers in year |
(1 | ) | (1 | ) | ||||
| Foreign currency exchange rate changes |
(1 | ) | (1 | ) | ||||
|
|
|
|
|
|||||
| Benefit obligation, end of period |
16 | 18 | ||||||
|
|
|
|
|
|||||
| Change in plan assets: |
||||||||
| Fair value of plan assets, beginning of period |
$ | 11 | $ | 11 | ||||
| Actual return on plan assets |
1 | 1 | ||||||
| Company contributions |
1 | 1 | ||||||
| Benefits paid |
(1 | ) | (1 | ) | ||||
| Foreign currency exchange rate changes |
(1 | ) | (1 | ) | ||||
|
|
|
|
|
|||||
| Fair value of plan assets, end of period |
11 | 11 | ||||||
|
|
|
|
|
|||||
| Funded status of continuing operations, end of period |
$ | (5 | ) | $ | (7 | ) | ||
|
|
|
|
|
|||||
The accumulated actuarial losses recognized in accumulated other comprehensive income amounted to $1.8 million and $3.5 million at December 31, 2010 and 2011, respectively. The amounts recognized in other comprehensive income for the years ended December 31, 2009, 2010 and 2011 is $1.6 million, $1.0 million and $1.9 million, respectively.
F-23
Table of Contents
The following table provides the components of net periodic pension costs of these defined benefit plans:
| For the Year Ended December 31, | ||||||||||||
| 2009 | 2010 | 2011 | ||||||||||
| Net periodic Pension Cost: |
||||||||||||
| Service cost |
$ | 1 | $ | 1 | $ | 1 | ||||||
| Interest cost |
1 | 1 | 1 | |||||||||
| Expected return on plan assets |
(1 | ) | (1 | ) | (1 | ) | ||||||
|
|
|
|
|
|
|
|||||||
| Net periodic benefit cost |
$ | 1 | $ | 1 | $ | 1 | ||||||
|
|
|
|
|
|
|
|||||||
The Group expects to contribute $1.2 million to its defined benefit pension plans in 2012.
Additional benefit obligation information
The information below includes all plans.
| Defined Benefit Pension Plans |
||||||||
| 2010 | 2011 | |||||||
| Accumulated benefit obligation |
$ | 11 | $ | 12 | ||||
The information below relates to plans with accumulated benefit obligations in excess of plan assets
| Defined Benefit Pension Plans |
||||||||
| 2010 | 2011 | |||||||
| Projected benefit obligation |
$ | 16 | $ | 18 | ||||
| Accumulated benefit obligation |
11 | 12 | ||||||
| Fair value of plan assets |
11 | 11 | ||||||
The information below relates to plans with projected benefit obligations in excess of plan assets
| Defined Benefit Pension Plans |
||||||||
| 2010 | 2011 | |||||||
| Projected benefit obligation |
$ | 16 | $ | 18 | ||||
| Fair value of plan assets |
11 | 11 | ||||||
Plan assets
The Company’s pension plans assets consist of guaranteed investment contracts with a large insurance company, AXA Belgium. The insurance company invests the majority of its funds in sovereign and corporate bonds. Investment decisions are based on strategic asset allocation studies and risk management best practices. The contracts provide a guaranteed rate of return, with returns over the guaranteed amount provided at the discretion of the insurance company based on actual returns of the investments. The contracts are recorded at fair value and are considered in the fair value hierarchy as Level 2 assets, for valuation purposes, based on contract value. Contract value is the most relevant indicator of fair value because the contracts can be redeemed or transferred at this amount.
F-24
Table of Contents
Estimated future benefit payments
As of December 31, 2011, future expected benefit payments by our pension plans which reflect expected future service, as appropriate, were as follows:
| 2012 | 2013 | 2014 | 2015 | 2016 | 2017-2021 | |||||||||||||||||||
| Belgian pension plans |
$ | 1 | $ | 2 | $ | 2 | $ | 1 | $ | 1 | $ | 11 | ||||||||||||
|
|
|
|
|
|
|
|
|
|
|
|
|
|||||||||||||
| Total |
$ | 1 | $ | 2 | $ | 2 | $ | 1 | $ | 1 | $ | 11 | ||||||||||||
|
|
|
|
|
|
|
|
|
|
|
|
|
|||||||||||||
Actuarial assumptions
The Company’s actuarial assumptions are determined based on the demographics of the population, the discount rate, the expected long-term return on assets, the rate of salary increase including inflation, the increase of the pension ceiling including inflation, economic trends, statutory requirements and other factors that could impact the benefit obligation and plan assets.
The assumptions used in determining net benefit costs and net benefit liabilities for our pension plans were as follows:
| 2009 | 2010 | 2011 | ||||||||||
| Discount rate |
5.0 | % | 4.5 | % | 4.0 | % | ||||||
| Expected rate of return on assets |
4.5 | % | 4.5 | % | 4.5 | % | ||||||
| Future salary increases |
3.5 | % | 3.5 | % | 3.5 | % | ||||||
| Future pension increases |
2.0 | % | 2.0 | % | 2.0 | % | ||||||
The Company selects the discount rates based on cash flow models using the yields of high-grade corporate bonds with the same duration of the pension and prepension liabilities within the Group, namely around 10 years.
The discount rate assumption in this chart changed from 2010 to 2011, resulting in a change in the pension benefit obligation. In the table showing that reconciles the change in benefit obligations for the year, the impact of the discount rate change is included in the actuarial loss line item.
The expected return on plan assets is based on market expectations both forward-looking as well as historical experience, taking into account the duration of the pension liabilities. As of financial year 2005, the average return on plan assets have been in the range of 4.93% to 5.13%, but has been reduced to 4.5%, considering the current financial climate with decreasing global interest rates.
EARLY RETIREMENT SCHEME IN BELGIUM
The Company offers to its Belgian employees, executives and blue collar workers the opportunity to enter into an early retirement scheme, as agreed in a collective employment agreement at the level of the Belgian Chemicals Industry sector. The employee benefits of this early retirement scheme are partly paid by the Company and partly paid by the Belgian government. This early retirement scheme is unfunded and the amounts accrued in the Financial Statements are derived from an actuarial calculation and represent the current and future liabilities from the Company to fund its obligations in this early retirement scheme.
The liability for this early retirement scheme at December 31, 2010 and 2011 were $4 million and $5 million, respectively.
The principal assumptions used in determining the early retirement benefit obligation under this plan are shown below:
| 2009 | 2010 | 2011 | ||||||||||
| Discount rate |
5.0 | % | 4.5 | % | 4.0 | % | ||||||
| Rate of inflation |
2.0 | % | 2.0 | % | 2.0 | % | ||||||
F-25
Table of Contents
OTHER LONG-TERM EMPLOYEE BENEFITS IN BELGIUM
The other long-term employee benefits in Belgium relate to a seniority bonus provision for executives and employees for which the liabilities recognized at December 31, 2010 and 2011 were $0.6 million and $0.7 million, respectively.
LONG-TERM EMPLOYEE COMPENSATION IN OTHER ENTITIES
The long-term employee compensation in other entities relate to a German early retirement program (Altersteilzeit) for 11 employees in Taminco Germany GmbH. The accrued liabilities recorded under this plan at December 31, 2010 and 2011 were $0.55 and $0.36 million, respectively. The liabilities are based on an actuarial calculation with principal assumptions of a future salary increase of 3.0%, an average remaining obligation of one year and discount factors of 3.75% and 3.80% for the years ended December 31, 2010 and 2011, respectively.
DEFINED CONTRIBUTION PLANS
The Company sponsors a defined contribution savings plan for its U.S.-based employees under Section 401(k) of the Internal Revenue Code (the “401(k) Plan”). The 401(k) Plan covers all employees who meet the defined age and service requirements, and allows participants an opportunity to defer a portion of their annual compensation on a pre-tax basis. The Company contributes a percentage of its eligible employees’ earnings. In addition, the Company may, at its discretion, make an additional profit sharing contribution of a designated percentage of each employee’s compensation, based upon the employee’s length of service.
For the years ended December 31, 2009, 2010 and 2011, the total amounts included in expenses for the Company’s contributions to the 401(k) Plan were $1.8 million, $1.5 million and $1.5 million, respectively.
Certain employees in Belgium are eligible to participate in defined contribution plans by contributing a portion of their compensation. We match the employees’ contributions. Contribution to these plans and charges to expenses amounted to $0.2 million, $0.3 million and $0.3 million for the years ended December 31, 2009, 2010 and 2011, respectively.
14. Income Taxes
Our provision for income taxes is determined using the liability method, under which deferred tax assets and liabilities are calculated based upon the temporary differences between the financial statement and income tax bases of assets and liabilities using currently enacted tax rates and operating loss and tax credit carryforwards.
Our deferred tax assets are recorded net of a valuation allowance when, based on the weight of available evidence, it is more likely than not that all or some portion of the recorded deferred tax balances will not be realized in future periods. The amount of deferred tax assets considered realizable could be reduced in the near period if estimates of future taxable income in the carryforward period are reduced.
ASC 740-10 requires the recognition of a tax benefit when it is more likely than not, based on the technical merits, that the position would be sustained upon examination by a taxing authority. The amount to be recognized is measured as the largest amount of tax benefit that is greater than 50% likely of being realized upon settlement with a taxing authority.
We record interest and penalties related to unrecognized tax benefits as income tax expense.
F-26
Table of Contents
The following table summarizes the income tax provision:
| For the Year Ended December 31, | ||||||||||||
| 2009 | 2010 | 2011 | ||||||||||
| Income before taxes: |
||||||||||||
| U.S. |
$ | 33 | $ | 48 | $ | 60 | ||||||
| Non-U.S. |
(16 | ) | 7 | 4 | ||||||||
|
|
|
|
|
|
|
|||||||
| Total income before taxes |
$ | 17 | $ | 55 | $ | 64 | ||||||
|
|
|
|
|
|
|
|||||||
| Current |
||||||||||||
| U.S. Federal |
$ | 11 | $ | 7 | $ | 17 | ||||||
| U.S. State and Local |
2 | 1 | 2 | |||||||||
| Non-U.S. |
10 | 33 | 19 | |||||||||
|
|
|
|
|
|
|
|||||||
| Total current |
23 | 41 | 38 | |||||||||
| Deferred |
||||||||||||
| U.S. Federal |
(4 | ) | 8 | 4 | ||||||||
| U.S. State and Local |
(1 | ) | 2 | 1 | ||||||||
| Non-U.S. |
(2 | ) | (18 | ) | (11 | ) | ||||||
|
|
|
|
|
|
|
|||||||
| Total deferred |
(7 | ) | (8 | ) | (6 | ) | ||||||
|
|
|
|
|
|
|
|||||||
| Income tax expense |
$ | 16 | $ | 33 | $ | 32 | ||||||
|
|
|
|
|
|
|
|||||||
Current and non-current deferred income tax assets and liabilities, as of December 31, are comprised of the following:
| 2010 | 2011 | |||||||
| Assets |
||||||||
| Asset retirement obligation |
$ | 1 | $ | 1 | ||||
| Inventory |
3 | 4 | ||||||
| Loss and credit carryforwards |
44 | 59 | ||||||
| Pension |
3 | 3 | ||||||
| Financial instruments |
6 | 4 | ||||||
| Other |
1 | 1 | ||||||
|
|
|
|
|
|||||
| Gross deferred tax assets |
58 | 72 | ||||||
| Valuation allowance |
(38 | ) | (58 | ) | ||||
|
|
|
|
|
|||||
| Net deferred tax asset |
$ | 20 | $ | 14 | ||||
|
|
|
|
|
|||||
| Liabilities |
||||||||
| Property, plant and equipment |
(38 | ) | (42 | ) | ||||
| Intangible assets |
(65 | ) | (54 | ) | ||||
| Interest bearing loans |
(2 | ) | (1 | ) | ||||
|
|
|
|
|
|||||
| Total deferred tax liabilities |
(105 | ) | (97 | ) | ||||
|
|
|
|
|
|||||
| Net deferred tax liability |
$ | (85 | ) | $ | (83 | ) | ||
|
|
|
|
|
|||||
The deferred tax assets and liabilities are classified in the consolidated balance sheets as follows at December 31:
| 2010 | 2011 | |||||||
| Current deferred tax asset |
$ | 8 | $ | 7 | ||||
| Noncurrent deferred tax liability |
(93 | ) | (90 | ) | ||||
|
|
|
|
|
|||||
| Net deferred tax liability |
$ | (85 | ) | $ | (83 | ) | ||
|
|
|
|
|
|||||
F-27
Table of Contents
As of December 31, 2010 and 2011, the Company had €98 million ($176 million) and €136 million ($131 million) of foreign net operating loss carryforwards available for utilization in future years. The carryforwards have an unlimited carryforward period in all taxing jurisdictions. The Company has provided a valuation allowance on the deferred tax assets due to the uncertainty regarding the Company’s ability to realize the entire assets. The valuation allowance has increased by $11 million, $13 million and $20 million during the years ended December 31, 2009, 2010 and 2011, respectively.
Undistributed earnings of the Company’s foreign subsidiaries amounted to approximately $21 million, $418 million and $420 million at December 31, 2009, 2010 and 2011, respectively. Those earnings from material subsidiaries are considered to be indefinitely reinvested; accordingly, no provision for income taxes has been provided thereon. Upon repatriation of those earnings, in the form of dividends or otherwise, the Company would be subject to foreign income taxes in Belgium and withholding taxes payable to the various foreign countries. Determination of the amount of unrecognized deferred income tax liability is not practicable due to the complexities associated with its hypothetical calculation.
The Group’s effective income tax rate differs from the ultimate parent company, Taminco Group Holdings S.à r.l.’s, Luxembourg domestic tax rate of 28.59% for the years ended December 31, 2009, 2010 and 2011 as follows:
| For the Year Ended December 31, | ||||||||||||
| 2009 | 2010 | 2011 | ||||||||||
| Tax at statutory rate—28.59% |
28.59 | % | 28.59 | % | 28.59 | % | ||||||
| Non-taxable income |
(1 | )% | — | (2 | )% | |||||||
| Foreign tax rate differential |
16 | % | 9 | % | 7 | % | ||||||
| State taxes |
9 | % | 3 | % | 4 | % | ||||||
| Withholding tax |
1 | % | — | — | ||||||||
| Changes in tax rate—impact on deferred taxes |
(10 | )% | — | — | ||||||||
| Valuation allowance |
63 | % | 23 | % | 32 | % | ||||||
| Tax incentives |
(13 | )% | (8 | )% | (19 | )% | ||||||
| Non-deductible expenses |
2 | % | 1 | % | 1 | % | ||||||
| Net changes to tax contingency accruals |
(10 | )% | 2 | % | — | |||||||
| Other |
4 | % | 2 | % | (2 | )% | ||||||
|
|
|
|
|
|
|
|||||||
| Effective tax rate |
90 | % | 61 | % | 50 | % | ||||||
|
|
|
|
|
|
|
|||||||
The effective tax rate is mainly the result of tax losses and foreign tax rate differentials on which no deferred tax assets have been recognized.
The Company is subject to income taxes in the United States and several non-U.S. jurisdictions. Significant judgment is required in determining the worldwide provision for income taxes. In the ordinary course of business, there are many transactions and calculations where the ultimate tax determination is uncertain. The Company is regularly under audit by tax authorities whereby the outcome of the audits is uncertain.
The following table summarizes the Company’s unrecognized tax benefits, excluding interest and penalties:
| For the Year Ended December 31, | ||||||||||||
| 2009 | 2010 | 2011 | ||||||||||
| Beginning balance |
$ | 4 | $ | 3 | $ | 2 | ||||||
| Increases for tax position in current years |
1 | 1 | — | |||||||||
| Lapse of statute of limitations |
(2 | ) | (2 | ) | — | |||||||
|
|
|
|
|
|
|
|||||||
| Ending balance |
$ | 3 | $ | 2 | $ | 2 | ||||||
|
|
|
|
|
|
|
|||||||
F-28
Table of Contents
At December 31, 2009, 2010 and 2011, there are $1.4 million, $2.3 million and $2.4 million of unrecognized tax benefits, including penalties and interest, that if recognized would affect the annual effective tax rate. The Company anticipates that it is reasonably possible that approximately $0.5 million of unrecognized tax benefits, primarily related to nondeductible interest, will be reversed within the next 12 months due to statute of limitations.
The Company classifies the liability for unrecognized tax benefits in noncurrent liabilities in the consolidated balance sheets. At December 31, 2009, 2010 and 2011, total interest, net of tax, and penalties included in the income tax expense was $0.02 million, $0.2 million and $0.1 million, respectively. Interest and penalties related to unrecognized tax benefits totaled $0.2 million and $0.2 million in the Company’s consolidated balance sheet at December 31, 2010 and 2011, respectively.
The Company files income tax returns in the United States and various non-U.S. jurisdictions. As of December 31, 2011, the Company’s open tax years subject to examination were 2006 through 2010.
15. Fair Value of Financial Instruments
As required by U.S. GAAP, the Company uses applicable guidance for defining fair value, the initial recording and periodic remeasurement of certain assets and liabilities measured at fair value and related disclosures for instruments measured at fair value. Fair value accounting guidance establishes a fair value hierarchy, which prioritizes the inputs to valuation techniques used to measure fair value into three broad levels. The fair value hierarchy gives the highest priority to quoted prices in active markets for identical assets or liabilities (Level 1) and the lowest priority to unobservable inputs (Level 3). An instrument’s categorization within the fair value hierarchy is based upon the lowest level input that is significant to the instrument’s fair value measurement.
For assets that are measured using quoted prices in active markets (Level 1), the total fair value is the published market price per unit multiplied by the number of units held without consideration of transaction costs. Assets and liabilities that are measured using significant other observable inputs (Level 2) are primarily valued by reference to quoted prices of similar assets or liabilities in active markets, adjusted for any terms specific to that asset or liability. For all other assets and liabilities for which unobservable inputs are used (Level 3), fair value is derived through the use of fair value models, such as a discounted cash flow model or other standard pricing models that the Company deems reasonable.
The following is a comparison by category of carrying amounts and fair value of all of the Company’s financial assets and liabilities that are carried in the financial statements.
The fair value of assets and liabilities are as follows:
| Carrying amount | Fair value | |||||||||||||||||||
| December 31, | December 31, | |||||||||||||||||||
| Level | 2010 | 2011 | 2010 | 2011 | ||||||||||||||||
| Financial assets |
||||||||||||||||||||
| Cash and cash equivalents |
1 | $ | 111 | $ | 131 | $ | 111 | $ | 131 | |||||||||||
| Accounts receivable |
1 | 91 | 90 | 91 | 90 | |||||||||||||||
| Financial liabilities |
||||||||||||||||||||
| Trade accounts payable |
1 | 69 | 72 | 69 | 72 | |||||||||||||||
| Capital lease obligations |
2 | 10 | 8 | 10 | 8 | |||||||||||||||
| Current portion of long-term debt |
2 | 28 | 14 | 28 | 14 | |||||||||||||||
| Interest rate swap contracts |
2 | 17 | 12 | 17 | 12 | |||||||||||||||
| Long-term debt |
3 | 774 | 729 | 766 | 749 | |||||||||||||||
| Related party debt |
3 | 350 | 373 | 420 | 424 | |||||||||||||||
F-29
Table of Contents
Financial Assets and Liabilities Measured at Fair Value on a recurring basis
The following tables present financial assets and liabilities measured at fair value on a recurring basis by the valuation hierarchy as defined in the fair value guidance:
| December 31, 2010 |
||||||||||||||||
| Level I | Level II | Level III | Total | |||||||||||||
| Interest rate swaps |
— | (17 | ) | — | (17 | ) | ||||||||||
| December 31, 2011 |
||||||||||||||||
| Level I | Level II | Level III | Total | |||||||||||||
| Interest rate swaps |
— | (12 | ) | — | (12 | ) | ||||||||||
The marked-to-market value of interest rate swaps of $17 million and $11.6 million at December 31, 2010 and 2011, respectively, are included in other non-current liabilities. These derivative instruments are not designated as cash flow hedges. The portion of changes in the fair value is recognized through the interest expense caption in the consolidated statements of operations. The amount recorded in interest expense for the years ended December 31, 2009, 2010 and 2011 was $3 million, $5.8 million and $5.4 million, respectively. There are no new interest rate swap contracts entered into in 2011. The interest rate swaps are classified as a Level 2 fair value measurement, as the value is determined based on the observed values of underlying interest rates and market determined risk premiums.
Non-Financial Assets and Liabilities Measured at Fair Value on a non-recurring Basis
Certain assets and liabilities are measured at fair value on a nonrecurring basis; that is, the assets and liabilities are not measured at fair value on an ongoing basis, but are subject to fair value adjustments in certain circumstances (e.g., when there is evidence of impairment). At December 31, 2010 and 2011, no material fair value adjustments or fair value measurements were required for non-financial assets or liabilities.
Certain Financial Assets and Liabilities not Measured at Fair Value
The Group’s principal financial liabilities, other than interest rate swap derivatives, comprise loans and borrowings, trade payables and secured borrowings under the factoring contract. The main purpose of these financial liabilities is to fund the Group’s operations. The Group has trade receivables and cash and short-term deposits considered as financial assets. The interest rate swaps contracts are recorded in the balance sheets at fair value and the loans and borrowings debt at amortized costs.
At December 31, 2011, the fair value of the Company’s related party was estimated at $424 million compared to a carrying amount of $373 million. The fair value of the Company’s long-term debt as of December 31, 2011 was estimated at $749 million compared to a carrying value of $729 million. The long-term and related party debt consists of debt denominated in U.S. dollar and Euro and are not actively traded nor is there a readily available market for comparison. The most appropriate measure of fair value is to hold EURIBOR and LIBOR constant over the term of the debt to measure the future cash flows for both principal and interests, and then discount the cashflows back to present value using the market’s current risk free interest rates plus the Company specific credit debt spread. At December 31, 2011, the fair value of the non-related party long-term debt is higher than the carrying value of he debt due to contractual interest rates being higher than the risk free interest rate plus the Company specific credit debt spread. The estimated fair value of the related party debt has been determined using an appropriate risk premium which reflects the unsecured nature of the debt, as well as the Company’s current situation.
F-30
Table of Contents
16. Related Party Transactions
TRANSACTIONS WITH TAMINCO INTERNATIONAL S.À R.L.
The related party balances, between the Company and Taminco International S.à r.l. (the direct holding entity of the Company), can be summarized below for the year ended December 31:
| Amounts Due To |
Interest Paid To |
Amounts Owed by |
||||||||||
| 2010 |
350 | 32 | 1 | |||||||||
| 2011 |
373 | 37 | 1 | |||||||||
As at December 31, 2011, amounts due to Taminco International Sàrl relate to $246 million bonds (€190 million) plus capitalized interests ($127 million compared to $96 million as at December 31, 2010) and a related party loan ($0.2 million compared to zero as at December 31, 2010).
Amounts owed by related parties at December 31, 2010 and 2011 related to receivables from Taminco International S.à r.l. in relation to recharge of various costs.
The interest expense resulting from related party debt increased from $31.8 million for the year ended December 31, 2010 to $36.7 million for the year ended December 31, 2011 due to the increased principal from unpaid interest, which is included in the principal loan balance subject to interest.
17. Segment Information
The reportable segments presented below represent the Company’s operating segments for which separate financial information is available and which is utilized on a regular basis by its chief operating decision maker to assess performance and to allocate resources. In identifying its reportable segments, the Company also considers the nature of services provided by its operating segments. Management evaluates the operating results of each of its reportable segments based upon net sales and Adjusted EBITDA (a non-GAAP measure). Adjusted EBITDA consists of EBITDA, which is defined as net income (loss) before depreciation and amortization, interest (income) expense and income taxes, each of which is presented in the Company’s Consolidated Statements of Operations and adjusted for certain items as discussed below. The Company’s presentation of Adjusted EBITDA may not be comparable to similar measures used by other companies. Business segment assets are the owned or allocated assets used by each business.
We are organized into three segments: Functional Amines, Specialty Amines, and Crop Protection.
| • | Functional Amines. This segment serves the needs of external customers that use our alkylamines products as the integral element in their chemical processes for the production of formulated products applied in a variety of end-markets such as agriculture, personal & home care, animal nutrition, and oil & gas. Through this segment, we also produce basic amines, which are captively used as building blocks to produce our downstream derivatives through our Specialty Amines and Crop Protection segments, serving a variety of attractive, non-cyclical end-markets. Approximately 30% of the Functional Amines production is used internally and forms the basis of our vertically integrated model. |
| • | Specialty Amines. This segment sells alkylamine derivatives for use in the water treatment, personal & home care, oil & gas and animal nutrition end-markets, and specialty additives for use in the pharmaceutical, industrial coatings and metal working fluid end-markets. This segment is downstream from the Functional Amines segment and uses that segment’s production as one of its key raw materials. The Specialty Amines segment’s customers are typically large, multinational enterprises who are leading players in their industry. |
| • | Crop Protection. This segment sells alkylamine derivatives, active ingredients and formulated products for use in the agriculture and crop protection end-markets. The majority of the segment’s customers range from multinational crop protection and agricultural enterprises to large local farms. |
F-31
Table of Contents
Adjusted EBITDA consists of EBITDA and eliminates (i) transaction costs, (ii) restructuring charges and (iii) foreign exchange gains/losses. We believe that making such adjustments provides investors meaningful information to understand our operating results and ability to analyze financial and business trends on a period-to-period basis and on a basis consistent with how management views the business.
| Net Sales | ||||||||||||
| For the Year Ended December 31, | ||||||||||||
| 2009 | 2010 | 2011 | ||||||||||
| Functional Amines |
$ | 411 | $ | 465 | $ | 515 | ||||||
| Specialty Amines |
294 | 357 | 460 | |||||||||
| Crop Protection |
120 | 129 | 148 | |||||||||
|
|
|
|
|
|
|
|||||||
| Total Company |
$ | 825 | $ | 951 | $ | 1,123 | ||||||
|
|
|
|
|
|
|
|||||||
Functional Amines: two customers in the Functional Amines segment represented 13% and 10% of the Company’s consolidated sales in the year ended December 31, 2010 and 2011, respectively. One customer in the Functional Amine segment represented 11% and 14% of the Company’s consolidated sales in the year ended December 31, 2009 and 2010, respectively.
Specialty Amines: one customer in the Specialty Amines segment represented 10% and 11% of the Company’s consolidated net sales for the years ended December 31, 2009 and 2011, respectively.
Products are transferred from the Functional Amines segment to the Specialty Amines segment at cost and therefore are not recorded as a sale. Accordingly, the Functional Amines segment does not reflect profit on products transferred to the Specialty Amines segment. Products are transferred from the Functional Amines segment to the Crop Protection segment on a basis intended to reflect as nearly as practicable, the market value of the products.
| Adjusted EBITDA | ||||||||||||
| For the Year Ended December 31, | ||||||||||||
| 2009 | 2010 | 2011 | ||||||||||
| Functional Amines |
$ | 111 | $ | 106 | $ | 108 | ||||||
| Specialty Amines |
54 | 57 | 78 | |||||||||
| Crop Protection |
31 | 40 | 41 | |||||||||
|
|
|
|
|
|
|
|||||||
| Total Adjusted EBITDA |
$ | 196 | $ | 203 | $ | 227 | ||||||
|
|
|
|
|
|
|
|||||||
| Reconciliation: |
||||||||||||
| Transaction costs |
(9 | ) | (2 | ) | (5 | ) | ||||||
| Restructuring charges |
(4 | ) | — | (11 | ) | |||||||
| Foreign exchange (gains) losses |
(4 | ) | 2 | (2 | ) | |||||||
| Depreciation and amortization |
(82 | ) | (74 | ) | (72 | ) | ||||||
| Interest expense, net |
(80 | ) | (74 | ) | (75 | ) | ||||||
| Income tax expense |
(16 | ) | (33 | ) | (32 | ) | ||||||
|
|
|
|
|
|
|
|||||||
| Net income |
$ | 1 | $ | 22 | $ | 30 | ||||||
|
|
|
|
|
|
|
|||||||
| Depreciation and Amortization | ||||||||||||
| For the Year Ended December 31, | ||||||||||||
| 2009 | 2010 | 2011 | ||||||||||
| Functional Amines |
$ | 55 | $ | 48 | $ | 41 | ||||||
| Specialty Amines |
21 | 19 | 22 | |||||||||
| Crop Protection |
6 | 7 | 9 | |||||||||
|
|
|
|
|
|
|
|||||||
| Total Company |
$ | 82 | $ | 74 | $ | 72 | ||||||
|
|
|
|
|
|
|
|||||||
F-32
Table of Contents
| Total Assets | ||||||||
| As of December 31, | ||||||||
| 2010 | 2011 | |||||||
| Functional Amines |
$ | 427 | $ | 431 | ||||
| Specialty Amines |
409 | 417 | ||||||
| Crop Protection |
347 | 326 | ||||||
| Corporate |
144 | 174 | ||||||
|
|
|
|
|
|||||
| Total Company |
$ | 1,327 | $ | 1,348 | ||||
|
|
|
|
|
|||||
The assets per segment include investments in equity method investees and expenditure in long lived assets.
GEOGRAPHIC INFORMATION
The Company’s net sales, total assets and property, plant and equipment are presented by country. These are predominately the countries in which the Company has production facilities. The caption “All Other Countries” represents Germany, China and Brazil.
| United States | Belgium | All Other Countries |
Companywide Goodwill & Intangible |
Total | ||||||||||||||||
| On or for the year ended December 31, 2009 |
||||||||||||||||||||
| Net Sales |
$ | 404 | $ | 338 | $ | 83 | $ | — | $ | 825 | ||||||||||
| Total Assets |
211 | 204 | 213 | 845 | 1,473 | |||||||||||||||
| Net property and equipment |
78 | 152 | 10 | — | 240 | |||||||||||||||
| On or for the year ended December 31, 2010 |
||||||||||||||||||||
| Net Sales |
466 | 390 | 95 | — | 951 | |||||||||||||||
| Total Assets |
252 | 214 | 101 | 760 | 1,327 | |||||||||||||||
| Net property and equipment |
100 | 140 | 6 | — | 246 | |||||||||||||||
| On or for the year ended December 31, 2011 |
||||||||||||||||||||
| Net Sales |
533 | 483 | 107 | — | 1,123 | |||||||||||||||
| Total Assets |
301 | 235 | 97 | 715 | 1,348 | |||||||||||||||
| Net property and equipment |
116 | 131 | 2 | — | 249 | |||||||||||||||
18. Subsequent Events
On December 15, 2011, the previous sponsor (the seller) and an affiliate of Apollo Global Management (the purchaser) entered into a sale purchase agreement for the shares of Taminco Group Holdings S.à r.l., resulting in the transfer of the shares and closing of the transaction on February 15, 2012 (the “Acquisition”). As part of the execution of this share purchase agreement all external financial debt has been repaid on February 15, 2012 and the related derivatives have been settled the same day. The Senior Facility Agreement with Rabobank and the subordinated capitalization bonds with Taminco International S.à.r.l. have been replaced by a new term loan facility and second-priority senior secured notes at the level of Taminco Global Chemical Corporation, a company established in the State of Delaware and the new shareholder of Taminco Group Holdings S.à r.l.
F-33
Table of Contents
| Page | ||||
| Unaudited consolidated financial statements of Taminco Group Holdings S.à r.l. (Predecessor) and Taminco Acquisition Corporation (Successor) |
||||
| F-35 | ||||
| F-36 | ||||
| Condensed consolidated balance sheets as of December 31, 2011 and September 30, 2012 |
F-37 | |||
| F-38 | ||||
| Condensed consolidated statements of equity (deficit) for the nine months ended September 30, 2012 |
F-39 | |||
| F-40 | ||||
F-34
Table of Contents
TAMINCO ACQUISITION CORPORATION
CONDENSED CONSOLIDATED STATEMENTS OF OPERATIONS
(In Millions, except share amount)
(Unaudited)
| Predecessor | Successor | |||||||||||||
| Nine Months Ended September 30, 2011 |
January 1 through February 14, 2012 |
Nine Months Ended September 30, 2012 |
||||||||||||
| Net Sales |
$ | 868 | $ | 144 | $ | 711 | ||||||||
| Cost of Sales |
693 | 111 | 598 | |||||||||||
|
|
|
|
|
|
|
|||||||||
| Gross Profit |
175 | 33 | 113 | |||||||||||
| Selling, general and administrative expense |
39 | 66 | 29 | |||||||||||
| Research and development expense |
9 | 1 | 7 | |||||||||||
| Other operating expense |
10 | 1 | 44 | |||||||||||
|
|
|
|
|
|
|
|||||||||
| Operating income |
117 | (35 | ) | 33 | ||||||||||
| Interest expense, net (including related party interest expense of $26 and $5 for the periods ended September 30, 2011 and February 14, 2012, respectively) |
57 | 8 | 50 | |||||||||||
| Other non-operating (income) expense, net |
2 | 2 | 8 | |||||||||||
|
|
|
|
|
|
|
|||||||||
| Income (loss) before income taxes and equity in earnings |
58 | (45 | ) | (25 | ) | |||||||||
| Income tax expense |
28 | 9 | 2 | |||||||||||
|
|
|
|
|
|
|
|||||||||
| Income (loss)before results from equity in earnings |
30 | (54 | ) | (27 | ) | |||||||||
| Equity in losses of unconsolidated entities |
1 | — | 2 | |||||||||||
|
|
|
|
|
|
|
|||||||||
| Net income (loss) for the period |
$ | 29 | $ | (54 | ) | $ | (29 | ) | ||||||
|
|
|
|
|
|
|
|||||||||
| Net income (loss) per share |
||||||||||||||
| Basic |
$ | 0.03 | $ | (0.05 | ) | $ | (5.37 | ) | ||||||
| Diluted |
$ | 0.03 | $ | (0.05 | ) | $ | (5.37 | ) | ||||||
| Number of common shares |
1,000,000,000 | 1,000,000,000 | 5,396,056 | |||||||||||
See accompanying notes to condensed consolidated financial statements
F-35
Table of Contents
TAMINCO ACQUISITION CORPORATION
CONDENSED CONSOLIDATED STATEMENTS OF COMPREHENSIVE INCOME
(In Millions)
(Unaudited)
| Predecessor | Successor | |||||||||||||
| Nine Months Ended September 30, 2011 |
January 1 through February 14, 2012 |
Nine Months Ended September 30, 2012 |
||||||||||||
| Net income (loss) for the period |
$ | 29 | $ | (54 | ) | $ | (29 | ) | ||||||
| Foreign currency translation adjustment |
(1 | ) | — | (10 | ) | |||||||||
| Net pension and other postretirement benefit adjustments |
(1 | ) | — | — | ||||||||||
| Other comprehensive income (loss), before tax |
(2 | ) | — | (10 | ) | |||||||||
| Income tax expense related to other comprehensive loss |
— | — | — | |||||||||||
|
|
|
|
|
|
|
|||||||||
| Other comprehensive income (loss), net of tax |
(2 | ) | — | (10 | ) | |||||||||
|
|
|
|
|
|
|
|||||||||
| Comprehensive income (loss) |
$ | 27 | $ | (54 | ) | $ | (39 | ) | ||||||
|
|
|
|
|
|
|
|||||||||
See accompanying notes to condensed consolidated financial statements
F-36
Table of Contents
TAMINCO ACQUISITION CORPORATION
CONDENSED CONSOLIDATED BALANCE SHEETS
(In Millions)
(Unaudited)
| Predecessor | Successor | |||||||||
| December 31, 2011 |
September 30, 2012 |
|||||||||
| Assets |
||||||||||
| Current assets: |
||||||||||
| Cash and cash equivalents |
$ | 131 | $ | 58 | ||||||
| Trade receivables, net of allowance of doubtful accounts of $1.3 and $1.5 in 2011 and 2012, respectively |
89 | 87 | ||||||||
| Related parties Receivables |
1 | 1 | ||||||||
| Inventories |
117 | 136 | ||||||||
| Deferred income taxes |
7 | 1 | ||||||||
| Prepaid expenses and other current assets |
15 | 13 | ||||||||
| Current assets held for sale |
2 | — | ||||||||
|
|
|
|
|
|||||||
| Total current assets |
362 | 296 | ||||||||
|
|
|
|
|
|||||||
| Property, plant and equipment, net |
249 | 415 | ||||||||
| Investments and long term receivables |
12 | 20 | ||||||||
| Intangibles assets, net |
175 | 581 | ||||||||
| Goodwill |
540 | 455 | ||||||||
| Deferred income taxes |
— | 2 | ||||||||
| Capitalized debt issuance costs |
10 | 55 | ||||||||
|
|
|
|
|
|||||||
| Total assets |
$ | 1,348 | $ | 1,824 | ||||||
|
|
|
|
|
|||||||
| Liabilities and Equity |
||||||||||
| Current liabilities: |
||||||||||
| Current installments of long-term debt |
$ | 29 | $ | 6 | ||||||
| Trade Payables |
72 | 90 | ||||||||
| Income tax payable |
6 | 5 | ||||||||
| Other current liabilities |
44 | 44 | ||||||||
|
|
|
|
|
|||||||
| Total current liabilities |
151 | 145 | ||||||||
|
|
|
|
|
|||||||
| Long-term debt |
729 | 904 | ||||||||
| Long-term related party debt |
373 | — | ||||||||
| Other liabilities |
24 | 15 | ||||||||
| Long-term pension and post employment benefit obligations |
13 | 17 | ||||||||
| Deferred income taxes |
90 | 242 | ||||||||
|
|
|
|
|
|||||||
| Total liabilities |
1,380 | 1,323 | ||||||||
|
|
|
|
|
|||||||
| Stockholders’ equity |
— | — | ||||||||
| Common stock (Predecessor: $0.014 par value, 1,000,000,000 shares authorized and issued; Successor: $0.001 par value, 5,396,056 shares authorized and issued) |
14 | — | ||||||||
| Additional paid-in capital |
— | 540 | ||||||||
| Accumulated deficit |
(24 | ) | (29 | ) | ||||||
| Accumulated other comprehensive loss |
(22 | ) | (10 | ) | ||||||
|
|
|
|
|
|||||||
| Total stockholders’ equity |
(32 | ) | 501 | |||||||
|
|
|
|
|
|||||||
| Total liabilities and equity |
$ | 1,348 | $ | 1,824 | ||||||
|
|
|
|
|
|||||||
See accompanying notes to condensed consolidated financial statements
F-37
Table of Contents
TAMINCO ACQUISITION CORPORATION
CONDENSED CONSOLIDATED STATEMENTS OF CASH FLOWS
(In Millions)
(Unaudited)
| Predecessor | Successor | |||||||||||||
| Nine Months Ended September 30, 2011 |
January 1 through February 14, 2012 |
Nine Months Ended September 30, 2012 |
||||||||||||
| Cash flows provided by operating activities |
||||||||||||||
| Net income (loss) |
$ | 29 | $ | (54 | ) | $ | (29 | ) | ||||||
| Adjustments to reconcile net loss to net cash provided by operating activities: |
||||||||||||||
| Depreciation and amortization |
58 | 7 | 64 | |||||||||||
| Deferred tax provision |
(1 | ) | (3 | ) | (19 | ) | ||||||||
| Other non-cash adjustments: |
||||||||||||||
| Management stock option compensation plan |
— | 60 | — | |||||||||||
| Equity investments |
1 | — | — | |||||||||||
| Amortization of debt-related costs |
2 | — | — | |||||||||||
| Unrealized profit on derivatives(3) |
(2 | ) | — | — | ||||||||||
| Accrued interest on related party loans |
26 | 5 | — | |||||||||||
| Net change in assets and liabilities: |
||||||||||||||
| (Increase)/Decrease in accounts receivable |
(4 | ) | 16 | (18 | ) | |||||||||
| (Increase)/Decrease in inventories |
(17 | ) | 5 | (24 | ) | |||||||||
| Increase/(Decrease) in accounts payable |
19 | 15 | 3 | |||||||||||
| Increase/(Decrease) in income tax payable |
10 | 9 | — | |||||||||||
| (Increase)/Decrease in other current assets |
2 | (3 | ) | 4 | ||||||||||
| Increase/(Decrease) in other current liabilities |
(9 | ) | — | 7 | ||||||||||
| Increase/(Decrease) in other non-current liabilities |
(5 | ) | (13 | ) | 4 | |||||||||
|
|
|
|
|
|
|
|||||||||
| Net cash flows provided by (used in) operating activities |
109 | 44 | (8 | ) | ||||||||||
|
|
|
|
|
|
|
|||||||||
| Cash flows provided by (used in) investing activities |
||||||||||||||
| Acquisition of Taminco Group Holdings S.à.r.l., net of cash acquired |
— | — | (158 | ) | ||||||||||
| Purchase of property, plant and equipment |
(34 | ) | (6 | ) | (33 | ) | ||||||||
| Purchase of intangible assets |
(4 | ) | — | (4 | ) | |||||||||
| Acquisition and investment within joint venture |
(14 | ) | — | — | ||||||||||
|
|
|
|
|
|
|
|||||||||
| Net cash flows from / (used in) investing activities |
(52 | ) | (6 | ) | (195 | ) | ||||||||
|
|
|
|
|
|
|
|||||||||
| Cash flows used in financing activities |
||||||||||||||
| Net increase (decrease) in short term borrowings |
— | — | (5 | ) | ||||||||||
| Proceeds from borrowings |
— | — | 908 | |||||||||||
| Repayments of borrowings |
(10 | ) | — | (1,121 | ) | |||||||||
| Capital Contribution, net |
— | — | 540 | |||||||||||
| Payments of debt issuance costs |
— | — | (56 | ) | ||||||||||
|
|
|
|
|
|
|
|||||||||
| Net cash flows from / (used in) financing activities |
(10 | ) | — | 266 | ||||||||||
|
|
|
|
|
|
|
|||||||||
| Net increase / (decrease) in cash and cash equivalents |
47 | 38 | 63 | |||||||||||
| Net foreign exchange difference |
(2 | ) | 2 | (5 | ) | |||||||||
| Cash and cash equivalents, beginning of period |
111 | 131 | — | |||||||||||
|
|
|
|
|
|
|
|||||||||
| Cash and cash equivalents, end of period |
$ | 156 | $ | 171 | $ | 58 | ||||||||
|
|
|
|
|
|
|
|||||||||
| Supplemental Cash Flow Information: |
||||||||||||||
| Interest paid |
$ | 25 | $ | 1 | $ | 44 | ||||||||
| Income tax payments, net |
22 | — | 24 | |||||||||||
See accompanying notes to condensed consolidated financial statements
F-38
Table of Contents
TAMINCO ACQUISITION CORPORATION
CONDENSED CONSOLIDATED STATEMENTS OF EQUITY (DEFICIT)
(In Millions)
(Unaudited)
| Total Equity (Deficit) |
Earnings | Accumulated Other Comprehensive Income (Loss) |
Common Stock | Additional paid In Capital |
||||||||||||||||
| Successor |
||||||||||||||||||||
| Balance at January 1, 2012 |
$ | — | $ | — | $ | — | $ | — | ||||||||||||
|
|
|
|
|
|
|
|
|
|
|
|||||||||||
| Capital contribution |
540 | — | — | — | 540 | |||||||||||||||
| Net Loss |
(29 | ) | (29 | ) | — | — | — | |||||||||||||
| Other comprehensive income (loss), net of tax |
||||||||||||||||||||
| Foreign currency translation adjustments |
(10 | ) | — | (10 | ) | — | — | |||||||||||||
|
|
|
|
|
|
|
|
|
|
|
|||||||||||
| Balance at September 30, 2012 |
$ | 501 | $ | (29 | ) | $ | (10 | ) | $ | — | $ | 540 | ||||||||
|
|
|
|
|
|
|
|
|
|
|
|||||||||||
See accompanying notes to condensed consolidated financial statements
F-39
Table of Contents
TAMINCO ACQUISITION CORPORATION
NOTES TO CONDENSED CONSOLIDATED FINANCIAL STATEMENTS
(Unless otherwise noted, all amounts are in millions)
(Unaudited)
1. Background and Basis of Presentation
Taminco Acquisition Corporation, a Delaware corporation (“TAC”) was incorporated on December 12, 2011 and is a holding company for its wholly owned subsidiary, Taminco Intermediate Corporation (“TIC”). TIC is a holding company for its wholly owned subsidiary, Taminco Global Chemical Corporation, a Delaware corporation (“Taminco”), and its subsidiaries. TAC, TIC and Taminco and its subsidiaries being referred to herein collectively as the “Company”. TAC and TIC derive all of their operating income and cash flows from Taminco and its subsidiaries.
On December 15, 2011, an affiliate of Apollo Global Management, LLC (the “Purchaser”) entered into a share purchase agreement (the “Acquisition”) with CVC Capital Partners (the “Seller”) pursuant to which Taminco acquired all of the issued share capital of Taminco Group Holdings S.à r.l. and its subsidiaries for a total consideration, including assumed indebtedness, of approximately $1.4 billion. The Acquisition was finalized on February 15, 2012. Therefore, the condensed consolidated statement of operations, condensed consolidated statement of comprehensive income, condensed consolidated statement of changes in equity and condensed consolidated statement of cash flows are presented for three periods: the nine month period ended September 30, 2011 (“Predecessor”), January 1, 2012 through February 14, 2012 (“Predecessor”) and January 1, 2012 through September 30, 2012 (“Successor”), which relate to the period immediately preceding and succeeding the Acquisition, respectively. The statement of financial position of TAC as of December 31, 2011 and the results of its operations and cash flows from December 12, 2011 to December 31, 2011 are nominal and accordingly, have not been presented. Additionally, the results of operations and cash flows of TAC for the period from January 1, 2012 until February 14, 2012 (the period prior to the Acquisition) consists solely of Acquisition related costs. The results of the Successor are not comparable to the results of the Predecessor as the acquired assets and liabilities have been subsequently remeasured at fair market value.
The principal activity of the Company is to produce alkylamines and derivatives, key building blocks in an array of chemical products that have a wide range of applications. These alkylamines and alkylamine derivatives are used by the Company’s customers in the manufacturing of products, primarily for the agriculture, water treatment, personal and home care, animal nutrition and oil and gas end-markets.
The accompanying condensed consolidated financial statements comprise the consolidated financial statements of TAC and Taminco. TAC’s only asset is its investment in TIC, and TIC’s only asset is its investment in Taminco. TAC’s only obligations are its guarantees of certain borrowings of Taminco. All expenses incurred by TAC and TIC are for the benefit of Taminco and have been reflected in Taminco’s condensed consolidated financial statements. All issuances of TAC’s equity securities, including grants of stock options and restricted stock by TAC to employees and directors of Taminco and its subsidiaries have been reflected in Taminco’s condensed consolidated financial statements. As a result, the consolidated financial positions, results of operations and cash flows of TAC, TIC and Taminco are the same. The condensed consolidated financial statements of the Company have been prepared in accordance with accounting principles generally accepted in the United States of America. All intercompany balances and transactions have been eliminated. In presenting the Condensed Consolidated Financial Statements, management makes estimates and assumptions that affect the amounts reported and the related disclosures. Estimates, by their nature, are based on judgment and available information. Accordingly, actual results could differ materially from those estimates.
In management’s opinion, the accompanying Condensed Consolidated Financial Statements reflect all normal and recurring adjustments necessary to present fairly the Company’s financial position as of December 31, 2011 and September 30, 2012 and the results of operations, comprehensive income/(loss) and cash flows for the nine
F-40
Table of Contents
months ended September 30, 2011 and 2012. As the interim Condensed Consolidated Financial Statements are prepared using the same accounting policies used to prepare the annual financial statements, they should be read in conjunction with the Consolidated Financial Statements for the year ended December 31, 2011, 2010 and 2009. The year-end condensed consolidated balance sheet data was derived from audited financial statements, but does not include all disclosures required by accounting principles generally accepted in the United States of America.
Significant Accounting Policies
SHARE-BASED COMPENSATION
The Company uses the Black-Scholes option pricing model to estimate the fair value of time-vested stock options and a lattice-based valuation model to estimate the fair value of performance-based awards on the date of grant, which requires certain estimates by management including the expected volatility and expected term of the option. The fair value of the performance-vesting options was determined using a Monte Carlo model.
Management also makes decisions regarding the risk-free interest rate used in the models and makes estimates regarding forfeiture rates. Fluctuations in the market that affect these estimates could have an impact on the resulting compensation cost. For non-performance-based employee stock awards, the fair value of the compensation cost is recognized on a straight-line basis over the requisite service period of the award. Compensation cost for restricted stock (non-vested stock) is recorded based on its market value on the date of grant and is expensed in the Company’s condensed consolidated statements of operations ratably over the vesting period. Performance-based awards vest upon the achievement of certain internal rate of return measures. Unrecognized costs of the performance-based options will be recorded as compensation expense when the above measures are probable of occurring.
Recently Adopted Accounting Pronouncements
In September 2011, the FASB amended the guidance on testing for goodwill impairment that allows an entity to elect to qualitatively assess whether it is necessary to perform the current two-step goodwill impairment test. If the qualitative assessment determines that it is not more-likely-than-not that the fair value of a reporting unit is less than its carrying amount, then performing the two-step test is unnecessary. If the entity elects to bypass the qualitative assessment for any reporting unit and proceed directly to Step One of the test and validate the conclusion by measuring fair value, it can resume performing the qualitative assessment in any subsequent period. The amendments are effective for annual and interim goodwill impairment tests performed for fiscal years beginning after December 15, 2011. The Company may not elect to utilize the quantitative analysis for its goodwill impairment test given the Apollo Acquisition during the calendar year.
In May 2011, the FASB amended the guidance on Fair Value Measurement that result in common measurement of fair value and disclosure requirements between U.S. GAAP and the International Financial Reporting Standards (“IFRS”). The amendments mainly change the wording used to describe many of the requirements in U.S. GAAP for measuring fair value and for disclosing information about fair value measurements. The amendments are effective prospectively for interim and annual periods beginning after December 15, 2011. The Company adopted the amendments on January 1, 2012 and the adoption did not have a significant impact on the consolidated financial statements.
2. Acquisition of Taminco Group Holdings S.à r.l.
On December 15, 2011, an affiliate of Apollo Global Management, LLC (the “Purchaser”) entered into a share purchase agreement (the “Acquisition”) with CVC Capital Partners (the “Seller”) pursuant to which Taminco acquired all of the issued share capital of Taminco Group Holdings S.à r.l. and its subsidiaries for a total consideration of approximately $1.4 billion, including assumed indebtedness, of approximately $1.1 billion. The Acquisition was consummated on February 15, 2012.
F-41
Table of Contents
Preliminary Purchase Price Allocation
We accounted for the Acquisition in accordance with the provisions of FASB Accounting Standards Codification (“ASC”) 805, “Business Combinations”, whereby the purchase price paid to effect the Acquisition is allocated to recognize the acquired assets and liabilities at fair value.
In accordance with the provisions of ASC 805, the total purchase price was preliminarily assigned to the Company’s net tangible and identifiable intangible assets based on their estimated fair values as set forth below. The excess of the purchase price over the net tangible and identifiable intangible assets was recorded as goodwill. These initial purchase price allocations may be adjusted within one year of the effective date of the Acquisition (February 15, 2012) for changes in estimates of the fair value of assets acquired and liabilities assumed based on the fair value for the acquired assets and liabilities.
The Company has made preliminary estimates of the values of the assets acquired and liabilities assumed that are presented in these Condensed Consolidated Financial Statements. Accordingly, the Company believes that the initial estimates of fair value of assets and liabilities could subsequently be revised and any such revisions could be material.
The following table summarizes the estimated fair values of the assets acquired and liabilities assumed at the date of acquisition:
| Cash |
$ | 171 | ||
| Inventory |
138 | |||
| Accounts Receivable |
85 | |||
| Property, plant and equipment |
417 | |||
| Intangible Assets |
619 | |||
| Goodwill |
455 | |||
| Other long term assets |
19 | |||
|
|
|
|||
| Total assets |
1,904 | |||
| Current liabilities |
167 | |||
| Long term debt |
1,108 | |||
| Other long term liabilities |
300 | |||
|
|
|
|||
| Total liabilities |
1,575 | |||
|
|
|
|||
| Net assets acquired |
$ | 329 | ||
|
|
|
Other long-term liabilities assumed are primarily comprised of noncurrent deferred tax liabilities of $267 million and other accruals of $33 million.
Inventory held by the Company includes a fair value adjustment of $22 million. The Company expensed this amount by June 30, 2012 as the acquired inventory was sold.
Property, plant and equipment include a fair value adjustment of $165 million and consist of land, buildings, plant and equipment. Depreciable lives are 15 years for buildings and range from 5 to 15 years for plant and equipment.
The preliminary fair values assigned to intangible assets were determined through the use of the income approach, specifically the relief from royalty method and the multi-period excess earnings method. Both valuation methods rely on management’s judgments, including expected future cash flows resulting from existing customer relationships, customer attrition rates, contributory effects of other assets utilized in the business, peer group cost of capital and royalty rates as well as other factors. The valuation of tangible assets was derived using a combination of the income approach, the market approach and the cost approach. Significant judgments used in valuing tangible assets include estimated reproduction or replacement cost, useful lives of assets, estimated selling prices, costs to complete and reasonable profit.
F-42
Table of Contents
The Acquisition related intangible assets valuation are as follows:
| Estimated Useful Lives |
As of February 15, 2012 |
|||||||
| Regulatory costs |
1.5 years | $ | 7 | |||||
| Customer relationships |
13 years | 332 | ||||||
| Technology, patents and license costs |
10 years | 94 | ||||||
| Various Contracts |
8 years | 186 | ||||||
| Software License costs |
5 years | — | ||||||
|
|
|
|||||||
| Total Intangible Assets at Acquisition |
619 | |||||||
Supplementary Pro Forma Information
The unaudited pro forma combined statements of operations for the nine months ended September 30, 2012 have been derived from our historical consolidated financial statements and have been prepared to give effect to the Acquisition, assuming that the Acquisition occurred on January 1, 2012.
The unaudited pro forma combined statements of operations for the nine months period ended September 30, 2012 have been adjusted to reflect:
| • | additional depreciation and amortization that resulted from changes in the estimated fair value of assets and liabilities; |
| • | reduction of the interest expense resulting from new indebtedness incurred in connection with the Acquisition; and |
| • | incremental operating expenses, representing the annual management fee to be paid by the Company to Apollo. |
| For the Nine months
ended September 30, 2012 |
||||||||||||||||
| (In millions, except per share amounts) | Predecessor January 1 through February 14, 2012 |
Successor Nine Months Ended September 30, 2012 |
Adjustments | Pro Forma | ||||||||||||
| Net sales |
$ | 144 | $ | 711 | $ | — | $ | 855 | ||||||||
|
|
|
|
|
|
|
|
|
|||||||||
| Net income (loss) |
$ | (54 | ) | $ | (29 | ) | $ | (5 | ) | $ | (88 | ) | ||||
|
|
|
|
|
|
|
|
|
|||||||||
| Net income (loss) per common share: |
||||||||||||||||
| Basic |
$ | (0.05 | ) | $ | (5.37 | ) | $ | (16.2 | ) | |||||||
| Diluted |
$ | (0.05 | ) | $ | (5.37 | ) | $ | (16.2 | ) | |||||||
The pro forma combined financial information is based on the Company’s preliminary assignment of purchase price and therefore subject to adjustment upon finalizing the purchase price assignment. Pro forma results do not include any anticipated synergies or other anticipated benefits of the Acquisition. Accordingly, the unaudited pro forma financial information is not necessarily indicative or either future results of operations or results that might have been achieved had the Acquisition occurred in January 1, 2012. The pro forma combined results above include non-recurring transaction costs and share-based compensation charges of $42 million and $60 million, respectively, that were directly related to the Acquisition.
3. Equity Method Investments
During the year ended December 31, 2011, the Company and Mitsubishi Gas Chemical Company (MGC) entered into a 50/50 joint venture agreement, obtaining official approval of the Te An Ling Tian (TALT). As of March 31, 2011, the Company had acquired a 50% interest. Total investment in the joint venture amounts to $6.5 million of which $2.5 million was paid in March 2011 and $4.0 million was paid in September 2011. In
F-43
Table of Contents
April 2011 the joint venture partners agreed on an equal capital increase in which the group contributed $2.5 million. In September 2011 the Company provided further financing through a subordinated shareholder loan of $5.0 million. For financial reporting purposes, the results of operations from this joint venture have been included in the Company’s financial statement from the quarter end September 30, 2011.
4. Goodwill and Intangible Assets
Goodwill by segment and changes in the carrying amount are as follows:
| Functional Amines |
Specialty Amines |
Crop Protection |
Total | |||||||||||||
| Balance at December 31, 2011 |
$ | 140 | $ | 172 | $ | 228 | $ | 540 | ||||||||
| Sale of a business(1) |
(140 | ) | (172 | ) | (228 | ) | (540 | ) | ||||||||
| Business acquisitions(2) |
109 | 146 | 200 | 455 | ||||||||||||
|
|
|
|
|
|
|
|
|
|||||||||
| Balance at September 30, 2012 |
$ | 109 | $ | 146 | $ | 200 | $ | 455 | ||||||||
|
|
|
|
|
|
|
|
|
|||||||||
| (1) | Represents the elimination of the goodwill established during the Acquisition of Taminco NV by CVC Capital Partners. |
| (2) | Represents the goodwill established during the acquisition of the Company by affiliates of Apollo Global Management (see Footnote 1 and Footnote 2). |
Intangible assets are as follows:
| Predecessor | Successor | |||||||||||||||||||||||||||||
| December 31, 2011 |
September 30, 2012 |
|||||||||||||||||||||||||||||
| Weighted Average Useful Lives |
Cost | Accumulated Amortization |
Net | Cost | Accumulated Amortization |
Net | ||||||||||||||||||||||||
| Landleasehold |
49 years | $ | 4 | $ | — | $ | 4 | $ | — | $ | — | $ | — | |||||||||||||||||
| Regulatory costs |
3 years | 9 | 2 | 7 | 10 | 3 | 7 | |||||||||||||||||||||||
| Customer relationships |
13 years | 177 | 59 | 118 | 332 | 18 | 314 | |||||||||||||||||||||||
| Technology, patents and license costs |
10 years | 11 | 9 | 2 | 94 | 5 | 89 | |||||||||||||||||||||||
| Various Contracts |
12 years | 68 | 24 | 44 | 186 | 15 | 171 | |||||||||||||||||||||||
| Software License costs |
5 years | 2 | 2 | — | — | — | — | |||||||||||||||||||||||
|
|
|
|
|
|
|
|
|
|
|
|
|
|||||||||||||||||||
| Total intangible assets |
$ | 271 | $ | 96 | $ | 175 | $ | 622 | $ | 41 | $ | 581 | ||||||||||||||||||
|
|
|
|
|
|
|
|
|
|
|
|
|
|||||||||||||||||||
Intangible asset amortization expense is as follows:
| Predecessor | Successor | |||||||||||||
| Nine Months Ended September 30, 2011 |
January 1 through February 14, 2012 |
Nine Months Ended September 30, 2012 |
||||||||||||
| Regulatory costs |
$ | 3 | $ | 1 | $ | 3 | ||||||||
| Customer relationships |
11 | 1 | 18 | |||||||||||
| Technology, patents and license costs |
1 | 1 | 5 | |||||||||||
| Various Contracts |
5 | 1 | 15 | |||||||||||
|
|
|
|
|
|
|
|||||||||
| Total amortization expense |
$ | 20 | $ | 4 | $ | 41 | ||||||||
|
|
|
|
|
|
|
|||||||||
Based on the Company’s amortizable intangible assets as of September 30, 2012, the Company expects related amortization expense for the remainder of 2012 to be $15 million and the four succeeding years to approximate $60 million annually.
F-44
Table of Contents
5. Inventories
Inventories consisted of the following components:
| Predecessor | Successor | |||||||||
| December 31, 2011 |
September 30, 2012 |
|||||||||
| Finished goods and work-in-process |
$ | 93 | $ | 106 | ||||||
| Raw materials and supplies |
24 | 30 | ||||||||
|
|
|
|
|
|||||||
| Total inventories |
$ | 117 | $ | 136 | ||||||
|
|
|
|
|
|||||||
6. Property, Plant and Equipment
Property, plant and equipment, at cost, and the related accumulated depreciation were as follows:
| Predecessor | Successor | |||||||||
| December 31, 2011 |
September 30, 2012 |
|||||||||
| Land and improvements |
$ | 12 | $ | 33 | ||||||
| Buildings, structures and related improvements |
19 | 36 | ||||||||
| Plant, machinery and equipment |
363 | 336 | ||||||||
| Furniture and vehicles |
5 | 2 | ||||||||
| Construction-in-process |
37 | 27 | ||||||||
| Software applications |
6 | 4 | ||||||||
|
|
|
|
|
|||||||
| Less accumulated depreciation |
193 | 23 | ||||||||
|
|
|
|
|
|||||||
| Total property, plant and equipment, net |
$ | 249 | $ | 415 | ||||||
|
|
|
|
|
|||||||
Total depreciation expense for the period ended September 30, 2011 was $37 million. Total depreciation expense for the predecessor period from January 1 through February 14, 2012 was $3 million and for the successor period for the nine months ended September 30, 2012 was $23 million. The amortization expense of assets recorded under capital leases are included with the depreciation expense and was $0.9 million for the period ended September 30, 2011. The amortization expense of assets recorded under capital leases was $0.2 million for the predecessor period from January 1 through February 14, 2012 and was $0.6 million for the successor period for the nine months ended September 30, 2012.
7. Other Current Liabilities
Other current liabilities consisted of the following:
| Predecessor | Successor | |||||||||
| December 31, 2011 |
September 30, 2012 |
|||||||||
| Payroll and benefits |
$ | 10 | $ | 10 | ||||||
| Taxes other than income taxes |
5 | 4 | ||||||||
| Deferred income |
14 | 13 | ||||||||
| Accrued charges |
15 | 17 | ||||||||
|
|
|
|
|
|||||||
| Total other current liabilities |
$ | 44 | $ | 44 | ||||||
|
|
|
|
|
|||||||
F-45
Table of Contents
8. Restructuring
In 2011 the Company recognized restructuring expenses reported in the other operating expense of the condensed consolidated statement of operations for a total amount of $ 11 million primarily related to a restructuring provision following the decision in August 2011 to close the MIPA (monoisopropylamine) production facility of Taminco Comércio e Industría de Aminas Ltda. located in Camaçari, Bahia, Brazil. The provision is an estimate for all costs related to the closure such as employee termination indemnities, early termination indemnity of raw material and utilities supply contracts and cleaning costs to make the site available for sale. The operating business of the MIPA facility has moved to the production facility in St. Gabriel, Louisiana. The MIPA business is now managed through the North American entity, Taminco Inc.
The following table sets forth the changes in the restructuring reserve:
| Functional Amines |
Total | |||||||
| Balance as of January 1, 2012 |
$ | — | $ | — | ||||
| Acquisition |
8 | 8 | ||||||
| Additions |
5 | 5 | ||||||
| Cash payments |
(4 | ) | (4 | ) | ||||
| Foreign currency translation adjustments |
— | — | ||||||
|
|
|
|
|
|||||
| Balance as of September 30, 2012 |
$ | 9 | $ | 9 | ||||
|
|
|
|
|
|||||
The above restructuring provision contains the following components:
| Termination |
$ | 5 | ||
| Site closure costs |
2 | |||
| Other costs |
2 | |||
|
|
|
|||
| Total |
$ | 9 | ||
|
|
|
9. Short and Long-Term Debt
Total indebtedness is as follows:
| Predecessor | Successor | |||||||||
| December 31, 2011 |
September 30, 2012 |
|||||||||
| Senior Secured Credit Facilities |
||||||||||
| Term loan credit facility - USD - $350 million |
$ | — | $ | 348 | ||||||
| Term loan credit facility - EUR - €120 million |
— | 154 | ||||||||
| Second-priority senior secured 9.75% notes due 2020, $400 million |
— | 400 | ||||||||
| Capital and financing lease obligations |
8 | 8 | ||||||||
| Subordinated capitalization bonds |
373 | — | ||||||||
| Term facility - € loan |
413 | — | ||||||||
| Term facility - $ loan |
337 | — | ||||||||
|
|
|
|
|
|||||||
| Total |
1,131 | 910 | ||||||||
| Less current maturities |
29 | 6 | ||||||||
|
|
|
|
|
|||||||
| Total long-term debt |
$ | 1,102 | $ | 904 | ||||||
|
|
|
|
|
|||||||
F-46
Table of Contents
Indebtedness Table
As of September 30, 2012, the total capacity, outstanding borrowings and available capacity under the Company’s borrowing arrangements were as follows:
| Interest Rate |
Expiration Date |
Total Capacity |
Outstanding Borrowings |
Available Capacity |
||||||||||||||||
| Senior Secured Credit Facilities |
||||||||||||||||||||
| Revolving Credit Facility - USD - $194 million |
(1)(2 | ) | February 15, 2017 | $ | 194 | $ | — | $ | 194 | |||||||||||
| Term loan Credit Facility - USD - $350 million |
(1)(3 | ) | February 15, 2019 | 348 | 348 | — | ||||||||||||||
| Term loan Credit Facility - EUR - €120 million |
(1)(4 | ) | February 15, 2019 | 154 | 154 | — | ||||||||||||||
| Second-Priority Senior Secured Notes |
9.75 | % | March 31, 2020 | 400 | 400 | — | ||||||||||||||
|
|
|
|
|
|
|
|||||||||||||||
| $ | 1,096 | $ | 902 | $ | 194 | |||||||||||||||
|
|
|
|
|
|
|
|||||||||||||||
| (1) | Alternate base rate is 1.25%. |
| (2) | The applicable rate for the revolving credit facility is determined by the First Lien Leverage Ratio. Below is table summarizing the applicable rate for the revolving credit facility: |
| Revolving Credit Facility Leverage Ratio |
ABR Spread for Revolving Loans |
Eurocurrency Spread for Revolving Loans |
||||||
| Category 1: |
||||||||
| Greater than or equal to 1.50 to 1.00 |
3.00 | % | 4.00 | % | ||||
| Category 2: |
||||||||
| Less than 1.50 to 1.00 and greater than or equal to 1.00 to 1.00 |
2.75 | % | 3.75 | % | ||||
| Category 3: |
||||||||
| Less than 1.00 to 1.00 |
2.50 | % | 3.50 | % | ||||
| (3) | The applicable rate for the Dollar term loan is 4.00% per annum. |
| (4) | The applicable rate for the Euro term loan is 4.25% per annum. |
Indebtedness Incurred at the Time of the Acquisition and Subsequent Debt Transactions
As a result of the Acquisition, the senior facility agreement and subordinated capitalization bonds were repaid and replaced by a new debt structure. The debt incurred on the transaction date, February 15, 2012, included borrowings under Taminco’s senior secured credit facility (the “Senior Secured Credit Facility”) and the issuance of secured notes. Taminco borrowed an initial amount of $510 million in term loan facilities and under the Senior Secured Credit Facility (consisting of $350 million Dollar term loans and €120 million Euro term loan) with original maturity dates of February 15, 2019. In addition, Taminco issued an original aggregate principal amount of $400 million under a second-priority senior secured notes with a maturity date of March 31, 2020. The initial term loan facilities and issuance of notes were used by Taminco to pay off the previously existing debt.
Taminco also entered an agreement for a $200 million senior secured revolving credit facility. There have not been any borrowings against the revolving loan.
On May 15, 2012, Taminco refinanced the senior secured term loans and Revolving Credit Loans. As part of this refinancing, the applicable rate was lowered by 1% on the USD loans and 0.75% on the Euro loans. There were no changes to the terms of the loans. In addition, the revolving credit agreement was reduced by $5.7 million, reducing the available capacity to $194 million. The transaction was treated as a debt modification and the financing costs of $8 million were capitalized and will be amortized over the life of the loan to interest expense.
F-47
Table of Contents
Senior Secured Credit Facility
The Senior Secured Credit Facility consists of term loan facilities and revolving credit facilities (the facilities described in the Original Credit Agreement, and as amended by the Senior Secured Credit Facility Amendment).
The Senior Secured Credit Facility and the indenture governing the notes contain customary covenants. Only the revolver line is subject to financial covenants, and only one ratio exists: a maximum net first lien leverage ratio of 3.75, tested quarterly and upon each credit extension, depending on certain conditions, as detailed in the debt terms and conditions. The test applies only if loans under this line exist or if more than $20 million of letters of credit that are not cash-collateralized are outstanding. This ratio is also based only on part of the financial debt, since the second-priority senior secured notes, which represent about half the financial debt, do not have first lien claims.
Second-Priority Senior Secured Notes
On February 15, 2012, Taminco issued in a private placement $400 million of 9.75% Second-Priority Senior Notes due 2020 (the “Notes”). These Notes mature on March 15, 2020 and bear interest payable semiannually on March 31 and September 30 of each year.
Taminco may redeem some or all of the Notes at any time on or after March 31, 2015 at the redemption price equal to the principal amount thereof plus accrued and unpaid interest, if any, to the redemption date. In addition, Taminco may redeem up to 40% of the aggregate principal amount of the Notes on or prior to March 31, 2015, with the net proceeds from certain equity offerings at a redemption price of 109.750%, plus accrued and unpaid interest, if any to the redemption date. Prior to March 31, 2015, Taminco may redeem some or all of the Notes at a price equal to 100% of the principal amount thereof, plus accrued and unpaid interest, and a calculated amount equal to one percent of the outstanding principal amount.
10. Share-Based Compensation
Stock Options
In August 2007, certain management members entered into an agreement (the “Option Agreement”) whereby stock options were granted to management that are exercisable into shares of Taminco International S.à r.l. (which was the direct holding company of Taminco Group Holdings S.à r.l. until February 14, 2012). In accordance with the Option Agreement, the options are exercisable only upon the occurrence of a sale of the Company, change in control, or initial public offering (the “Exit Event”). The number of exercisable options is determined on the basis of the internal rate of return achievable by the investors upon the Exit Event. All options lapse if the optionholders cease to remain employees of the Company through the Exit Event. Since the stock options only become exercisable upon an Exit Event, management determined that it is not probable that such options will vest until the Exit Event occurs.
An Exit Event occurred on February 14, 2012 and consequently 27,643,485 stock options became exercisable and were converted into shares. As the vesting of such options was not probable until the Exit Event, the Company recorded a non-cash compensation charge of $8 million during the period from January 1, 2012 through February 14, 2012 (Predecessor period), which is classified in selling, general and administrative expense. The charge represented the fair value of the options as determined on the date of grant.
Other Share-Based Arrangement
In connection with the acquisition of the Company in August 2007, certain agreements were entered into whereby management invested $36 million in Taminco International S.à r.l., which was comprised of $33 million in subordinated loans and $3 million in shares. The subordinated loans bear a fixed compounded interest rate of 10%. Under the terms of the agreements, the loans and the shares required that management provide service to the Company through the Exit Event. If management were to terminate employment at its own discretion prior to the Exit Event, the entire investment and accrued interest with respect to the subordinated loans would be forfeited. As a result, the arrangement is accounted for as compensatory and expense is pushed down from Taminco International Sà r.l. to the financial statements of the Company.
F-48
Table of Contents
Since the loans are cash settled, it is treated as a liability award, and compensation expense will be recognized when it is probably that the Exit Event will occur in an amount equal to the actual amounts paid to management at the Exit Event. The shares are an equity award as settlement is required in shares. Therefore, the Company determined the fair value of the shares on the grant date and compensation expense will be recognized when it is probable that the Exit Event will occur. The fair value of the shares on the grant date is equal to $3 million. As a result of the Exit Event on February 14, 2012, the non-cash compensation expense related to the shares and the subordinated loans of $52 million was recorded in the period from January 1, 2012 through February 14, 2012, and is included in selling, general and administrative expense.
Incentive Equity Awards Granted by TAC
In April 2012, TAC granted stock options. The original stock options granted were either time vesting or performance based awards with an exercise price equal to the grant date fair price of the underlying shares. The Tranche A shares which are time vesting follow a vesting schedule whereby one-fifth of the shares vest on each of the first five grant date anniversaries. The vesting of the rest of the shares will accelerate upon a realization event. The Tranche B shares are performance vesting are based on the occurrence of a realization event and two financial metrics (sponsor internal rate of return and sponsor multiple of invested capital).
Options with an estimated fair value of $8.7 million were granted in connection with the April 2012 issuance. An additional grant of options with an estimated fair value of $0.5 million was issued in the third quarter of 2012. The fair value of the time vesting options was determined by using the Black-Scholes formula with expected life based on the SEC simplified method. The fair value of the performance vesting options was determined by using a Monte Carlo model.
| 2012 Time Vesting Options |
||||
| Weighted average grant date fair value |
$ | 44.29 | ||
| Expected volatility |
37 | % | ||
| Expected Term (years) |
8 | |||
| Risk-free interest rate |
1.81 | % | ||
| Dividend yield |
— | |||
Equity Award Activity
A summary of 2012 option and restricted share activity is presented below (number of shares in millions):
| Time Vesting Options | Performance Based Options | |||||||
| Outstanding at January 1, 2012 |
— | — | ||||||
|
|
|
|
|
|||||
| Granted |
0.15 | 0.24 | ||||||
| Exercised |
— | — | ||||||
| Vested |
— | — | ||||||
| Forfeited |
— | — | ||||||
|
|
|
|
|
|||||
| Outstanding at September 30, 2012 |
0.15 | 0.24 | ||||||
|
|
|
|
|
|||||
There were no options exercisable at September 30, 2012.
As of September 30, 2012, there was approximately $6.2 million of unrecognized compensation cost related to the time vesting options and $2.6 million of unrecognized compensation cost related to performance based options issued. Unrecognized cost for the time vesting options will be recorded in future periods as compensation
F-49
Table of Contents
expense as the awards vest over the 8 year period from the date of grant with a remaining weighted average period of approximately 8 years. Performance-based awards vest upon the achievement of certain internal rate of return measures. Unrecognized costs of the performance-based options will be recorded as compensation expense when the above measures are probable of occurring.
11. Financial Instruments and Derivatives
The fair value of derivative instruments was as follows:
| Liability Derivatives |
Predecessor December 31, 2011 Fair Value |
Successor September 30, 2012 Fair Value |
||||||||||
| Not Designated as Hedging Instruments |
||||||||||||
| Interest rate swaps |
Other non-current liabilities | $ | 12 | $ | — | |||||||
|
|
|
|
|
|||||||||
| $ | 12 | $ | — | |||||||||
|
|
|
|
|
|||||||||
During the Successor Period for the nine months ended September 30, 2012, the Company did not have any financial instruments and derivatives.
The following tables present the Company’s assets and liabilities that are measured at fair value on a recurring basis and are categorized using the fair value hierarchy. The fair value hierarchy has three levels based on the reliability of the inputs used to determine fair value.
| Level Input: |
Input Definition: | |
| Level I |
Inputs are unadjusted, quoted prices for identical assets or liabilities in active markets at the measurement date. | |
| Level II |
Inputs other than quoted prices included in Level I that are observable for the asset or liability through corroboration with market data at the measurement date. | |
| Level III |
Unobservable inputs that reflect management’s best estimate of what market participants would use in pricing the asset or liability at the measurement date. |
The availability of observable inputs can vary from asset to asset and is affected by a wide variety of factors, including, for example, the type of asset, whether the asset is new and not yet established in the marketplace, and other characteristics particular to the transaction. To the extent that valuation is based on models or inputs that are less observable or unobservable in the market, the determination of fair value requires more judgment. Accordingly, the degree of judgment exercised by the Company in determining fair value is greatest for instruments categorized in Level III. In certain cases, the inputs used to measure fair value may fall into different levels of the fair value hierarchy. In such cases, for disclosure purposes, the level in the fair value hierarchy within which the fair value measurement in its entirety falls is determined based on the lowest level input that is significant to the fair value measurement in its entirety.
The following table summarizes fair value measurements by level at December 31, 2011 for assets/liabilities measured at fair value on a recurring basis:
| Level I | Level II | Level III | Total | |||||||||||||
| Derivatives |
||||||||||||||||
| Interest rate swaps (included in other non-current liabilities |
$ | — | $ | 12 | $ | — | $ | 12 | ||||||||
There were no assets or liabilities valued at fair value on a recurring basis during the nine months ended September 30, 2012 for the successor.
F-50
Table of Contents
The following table summarizes the carrying amount of the Company’s indebtedness compared to the estimated fair value at:
| Predecessor December 31, 2011 |
Successor September 30, 2012 |
|||||||||||||||||
| Carrying Amount |
Estimated Fair Value(a) |
Carrying Amount |
Estimated Fair Value(a) |
|||||||||||||||
| Senior Secured Credit Facilities |
||||||||||||||||||
| Revolving credit facility - USD - $200 million |
$ | — | $ | — | $ | — | $ | — | ||||||||||
| Term loan credit facility - USD - $350 million |
— | — | 348 | 349 | ||||||||||||||
| Term loan credit facility - EUR - €120 million |
— | — | 154 | 156 | ||||||||||||||
| Second-priority senior secured 9.75% notes due 2020, $400 million |
— | — | 400 | 424 | ||||||||||||||
| Related party debt |
373 | 424 | — | — | ||||||||||||||
| Term facility |
729 | 749 | — | — | ||||||||||||||
| (a) | The fair value of the Company’s indebtedness is categorized as Level II. |
12. Defined Benefit Pension Plan
Net periodic benefit costs for the defined benefit pension plan for the period presented are as follows:
| (amounts in millions) | Predecessor | Successor | ||||||||||||
| Nine Months Ended September 30, 2011 |
January 1 through February 14, 2012 |
Nine Months Ended September 30, 2012 |
||||||||||||
| Service cost |
$ | 1 | $ | — | $ | 1 | ||||||||
| Interest cost |
1 | — | 1 | |||||||||||
| Expected return on plan assets |
(1 | ) | — | (1 | ) | |||||||||
| Amortization of actuarial gain/loss |
— | — | — | |||||||||||
| Amortization of prior service cost |
— | — | — | |||||||||||
|
|
|
|
|
|
|
|||||||||
| Net periodic benefit costs |
$ | 1 | $ | — | $ | 1 | ||||||||
|
|
|
|
|
|
|
|||||||||
13. Income Taxes
The Company calculates the tax provision for interim periods using an estimated annual effective tax rate methodology which is based on a current projection of full-year earnings before taxes amongst different taxing jurisdictions and is adjusted for the impact of discrete quarterly items. The annual estimated effective tax rate for the year ending December 31, 2012 is 49.11%. The estimated annual effective tax rate is greater than the U.S. statutory tax rate of 35% due to state taxes and operations in non-U.S. jurisdictions where the Company is not able to defer taxation in the U.S. The Company has incurred a pretax loss for the nine months ended September 30, 2012 and has recorded tax expense at an effective tax rate of 18.61%. The effective tax rate for the period is different from the estimated annual effective tax rate due to the non-deductibility of certain transaction costs that were recorded as a discrete expense during the period.
For the Predecessor period, income tax expense for the first nine months of 2011 was $28 million on pre-tax income of $58 million. The income tax expense for the nine months ended September 30, 2011 was partially off-set by anticipated tax credits due to the liquidation of Taminco South. The income tax expense for the period January 1 through February 14, 2012 was $9 million on a pre-tax loss of $45 million. This effective tax rate of (20)% is explained by the non-deductibility of the share-based compensation and other share-based arrangements in the Predecessor period as described in note 10.
F-51
Table of Contents
14. Related Parties
Transactions with Related Parties (Taminco International Sàrl)
As of December 31, 2011 amounts due to related parties were $373 million for the subordinated capitalization bonds and amounts due from related parties were $1 million. As part of the acquisition, all outstanding interest and capitalized interest were repaid.
Transactions with Related Parties (Apollo Affiliates)
The Company has entered into certain transactions in the normal course of business with entities that are owned by affiliates of Apollo. For nine months ended September 30, 2012, the Company has recognized net sales related to these transactions of $5 million.
Apollo Management Fee Agreement
In connection with the Acquisition, Apollo Management VII, LP (“Apollo Management”) entered into a management fee agreement with the Company which allows Apollo Management and its affiliates to provide certain management consulting services to the Company. The Company pays Apollo Management an annual management fee for this service of $3.9 million plus out-of-pocket costs and expenses in connection therewith. In 2012, the fee was prorated based on the date of the Acquisition. At September 30, 2012, the company has expensed $2.4 million with a remainder of $1 million carried as a prepaid asset. In addition to the management fee, the company has recognized expenses paid to Apollo Global Securities, LLC in connection with the Acquisition amounting to $14.6 million.
15. Other Operating Expenses
Other operating expenses for the period ended September 30, 2012 totaled $44 million. The amount is related to the recent Acquisition and includes fees paid to Apollo, legal fees and general advisory fees.
16. Other Non-Operating Expenses
Other non-operating expenses for the period ended September 30, 2012 totaled $8 million. The amount consisted of costs related to a foreign currency swap of approximately $6 million related to the Acquisition and approximately $2 million related to foreign exchange rates.
17. Segment Information
The reportable segments presented below represent the Company’s operating segments for which separate financial information is available and which is utilized on a regular basis by its chief operating decision maker to assess performance and to allocate resources. In identifying its reportable segments, the Company also considers the nature of services provided by its operating segments. Management evaluates the operating results of each of its reportable segments based upon net sales and Adjusted EBITDA (a non-GAAP measure). The Company’s presentation of Adjusted EBITDA may not be comparable to similar measures used by other companies. Business segment assets are the owned or allocated assets used by each business.
EBITDA consists of profit for the period before interest, taxation, depreciation and amortization. Adjusted EBITDA consists of EBITDA and eliminates (i) transaction costs, (ii) restructuring charges, (iii) foreign exchange gains/losses, (iv) sponsor management and director fees and expenses (Successor period only), and (v) share-based compensation expense.
F-52
Table of Contents
| Net Sales(1) | ||||||||||||||
| Predecessor | Successor | |||||||||||||
| Nine Months Ended September 30, 2011 |
January 1 through February 14, 2012 |
Nine Months Ended September 30, 2012 |
||||||||||||
| Functional Amines |
$ | 393 | $ | 64 | $ | 318 | ||||||||
| Specialty Amines |
355 | 61 | 302 | |||||||||||
| Crop Protection |
120 | 19 | 91 | |||||||||||
|
|
|
|
|
|
|
|||||||||
| Total Company |
$ | 868 | $ | 144 | $ | 711 | ||||||||
|
|
|
|
|
|
|
|||||||||
| (1) | Products are transferred from the Functional Amines segment to the Specialty Amines segment at cost and therefore are not recorded as a sale. Accordingly, the Functional Amines segment does not reflect profit on products transferred to the Specialty Amines segment. Products are transferred from the Functional Amines segment to the Crop Protection segment on a basis intended to reflect as nearly as practicable, the market value of the products. |
| Adjusted EBITDA | ||||||||||||||
| Predecessor | Successor | |||||||||||||
| Nine Months Ended September 30, 2011 |
January 1 through February 14, 2012 |
Nine Months Ended September 30, 2012 |
||||||||||||
| Functional Amines |
$ | 88 | $ | 15 | $ | 81 | ||||||||
| Specialty Amines |
61 | 9 | 53 | |||||||||||
| Crop Protection |
35 | 6 | 27 | |||||||||||
|
|
|
|
|
|
|
|||||||||
| Total Adjusted EBITDA |
$ | 184 | $ | 30 | $ | 161 | ||||||||
|
|
|
|
|
|
|
|||||||||
| Reconciliation: |
||||||||||||||
| Transaction costs |
(2 | ) | — | (68 | ) | |||||||||
| Restructuring charges |
(8 | ) | — | — | ||||||||||
| Foreign exchange (gains) losses |
(2 | ) | — | (3 | ) | |||||||||
| Sponsor management and director fees and expenses |
— | — | (3 | ) | ||||||||||
| Share-based compensation expense |
— | (60 | ) | — | ||||||||||
| Depreciation and amortization |
(58 | ) | (7 | ) | (64 | ) | ||||||||
| Interest expense, net |
(57 | ) | (8 | ) | (50 | ) | ||||||||
| Income tax expense |
(28 | ) | (9 | ) | (2 | ) | ||||||||
|
|
|
|
|
|
|
|||||||||
| Net Income (loss) |
$ | 29 | $ | (54 | ) | $ | (29 | ) | ||||||
|
|
|
|
|
|
|
|||||||||
| Depreciation and Amortization | ||||||||||||||
| Predecessor | Successor | |||||||||||||
| Nine Months Ended September 30, 2011 |
January 1 through February 14, 2012 |
Nine Months Ended September 30, 2012 |
||||||||||||
| Functional Amines |
$ | 35 | $ | 4 | $ | 29 | ||||||||
| Specialty Amines |
17 | 2 | 21 | |||||||||||
| Crop Protection |
6 | 1 | 14 | |||||||||||
|
|
|
|
|
|
|
|||||||||
| Total Company |
$ | 58 | $ | 7 | $ | 64 | ||||||||
|
|
|
|
|
|
|
|||||||||
F-53
Table of Contents
| Total Assets | ||||||||||
| Predecessor | Successor | |||||||||
| December
31, 2011 |
September
30, 2012 |
|||||||||
| Functional Amines |
$ | 431 | $ | 549 | ||||||
| Specialty Amines |
417 | 649 | ||||||||
| Crop Protection |
326 | 476 | ||||||||
| Corporate |
174 | 150 | ||||||||
|
|
|
|
|
|||||||
| Total Company |
$ | 1,348 | $ | 1,824 | ||||||
|
|
|
|
|
|||||||
18. Commitments and Contingencies
The Company is, from time to time, subject to a variety of litigation and similar proceedings incidental to its business. These legal matters primarily involve claims for damages arising out of the use of the Company’s products and services and claims relating to intellectual property matters, employment matters, tax matters, commercial disputes, competition and sales and trading practices, personal injury and insurance coverage. The Company may also become subject to lawsuits as a result of past or future acquisitions or as a result of liabilities retained from, or representations, warranties or indemnities provided in connection with, divested businesses. Some of these lawsuits may include claims for punitive and consequential, as well as compensatory damages. Based upon the Company’s experience, current information and applicable law, it does not believe that these proceedings and claims will have a material adverse effect on its consolidated results of operations, financial position or liquidity. However, in the event of unexpected further developments, it is possible that the ultimate resolution of these matters, or other similar matters, if unfavorable, may be materially adverse to the Company’s business, financial condition, results of operations or liquidity.
19. Subsequent Events
On December 18, 2012, TAC issued $250 million of 9.125%/9.875% Senior PIK Toggle Notes due 2017 (“Toggle Notes”). The interest associated with the Toggle Notes may be paid in cash, through an increase in the principal amount of the Toggle Notes or by issuing new Toggle Notes to satisfy the obligation. Interest expense is calculated at a rate of 9.125% for cash payments or 9.875% for payments made through an increase in the principal amount of Toggle Notes outstanding, respectively. The net proceeds of this offering of approximately $243 million were distributed to the shareholders of the Company as a return of capital.
F-54
Table of Contents
Shares

TAMINCO GLOBAL CHEMICAL CORPORATION
Common Stock
Citigroup
Credit Suisse
Deutsche Bank Securities
Goldman, Sachs & Co.
Nomura
UBS Investment Bank
PROSPECTUS
, 2013
Table of Contents
PART II
INFORMATION NOT REQUIRED IN PROSPECTUS
Item 13. Other Expenses of Issuance and Distribution.
The following table sets forth all costs and expenses, other than the underwriting discounts and commissions payable by us, in connection with the offer and sale of the securities being registered. All amounts shown are estimates except for the SEC registration fee and the Financial Industry Regulatory Authority, Inc. (“FINRA”) filing fee.
| Amount | ||||
| SEC registration fee |
$ | 34,100 | ||
| FINRA filing fee |
$ | 38,000 | ||
| Listing fee |
* | |||
| Printing expenses |
* | |||
| Accounting fees and expenses |
* | |||
| Legal fees and expenses |
* | |||
| Blue Sky fees and expenses |
* | |||
| Transfer Agent and Registrar fees and expenses |
* | |||
| Miscellaneous expenses |
* | |||
|
|
|
|||
| Total |
$ | * | ||
|
|
|
|||
| * | To be provided by amendment. |
Item 14. Indemnification of Officers and Directors.
We are incorporated under the laws of the State of Delaware. Reference is made to Section 102(b)(7) of the Delaware General Corporation Law (“DGCL”), which enables a corporation in its original certificate of incorporation or an amendment thereto to eliminate or limit the personal liability of a director for violations of the director’s fiduciary duty, except (1) for any breach of the director’s duty of loyalty to the corporation or its stockholders, (2) for acts or omissions not in good faith or which involve intentional misconduct or a knowing violation of law, (3) pursuant to Section 174 of the DGCL, which provides for liability of directors for unlawful payments of dividends of unlawful stock purchase or redemptions or (4) for any transaction from which a director derived an improper personal benefit.
Reference is also made to Section 145 of the DGCL, which provides that a corporation may indemnify any person, including an officer or director, who is, or is threatened to be made, party to any threatened, pending or completed legal action, suit or proceeding, whether civil, criminal, administrative or investigative, other than an action by or in the right of such corporation, by reason of the fact that such person was an officer, director, employee or agent of such corporation or is or was serving at the request of such corporation as a director, officer, employee or agent of another corporation or enterprise. The indemnity may include expenses (including attorneys’ fees), judgments, fines and amounts paid in settlement actually and reasonably incurred by such person in connection with such action, suit or proceeding, provided such officer, director, employee or agent acted in good faith and in a manner he reasonably believed to be in, or not opposed to, the corporation’s best interest and, for criminal proceedings, had no reasonable cause to believe that his conduct was unlawful. A Delaware corporation may indemnify any officer or director in an action by or in the right of the corporation under the same conditions, except that no indemnification is permitted without judicial approval if the officer or director is adjudged to be liable to the corporation. Where an officer or director is successful on the merits or otherwise in the defense of any action referred to above, the corporation must indemnify him against the expenses that such officer or director actually and reasonably incurred.
II-1
Table of Contents
Our amended and restated by-laws provides for indemnification of the officers and directors to the full extent permitted by applicable law. The Underwriting Agreement provides for indemnification by the underwriters of the registrant and its officers and directors for certain liabilities arising under the Securities Act, or otherwise.
Item 15. Recent Sales of Unregistered Securities
Set forth below in chronological order is certain information regarding securities issued by the Registrant during the three years preceding the filing of this registration statement in transactions that were not registered under the Securities Act of 1933, as amended (the “Securities Act”), including the consideration, if any, received by the Registrant for such issuances. None of these transactions involved any underwriters or any public offerings. Each of these transactions was exempt from registration under the Securities Act pursuant to Section 4(2) of the Securities Act or Regulation D or Rule 701 promulgated thereunder, as transactions by an issuer not involving a public offering. With respect to each transaction listed below, no general solicitation was made by either the Registrant or any person acting on its behalf; the recipient of our securities agreed that the securities would be subject to the standard restrictions applicable to a private placement of securities under applicable state and federal securities laws; and appropriate legends were affixed to the certificates issued in such transactions.
| • | On February 3, 2012, the Registrant issued $400 million in aggregate principal amount of 9.750% Second-Priority Senior Secured Notes due 2020 at an issue price of 100%. |
| • | On February 22, 2012, the Registrant issued 238,860 shares of its common stock to certain key employees and directors at a purchase price of $100 per share. |
| • | On July 16, 2012, the Registrant issued 296 shares of its common stock to a certain key employee at a purchase price of $122 per share. |
| • | On August 8, 2012, the Registrant issued 4,110 shares of its common stock to a certain key employee at a purchase price of $122 per share. |
| • | On August 20, 2012, the Registrant issued 518 shares of its common stock to a certain key employee at a purchase price of $122 per share. |
| • | On October 8, 2012, the Registrant issued 822 shares of its common stock to a certain key employee at a purchase price of $122 per share. |
| • | On December 18, 2012, the Registrant issued $250 million in aggregate principal amount of 9.125%/9.875% Senior PIK Toggle Notes due 2017 at an issue price of 99%. |
| • | On December 28, 2012, the Registrant issued 13,703 shares of its common stock to certain key employees at a purchase price of $89.53 per share. |
II-2
Table of Contents
Item 16. Exhibits
(a) Exhibits
The list of exhibits is set forth under “Exhibit Index” at the end of this registration statement and is incorporated herein by reference.
(b) Financial Statement Schedules
The Financial Statement Schedule of the Company appended hereto is for the years ended December 31, 2009, 2010 and 2011 and consists of the following:
Schedule II—Valuation and Qualifying Accounts
| Description |
Balance at Beginning of Year |
Charged to Costs and Expenses |
Balance at End of Year |
|||||||||
| Fiscal Year 2009: |
||||||||||||
| Valuation allowance for trade and notes receivable |
$ | 1 | $ | — | $ | 1 | ||||||
| Valuation allowance for excess and obsolete inventory |
2 | — | 2 | |||||||||
| Valuation allowance for income taxes |
13 | 12 | 25 | |||||||||
| Fiscal Year 2010: |
||||||||||||
| Valuation allowance for trade and notes receivable |
1 | — | 1 | |||||||||
| Valuation allowance for excess and obsolete inventory |
2 | — | 2 | |||||||||
| Valuation allowance for income taxes |
25 | 13 | 38 | |||||||||
| Fiscal Year 2011: |
||||||||||||
| Valuation allowance for trade and notes receivable |
1 | — | 1 | |||||||||
| Valuation allowance for excess and obsolete inventory |
2 | — | 2 | |||||||||
| Valuation allowance for income taxes |
38 | 20 | 58 | |||||||||
| (1) | Uncollectible amounts, dispositions charged against the reserve and utilization of net operation losses. |
All other schedules have been omitted because they are not applicable or because the information required is included in the notes to the consolidated financial statements.
Item 17. Undertakings
(a) The undersigned registrant hereby undertakes to provide to the underwriters at the closing specified in the underwriting agreement certificates in such denominations and registered in such names as required by the underwriters to permit prompt delivery to each purchaser.
(b) Insofar as indemnification for liabilities arising under the Securities Act of 1933, as amended, may be permitted to directors, officers and controlling persons of the registrant pursuant to the foregoing provisions, or otherwise, the registrant has been advised that in the opinion of the Securities and Exchange Commission such indemnification is against public policy as expressed in the Securities Act and is, therefore, unenforceable. In the event that a claim for indemnification against such liabilities (other than the payment by the registrant of expenses incurred or paid by a director, officer or controlling person of the registrant in the successful defense of any action, suit or proceeding) is asserted by such director, officer or controlling person in connection with the securities being registered, the registrant will, unless in the opinion of its counsel the matter has been settled by controlling precedent, submit to a court of appropriate jurisdiction, the question whether such indemnification by it is against public policy as expressed in the Securities Act and will be governed by the final adjudication of such issue.
II-3
Table of Contents
(c) The undersigned registrant hereby further undertakes that:
(1) For purposes of determining any liability under the Securities Act of 1933, as amended, the information omitted from the form of prospectus filed as part of this registration statement in reliance upon Rule 430A and contained in a form of prospectus filed by the registrant pursuant to Rule 424(b)(1) or (4) or 497(h) under the Securities Act shall be deemed to be part of this registration statement as of the time it was declared effective.
(2) For the purpose of determining any liability under the Securities Act of 1933, as amended, each post-effective amendment that contains a form of prospectus shall be deemed to be a new registration statement relating to the securities offered therein, and the offering of such securities at that time shall be deemed to be the initial bona fide offering thereof.
II-4
Table of Contents
SIGNATURES
Pursuant to the requirements of the Securities Act of 1933, as amended, the registrant has duly caused this registration statement to be signed on its behalf by the undersigned, thereunto duly authorized in the City of Ghent, Belgium, on February 8, 2013.
| TAMINCO ACQUISITION CORPORATION | ||
| By: |
/s/ Laurent Lenoir | |
| Name: Laurent Lenoir | ||
| Title: Chief Executive Officer and Director | ||
* * * *
Pursuant to the requirements of the Securities Act of 1933, as amended, this Registration Statement has been signed by the following persons in the capacities indicated and on the date indicated below:
| Name |
Title |
Date | ||
| /s/ Laurent Lenoir Laurent Lenoir |
Chief Executive Officer and Director (Principal Executive Officer) |
February 8, 2013 | ||
| /s/ Kurt Decat Kurt Decat |
Chief Financial Officer and Director (Principal Financial and Accounting Officer) |
February 8, 2013 | ||
| * Charlie Shaver |
Director | February 8, 2013 | ||
| * Kenny Cordell |
Director | February 8, 2013 | ||
| * Samuel Feinstein |
Director | February 8, 2013 | ||
| * Scott Kleinman |
Director | February 8, 2013 | ||
| * Marvin Schlanger |
Director | February 8, 2013 | ||
| * Justin Stevens |
Director | February 8, 2013 | ||
| * Pol Vanderhaeghen |
Director | February 8, 2013 | ||
| *By: | /s/ Laurent Lenoir | |
| Laurent Lenoir | ||
| Attorney-in-Fact |
II-5
Table of Contents
EXHIBIT INDEX
| Exhibit No. |
Description | |
| 1.1* | Form of Underwriting Agreement (including form of lock-up agreement) | |
| 3.1* | Form of Amended and Restated Certificate of Incorporation of Taminco Global Chemical Corporation | |
| 3.2* | Form of Amended and Restated Bylaws of Taminco Global Chemical Corporation | |
| 4.1** | Indenture, dated as of February 3, 2012, among Taminco Global Chemical Corporation, as Issuer, the Guarantors party thereto from time to time and Wilmington Trust, National Association, as Trustee and Collateral Agent, relating to the issuance of 9.750% Second-Priority Senior Secured Notes due 2020 | |
| 4.2** | Supplemental Indenture, dated as of February 15, 2012, among Taminco Inc., Taminco Group Holdings S.à r.l., Taminco Group NV, Taminco NV, Taminco North BVBA and Taminco Germany GmbH, as the New Guarantors, Taminco Global Chemical Corporation, as Issuer, and Wilmington Trust, National Association, as Trustee, to the Indenture, dated as of February 3, 2012, among Taminco Global Chemical Corporation, as Issuer, the Guarantors party thereto from time to time and Wilmington Trust, National Association, as Trustee and Collateral Agent relating respect to the issuance of 9.75% Second-Priority Senior Secured Notes due 2020 | |
| 4.3** | Indenture, dated as of December 18, 2012, among Taminco Acquisition Corporation, as Issuer, the Guarantors party thereto from time to time and Wilmington Trust, National Association, as Trustee, relating to the issuance of 9.125%/9.875% Senior PIK Toggle Notes due 2017 | |
| 5.1* | Form of Opinion of Kirkland & Ellis LLP | |
| 10.1** | Credit Agreement, dated as of February 15, 2012, among Taminco Intermediate Corporation, Taminco Global Chemical Corporation, as Borrower, the lenders party thereto and Citibank, N.A. as Administrative Agent, Citigroup Global Markets Inc., Nomura Securities International, Inc., Credit Suisse Securities (USA) LLC, UBS Securities LLC, Deutsche Bank Securities Inc. and Goldman Sachs Lending Partners LLC, as the Joint Lead Arrangers | |
| 10.2** | Amendment No. 1, dated as of May 14, 2012, among Taminco Global Chemical Corporation, as the Borrower, Taminco Intermediate Corporation, the lending institutions from time to time thereto, and Citibank, N.A., as Administrative Agent to Credit Agreement, dated as of February 15, 2012, among Taminco Intermediate Corporation, Taminco Global Chemical Corporation, as Borrower, the lenders party thereto and Citibank, N.A. as Administrative Agent, Citigroup Global Markets Inc., Nomura Securities International, Inc., Credit Suisse Securities (USA) LLC, UBS Securities LLC, Deutsche Bank Securities Inc. and Goldman Sachs Lending Partners LLC, as the Joint Lead Arrangers | |
| 10.3** | First Lien Collateral Agreement, dated as of February 15, 2012, among Taminco Intermediate Corporation, Taminco Global Chemical Corporation, the other grantors party thereto and Citibank, N.A. as Administrative Agent | |
| 10.4** | Master Guarantee Agreement, dated as of February 15, 2012, among Taminco Intermediate Corporation, the subsidiary guarantors indentified therein, Citibank International PLC, as Belgian sub-agent for the Secured Parties, and Citibank, N.A., as Administrative Agent | |
| 10.5** | Notes Intercreditor Agreement, dated as of February 15, 2012, among Citibank, N.A., as Credit Agreement Agent, each Other First Priority Lien Obligations Agent from time to time party thereto, Wilmington Trust, National Association, as Trustee and Second Priority Collateral Agent, each collateral agent for any Future Second Lien Indebtedness from time to time party thereto, and Citibank, N.A., as Common Collateral Agent | |
| 10.6** | Management Fee Agreement, among Taminco Global Chemical Corporation, Taminco Acquisition Corporation and Apollo Management VII, L.P., dated as of February 15, 2012 | |
II-6
Table of Contents
| Exhibit No. |
Description | |
| 10.7** | Investor Rights Agreement, among Taminco Acquisition Corporation, the Sponsor and the Holders party thereto, dated as of February 15, 2012 | |
| 10.8** | Amended and Restated Non-recourse Accounts Receivable Purchase Agreement, dated as of October 24, 2012, among BNP Paribas Fortis Factor N.V. and Taminco B.V.B.A. | |
| 10.9** | Form of Tranche A Non-qualified Stock Option Agreement under the 2012 Equity Incentive Plan of Taminco Acquisition Corporation | |
| 10.10** | Form of Tranche B-1 Non-qualified Stock Option Agreement under the 2012 Equity Incentive Plan of Taminco Acquisition Corporation | |
| 10.11** | Form of Tranche B-2 Non-qualified Stock Option Agreement under the 2012 Equity Incentive Plan of Taminco Acquisition Corporation | |
| 10.12** | Form of Tranche B-3 Non-qualified Stock Option Agreement under the 2012 Equity Incentive Plan of Taminco Acquisition Corporation | |
| 10.13** | Form of Director Non-qualified Stock Option Agreement under the 2012 Equity Incentive Plan of Taminco Acquisition Corporation | |
| 10.14** | Form of Apollo Director Non-qualified Stock Option Agreement under the 2012 Equity Incentive Plan of Taminco Acquisition Corporation | |
| 10.15** | 2012 Equity Incentive Plan of Taminco Acquisition Corporation | |
| 10.16†** | Methanol Purchase and Sale Agreement, dated as of August 29, 2001, between Methanex Methanol Company and Air Products and Chemicals, Inc. | |
| 10.17†** | Methanol Purchase and Sale Agreement Amendment No. 1, dated as of October 9, 2002, between Methanex Methanol Company and Air Products and Chemicals, Inc. | |
| 10.18** | Management Agreement, dated December 31, 2009, between Taminco Group NV and Laurent Lenoir | |
| 10.19** | Management Agreement, dated December 31, 2009, between Taminco NV and Kurt Decat | |
| 10.20** | Management Agreement, dated December 31, 2009, between Taminco NV and Guy Wouters | |
| 10.21** | Management Agreement, dated December 31, 2009, between Taminco NV and Piet Vanneste | |
| 10.22 | Permanent Employment Contract, dated September 1, 2000, between UCB N.V. and Sabine Ketsman | |
| 10.23 | Addendum Number 1 to the Employment Contract, dated June 29, 2007, between Taminco NV and Sabine Ketsman | |
| 16.1** | Letter from Ernst & Young Bedrijfsrevisoren BCVBA regarding change in certifying accountant | |
| 21.1* | List of Subsidiaries of the Registrant | |
| 23.1 | Consent of Ernst & Young Bedrijfsrevisoren BCVBA | |
| 23.2* | Consent of Kirkland & Ellis LLP (included in Exhibit 5.1) | |
| 23.3** | Consent of Arthur D. Little Benelux S.A./N.V. | |
| 24.1** | Power of Attorney | |
| * | To be filed by amendment. |
| ** | Previously filed. |
| † | Confidential treatment of certain provisions of these exhibits has been requested with the Securities and Exchange Commission. Omitted material for which confidential treatment has been requested has been filed separately with the Securities and Exchange Commission. |
II-7