Attached files
| file | filename |
|---|---|
| 8-K - PPBI 8K 2012 Q4 INVESTOR PRESENTATION - PACIFIC PREMIER BANCORP INC | ppbi_8k-invpres2012q4.htm |
Investor Presentation
Fourth Quarter 2012
Fourth Quarter 2012
Steve Gardner
President & CEO

Forward-Looking Statements and
Where to Find Additional Information
Where to Find Additional Information
The statements contained in this presentation that are not historical facts are forward-looking statements based on management’s current expectations and beliefs concerning future developments and their
potential effects on Pacific Premier Bancorp, Inc. (the “Company”). Such statements involve inherent risks and uncertainties, many of which are difficult to predict and are generally beyond the control of the
Company. There can be no assurance that future developments affecting the Company will be the same as those anticipated by management. The Company cautions readers that a number of important factors
could cause actual results to differ materially from those expressed in, or implied or projected by, such forward-looking statements. These risks and uncertainties include , but are not limited to, the following:
the strength of the United States economy in general and the strength of the local economies in which the Company conducts operations; the effects of, and changes in, trade, monetary and fiscal policies and
laws, including interest rate policies of the Board of Governors of the Federal Reserve System; inflation, interest rate, market and monetary fluctuations; the timely development of competitive new products
and services and the acceptance of these products and services by new and existing customers; the willingness of users to substitute competitors’ products and services for the Company’s products and services;
the impact of changes in financial services policies, laws and regulations (including the Dodd-Frank Wall Street Reform and Consumer Protection Act) and of governmental efforts to restructure the U.S.
financial regulatory system; technological changes; the effect of acquisitions that the Company may make, if any, including, without limitation, the failure to achieve the expected revenue growth and/or
expense savings from its acquisitions such as First Associations Bank (“FAB”); changes in the level of the Company’s nonperforming assets and charge-offs; oversupply of inventory and continued
deterioration in values of California real estate, both residential and commercial; the effect of changes in accounting policies and practices, as may be adopted from time-to-time by bank regulatory agencies,
the Securities and Exchange Commission (“SEC”), the Public Company Accounting Oversight Board, the Financial Accounting Standards Board or other accounting standards setters; possible other-than-
temporary impairments of securities held by the Company; changes in consumer spending, borrowing and savings habits; the effects of the Company’s lack of a diversified loan portfolio, including the risks of
geographic and industry concentrations; ability to attract deposits and other sources of liquidity; changes in the financial performance and/or condition of the Company’s borrowers; changes in the competitive
environment among financial and bank holding companies and other financial service providers; unanticipated regulatory or judicial proceedings; and the Company’s ability to manage the risks involved in the
foregoing.
Additional factors that could cause actual results to differ materially from those expressed in the forward-looking statements are discussed in the Company’s 2011 Annual Report on Form 10-K filed with the
SEC and other filings made by the Company with the SEC. The Company specifically disclaims any obligation to update any factors or to publicly announce the result of revisions to any of the forward-
looking statements included herein to reflect future events or developments.
SEC and other filings made by the Company with the SEC. The Company specifically disclaims any obligation to update any factors or to publicly announce the result of revisions to any of the forward-
looking statements included herein to reflect future events or developments.
Notice to FAB Shareholders
This presentation does not constitute an offer to sell or the solicitation of an offer to buy any securities or a solicitation of any vote or approval. In connection with the proposed acquisition of FAB, the
Company filed a registration statement on Form S-4 (the “Registration Statement”) with the SEC, which contains a proxy statement of FAB and a prospectus of the Company (collectively, the “proxy
statement/prospectus”). A definitive proxy statement/prospectus will be distributed to the shareholders of FAB in connection with their vote on the proposed acquisition of FAB after the Registration Statement
is declared by the SEC to be effective. As of the date of this presentation, the Registration Statement has not been declared effective by the SEC. SHAREHOLDERS OF FAB ARE ENCOURAGED TO READ
THE REGISTRATION STATEMENT AND THE DEFINITIVE PROXY STATEMENT/PROSPECTUS AND ALL OTHER RELEVANT DOCUMENTS FILED WITH THE SEC, AS WELL AS
SUPPLEMENTS TO THOSE DOCUMENTS, BECAUSE THEY WILL CONTAIN IMPORTANT INFORMATION ABOUT THE PROPOSED ACQUISITION OF FAB. The definitive proxy
statement/prospectus will be mailed to shareholders of FAB. Investors and security holders will be able to obtain the definitive proxy statement/prospectus and the other documents free of charge at the SEC's
website, www.sec.gov. In addition, documents filed with the SEC by the Company will be available free of charge by (1) accessing the Company’s website at www.ppbi.com under the “Investor Relations”
link and then under the heading “SEC Filings,” (2) writing the Company at 17901 Von Karman Ave., Suite 1200, Irvine, California 92614, Attention: Investor Relations or (3) writing FAB at 12001 N. Central
Expressway, Suite 1165, Dallas, Texas 75243, Attention: Corporate Secretary.
The directors, executive officers and certain other members of management and employees of the Company may be deemed to be participants in the solicitation of proxies in favor of the proposed acquisition
from the shareholders of FAB. Information about the directors and executive officers of the Company is included in the definitive proxy statement/prospectus for the proposed acquisition of FAB. The
directors, executive officers and certain other members of management and employees of FAB may also be deemed to be participants in the solicitation of proxies in favor of the proposed acquisition from the
shareholders of FAB. Information about the directors and executive officers of FAB is included in the definitive proxy statement/prospectus for the proposed acquisition of FAB. Additional information
regarding the interests of those participants and other persons who may be deemed participants in the transaction may be obtained by reading the definitive proxy statement/prospectus regarding the proposed
acquisition. You may obtain free copies of this document as described in the preceding paragraph.
2
Corporate Profile
|
NASDAQ
|
PPBI
|
|
Focus
|
Small & Middle
Market Businesses |
|
Total Assets
|
$1.174 Billion
|
|
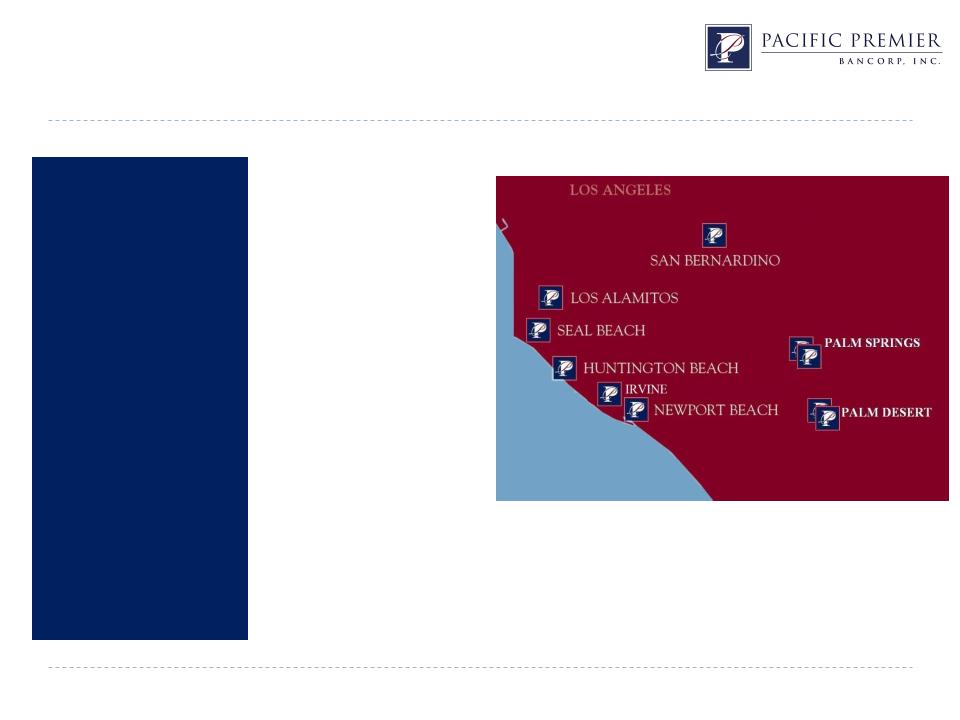
Branches
|
10 Locations
|
|
TCE Ratio
|
11.26% (1)
|
|
FD Book Value
|
$9.75
|
|
Net Income
|
$15.8 Million
|
|
ROAA
|
1.52%
|
|
ROAE
|
16.34%
|
As of and for the year ended December 31, 2012
(1) Non-GAAP financial measure. Please see the Appendix to this investor presentation for the GAAP reconciliation
3

Overview of PPBI
|
Strategic Plan -
Pre 2008 Stage |
o Convert from a thrift to a commercial bank
o Diversify the balance sheet - assets and liabilities
o Regimented approach to credit management
|
|
Strategic Plan -
Current Stage |
o Organic growth driven by high performing sales culture
o Geographic and product expansion through disciplined acquisitions
o Canyon National Bank(CNB) - $209 million in assets as of 2/11/11
o Palm Desert National Bank(PDNB) - $121 million in assets as of 4/27/12
o First Associations Bank(FAB)(Pending) - $356 million in assets as of 9/30/12
|
|
Strategic Plan -
Next Stage |
o Recently completed $35.9 million capital raise to support growth
o Increase fee income - government guaranteed lending
o Increase non-interest bearing accounts to 35%+ of deposit base
o Build out commercial banking franchise
|
4
Creating Shareholder Value 2008 to 2012
$457,128
$618,734
$659,240
$828,877
$904,768
5
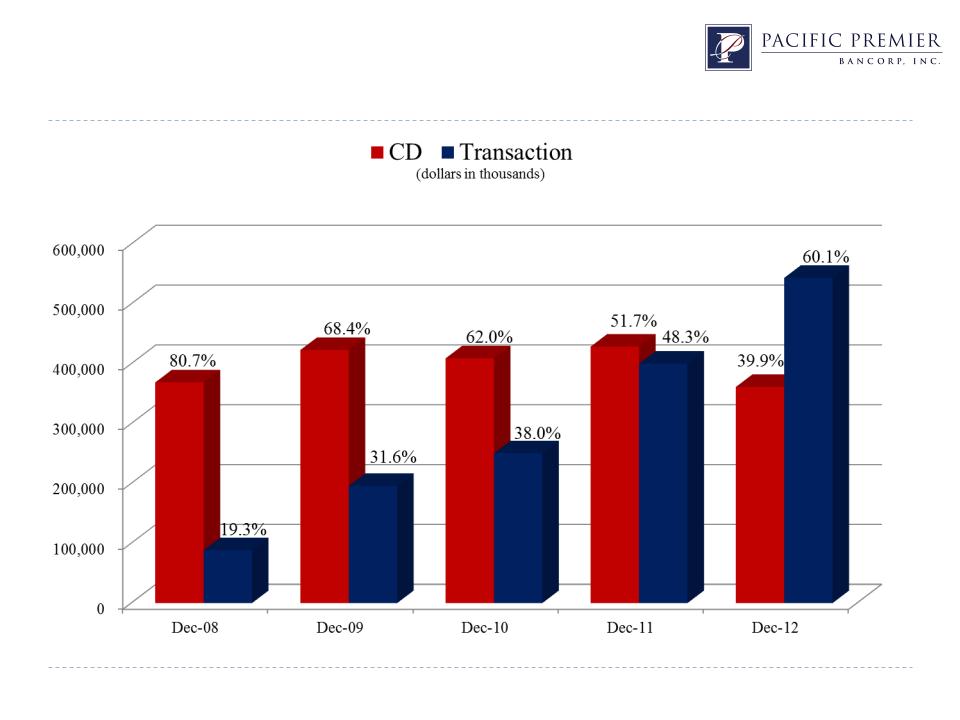
Deposit Base: 2008 vs 2012
|
|
12/31/08
|
12/31/12
|
Variance
|
|
|
(dollars in thousands)
|
||
|
Transaction Accounts
|
|
|
|
|
Noninterest bearing
|
$29,443
|
$213,636
|
625.6%
|
|
Interest bearing checking
|
20,989
|
14,299
|
(31.9%)
|
|
Money market
|
23,463
|
236,206
|
906.7%
|
|
Savings
|
14,401
|
79,420
|
451.5%
|
|
Total transaction accounts
|
88,296
|
543,561
|
515.6%
|
|
CD Accounts
|
|
|
|
|
Time deposits
|
341,741
|
361,207
|
5.7%
|
|
Broker/wholesale CDs
|
27,091
|
--
|
(100.0%)
|
|
Total CDs
|
368,832
|
361,207
|
(2.1%)
|
|
Total deposits
|
$457,128
|
$904,768
|
97.9%
|
6
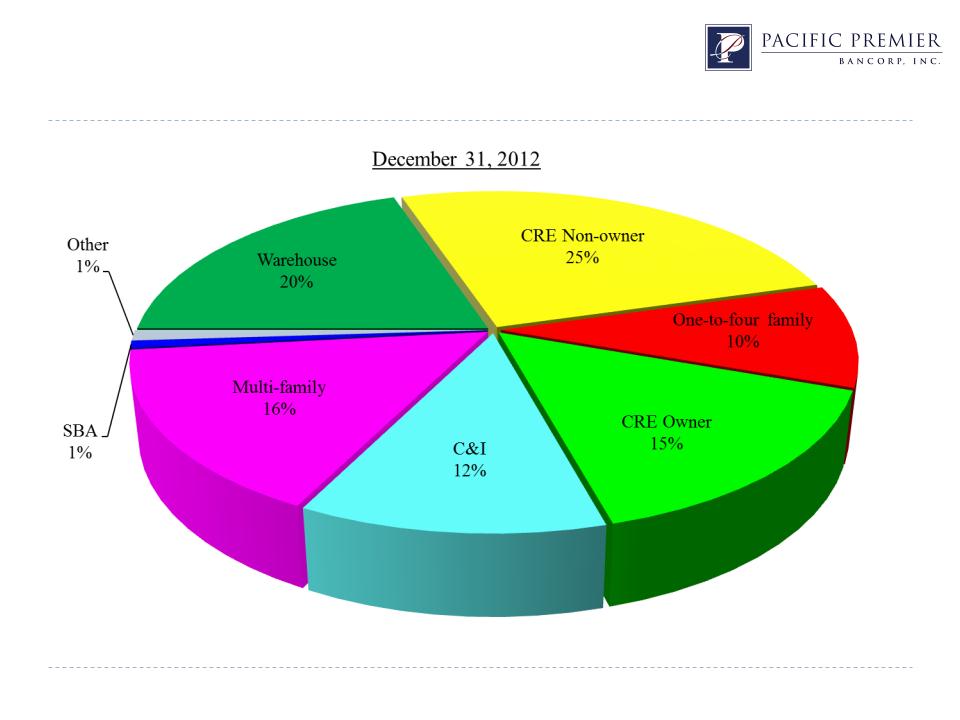
Diversified Loan Portfolio
Total loans: $986.2 million
WAVG Rate: 5.44%
7
Loan Portfolio: 2008 vs 2012
|
|
12/31/08
|
12/31/12
|
Variance
|
|
|
(dollars in thousands)
|
||
|
Business Loans
|
|
|
|
|
Commercial RE owner occupied
|
$112,406
|
$150,934
|
34.3%
|
|
Commercial and industrial
|
43,235
|
115,354
|
166.8%
|
|
Warehouse
|
--
|
195,761
|
n/a
|
|
SBA
|
4,942
|
6,882
|
39.3%
|
|
Total business loans
|
160,583
|
468,931
|
192.0%
|
|
CRE Loans
|
|
|
|
|
Multi-family
|
287,592
|
156,424
|
(45.6%)
|
|
Commercial non-owner occupied
|
163,428
|
253,409
|
55.1%
|
|
Total CRE loans
|
451,020
|
409,833
|
(9.1%)
|
|
|
|
|
|
|
One-to-four family
|
9,925
|
97,463
|
882.0%
|
|
Other loans
|
7,239
|
9,967
|
37.7%
|
|
Gross loans
|
$628,767
|
$986,194
|
56.8%
|
8

Building out the Franchise
o Relationship banking model - strong sales culture
o Growing core deposit base - increasing franchise value
o Robust earnings stream, building book value
o Disciplined analysis and pricing of acquisition targets
o Strong execution on acquisitions
o Excellent asset quality
9
Financial Summary
|
|
QTD
12/31/11
|
QTD
3/31/12
|
QTD
6/30/12
|
QTD
9/30/12
|
QTD
12/31/12
|
|
Balance Sheet
|
(dollars in thousands, except per share data)
|
|
|||
|
Total assets
|
$961,128
|
$985,171
|
$1,065,035
|
$1,089,336
|
$1,173,792
|
|
Net loans
|
730,067
|
687,141
|
790,062
|
856,443
|
977,894
|
|
Total deposits
|
828,877
|
846,717
|
913,191
|
895,870
|
904,768
|
|
Total borrowings
|
38,810
|
38,810
|
38,810
|
85,810
|
125,810
|
|
Total equity
|
86,777
|
89,479
|
96,069
|
99,886
|
134,517
|
|
|
|
|
|
|
|
|
Statements of Operations
|
|
|
|
|
|
|
Net interest income
|
$10,960
|
$10,041
|
$11,282
|
$11,854
|
$12,621
|
|
Noninterest income
|
257
|
939
|
6,529
|
1,910
|
3,194
|
|
Noninterest expense
|
6,616
|
6,641
|
8,205
|
8,031
|
8,977
|
|
Net income
|
2,555
|
2,692
|
5,811
|
3,462
|
3,811
|
|
Diluted EPS
|
$0.24
|
$0.25
|
$0.55
|
$0.32
|
$0.32
|
|
|
|
|
|
|
|
|
Bank Capital Ratios
|
|
|
|
|
|
|
Tier 1 leverage
|
9.44%
|
9.49%
|
9.48%
|
9.48%
|
12.07%
|
|
Tier 1 risk-based
|
11.68%
|
12.54%
|
11.28%
|
11.04%
|
12.99%
|
|
Total risk-based
|
12.81%
|
13.66%
|
12.18%
|
11.88%
|
13.79%
|
|
|
|
|
|
|
|
10
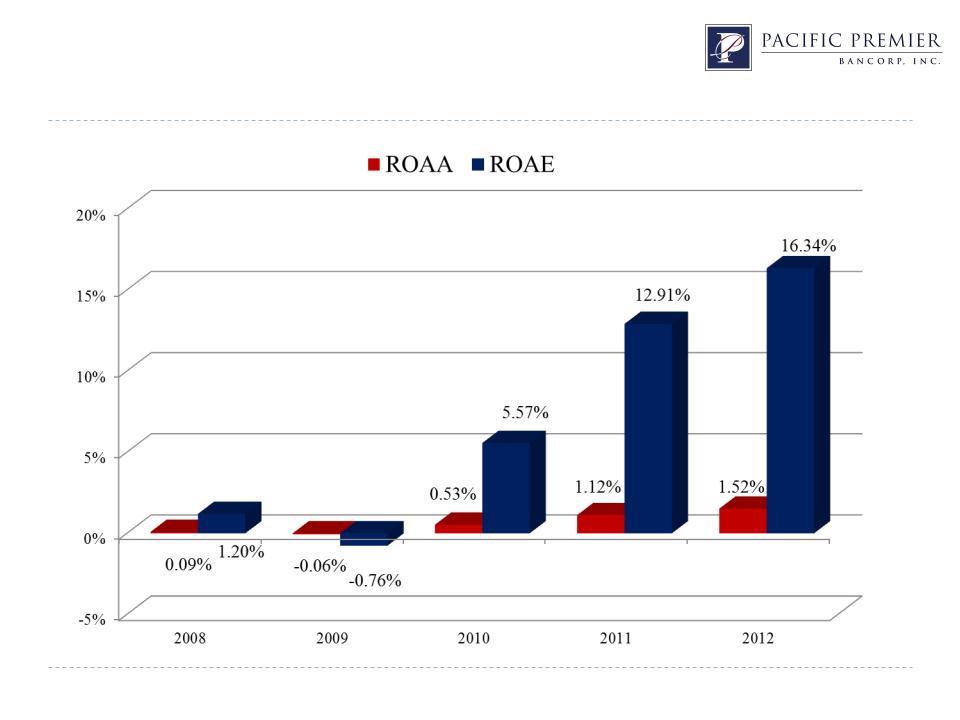
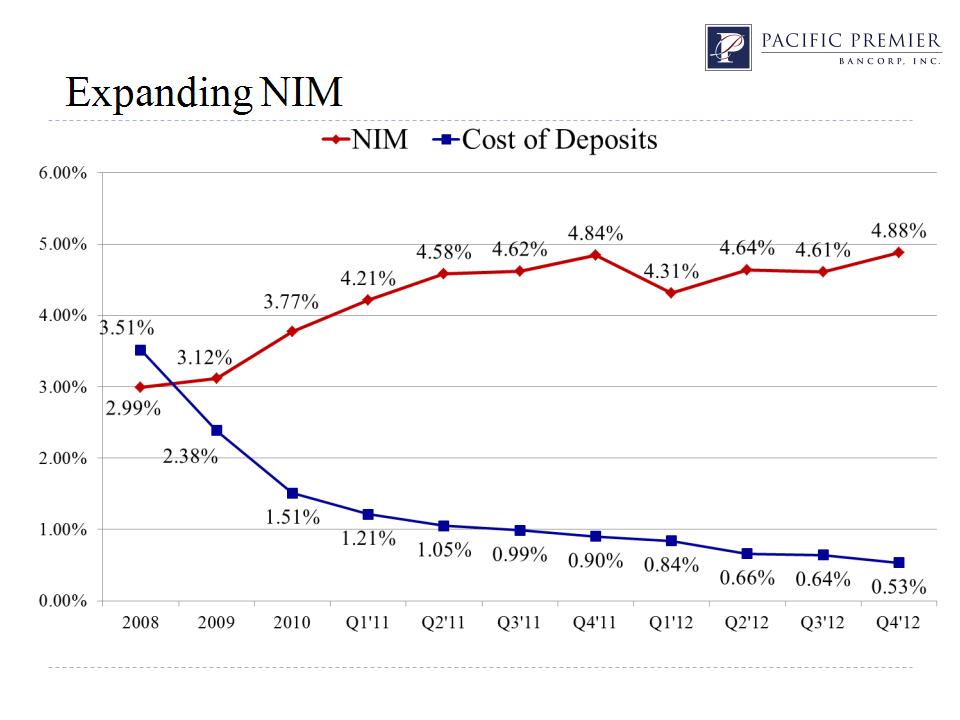
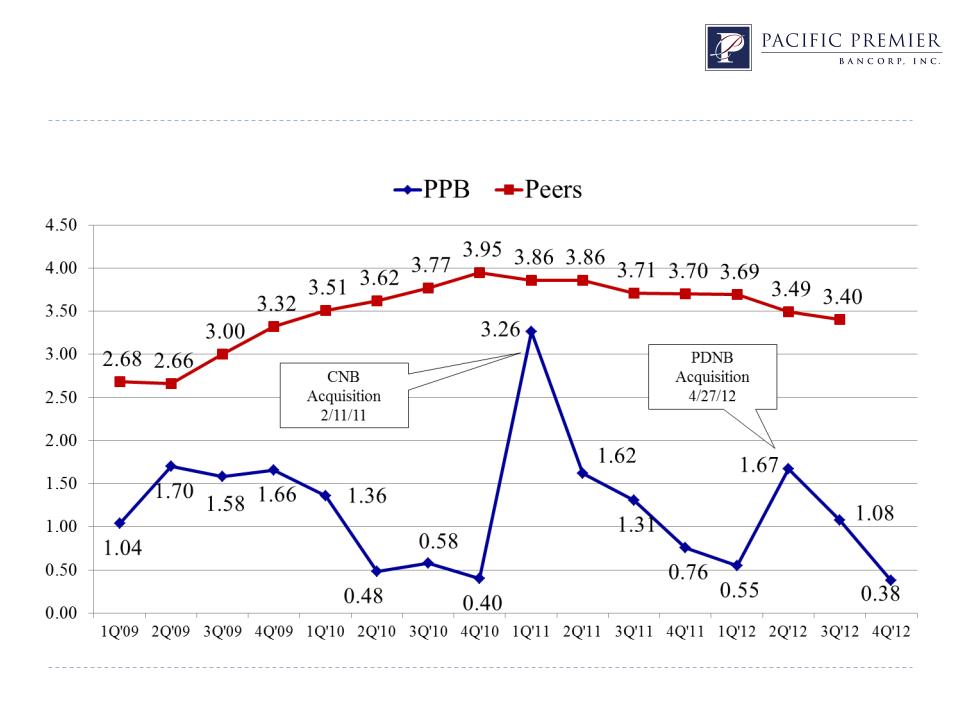
M&A and Organic Growth = Strong Returns
11
12
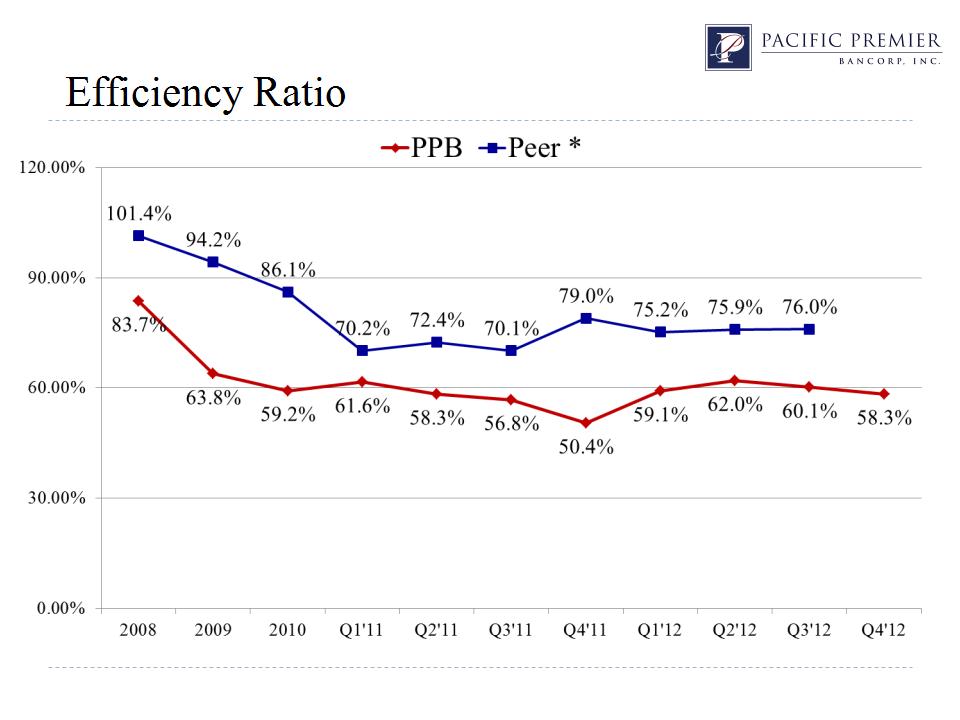
* California peer group consists of all insured California institutions, from SNL Financial.
13

High Performing Sales Culture Drives Organic Growth
o Business development team consists of early career sales executives with
real estate or financial services experience
real estate or financial services experience
o Each executive required to make 25 calls per day to develop sales pipeline
o Consistent calling effort identifies prospects
o Diligent monitoring and management of quantity and quality of lead
generation
generation
o Senior commercial bankers utilized to close new relationships
14
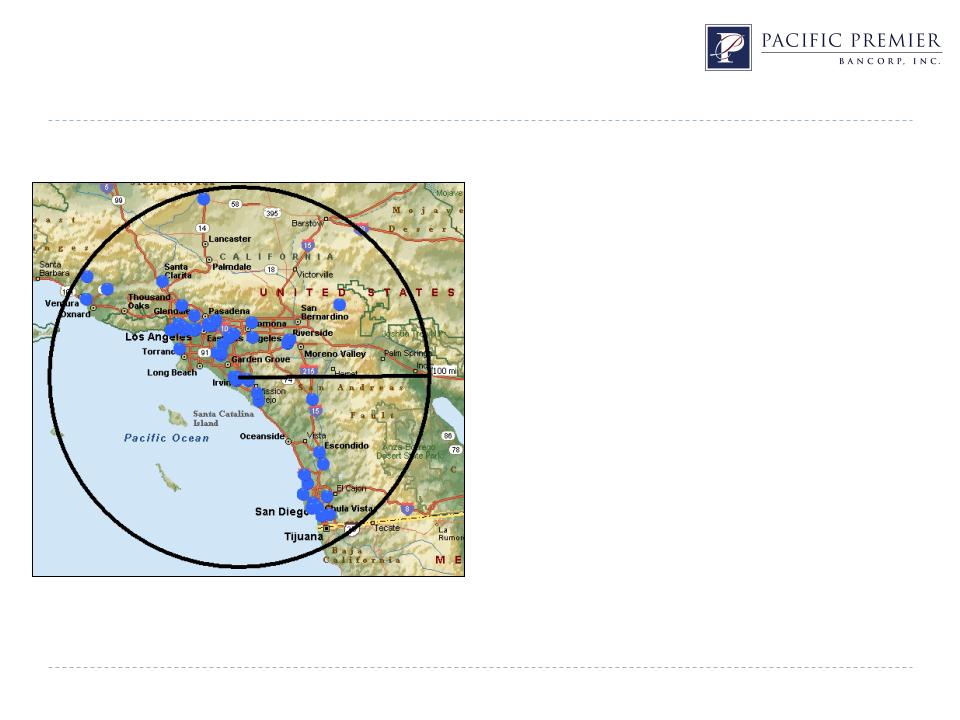
Potential M&A - Target Rich Environment
Southern California Institutions
Source: SNL Financial
|
Total assets …………………………………..
|
$ 15.3
|
|
Total deposits ………………….....................
|
$ 12.6
|
|
Total core deposits ……………....................
|
$ 11.0
|
|
Total loans …………………….....................
|
$ 10.6
|
|
Total branches ………………........................
|
204
|
(dollars in billions)
|
Potential Targets - $100 to $500 million
100 miles from Irvine, California
As of September 30, 2012
|
|
|
|
# of Institutions
|
|
$100 to $250 million
|
43
|
|
$250 to $500 million
|
22
|
15

Acquisition and Integration Strategy
General Acquisition Criteria
oWe look for strategic, financially compelling and culturally compatible
organizations
organizations
oDisciplined analysis, pricing and structuring of each transaction
oSeeking immediate accretion to EPS, minimum 15% IRR, maximum 10% dilution
to TBV, payback of 4 years or less
to TBV, payback of 4 years or less
Integration Strategy
oIdentify key players that fit into our culture and can add value
oImmediately meet with new customer base to begin cross-selling
oAggressive schedule for disposition of problem assets when needed
16

Conservative Credit Culture
o Overall Underwriting Approach:
o Global cash flow lender
o Loans:
o Business - full banking relationship
o CRE - no high risk product types or loan structures
o Personal guarantees, cross collateralized, cross guarantees
o Proactive Portfolio Management
o No TDRs
o No bulk loan sales
17
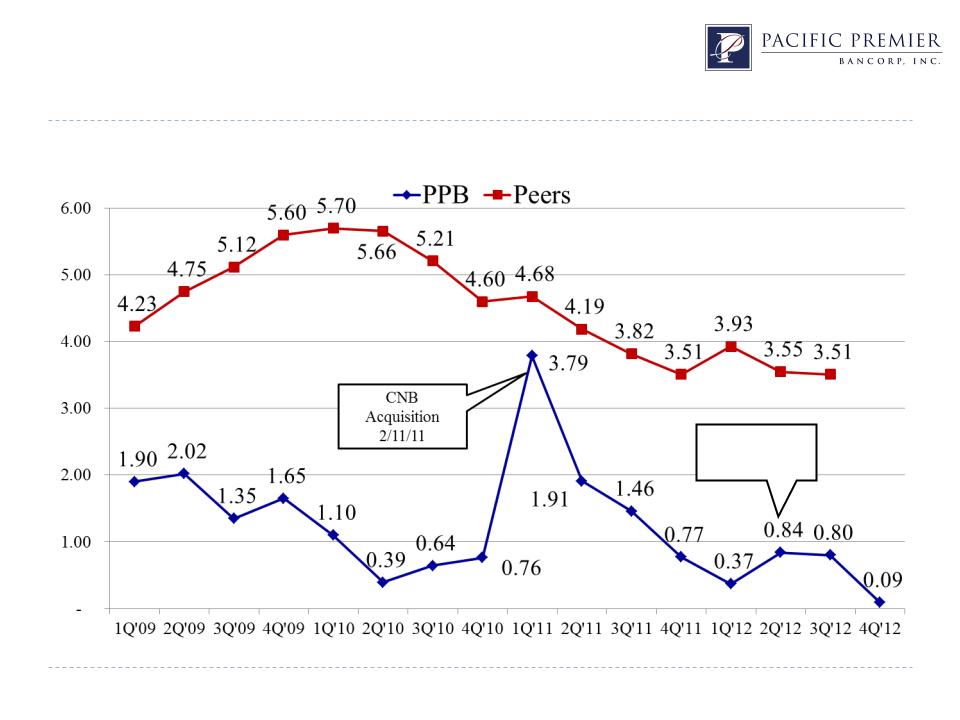
Excellent Loan Performance
Delinquency to Total Loans
PDNB
Acquisition
4/27/12
* California peer group consists of all insured California institutions, from SNL Financial.
18
Proactive Asset Management
Nonperforming Assets to Total Assets
* California peer group consists of all insured California institutions, from SNL Financial.
19

First Associations Bank Acquisition Overview
|
Strategic Rationale
|
o Valuable source of long-term low-cost core deposits - 0.23% COF(1)
o Improves deposit mix and enhances franchise value
o HOA Management deposit platform provides additional funding for loan growth
|
|
Attractive Valuation
|
o Price / tangible book value of 122.4%(1)(2)
o Core deposit premium of 3.36%(1)
o Price / earnings (last twelve months, tax adjusted)(1)(3) of 18.0x
|
|
Pro Forma Impact to PPBI
|
o Accretive to EPS beginning in 2013
o Tangible book value payback period approximately 2 years(2)(4)
|
|
Cost Savings
|
o Cost savings of approximately 10.0% (no personnel reduction)
o Cost savings are 75.0% phased in during 2013 and 100.0% phased in by 2014
|
|
Revenue Enhancements
|
o Readily available liquidity that can be redeployed into commercial banking business model.
Additional revenue enhancements from higher cost CD run-off |
(1) FAB balance sheet data as of 9/30/2012; PPBI market price data as of 2/4/2013
(2) Non-GAAP financial measure. Please see the Appendix to this investor presentation for GAAP reconciliation
(3) Adjusted for FAB’s S-Corporation status based on tax rate of 34.00%
(4) Incremental Tangible Book Value Payback represents the number of years to eliminate pro forma tangible book value dilution at closing utilizing incremental earnings created in the
merger including pro forma earnings from FAB and a pro forma tangible book value calculated on a combined basis for the merger, as further adjusted after giving effect to the sale of
3,795,000 newly issued shares of Pacific Premier common stock in its recent underwritten public offering
merger including pro forma earnings from FAB and a pro forma tangible book value calculated on a combined basis for the merger, as further adjusted after giving effect to the sale of
3,795,000 newly issued shares of Pacific Premier common stock in its recent underwritten public offering
20

Outlook
Numerous catalysts in place to drive increase in earnings and franchise value
oAdding relationship bankers to further take market share from competitors
oGrowing SBA loan production to generate higher non-interest income
oLiquidity from FAB acquisition and deposit platform will fund future loan growth
oExpanding commitments and new business relationships with mortgage bankers
oTarget rich environment for M&A
oProven management team with track record of extracting value from acquisitions
21

Steve Gardner
sgardner@ppbi.com
(949) 864 - 8000
www.ppbi.com
22

Appendix
23
Non-GAAP Financial Measures
Tangible common equity and tangible book value per share are non-GAAP financial measures derived from GAAP-based amounts. We calculate tangible common
equity by excluding the balance of intangible assets from common stockholders’ equity. We calculate tangible book value per share by dividing tangible common
equity by common shares outstanding, as compared to book value per common share, which we calculate by dividing common stockholders’ equity by common
shares outstanding. We believe that this is consistent with the treatment by bank regulatory agencies, which exclude intangible assets from the calculation of risk-
based capital ratios. Accordingly, we believe that these non-GAAP financial measures provide information that is important to investors and that is useful in
understanding our capital position and ratios. However, these non-GAAP financial measures are supplemental and are not a substitute for an analysis based on GAAP
measures. As other companies may use different calculations for these measures, this presentation may not be comparable to other similarly titled measures reported
by other companies. A reconciliation of the non-GAAP measures of tangible common equity and tangible book value per share to the GAAP measures of common
stockholder’s equity and book value per share is set forth.
|
|
PPBI
|
Pro Forma Combined with
FAB and Adjusted for the Offering |
|
|
12/31/12
|
9/30/12
|
|
Common Stockholders’ Equity
|
$134,517
|
$144,925
|
|
Less: Intangible Assets
|
$2,626
|
$7,839
|
|
Tangible Common Equity
|
$131,891
|
$137,086
|
|
Book Value per Share
|
$9.85
|
$9.40
|
|
Less: Intangible Assets per Share
|
$0.20
|
$0.51
|
|
Tangible Book Value per Share
|
$9.65
|
$8.89
|
|
Total Assets
|
$1,173,792
|
$1,444,697
|
|
Less: Intangible Assets
|
$2,626
|
$7,839
|
|
Tangible Assets
|
$1,171,166
|
$1,436,858
|
|
Tangible Common Equity Ratio
|
11.26%
|
9.54%
|
Note: Dollars in thousands except per share
24