Attached files
| file | filename |
|---|---|
| EX-99.1 - EXHIBIT 99.1 - NEW JERSEY RESOURCES CORP | d481626dex991.htm |
| 8-K - FORM 8-K - NEW JERSEY RESOURCES CORP | d481626d8k.htm |
 New York Financial Community Meeting
February 7, 2013
Exhibit 99.2 |
 2
Regarding Forward-Looking Statements
2
Certain
statements
contained
in
this
presentation
are
forward-looking
statements
within
the
meaning
of
the
Private
Securities
Litigation
Reform
Act
of
1995.
Forward-looking
statements
can
also
be
identified
by
the
use
of
forward-looking
terminology
such
as
“may,”
"will,"
“intend,”
“expect,”
"believe,"
or
“continue”
or
comparable
terminology
and
are
made
based
upon
management’s
current
expectations
and
beliefs
as
of
this
date
concerning
future
developments
and
their
potential
effect
upon
New
Jersey
Resources
(NJR
or
the
Company).
There
can
be
no
assurance
that
future
developments
will
be
in
accordance
with
management’s
expectations
or
that
the
effect
of
future
developments
on
the
Company
will
be
those
anticipated
by
management.
NJR
cautions
persons
reading
or
hearing
this
presentation
that
the
assumptions
that
form
the
basis
for
forward-looking
statements
regarding
expected
contribution
by
new
customers
of
New
Jersey
Natural
Gas
Company
(NJNG)
to
utility
gross
margin,
expected
number
of
new
customers
of
NJNG,
the
completion
of
NJRCEV's
planned
solar
projects
in
fiscal
2013,
NJR’s
effective
tax
rate,
estimated
capital
expenditures
in
fiscal
2013,
by
NJNG
and
NJRCEV,
fiscal
2013
cash
flow
forecast,
expected
dividend
payout
ratio,
and
the
potential
impact
of
post-tropical
cyclone
Sandy,
(commonly
referred
to
as
“Superstorm”
Sandy)
The
factors
that
could
cause
actual
results
to
differ
materially
from
NJR’s
expectations
include,
but
are
not
limited
to,
weather
and
economic
conditions;
demographic
changes
in
the
NJNG
service
territory
and
their
effect
on
NJNG's
customer
growth;
volatility
of
natural
gas
and
other
commodity
prices
and
their
impact
on
NJNG
customer
usage,
NJNG's
Basic
Gas
Supply
Service
incentive
programs,
NJRES'
operations
and
on
the
Company's
risk
management
efforts;
changes
in
rating
agency
requirements
and/or
credit
ratings
and
their
effect
on
availability
and
cost
of
capital
to
the
Company;
the
impact
of
volatility
in
the
credit
markets;
the
ability
to
comply
with
debt
covenants;
the
impact
to
the
asset
values
and
resulting
higher
costs
and
funding
obligations
of
NJR's
pension
and
postemployment
benefit
plans
as
a
result
of
downturns
in
the
financial
markets,
a
lower
discount
rate,
and
impacts
associated
with
the
Patient
Protection
and
Affordable
Care
Act;
accounting
effects
and
other
risks
associated
with
hedging
activities
and
use
of
derivatives
contracts;
commercial
and
wholesale
credit
risks,
including
the
availability
of
creditworthy
customers
and
counterparties
and
liquidity
in
the
wholesale
energy
trading
market;
the
ability
to
obtain
governmental
approvals
and/or
financing
for
the
construction,
development
and
operation
of
certain
non-regulated
energy
investments;
risks
associated
with
the
management
of
the
Company's
joint
ventures
and
partnerships;
risks
associated
with
our
investments
in
renewable
energy
projects
and
our
investment
in
an
on-shore
wind
developer,
including
the
availability
of
regulatory
and
tax
incentives,
logistical
risks
and
potential
delays
related
to
construction,
permitting,
regulatory
approvals
and
electric
grid
interconnection,
the
availability
of
viable
projects
and
NJR's
eligibility
for
federal
investment
tax
credits
(ITC),
the
future
market
for
Solar
Renewable
Energy
Certificates
and
operational
risks
related
to
projects
in
service;
timing
of
qualifying
for
ITCs
due
to
delays
or
failures
to
complete
planned
solar
energy
projects
and
the
resulting
effect
on
our
effective
tax
rate
and
earnings;
the
level
and
rate
at
which
NJNG's
costs
and
expenses
(including
those
related
to
restoration
efforts
resulting
from
Superstorm
Sandy)
are
incurred
and
the
extent
to
which
they
are
allowed
to
be
recovered
from
customers
through
the
regulatory
process;
access
to
adequate
supplies
of
natural
gas
and
dependence
on
third-party
storage
and
transportation
facilities
for
natural
gas
supply;
operating
risks
incidental
to
handling,
storing,
transporting
and
providing
customers
with
natural
gas;
risks
related
to
our
employee
workforce,
including
a
work
stoppage;
the
regulatory
and
pricing
policies
of
federal
and
state
regulatory
agencies;
the
possible
expiration
of
the
NJNG
Conservation
Incentive
Program
(CIP),
the
costs
of
compliance
with
the
proposed
regulatory
framework
for
over-the-counter
derivatives;
the
costs
of
compliance
with
present
and
future
environmental
laws,
including
potential
climate
change-related
legislation;
risks
related
to
changes
in
accounting
standards;
the
disallowance
of
recovery
of
environmental-related
expenditures
and
other
regulatory
changes;
environmental-related
and
other
litigation
and
other
uncertainties;
and
the
impact
of
natural
disasters,
terrorist
activities,
and
other
extreme
events
on
our
operations
and
customers,
including
any
impacts
to
utility
gross
margin,
and
restoration
costs
resulting
from
Superstorm
Sandy.
The
aforementioned
factors
are
detailed
in
the
“Risk
Factors”
sections
of
our
Annual
Report
on
Form
10-K
filed
on
November
28,
2012,
as
filed
with
the
Securities
and
Exchange
Commission
(SEC)
and
which
is
available
on
the
SEC’s
website
at
sec.gov.
NJR
disclaims
any
obligation
to
update
and
revise
statements
contained
in
these
materials
based
on
new
information
or
otherwise. |
 Disclaimer Regarding
Non-GAAP Financial Measures
This
presentation
includes
the
non-GAAP
measures
net
financial
earnings
(losses),
financial
margin
and
utility
gross
margin.
As
an
indicator
of
the
Company’s
operating
performance,
these
measures
should
not
be
considered
an
alternative
to,
or
more
meaningful
than,
GAAP
measures
such
as
cash
flow,
net
income,
operating
income
or
earnings
per
share.
Net
financial
earnings
(losses)
and
financial
margin
exclude
unrealized
gains
or
losses
on
derivative
instruments
related
to
the
Company’s
unregulated
subsidiaries
and
certain
realized
gains
and
losses
on
derivative
instruments
related
to
natural
gas
that
has
been
placed
into
storage
at
NJRES.
Volatility
associated
with
the
change
in
value
of
these
financial
and
physical
commodity
contracts
is
reported
in
the
income
statement
in
the
current
period.
In
order
to
manage
its
business,
NJR
views
its
results
without
the
impacts
of
the
unrealized
gains
and
losses,
and
certain
realized
gains
and
losses,
caused
by
changes
in
value
of
these
financial
instruments
and
physical
commodity
contracts
prior
to
the
completion
of
the
planned
transaction
because
it
shows
changes
in
value
currently
as
opposed
to
when
the
planned
transaction
ultimately
is
settled.
NJNG’s
utility
gross
margin
represents
the
results
of
revenues
less
natural
gas
costs,
sales
and
other
taxes
and
regulatory
rider
expenses,
which
are
key
components
of
the
Company’s
operations
that
move
in
relation
to
each
other.
Management
uses
net
financial
earnings
(NFE),
financial
margin
and
utility
gross
margin
as
supplemental
measures
to
other
GAAP
results
to
provide
a
more
complete
understanding
of
the
Company’s
performance.
Management
believes
these
non-GAAP
measures
are
more
reflective
of
the
Company’s
business
model,
provide
transparency
to
investors
and
enable
period-to-period
comparability
of
financial
performance.
For
a
full
discussion
of
our
non-GAAP
financial
measures,
please
see
Item
7
of
our
Annual
Report
on
Form
10-K
for
the
fiscal
year
ended
September
30,
2012,
filed
on
November
28,
2012.
3
3 |
 The
NJR Story 21 consecutive years of Net Financial Earnings (NFE) growth
17 consecutive years of dividend growth
Low payout ratio compared to peer group
Strong financial profile and liquidity –
senior secured rating of A+ (S&P) and
Aa3 (Moody’s)
10-year average annual total return to shareowners of 10.1 percent
Return on Equity* in excess of 13.5 percent in each of the last eight years
4
* Based on net financial earnings |
 Financial Goals
Long-Term NFE growth of 4 to 6 percent
Earnings from NJNG of 60 to 70 percent
Annual dividend growth of 5 percent
Maintain a payout ratio at or lower than peer average
Maintain a strong financial profile with a minimum equity ratio of 50 percent
5 |
 Impact lower than original post-storm estimates
Total storm-related capital expenditures currently estimated at $30 to
$40 million over the next three years
Capital will be treated as rate base additions
Total incremental O&M costs are currently estimated at $15 to $20 million
Costs deferred for recovery in the next base rate case
No direct impact expected on fiscal 2013 earnings
6
Recovery of both capital and O&M will be sought in a future base
rate
case to be filed before November 2015
Superstorm Sandy –
Impact |
 Benefits of Lower Natural Gas Prices
New Jersey Natural Gas (NJNG):
•
Lower
customer
bills
–
no
impact
on
margin
•
Lower bad debt
•
Lower working capital requirements
•
Supports customer growth
•
Higher customer satisfaction
•
Supports NJ’s Energy Master Plan
NJR Energy Services (NJRES):
•
Lower working capital requirements
•
Higher demand for natural gas-fired electric generation
•
Lower counterparty exposure on natural gas sales
7 |
  First
Quarter NFE 8
($MM)
Company
Q1 2013
Q1 2012
Change
New Jersey Natural Gas
$25.5
$26.0
$(.5)
NJR Energy Services
3.0
7.6
(4.6)
NJR Clean Energy
5.3
10.1
(4.8)
NJR Energy Holdings
1.8
1.8
-
NJR Home Services/Other
(.1)
(.2)
.1
Total
$35.5
$45.3
$(9.8)
Per basic share
$.85
$1.09
$(.24)
Net financial earnings over the balance of the fiscal year expected to exceed
fiscal 2012
* Source: Bloomberg |
 9
Strong results from NJNG
•
Annual customer growth estimate increased
•
Accelerated infrastructure opportunities
•
Results over the balance of the year expected to increase over fiscal 2012
Continued progress on clean energy and retail energy strategies
•
Solar Renewable Energy Certificates (SREC) pricing improving
•
Effective tax rate expected to decline with additional project approvals
•
NJR Home Services reflect improved installation market
Positive net financial earnings contributions from wholesale energy services and
midstream •
Full year NFE results expected to be higher than fiscal 2012
Fiscal 2013 Outlook |
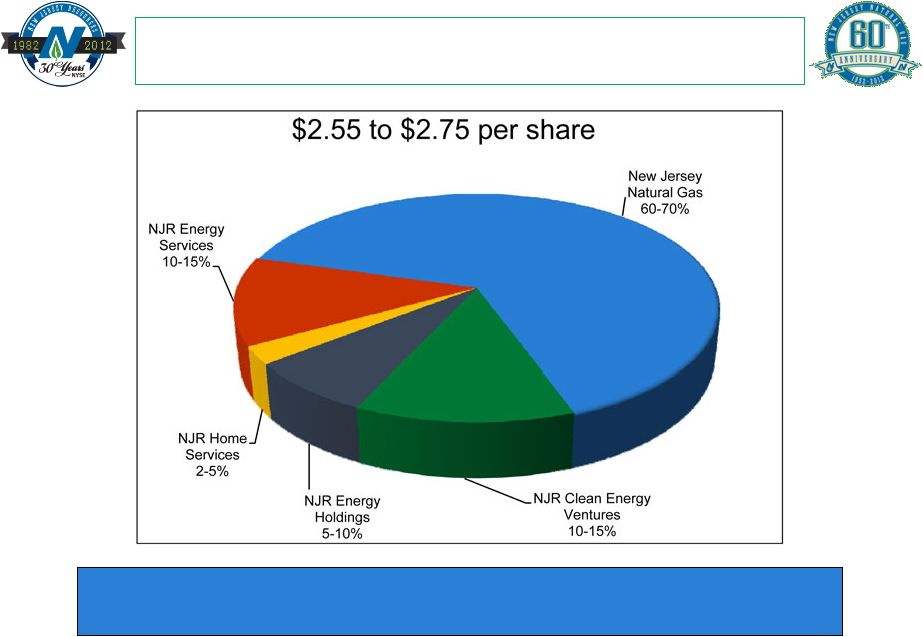 10
Infrastructure-based businesses expected to contribute about
90 percent of fiscal 2013 NFE
Fiscal 2013 Earnings Guidance |
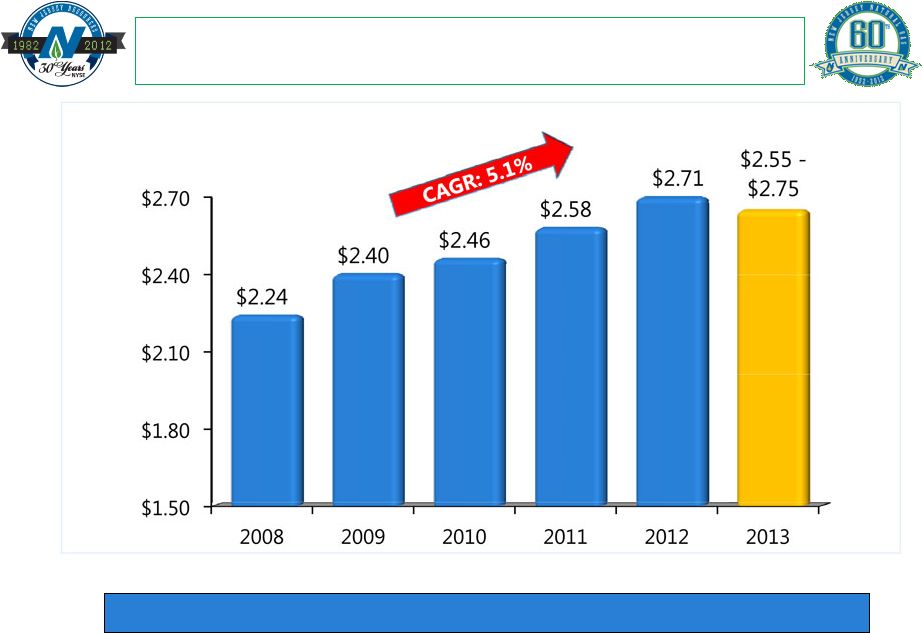 Solid financial performance expected in fiscal 2013
11
Net Financial Earnings |
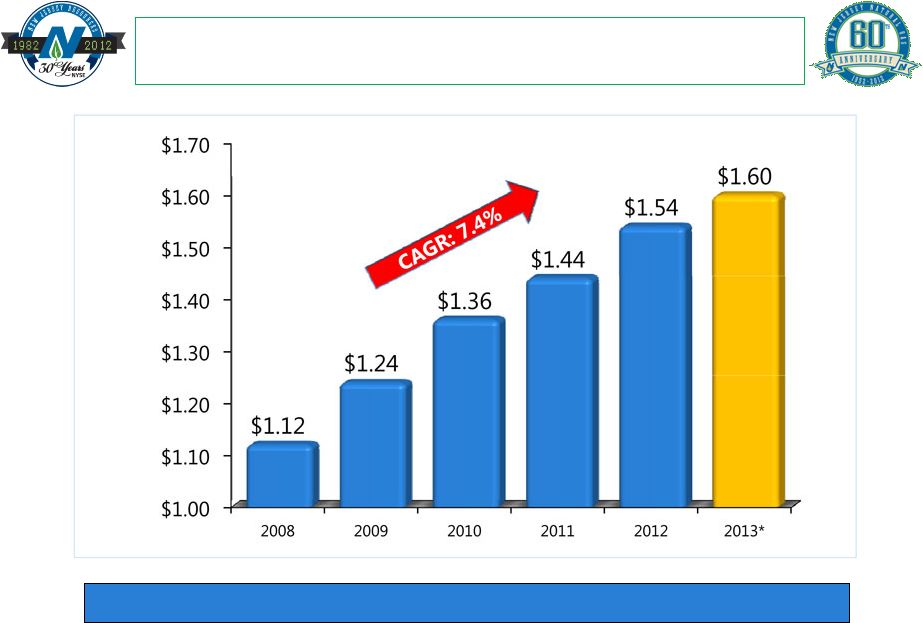 12
19 dividend increases in 17 years
* Current annual rate
Growing Dividends |
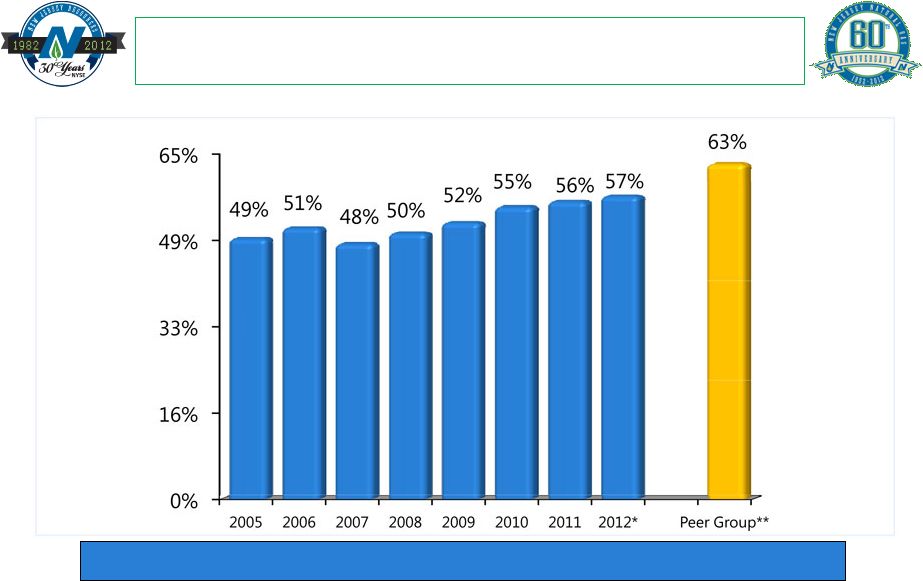 13
* Based on NJR Net Financial Earnings
** Peer group average based on 2012 earnings estimates and indicated
dividend from Bloomberg. Peer group: ATO, GAS, LG, NWN, PNY,
SJI, SWX, VVC and WGL Goal of 60 to 65 percent payout ratio
Payout Ratio |
 Natural Gas
Distribution
•
Strong customer growth
•
Infrastructure investments
•
Regulatory incentives
Clean
Energy
•
Residential and commercial solar programs
•
Onshore wind
•
Combined heat and power
Retail
Energy
Services
•
Service contracts
•
Installation of heating, cooling and natural gas generators
•
Repair services
14
Our Business Model
•
Producer services
•
Storage and asset management
•
Midstream investments
Wholesale
Energy
Services |
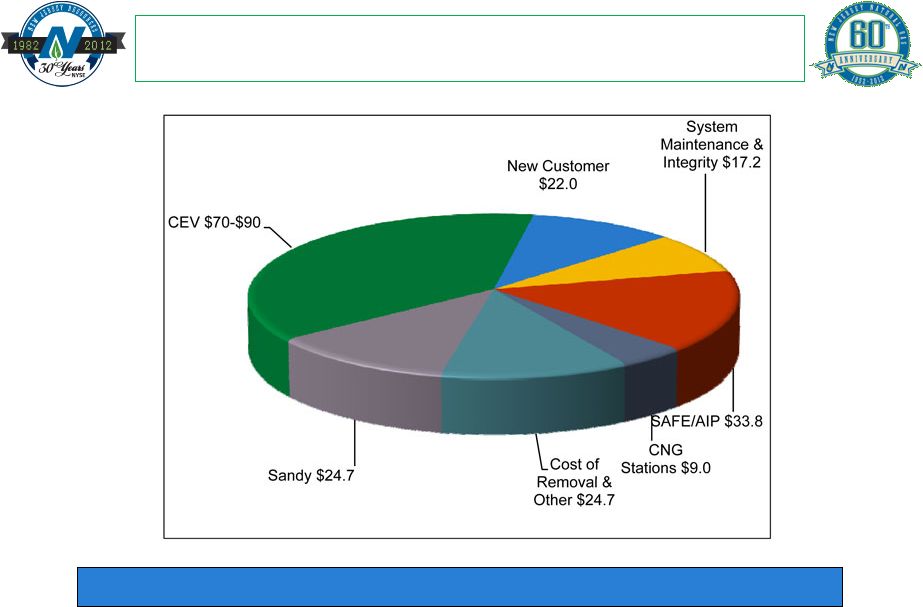 Capital Budget Fiscal 2013: $211Million
15
Strong capital investment to support future earnings growth
|
 ($ millions)
September 30,
2013
Cash flow from operations
$243.4
Capital expenditures:
Utility plant
(48.2)
AIP/SAFE
(33.8)
Sandy
(24.7)
Cost of removal
(24.7)
CEV
(80.0)
Total capital expenditures
(211.4)
Financing activities
Common stock issued
7.5
Dividends
(66.6)
Debt proceeds, net
27.1
Total financing activities
(32.0)
Fiscal 2013 Cash Flow Forecast
16 |
 Growing customer base –
primarily
residential and commercial
Net plant, property and equipment of
nearly $1.2 billion
Collaborative regulatory relations
High customer satisfaction
17
NJNG provides majority of earnings
Our Core Distribution Business |
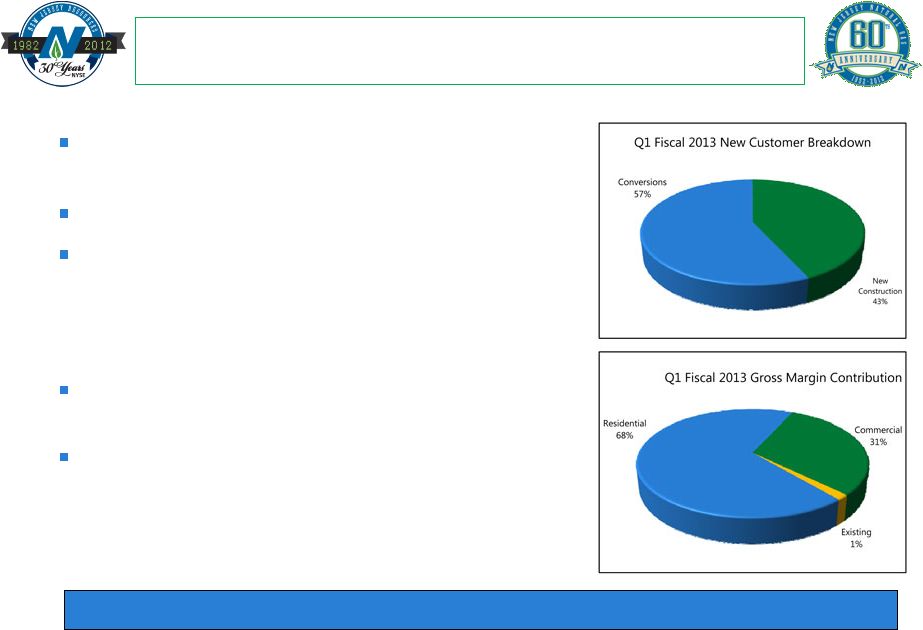 1,959 new customers in added in Q1 fiscal
2013
62 existing customer heat conversions
Solid conversion market:
•
65 percent oil
•
23 percent electric
•
12 percent propane
Customer growth expected to add $3.5 million
of gross margin annually
Increasing customer growth estimates to
12,500 to 14,500 new customers over the
next fiscal two years
18
Demographics and customer service support future customer growth
Strong Customer Growth |
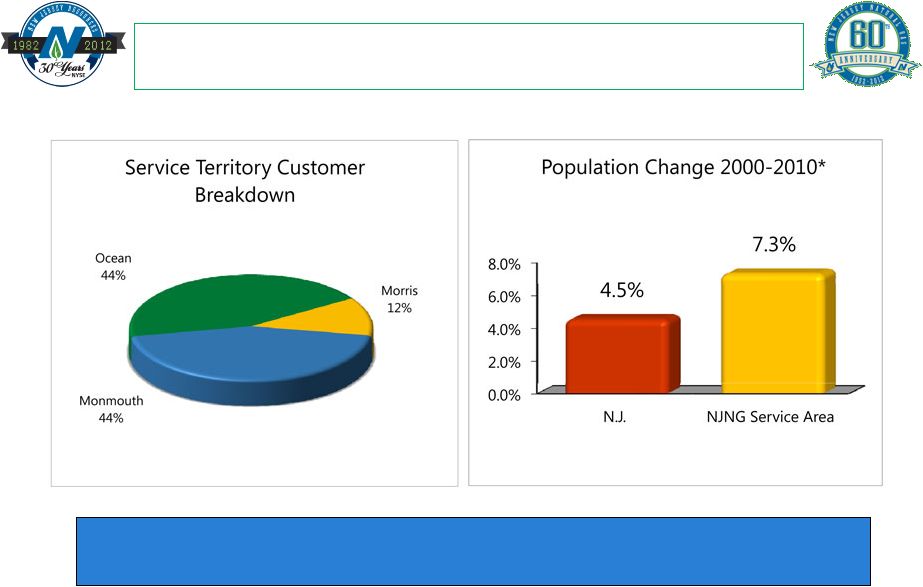 A
Growing Service Area 19
Our service territory is among the fastest growing in the state with
Ocean County accounting for half our growth
* Source: US Census data |
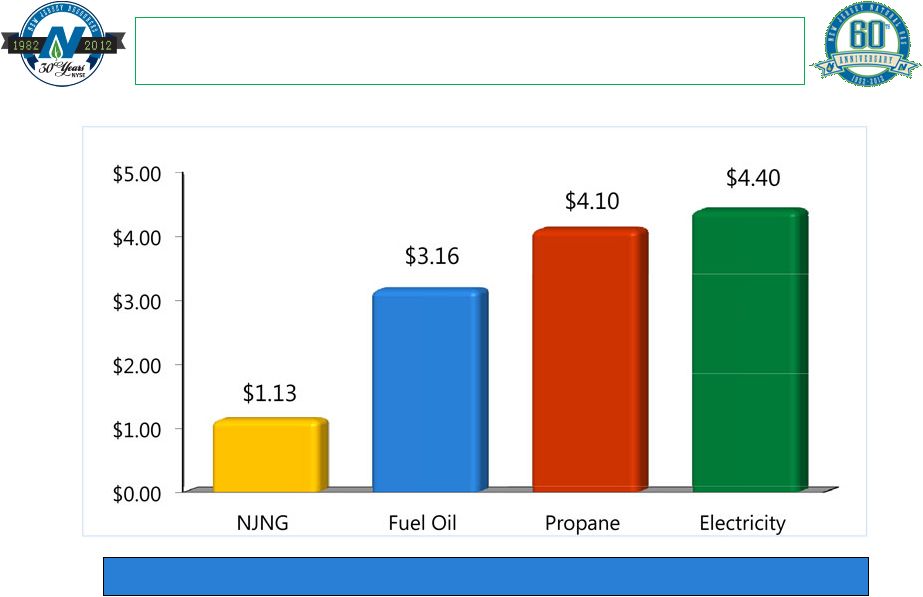 Source: US Energy Information Administration
Data as of December 2012. Based on 100,000 comparable BTUs
20
NJNG enjoys a distinct price advantage in its service area
Value for Customers |
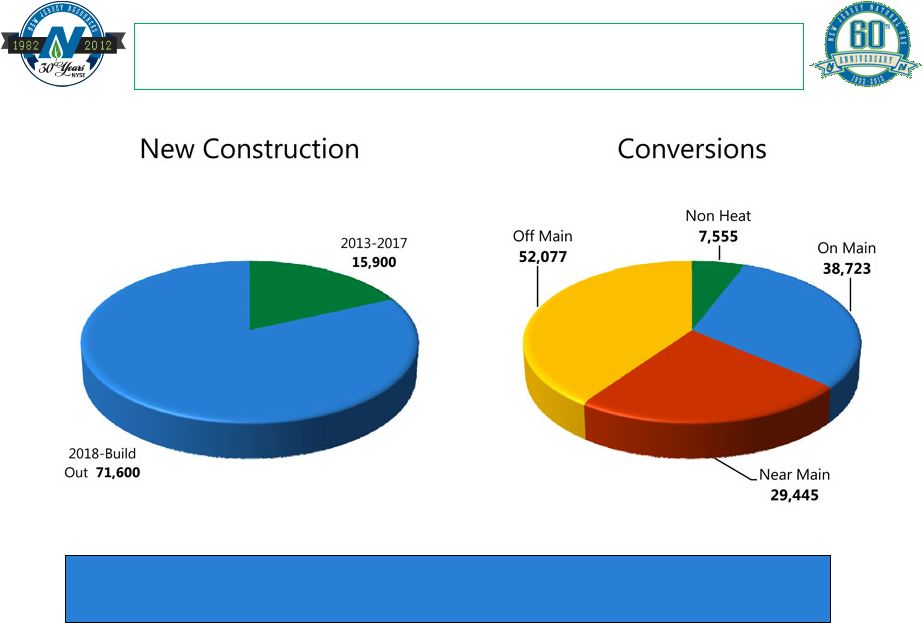 Future Potential Customer Growth
21
With our new construction and conversion outlook,
we see a total potential of over 204,000 new customers
|
 In
place through September 30, 2013 Protects
NJNG
from
declining
usage
and
weather;
encourages
customer
conservation
Customers have reduced usage and saved
over $248 million since inception in 2006
Accelerated Infrastructure Programs
Constructive regulatory environment and support of public policy
objectives create growth opportunities for NJNG
Regulatory Collaboration
22
Programs began in 2009
Accelerated capital projects support
system reliability and help strengthen the
state’s economy
Current return on investment including a
10.3 percent return on equity
$131 million invested in 23 projects
through October 2013
Conservation Incentive Program |
 Approved by the BPU on October 23, 2012
4-year program includes $130 million of investment
Replace approximately 276 miles of unprotected steel and cast iron distribution
main Cost recovery at a weighted average cost of capital of 6.9 percent
Should create approximately 1,325 jobs*
23
* According to a formula set forth in a study by the Rutgers Bloutstein
School of Planning and Public Policy NJNG must file a base rate case no
later than November 2015 Regulatory Collaboration
Safety Acceleration and Facility Enhancement (SAFE) Program
|
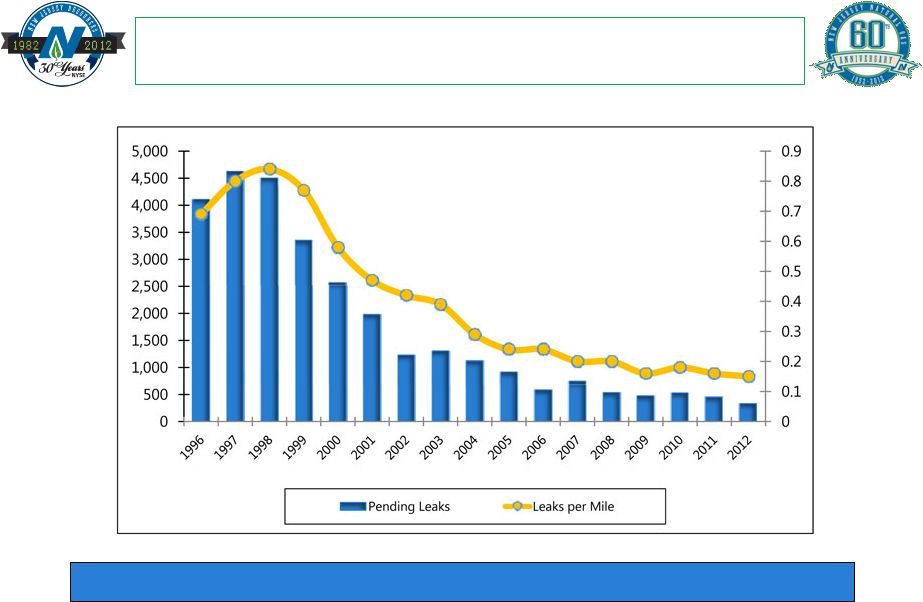 Infrastructure investment improves system performance
System Reliability
24 |
 Current BPU Filings
25
The SAVEGREEN Project®
Through
December
31
2012,
a
total
of
$31.2
million
in
incentives
and
rebates
have
been
provided
through SAVEGREEN programs
Over 1,375 contractors have participated in The SAVEGREEN Project and the program
has resulted in approximately $144 million in economic activity for New
Jersey Existing incentives and rebates extended through June 30, 2013
•
BPU continues to review NJNG’s current SAVEGREEN filing
Filed with the BPU on November 19, 2012
Seeking deferred accounting treatment for uninsured storm-related O&M
costs Precedent in state
•
Atlantic City Electric/PSE&G
Allows NJNG to accumulate costs on its Balance Sheet for recovery in the next base
rate case Deferred Accounting Treatment for Superstorm Sandy Incremental
Operational and Maintenance (O&M) costs |
 Approved on June 18, 2012
Investment of up to $10 million on CNG infrastructure
NJNG will install, own and maintain the CNG infrastructure
Designed to grow the market for clean, affordable and energy-efficient
natural gas vehicles
Have received interest from delivery fleets, waste haulers and
municipalities
26
Supports New Jersey’s Energy Master Plan
Our NGV Advantage: Fueling the Future |
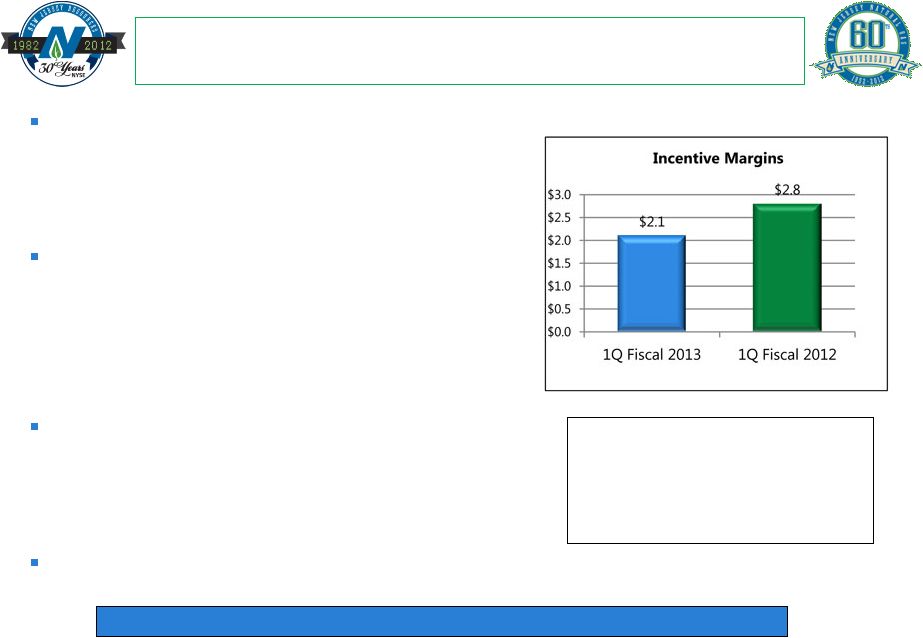 Off-system sales and capacity release
•
Optimization of capacity and supply contracts
•
Sharing formula of 85 percent customers;
15 percent shareowners
Storage Incentive
•
Promotes long-term price stability
•
Promotes efficient contract utilization
•
Sharing formula of 80 percent customers;
20 percent shareowners
Financial Risk Management
•
Promotes application of risk management tools
•
Sharing formula of 85 percent customers;
15 percent shareowners
Customers have saved over $600 million since inception
27
Incentive programs in place through October 2015
Total earnings of
$1.93 per share;
an average of
$.09 annually
BGSS Incentives |
 Total commercial and residential programs through December 31, 2012:
•
45.5 MW of installed capacity
•
Approximately 50,000 SRECs generated annually
Competitively priced electricity for customers
Strong legislative commitment to solar in New Jersey
Meaningful earnings growth opportunities
Expected to contribute 10-15 percent to fiscal 2013 NFE
28
Enhancing shareowner value while saving customers money
NJR Clean Energy Ventures |
 Improving SREC Prices
Tax credits, federal grants, bonus depreciation and high SREC prices resulted
in an overbuilt market
•
Put downward pressure on SREC prices
New state legislation
•
Signed in July 2012 to bring long-term stability to New Jersey’s solar
industry •
Increases RPS starting in June 2013
•
Mandates BPU approval process for grid-connected projects
•
Extends SREC life to five years
New Jersey solar construction has slowed
SREC prices have improved
•
October
1,
2012
–
energy
year
2013
bid
at
$70*
•
February
4,
2013
–
energy
year
2013
bid
at
125*
29
SREC values have increased over 75 percent during fiscal 2013
*Bid prices reported by Karbone Renewables Research
|
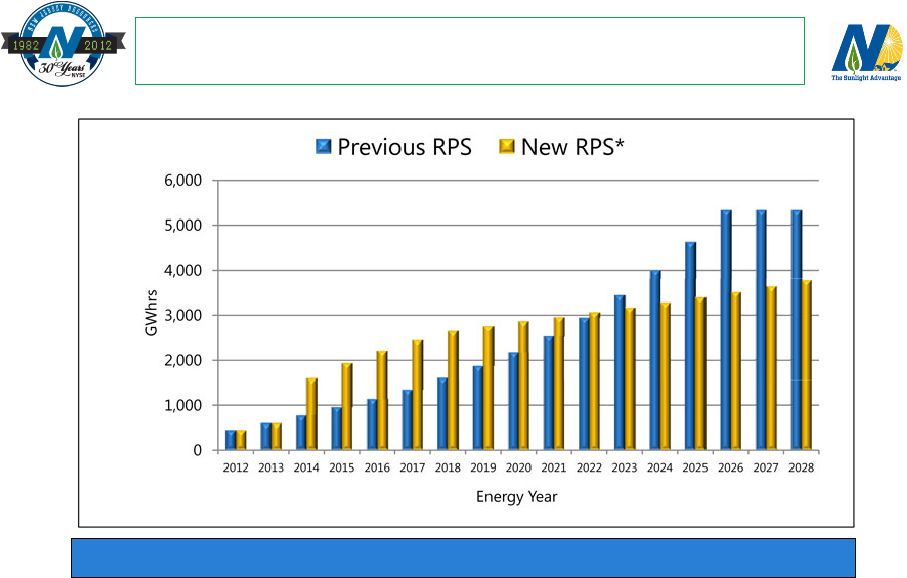 *New RPS utilizes retail electricity sales forecast provided by
Rutgers
Bloustein
School
-
Center
for
Energy,
Economic
and
Environmental Policy (R/ECON, spring 2012)
Supporting a sustainable solar industry in New Jersey
30
New Jersey’s Clean Energy Commitment |
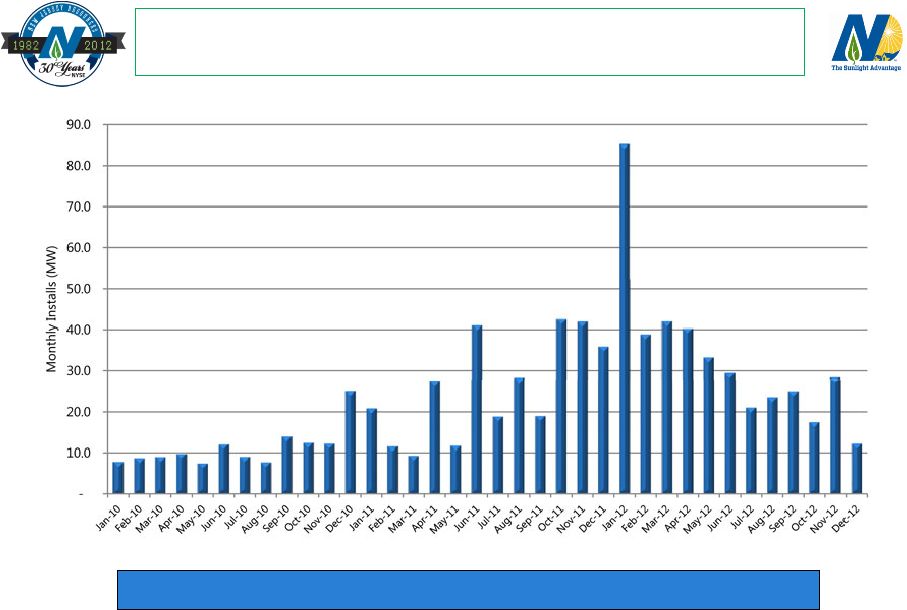 New Jersey Monthly Installations
31
Construction activity has slowed; increasing SREC prices
Source: Karbone Renewables Research |
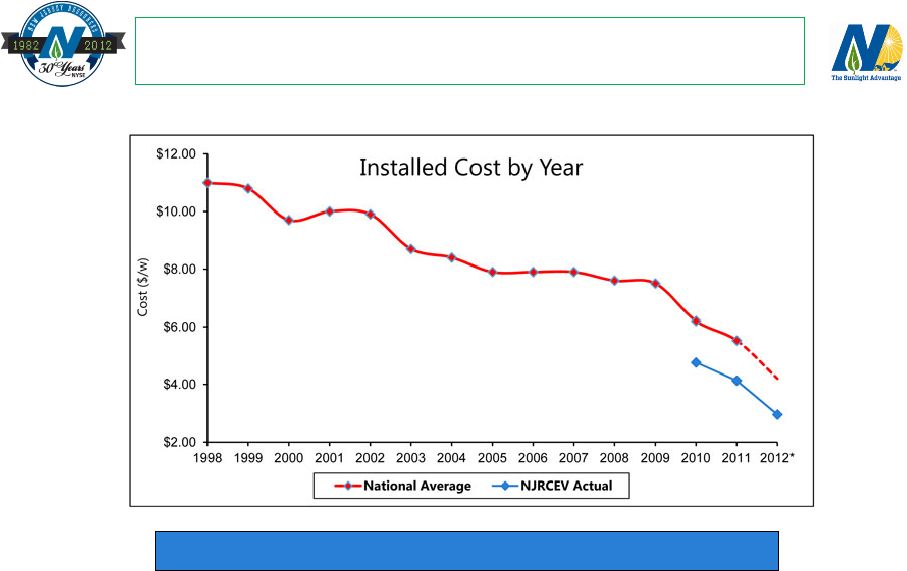 Source: Lawrence Berkeley National Laboratory (Behind the meter
weighted average installed cost) * Analyst estimate for
2012 Making solar more competitive
32
Declining Solar Costs |
 Residential Program
Fiscal 2013 results:
•
103 homes added
•
Average size: 8 kilowatts
•
$2.8 million of capital deployed
About 1,300 customers added
since inception
Partnering with contractors to
support local business
Residential customer electric bills lowered by over $630,000
33
The Sunlight Advantage
® |
 Commercial Program
Fiscal 2013 projects:
•
Medford
Ground-mounted system
$20 million; 6.7 MW project
In service as of October 15, 2012
•
Wakefern
Rooftop system
$6.9 million; 2.4 MW project
In service as of December 31, 2012
Medford Township Wastewater
Ground-mounted system
$4.7 million; 1.5 MW project
Expected completion Q3, fiscal 2013
Expect to commit $70 to $90 million in capital annually
34
Approximately $130 million in commercial project pipeline
The Sunlight Advantage
® |
 $8.8 million investment to acquire approximately
18 percent equity interest
OwnEnergy manages onshore wind project
development process
CEV receives “shovel ready”
investment
opportunities for consideration
Reduce reliance on SRECs and investment tax
credits
Production tax credit extension supports industry
growth
35
Diversifies CEV’s renewable energy portfolio
Investing in Onshore Wind |
 Contributed $3.0 million to NFE in Q1 fiscal 2013
Focusing on long-option strategy and disciplined risk management
•
Limits downside
•
Transactions have upside potential
36
NFE forecast for balance of fiscal year expected to exceed fiscal 2012
NJR Energy Services
Providing customized energy solutions for customers
•
Producers, utilities, power generators, pipelines and industrials
•
Holds 1.3 Bcf/day of firm transportation and over 35 Bcf of storage
diversified throughout the U.S. and Canada
Over 30 percent of gross margin is derived from fee-based transactions;
does not rely on price volatility
Expected
to
contribute
10-15
percent
to
fiscal
2013
NFE |
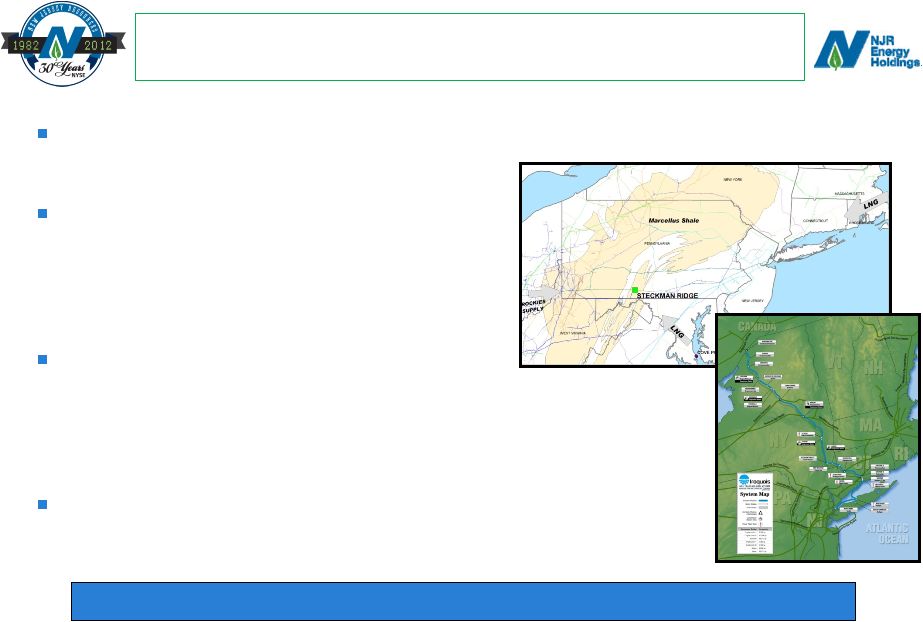 Contributed $1.8 million to NFE in Q1 fiscal 2013
Steckman Ridge
•
50 percent joint venture with
Spectra Energy
Iroquois
•
5.53 percent ownership in pipeline
from Canada to the northeast
Expected to contribute 5-10 percent to fiscal 2013 NFE
37
Contract services provide steady margins
NJR Energy Holdings |
 Serves approximately 128,000 customers
Expanded services now offered
•
Whole house electric and plumbing contracts
•
Standby generator contracts
•
Air conditioning
•
Generators sales and installation
Pursuing geographic expansion
•
Currently marketing in Sussex, Warren and
Hunterdon counties
Expected to contribute 2-5 percent to fiscal 2013 NFE
38
Home energy solutions for customer comfort
NJR Home Services |
 Summary
Solid earnings performance expected in fiscal 2013
Increasing dividend while maintaining strong financial profile
Core utility continues to provide majority of earnings
•
Strong
customer
growth
of
1.3
–
1.4
percent
•
Infrastructure investment opportunities
•
Regulatory incentives
Storm-related incremental capital and O&M costs recoverable in a future
base rate case CEV spending consistent with tax appetite
•
$70-$90 million annually
•
SREC market improving
Positive contributions expected from NJRES, NJR Energy Holdings
and
NJR Home Services
39
Fundamentals remain in place to achieve continued
consistent performance and long-term growth
|
 New York Financial Community Meeting
February 7, 2013 |