Attached files
| file | filename |
|---|---|
| 8-K - FORM 8-K - GULFMARK OFFSHORE INC | d484801d8k.htm |
 GulfMark Offshore, Inc
2013 Credit Suisse Energy Summit
2013 Credit Suisse Energy Summit
Exhibit 99.1 |
 Forward Looking Statements
2
NYSE:
GLF
www.GulfMark.com Cautionary Statement Regarding
Forward-Looking Statements
Certain statements and information in this presentation may constitute “forward-looking statements” within the meaning of the
Private Securities Litigation Reform Act of 1995. The words “believe,” “expect,”
“anticipate,” “plan,” “intend,” “foresee,” “should,” “would,”
“could” or other similar expressions are intended to identify forward-looking
statements, which are generally not historical in nature. These forward-looking statements
are based on our current expectations and beliefs concerning future developments and their potential effect on
us. While management believes that these forward-looking statements are reasonable as and when
made, there can be no assurance that future developments affecting us will be those that we
anticipate. All comments concerning our expectations for future revenues are based on our
forecasts for our existing operations. Our forward-looking statements involve significant risks and uncertainties (some of which are
beyond our control) and assumptions that could cause actual results to differ materially from our
historical experience and our present expectations or projections. Among the important factors
that could cause actual results to differ materially from those in the forward- looking
statements include, but are not limited to: the price of oil and gas and its effect on offshore drilling, vessel utilization and day rates;
industry volatility; fluctuations in the size of the offshore marine vessel fleet in areas where the
Company operates; changes in competitive factors; delays or cost overruns on construction
projects, and other material factors that are described from time to time in the Company’s
filings with the SEC, including the registration statement and the Company’s Annual Report on
Form 10-K for the year ended December 31, 2011, Quarterly Reports on Form 10-Q and
Current Reports on Form 8-K. Consequently, the forward-looking statements contained herein
should not be regarded as representations that the projected outcomes can or will be achieved. These
forward-looking statements speak only as of the date hereof. We undertake no obligation to
publicly update or revise any forward-looking statements after the date they are made,
whether as a result of new information, future events or otherwise.
|
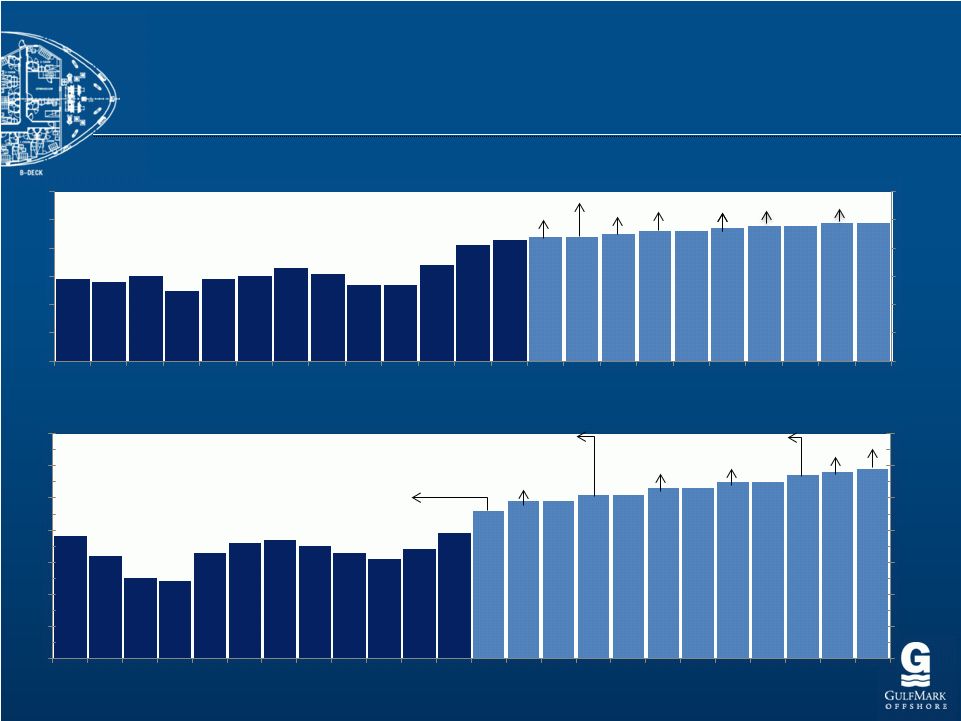
 Long Term Revenue & EBITDA
(in millions of dollars)
(in millions of dollars)
3
* Note: Adjusted for Special Items, See Supporting Information at the end of this
Presentation $0
$100
$200
$300
$400
$500
$600
$700
$0
$100
$200
$300
$400
$500
$600
$700
2000
2001
2002
2003
2004
2005
2006
2007
2008
2009
2010
2011
2012 TTM
Revenue
EBITDA* |
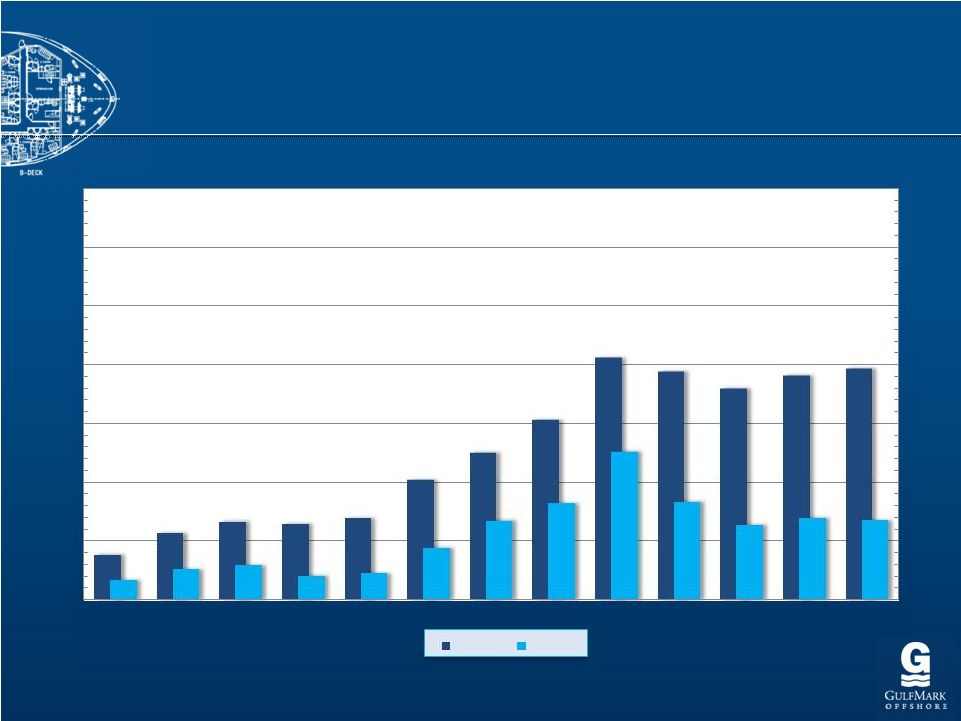
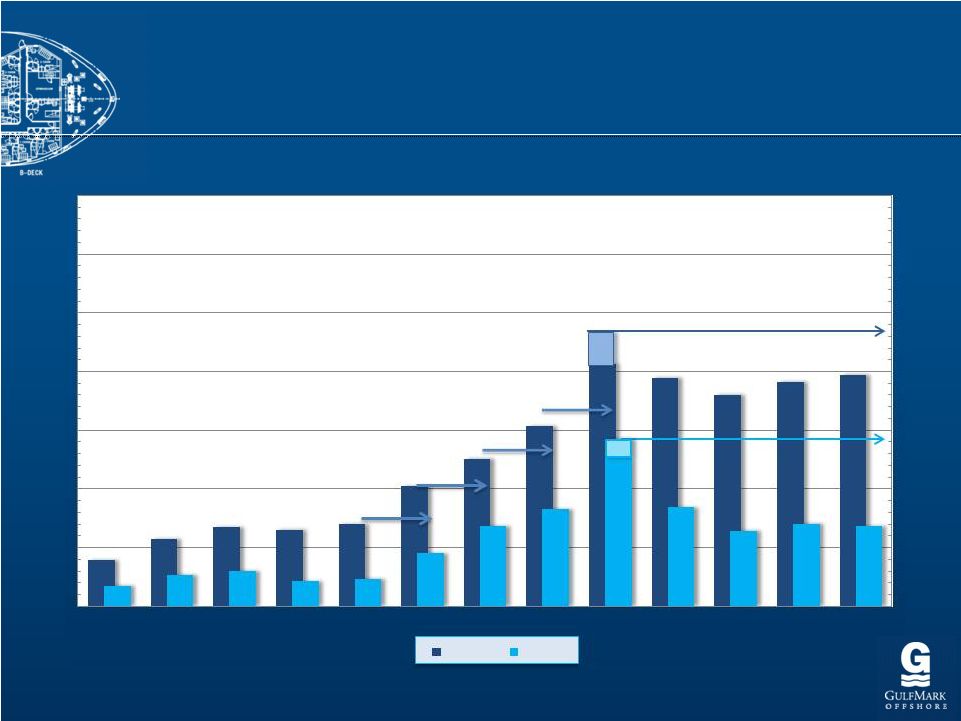 Pro
Forma Prior Peak Revenue & EBITDA Pro Forma Prior Peak Revenue &
EBITDA (in millions of dollars)
(in millions of dollars)
4
* Note: Adjusted for Special Items, See Supporting Information at the end of this
Presentation •
Pro Forma for July 1, 2008 Acquisition
•
Prior Up-Cycle Incremental EBITDA Margins Average 72%
•
Substantial Fleet Upgrades Since 2008
•
11 New Vessels Beginning in 2013
68%
100%
53%
71%
$0
$100
$200
$300
$400
$500
$600
$700
$0
$100
$200
$300
$400
$500
$600
$700
2000
2001
2002
2003
2004
2005
2006
2007
2008
2009
2010
2011
2012 TTM
Revenue
EBITDA* |
 5
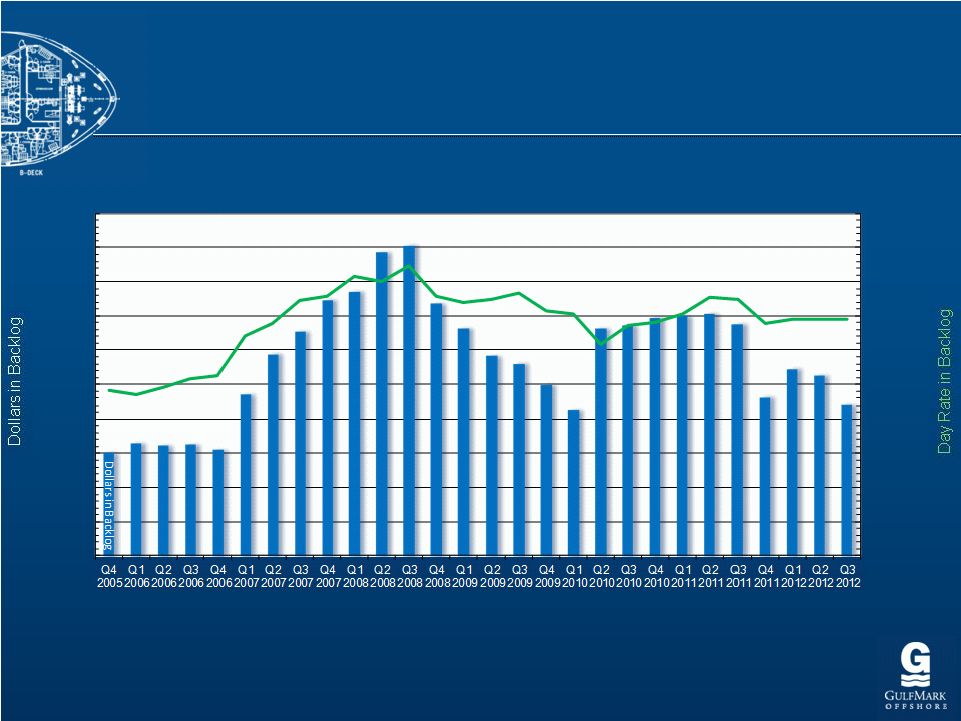
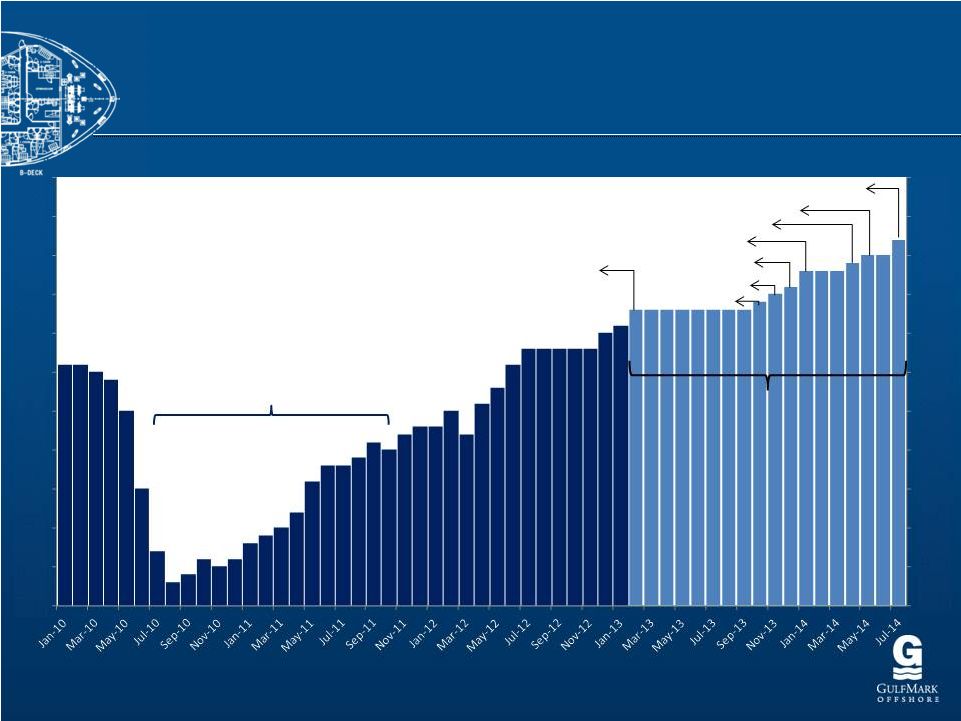
Total Revenue in Backlog
Total Revenue in Backlog
(in thousands of dollars)
(in thousands of dollars)
Day Rate in
Backlog
$0
$2,500
$5,000
$7,500
$10,000
$12,500
$15,000
$17,500
$20,000
$22,500
$25,000
$0
$100,000
$200,000
$300,000
$400,000
$500,000
$600,000
$700,000
$800,000
$900,000
$1,000,000 |
 6
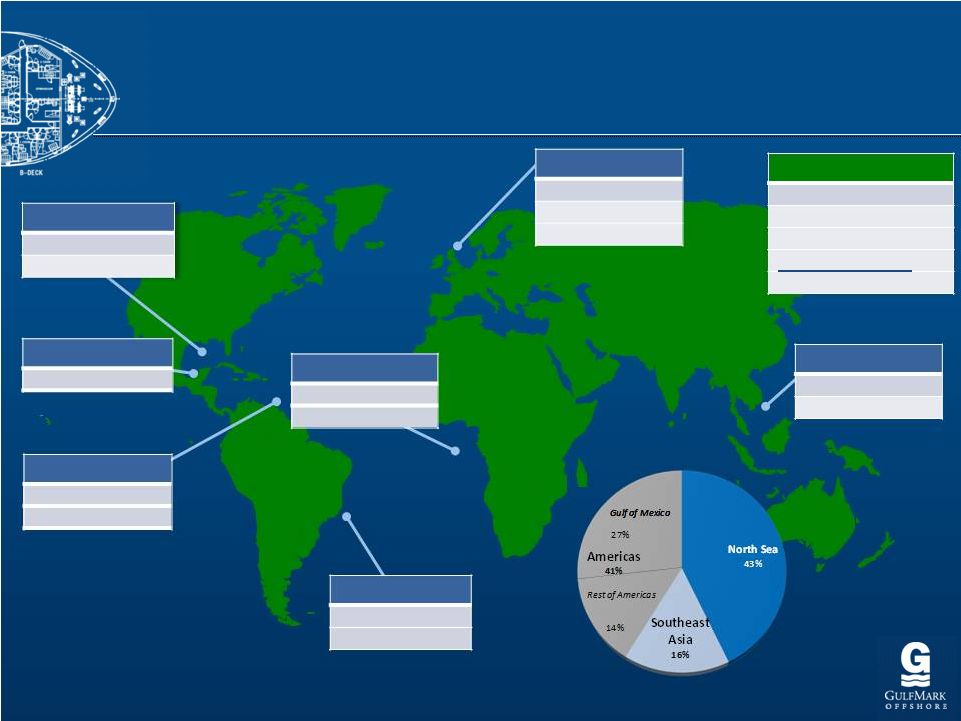
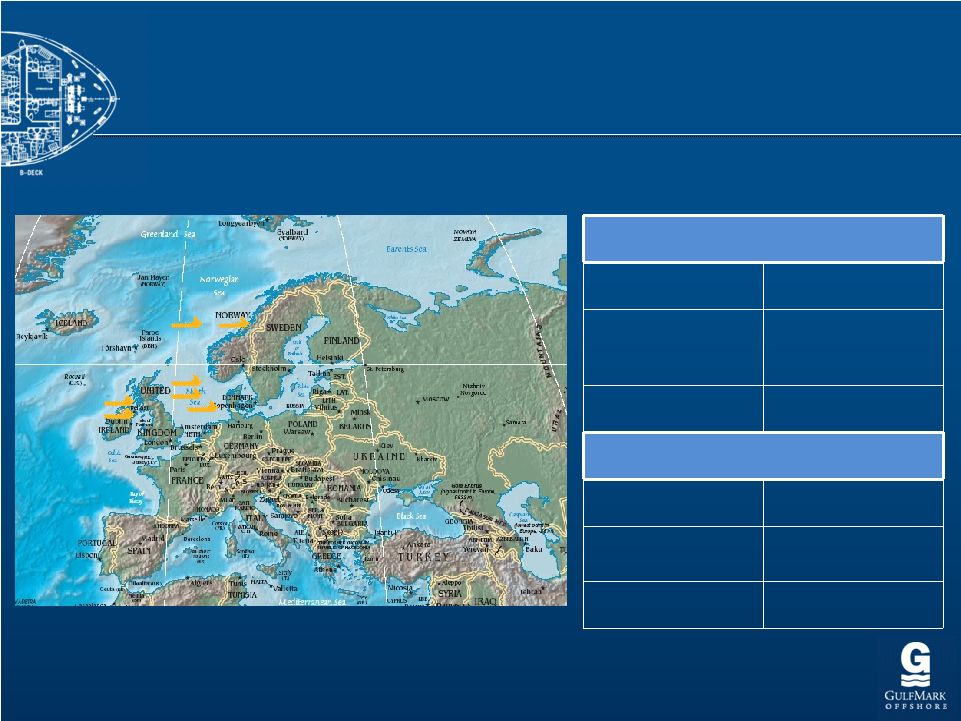
Global Vessel Diversification
Global Vessel Diversification
Revenue Breakout by Region
–
Twelve Months Ended
September 30, 2012
US
Gulf
PSV
15
West
Africa
PSV
1
Mexico
AHTS
2 Trinidad
PSV
2 FSV
1
North
Sea
PSV
20
AHTS
1
SpV
1 Worldwide
PSV
AHTS
FSV
SpV
Total
70
SE
Asia
PSV
4
AHTS 12
Brazil
PSV
6
SpV
1
FSV
2 2
48
17
AHTS
3
2 |
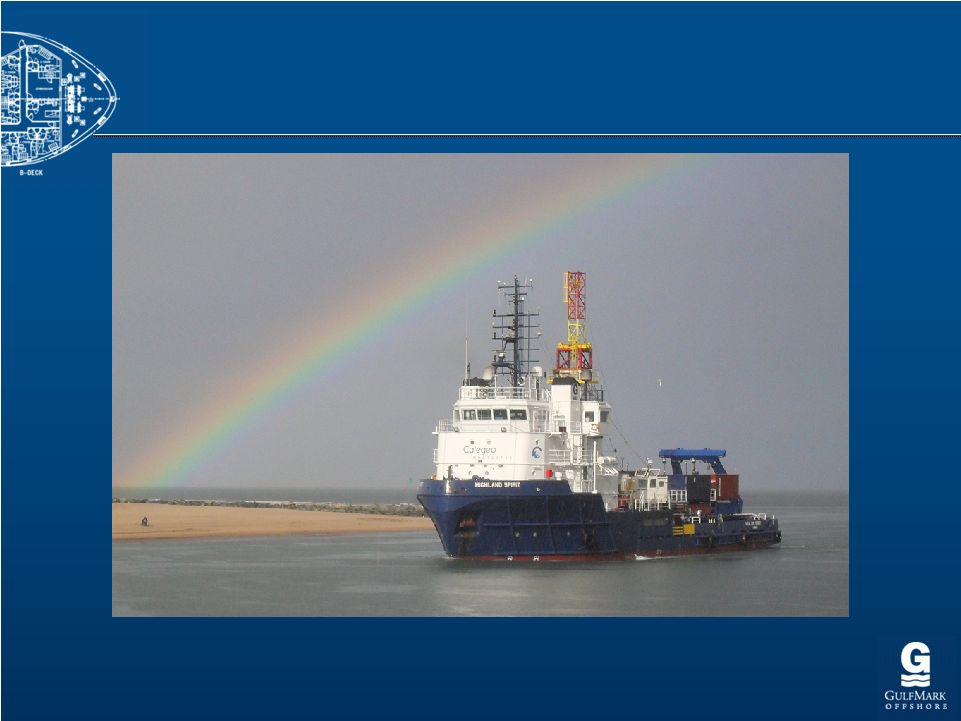
 The GulfMark Fleet
7 |
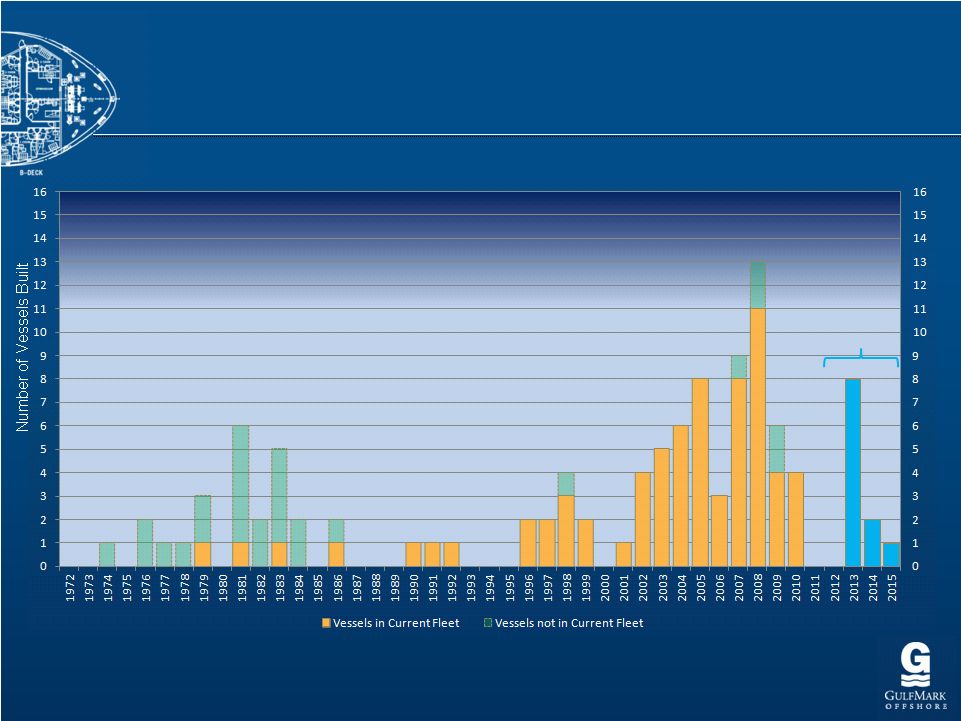 Young & Versatile Fleet
8
Number of Vessels GulfMark Built Per Year
New Build
Deliveries |
 Building For Our Future
9
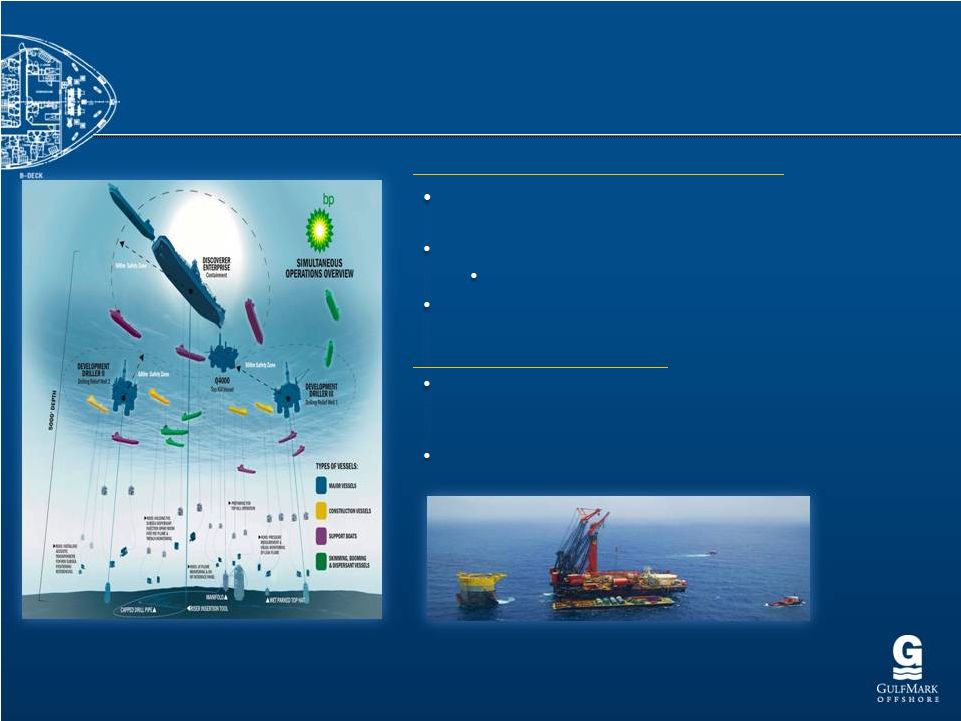
Significant number of new generation rigs on order
Increasing Activity both in the North Sea and New Frontiers
Industry call for higher specification vessels to meet increasing regulatory
demands:
•
Deeper Waters and Harsher Environments
•
Increased cargo carrying capacity and flexibility
•
Enhanced Green
Footprint and offering greater safety support |
 10
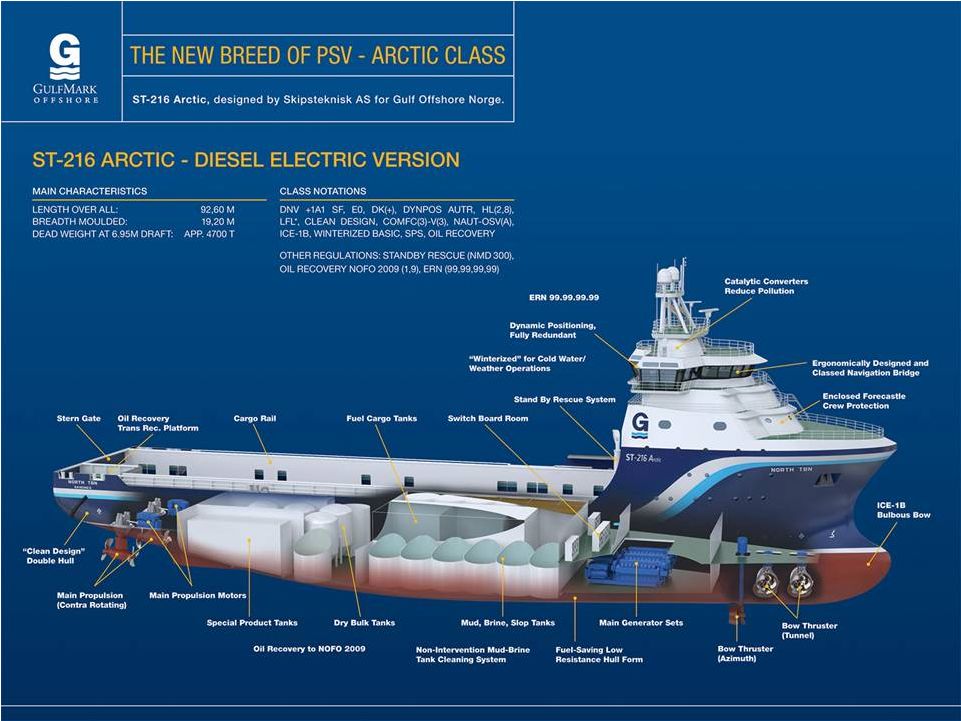
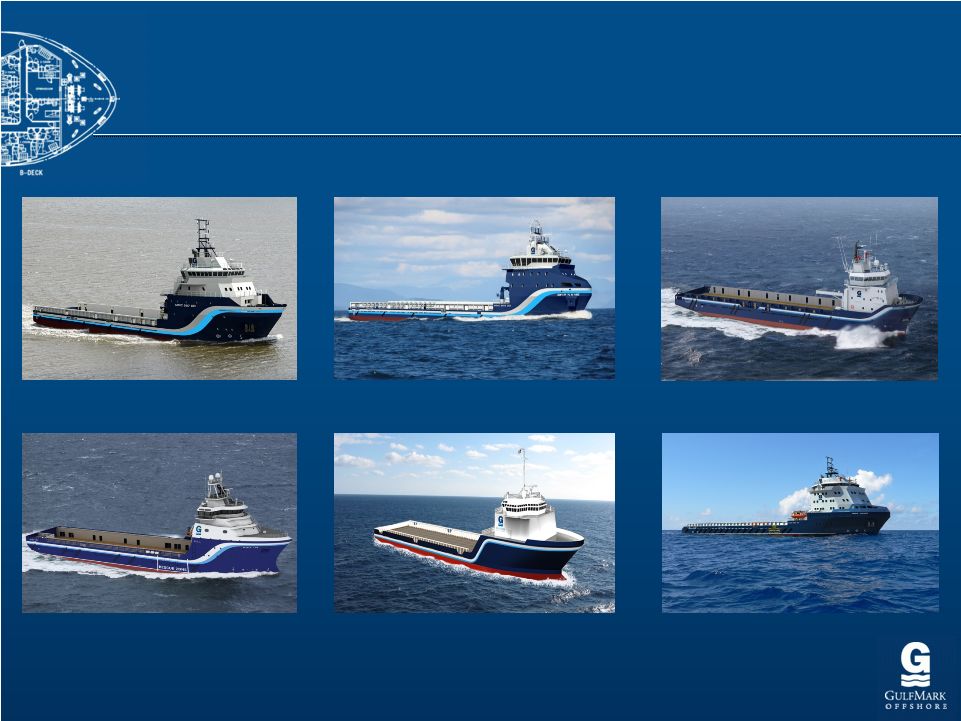
New Build Program Overview
New Build Program Overview
Two MMC 887 300 Class DP 2 (Europe)
One MMC 879 280 Class DP2 (Europe)
Two UT 755 XL 250 Class DP2 (Europe)
Two ST-216 300 Class Arctic DP2 (Europe)
Two 280 Class PSV DP2 (US)
Two 300 Class PSV DP2 (US) |
 New Build and Vessel Enhancement
Program Summary
Program Summary
11
•
North Sea
•
7 Newbuild Vessels
•
North Sea vessels hedged in EUR
•
DP2 Green PSVs (300 Class (2), 300 Class Arctic (2), 280 Class (1), 250 Class
(2)) •
Staggered delivery of Newbuilds-
2Q 2013 through 1Q 2014
•
U.S. GOM
•
4 Newbuild US Flagged Vessels for Approximately $170 million
•
DP2 Green PSVs (280 Class(2), 300 Class (2))
•
Staggered delivery -
3Q 2013 through 1Q 2015 |
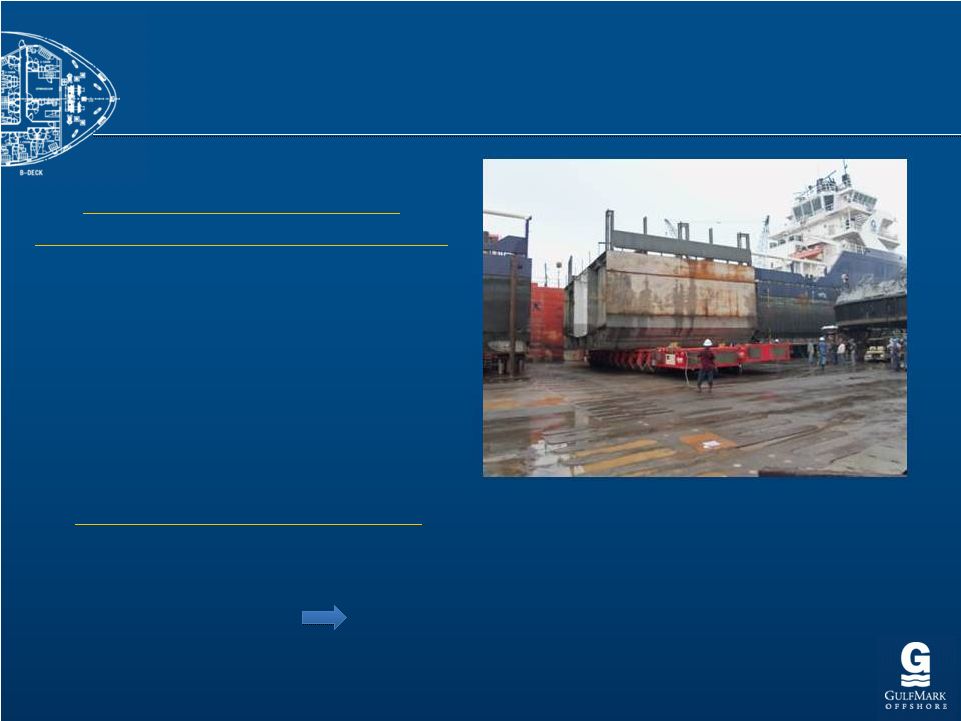 12
2012 Phase 1: 190’
to 230’
Three
Vessels
Completed
2011-12
Avg. Cost Per Vessel
$2.2 million
Avg. Incremental Days Out of Service
77
Avg. Day Rate % Increase
+40%
Avg. Utilization Percentage Increase
18%
Estimated Payback Period (Including
Opportunity Cost)
10.5 months
Return on Net Capital Employed
117%
U.S.
GOM
–
Stretch
Program
•
Completed Three 190’
Vessels in 2011-2012, Will Complete Three More During Q1 2013
•
Four Additional 190’
Vessels Will Become Stretch Program Candidates During 2015
•
Next Steps –
210 Class 260 Class
•
10 Vessel Candidates, Regulatory Approval Expected Q1 2013
New Build and Vessel Enhancement
New Build and Vessel Enhancement
Program Summary, Cont’d
Program Summary, Cont’d |
 Building For Our Future: 2013 & Beyond
(U.S. dollars, in millions)
(U.S. dollars, in millions)
13
Vessels Under
Construction
Vessel Type
Initial
Operating
Region
Estimated
Construction
Cost
Estimated
Average Annual
EBITDA
Implied EBITDA
Multiple
300 Class
PSV
North Sea
$37.0
$8.2
4.5x
300 Class
PSV
North Sea
$37.0
$8.2
4.5x
280 Class
PSV
North Sea
$34.0
$7.7
4.4x
300 Class Arctic
PSV
North Sea
$58.0
$10.8
5.4x
300 Class Arctic
PSV
North Sea
$60.0
$10.8
5.6x
250 Class
PSV
North Sea
$31.0
$7.4
4.2x
250 Class
PSV
North Sea
$31.0
$7.4
4.2x
US 280 Class
PSV
Americas
$36.0
$6.5
5.5x
US 280 Class
PSV
Americas
$36.0
$6.5
5.5x
US 300 Class
PSV
Americas
$48.0
$8.8
5.5x
US 300 Class
PSV
Americas
$48.0
$8.8
5.5x
Total
$456.0
$91.1
5.0x |
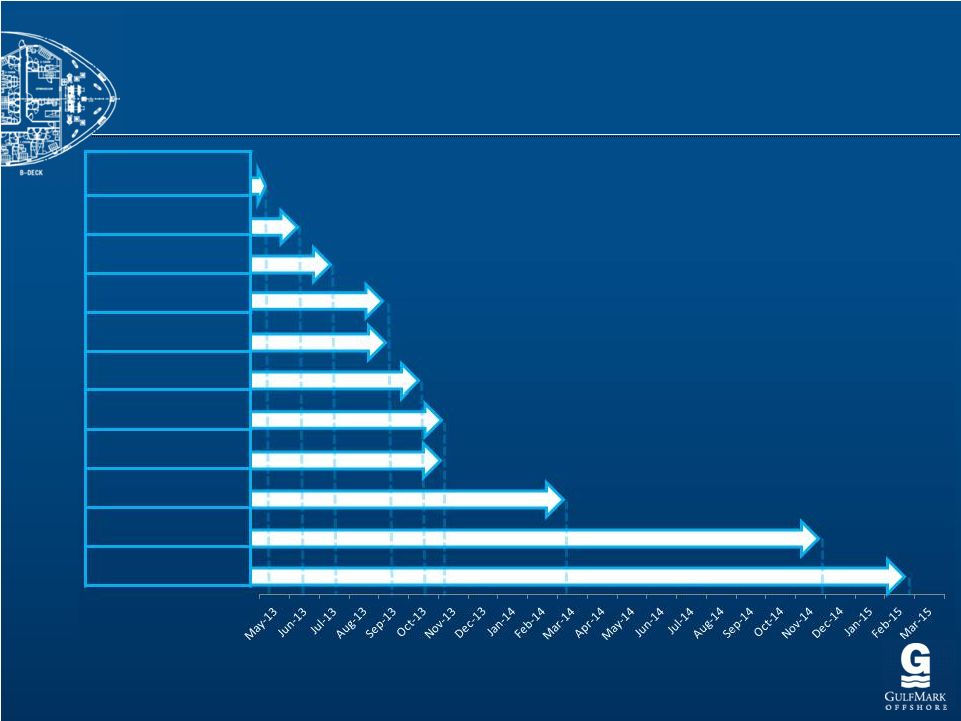 New Build Delivery Schedule
14
280 Class Europe
300 Class Artic Europe
280 Class Europe
300 Class Europe
280 Class US
250 Class Europe
300 Class Artic
280 Class US
250 Class Europe
300 Class US
300 Class US |
 Market
Drivers
Drivers
15 |
 Rig Growth in the North Sea
16
Source: IHS Petrodata , Carnegie Research
Floating Rigs
Active
41
Scheduled
Arrivals/Activations
(by 2014)
16
% Increase
39%
Jackups
Active
42
Scheduled Arrivals
(by 2014)
7
% Increase
17% |
 Rig Growth in the North Sea
17
Source: IHS Petrodata
Jackups
Jackups
Floating Rigs
Floating Rigs
0
10
20
30
40
50
60
2001
2002
2003
2004
2005
2006
2007
2008
2009
2010
2011
2012
Q1
2013
Q2
2013
Q3
2013
Q4
2013
Q1
2014
Q2
2014
Q3
2014
Q4
2014
Q1
2015
Q2
2015
Q3
2015
0
10
20
30
40
50
60
West Hercules,
COSL Promoter,
Leiv Eriksson
Stena Carron,
Island Innovator
Eirik Raude
Songa Equinox,
Ocean Patriot
Deepsea Aberdeen,
Songa Endurance
Songa Encourage, Bollsta Dolphin
Songa Enabler
Atwood Advantage, Sedco 712
North Dragon
0
10
20
30
40
50
60
70
0
10
20
30
40
50
60
70
2001
2002
2003
2004
2005
2006
2007
2008
2009
2010
2011
2012
Q1
2013
Q2
2013
Q3
2013
Q4
2013
Q1
2014
Q2
2014
Q3
2014
Q4
2014
Q1
2015
Q2
2015
Q3
2015
Q4
2015
Noble Regina Allen
Prospecter 1
ENSCO 120
West Linus
Maersk XL
Enhanced 1
Maersk XL
Enhanced 2
Maersk XL
Enhanced 3 |
 Floating Rig Growth in the U.S. GOM
18
Source:
IHS
Petrodata
–
August
2012
Floating Rigs in U.S. GOM
Active
36
Scheduled Arrivals
(by 2014)
11
% Increase
31% |
 Floating Rig Growth in the U.S. GOM
19
Source: Barclays, IHS Petrodata
0
5
10
15
20
25
30
35
40
45
50
55
0
5
10
15
20
25
30
35
40
45
50
55
Helix 534,
ENSCO
8506
West Auriga
Noble Globetrotter II
Ocean Confidence
West
Vela, Maersk Drsh Tbn 1
Pacific
Sharav
Deepwater Invictus
Noble Bob Douglas, Maersk Deepwater Advanced 2
Moratorium and Recovery
Planned |
 Worldwide Sub Sea –
Driving the Future
Driving the Future
20
Source:
Douglas-Westwood’s World Subsea Vessel Operations Market Forecast
2012-2016 Subsea Demand Expected to Increase 33% and
Annual Expenditure double to $20.3 Billion by 2016
Set to Top $77 Billion Over Next Five Years
Increase of 63% Over Previous Five Year Period
Sub Sea Work Requires Newer, More Specialized
Vessels and Support Equipment
Between 2013 and 2017, $91bn Will be Spent on Floating
Production
Systems
(FPS)
-
an
Increase
of
100%
over
the
Preceding Five-Year Period.
A Total of 121 Floating Production Units are Forecast to
be Installed -
a 37% Increase
Sub
Sea
Activity
is
Continuing
to
Expand
FPSO
Spending
–
Projected |
 Financial Information
21 |
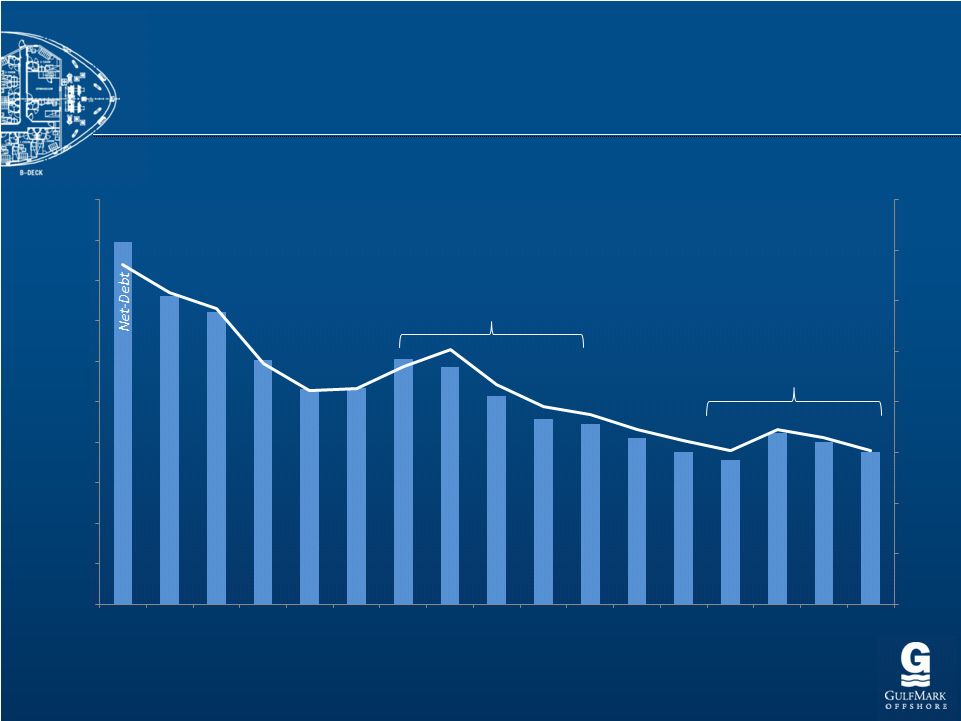 22
Consistent Reduction in
Consistent Reduction in
Net Debt Position
Net Debt Position
0%
5%
10%
15%
20%
25%
30%
35%
40%
$0
$50,000
$100,000
$150,000
$200,000
$250,000
$300,000
$350,000
$400,000
$450,000
$500,000
Q3 2008
Q4 2008
Q1 2009
Q2 2009
Q3 2009
Q4 2009
Q1 2010
Q2 2010
Q3 2010
Q4 2010
Q1 2011
Q2 2011
Q3 2011
Q4 2011
Q1 2012
Q2 2012
Q3 2012
Net-Debt to
Total Book
Capitalization
Finalization of Previous
New-
Build Program
Initiation of Current
New-Build Program |
 23
Investment Highlights
Investment Highlights
Industry Leaders in QHSE Performance & People Development
Global Presence and Diverse Operations Expertise
Financial Stability & Flexibility to Pursue Opportunities
Growth through Both Acquisition and New Construction
Young, Versatile, High-Specification Fleet |
 Reconciliation of Adjusted EBITDA
24
EBITDA is defined as net income (loss) before interest expense, net,
income tax provision, and depreciation and amortization, which includes impairment. Adjusted
EBITDA is calculated by adjusting EBITDA for certain items that we
believe are non-cash or unusual, consisting of: (i) loss from unconsolidated ventures; (ii) minority
interest;
and
(iii)
other
(income)
expense,
net.
EBITDA
and
Adjusted
EBITDA
are
not
measurements
of
financial
performance
under
GAAP
and
should
not
be
considered
as an alternative to cash flow data, a measure of liquidity or an
alternative to income from operations or net income as indicators of our operating performance or any other
measures
of
performance
derived
in
accordance
with
GAAP.
EBITDA
and
Adjusted
EBITDA
are
presented
because
we
believe
they
are
used
by
security
analysts,
investors and other interested parties in the evaluation of companies
in our industry. However, since EBITDA and Adjusted EBITDA are not measurements determined in
accordance with GAAP and are thus susceptible to varying calculations,
EBITDA and Adjusted EBITDA as presented may not be comparable to other similarly titled
measures of other companies.
Net (loss) income
$24.0
$0.5
($4.6)
$38.4
$89.7
$99.0
$183.8
$50.6
($34.7)
$49.9
$47.8
Interest expense, net
10.9
12.8
17.0
18.4
14.4
4.8
12.8
19.9
20.7
21.6
22.6
Income tax (benefit)
3.0
0.2
(6.5)
3.4
3.0
30.2
11.7
(2.1)
(12.7)
4.7
5.5
Depreciation & Amortization
21.4
28.0
26.1
28.9
28.5
30.6
44.3
53.0
57.0
59.6
59.6
EBITDA
59.3
$
41.5
$
32.0
$
89.1
$
135.6
$
164.6
$
252.6
$
121.5
$
30.2
$
135.8
$
135.5
$
Adjustments:
Impairment
-
-
-
-
-
-
-
46.2
97.7
1.8
2.7
Debt refinancing costs
-
-
6.5
-
-
-
-
-
-
-
3.8
Accounting Change
-
-
7.3
-
-
-
-
-
-
-
-
Other
(2.5)
1.3
(1.5)
(0.5)
0.1
0.3
(1.6)
1.2
(0.1)
2.3
0.0
Adjusted EBITDA
$56.8
$42.8
$44.3
$88.6
$135.7
$164.9
$251.0
$168.8
$127.8
$139.9
$142.0
2002
2003
2004
2005
2006
2007
2008
2009
2010
2012 TTM
2011 |