Attached files
| file | filename |
|---|---|
| 8-K - EAGLE BANCORP MONTANA, INC. 8-K - Eagle Bancorp Montana, Inc. | a505567112.htm |
Exhibit 99.1
FIG Partners West Coast Bank CEO Forum February 2013
Forward Looking Statements This presentation may contain certain "forward-looking statements" within the meaning of Section 27A of the Securities Act of 1933 and Section 21E of the Securities Exchange Act of 1934, and may be identified by the use of such words as "believe," "expect," "anticipate," "should," "planned," "estimated," and "potential." These forward-looking statements include, but are not limited to statements of our goals, intentions and expectations; statements regarding our business plans, prospects, growth and operating strategies; statements regarding the asset quality of our loan and investment portfolios; and estimates of our risks and future costs and benefits. These forward-looking statements are based on current beliefs and expectations of our management and are inherently subject to significant business, economic and competitive uncertainties and contingencies, many of which are beyond our control. In addition, these forward-looking statements are subject to assumptions with respect to future business strategies and decisions that are subject to change. These factors include, but are not limited to, changes in laws or government regulations or policies affecting financial institutions, including changes in regulatory fees and capital requirements; general economic conditions, either nationally or in our market areas, that are worse than expected; competition among depository and other financial institutions; loan demand or residential and commercial real estate values in Montana; inflation and changes in the interest rate environment that reduce our margins or reduce the fair value of financial instruments; adverse changes in the securities markets; and other economic, governmental, competitive, regulatory and technological factors that may affect our operations. Because of these and other uncertainties, our actual future results may be materially different from the results indicated by these forward-looking statements.
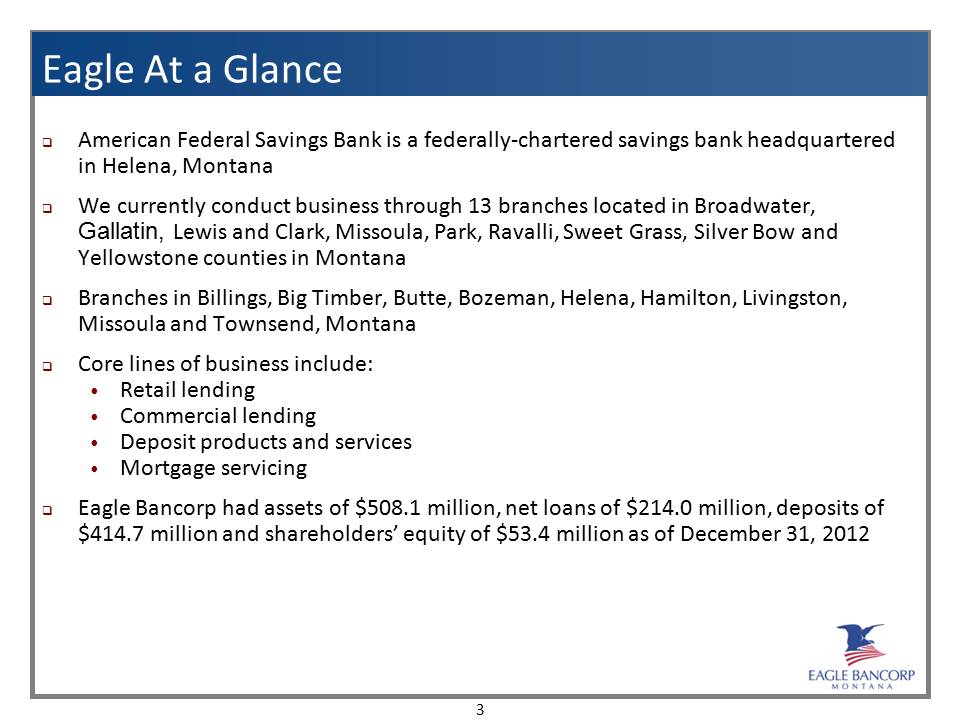
Eagle At a Glance American Federal Savings Bank is a federally-chartered savings bank headquartered in Helena, Montana We currently conduct business through 13 branches located in Broadwater, Gallatin, Lewis and Clark, Missoula, Park, Ravalli, Sweet Grass, Silver Bow and Yellowstone counties in Montana Branches in Billings, Big Timber, Butte, Bozeman, Helena, Hamilton, Livingston, Missoula and Townsend, Montana Core lines of business include: Retail lending Commercial lending Deposit products and services Mortgage servicing Eagle Bancorp had assets of $508.1 million, net loans of $214.0 million, deposits of $414.7 million and shareholders’ equity of $53.4 million as of December 31, 2012
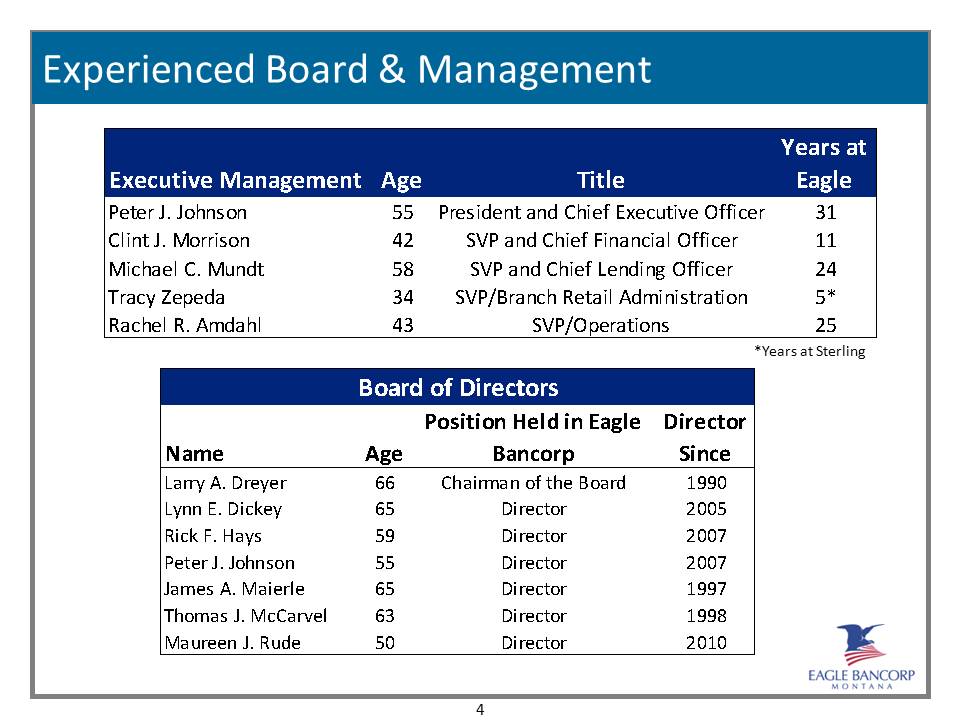
Experienced Board & Management Years at Eagle Executive Management Age Title Peter J. Johnson 55 President and Chief Executive Officer 31 Clint J. Morrison 42 SVP and Chief Financial Officer 11 Michael C. Mundt 58 SVP and Chief Lending Officer 24 Tracy Zepeda 34 SVP/Branch Retail Administration 5* Rachel R. Amdahl 43 SVP/Operations 25 Board of Directors Position Held in Eagle Bancorp Director Since Name Age Larry A. Dreyer 66 Chairman of the Board 1990 Lynn E. Dickey 65 Director 2005 Rick F. Hays 59 Director 2007 Peter J. Johnson 55 Director 2007 James A. Maierle 65 Director 1997 Thomas J. McCarvel 63 Director 1998 Maureen J. Rude 50 Director 2010
Business Strategy Continue to diversify our loan portfolio into commercial (C&I) and commercial real estate Attract and retain lower-cost core deposits Continue to expand our franchise through selective acquisitions and branch additions Maintain high asset quality levels Continue to operate as a community-oriented financial institution
Acquisition On November 30, 2012, purchased 7 branch banking locations from Sterling Savings Bank, a wholly-owned subsidiary of Sterling Financial Corp. (NASDAQ: STSA). The transaction more than doubled the franchise to 13 branches and extended the branch network throughout Southern Montana Created the 6th largest Montana-based banking institution Expands our footprint in Southern Montana: New markets include Missoula and Billings, the largest metropolitan markets in Montana Leveraged excess capital in a lower risk branch transaction Limited credit risk: assumed only pass rated credits Doubled mortgage banking business and added wealth management platform Immediately accretive to EPS by 20% + in year 1 with an expected tangible book earn-back period of between four to five years Internal rate of return of approximately 15%
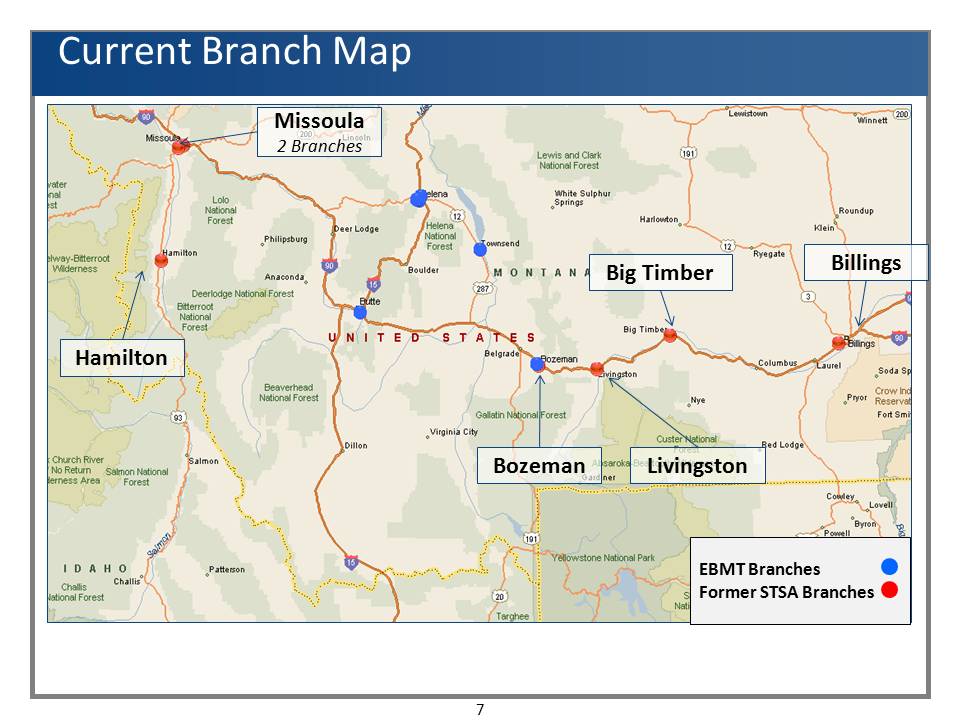
Current Branch Map Missoula 2 Branches Hamilton Bozeman Big Timber Billings Livingston EBMT Branches Former STSA Branches
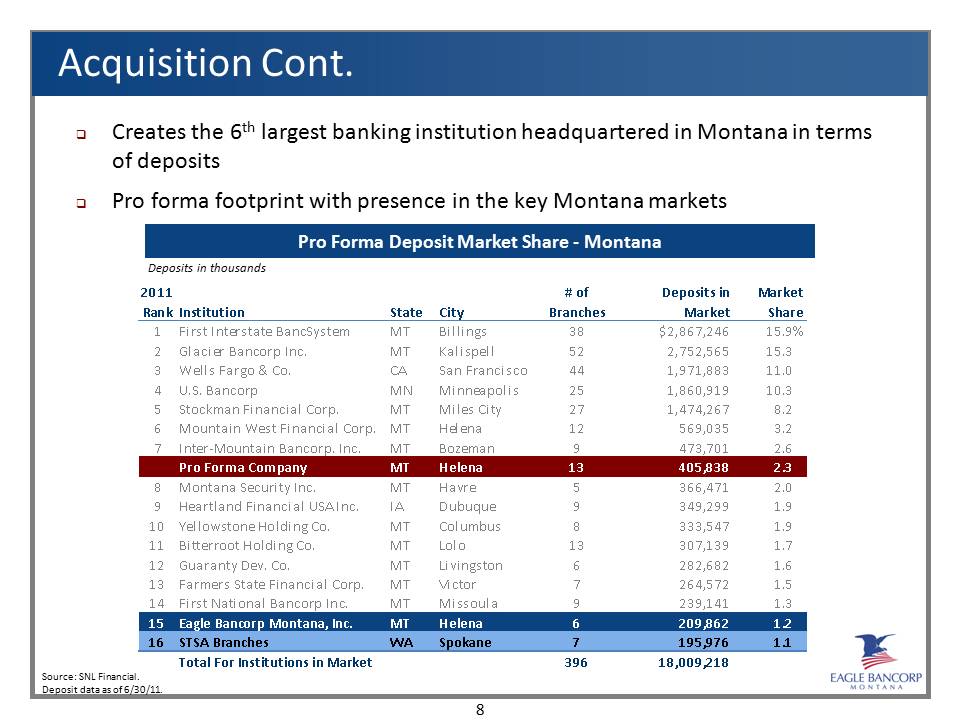
Acquisition Cont. Creates the 6th largest banking institution headquartered in Montana in terms of deposits Pro forma footprint with presence in the key Montana markets Pro Forma Deposit Market Share – Montana Deposits in thousands 2011 Rank Institution State City # of Branches Deposits in Market Market Share 1 First Interstate BancSystem MT Billings 38 $2,867,246 15.9% 2 Glacier Bancorp Inc. MT Kalispell 52 2,752,565 15.3 3 Wells Fargo & Co. CA San Francisco 44 1,971,883 11.0 4 U.S. Bancorp MN Minneapolis 25 1,860, 919 10.3 5 Stockman Financial Corp. MT Miles City 27 1,474, 267 8.2 6 Mountain West Financial Corp MT Helena 12 569,035 3.2 7 Inter-Mountain Bancorp, Inc. MT Bozeman 9 473,701 2.6 Pro Forma Company MT Helena 13 405,838 2.3 8 Montana Security Inc. MT Havre 5 366,471 2.0 9 Heartland Financial USA Inc. IA Dubuque 9 349,299 1.9 10 Yellowstone Holding Co. MT Columbus 8 333,547 1.9 11 Bitterroot Holding Co. MT Lolo 13 307,139 1.7 12 Guaranty Dev. Co. MT Livingston 6 282,682 1.6 13 Farmers State Financial Corp. MT Victor 7 264,572 1.5 14 First National Bancorp Inc. MT Missoula 9 239,141 1.3 15 Eagle Bancorp Montana, Inc. MT Helena 6 209,862 1.2 16 STSA Branches WA Spokane 7 195,976 1.1 Total For Institutions in Market 396 18,009,218 Source: SNL Financial. Deposit dates as of 6/30/11.
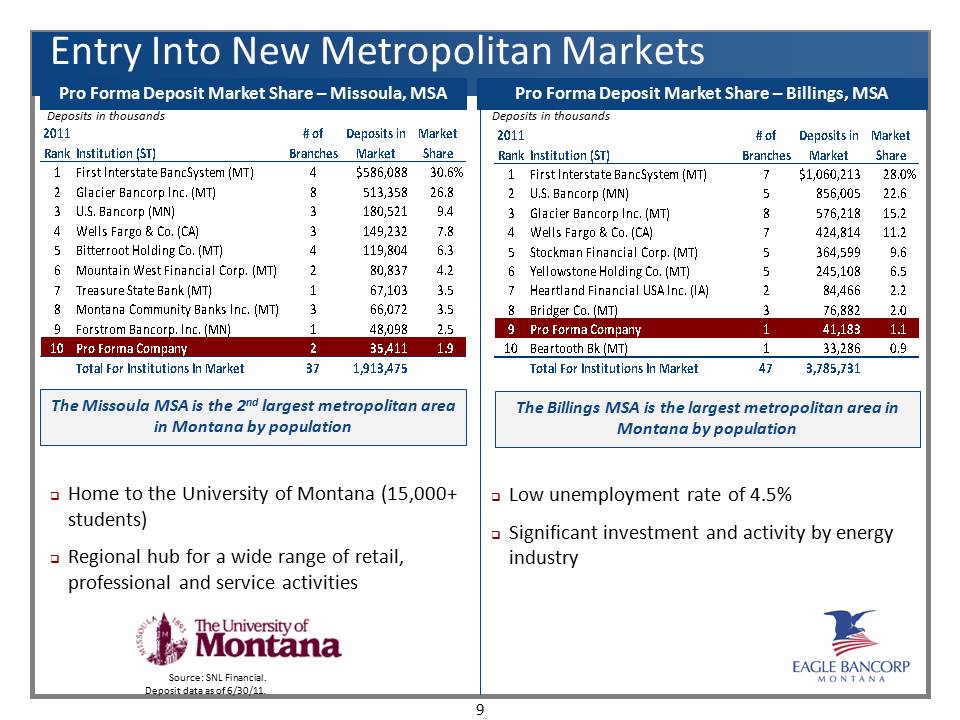
Entry Into New Metropolitan Markets Pro Forma Deposit Market Share – Missoula, MSA Pro Forma Deposit Market Share – Billings, MSA Deposits in thousands The Missoula MSA is the 2nd largest metropolitan area in Montana by population The Billings MSA is the largest metropolitan area in Montana by population Home to the University of Montana (15,000+ students) Regional hub for a wide range of retail, professional and service activities Low unemployment rate of 4.5% Significant investment and activity by energy industry 2011 Rank Institution (ST) # of Branches Deposits in Market Market Share 1 First Interstate BancSystem (MT) 4 $586,088 30.6% 2 Glacier Bancorp Inc. (MT) 8 513,358 26.8 3 U.S. Bancorp (MN) 3 180,821 9.4 4 Wells Fargo & Co. (CA) 3 149,232 7.8 5 Bitterroot Holding Co. (MT) 4 119,804 6.3 6 Mountain West Financial Corp. (MT) 2 80,837 4.2 7 Treasure State Bank (MT) 1 67,103 3.5 8 Montana Community Banks Inc. (MT) 3 66,072 3.5 9 Forstrom Bancorp, Inc. (MN) 1 48,098 2.5 10 Pro Forma Company 2 35,411 1.9 Total For Institutions In Market 37 1,913,475 2011 Rank Institution (ST) # of Branches Deposits in Market Market Share 1 First Interstate BancSystem (MT) 7 $1,060,213 28.0% 2 U.S. Bancorp (MN) 5 856,005 22.6 3 Glacier Bancorp Inc. (MT) 8 576,218 15.2 4 Wells Fargo & Co. (CA) 7 424,814 11.2 5 Stockman Financial Corp. (MT) 5 364,599 9.6 6 Yellowstone Holding Co. (MT) 5 245,108 6.5 7 Heartland Financial USA Inc. (IA) 2 84,466 2.2 8 Bridger Co. (MT) 3 76,882 2.0 9 Pro Forma Company 1 41,183 1.1 10 Beartooth Bk (MT) 1 33,286 0.9 Total For Institutions In Market 47 3,785,731
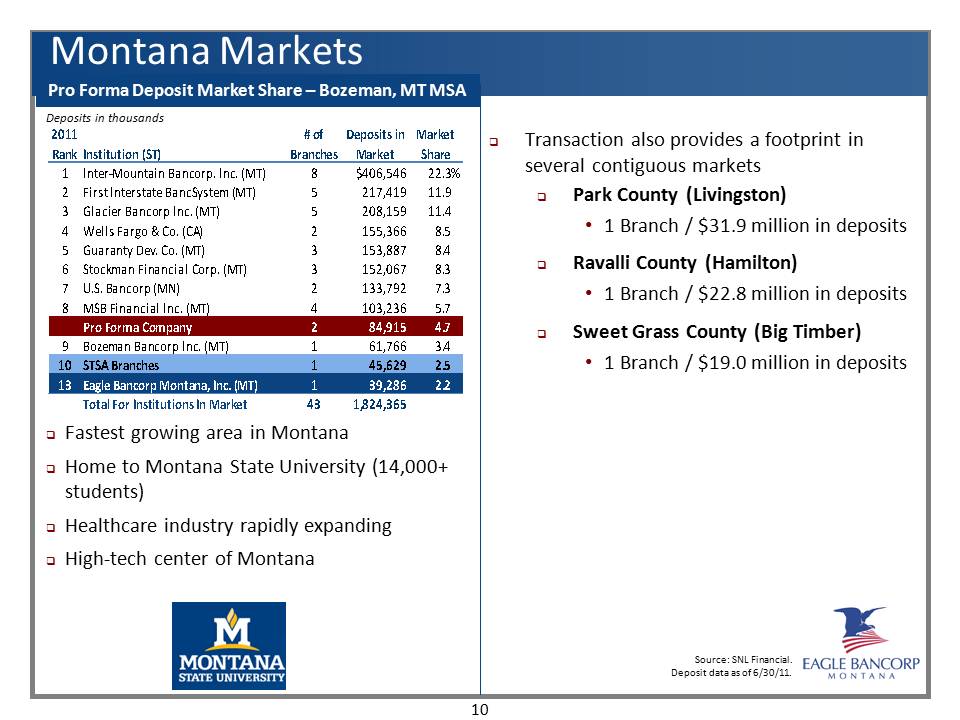
Montana Markets Pro Forma Deposit Market Share – Bozeman, MT MSA Fastest growing area in Montana Home to Montana State University (14,000+ students) Healthcare industry rapidly expanding High-tech center of Montana Transaction also provides a footprint in several contiguous markets Park County (Livingston) 1 Branch / $31.9 million in deposits Ravalli County (Hamilton) 1 Branch / $22.8 million in deposits Sweet Grass County (Big Timber) 1 Branch / $19.0 million in deposits Deposits in thousandes 2011 Rank Institution (ST) # of Branches Deposits in Market Market Share 1 Inter-Mountain Bancorp. Inc. (MT) 8 $406,546 22.3% 2 First Interstate BancSystem (MT) 5 217,419 11.9 3 Glacier Bancorp Inc. (MT) 5 208,159 11.4 4 Wells Fargo & Co. (CA) 2 155,366 8.5 5 Guaranty Dev. Co. (MT) 3 153,887 8.4 6 Stockman Financial Corp. (MT) 3 152,067 8.3 7 U.S. Bancorp (MN) 2 133,792 7.3 8 MBS Financial Inc. (MT) 4 103,236 5.7 Pro Forma Company 2 84,915 4.7 9 Bozeman Bancorp Inc. (MT) 1 61,766 3.4 10 STSA Branches 1 45,629 2.5 13 Eagle Bancorp Montana, Inc. (MT) 1 39,286 2.2 Total For Institutions In Market 43 1,824,365
EAGLE BANCORP MONTANA Financial Highlights
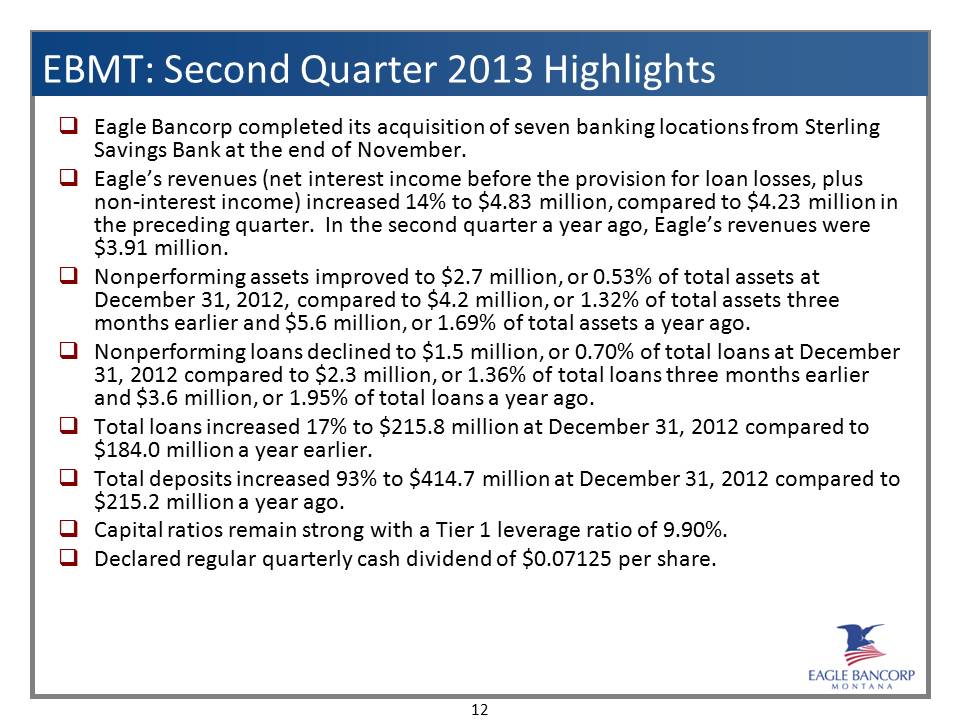
EBMT: Second Quarter 2013 Highlights Eagle Bancorp completed its acquisition of seven banking locations from Sterling Savings Bank at the end of November. Eagle’s revenues (net interest income before the provision for loan losses, plus non-interest income) increased 14% to $4.83 million, compared to $4.23 million in the preceding quarter. In the second quarter a year ago, Eagle’s revenues were $3.91 million. Nonperforming assets improved to $2.7 million, or 0.53% of total assets at December 31, 2012, compared to $4.2 million, or 1.32% of total assets three months earlier and $5.6 million, or 1.69% of total assets a year ago. Nonperforming loans declined to $1.5 million, or 0.70% of total loans at December 31, 2012 compared to $2.3 million, or 1.36% of total loans three months earlier and $3.6 million, or 1.95% of total loans a year ago. Total loans increased 17% to $215.8 million at December 31, 2012 compared to $184.0 million a year earlier. Total deposits increased 93% to $414.7 million at December 31, 2012 compared to $215.2 million a year ago. Capital ratios remain strong with a Tier 1 leverage ratio of 9.90%. Declared regular quarterly cash dividend of $0.07125 per share.
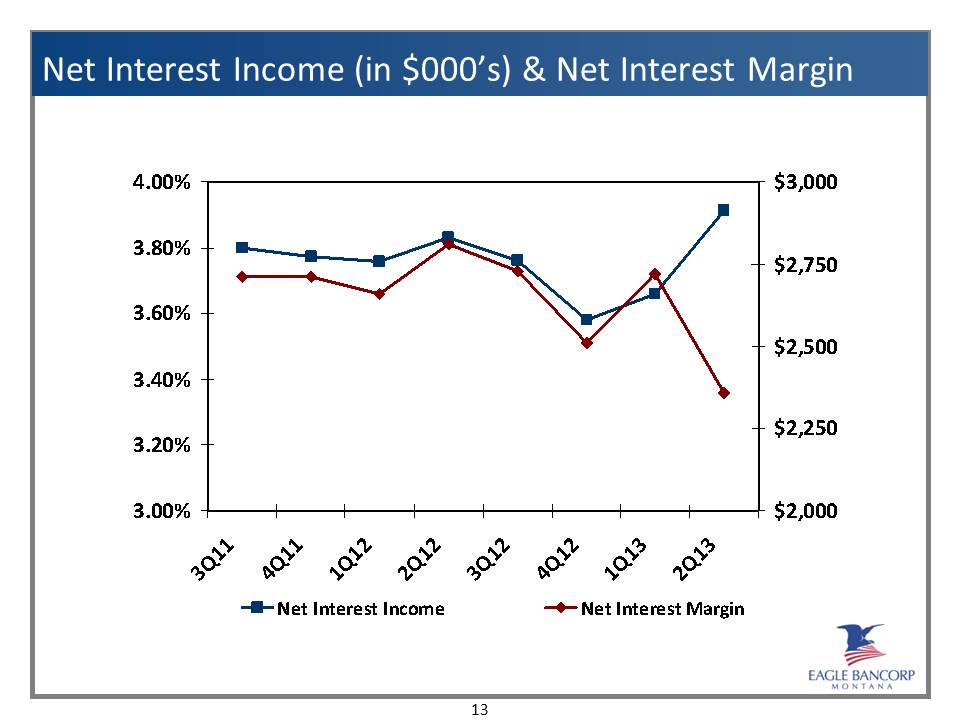
Net Interest Income (in $000’s) & Net Interest Margin 4.00% 3.80% 3.60% 3.40% 3.20% 3.00% $3,000 $2,750 $2,500 $2,250 $2,000 3Q11 4Q11 1Q12 2Q12 3Q12 4Q12 1Q13 2Q13 Net Interest Income Net Interest Margin
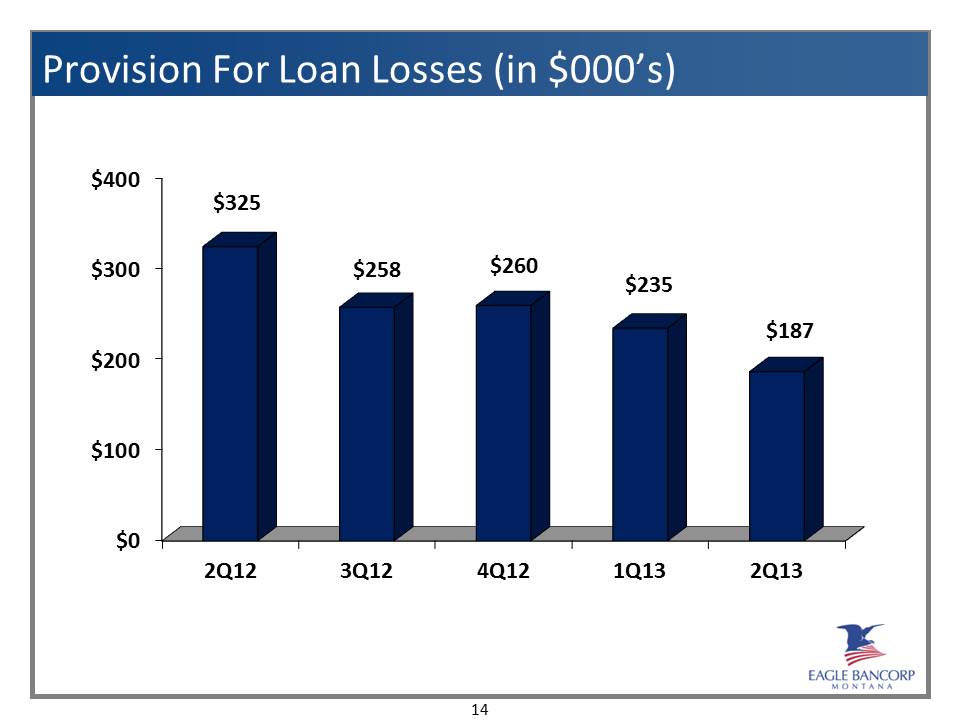
Provision For Loan Losses (in $000’s) $0 $100 $200 $300 $400 2Q12 3Q12 4Q12 1Q13 2Q13 $325 $258 $260 $235 $187
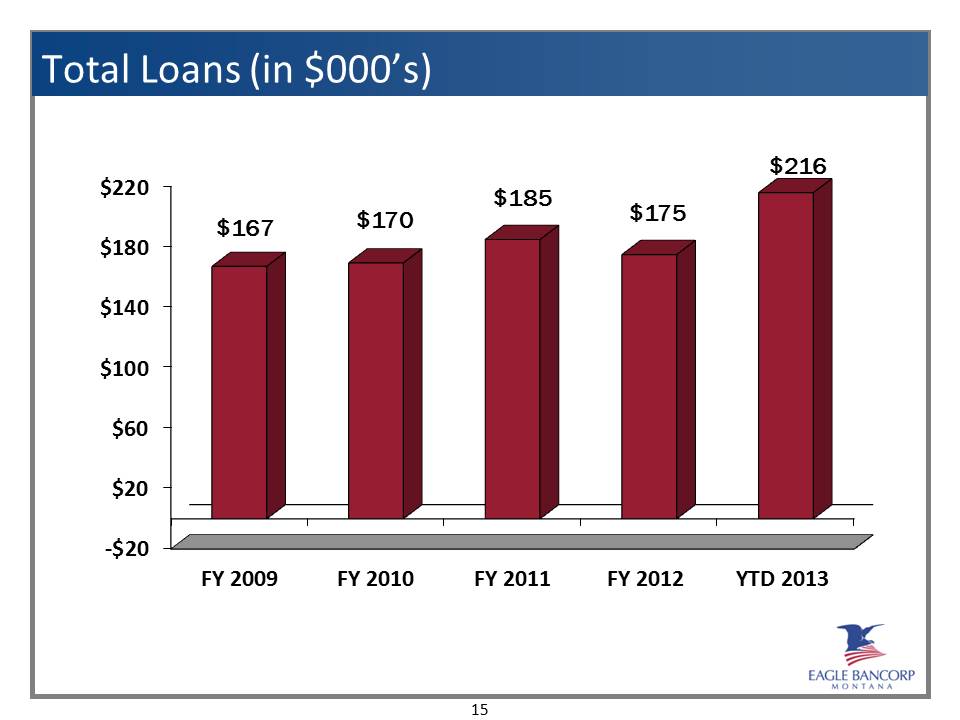
Total Loans (in $000’s) $220 $180 $140 $100 $60 $20 -$20 FY 2009 FY 2010 FY 2011 FY 2012 YTD 2013 $167 $170 $185 $175 $216
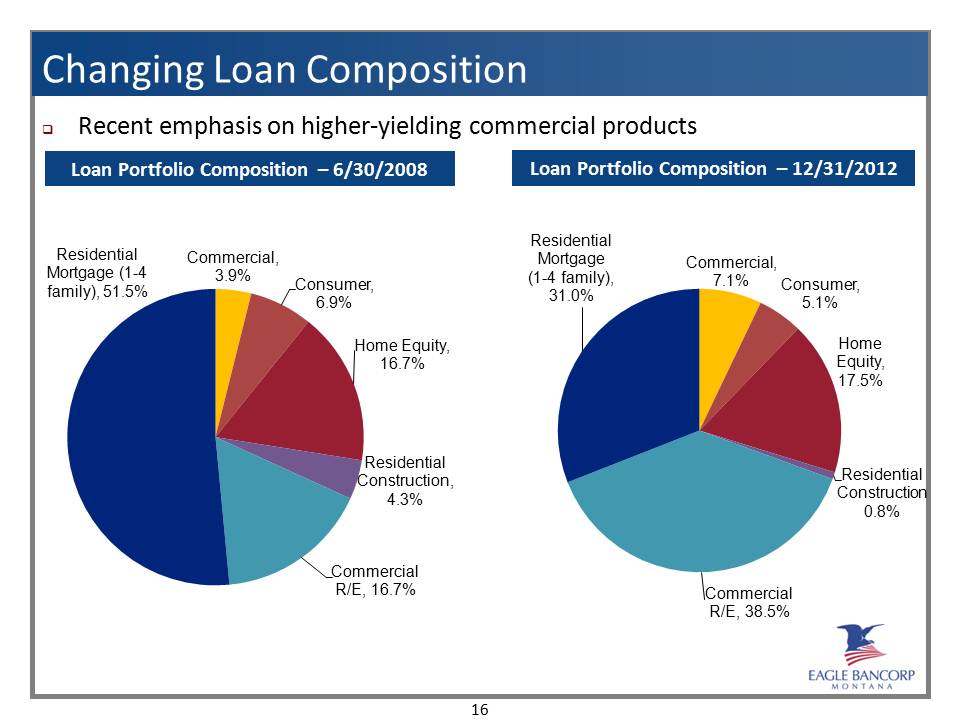
Changing Loan Composition Recent emphasis on higher-yielding commercial productsLoan Portfolio Composition – 6/30/2008 Loan Portfolio Composition – 12/31/2012 Residential Mortgage (1-4 family) 51.5% Commercial, 3.9% Consumer, 6.9% Home Equity, 16.7% Residential Construction, 4.3% Commercial R/E, 16.7% Residential Mortgage (1-4 family), 31.0% Commercial, 7.1% Consumer, 5.1% Home Equity, 17.5% Residential Construction, 0.8% Commercial R/E, 38.5%
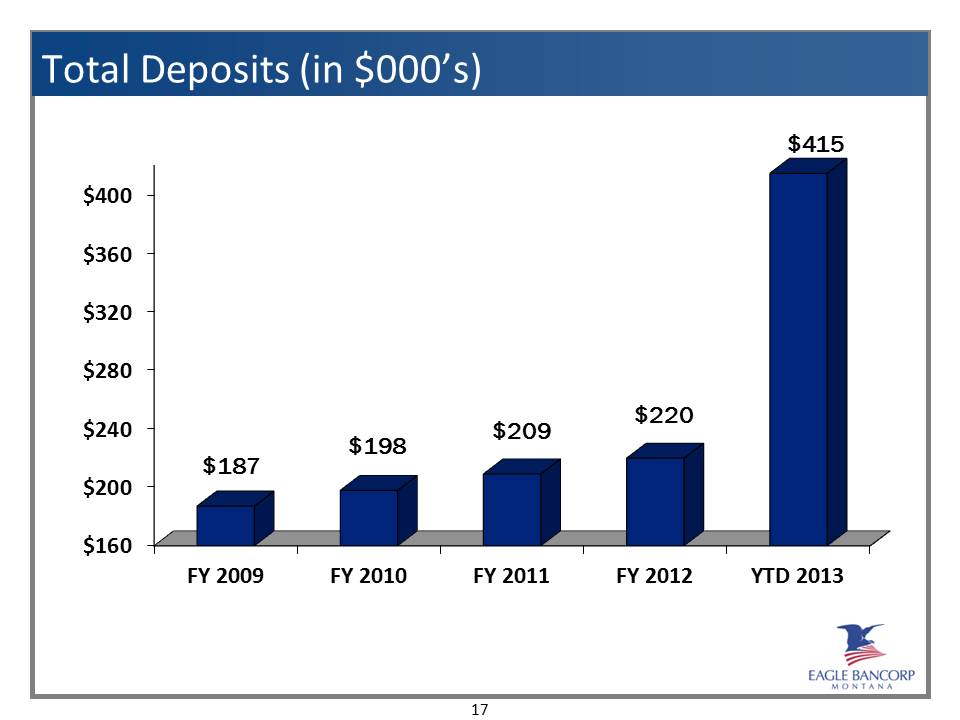
Total Deposits (in $000’s) $400 $3360 $320 $280 $240 $200 $160 FY 2009 FY 2010 FY 2011 FY 2012 YTD 2013 $187 $198 $209 $220 $415
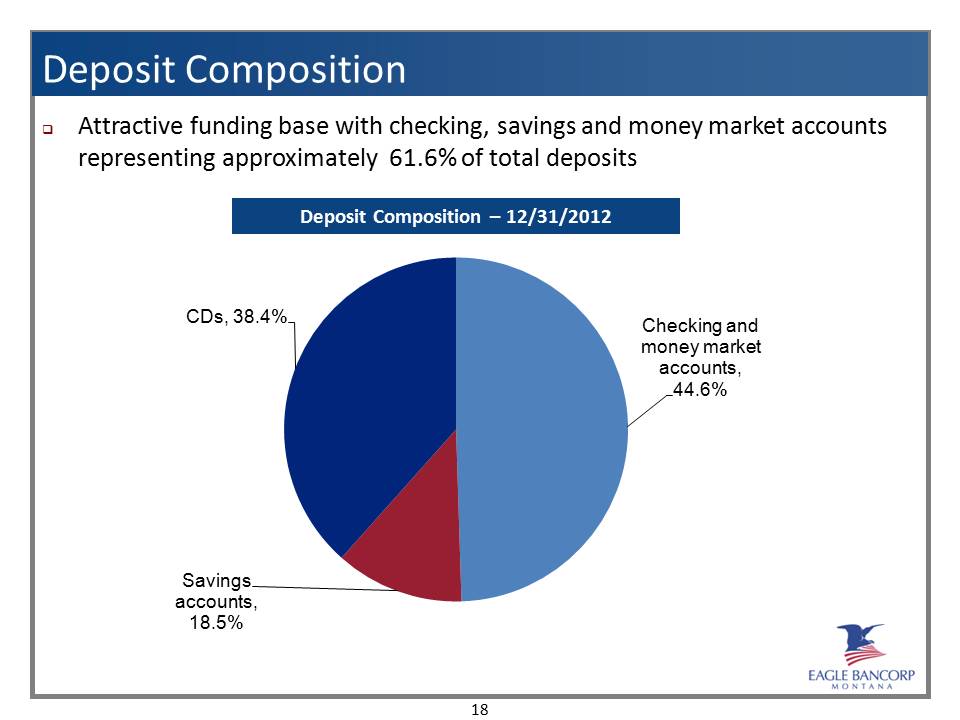
Deposit Composition Attractive funding base with checking, savings and money market accounts representing approximately 61.6% of total deposits Deposit Composition – 12/31/2012 CDs, 38.4% Checking and money market accounts, 44.6% Savings accounts, 18.5%
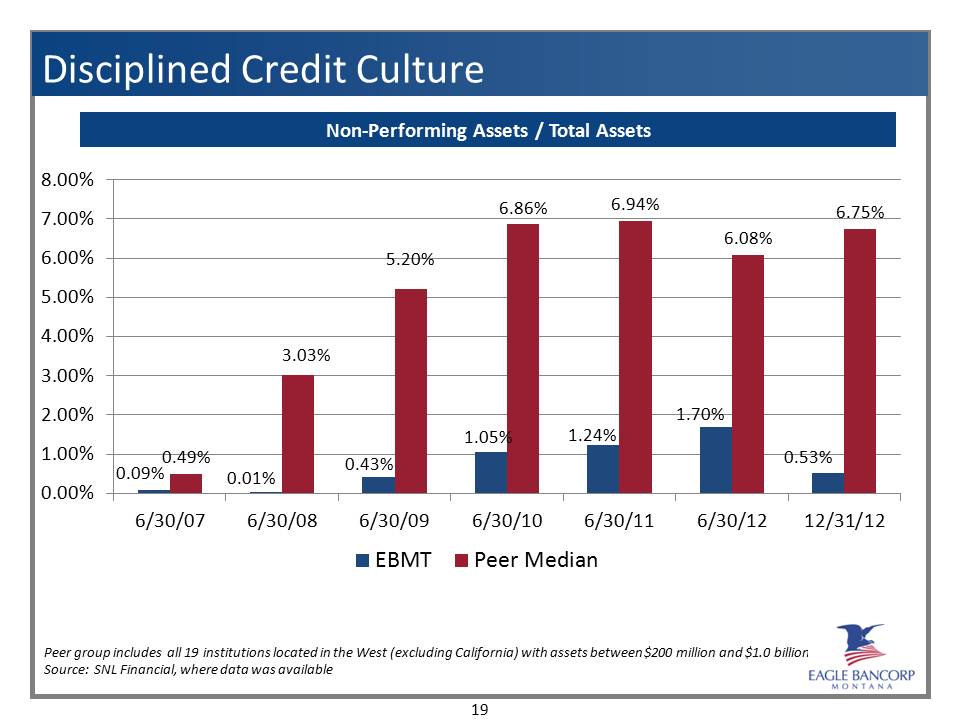
Disciplined Credit Culture Non-Performing Assets / Total Assets 8.00% 7.00% 6.00% 5.00% 4.00% 3.00% 2.00% 1.00% 0.00% 6/30/07 6/30/08 6/30/09 6/30/10 6/30/11 6/30/12 12/31/12 EBMT Peer Median 0.009% 0.49% 0.01% 3.03% 0.43% 5.20% 1.05% 6.86% 1.24% 6.94% 1.70% 6.08% 0.53% 6.75% Peer group includes all 19 institutions located in the West (excluding California) with assets between $200 million and $1.0 billion. Source: SNL Financial, where data was available
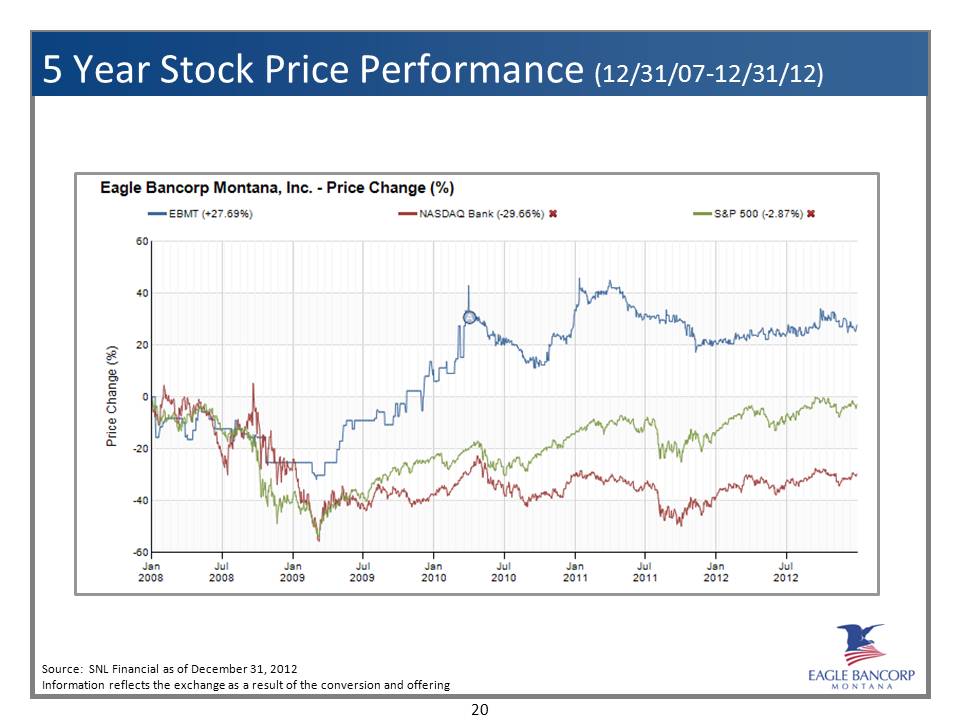
5 Year Stock Price Performance (12/31/07-12/31/12) Eagle Bancorp Montana, Inc. – Price Change (5) EBMT (+27.69%) NASDAQ Bank (-29.66%) S&P 500 (-2.87%) Price Change (5) 60 40 20 0 -20 -40 -60 Jan 2008 Jul 2008 Jan 2009 Jul 2009 Jan 2010 Jul 2010 Jan 2011 Jul 2011 Jan 2012 Jul 2012 Source: SNL Financial as of December 31, 2012 Information reflects the exchange as a result of the conversion and offering
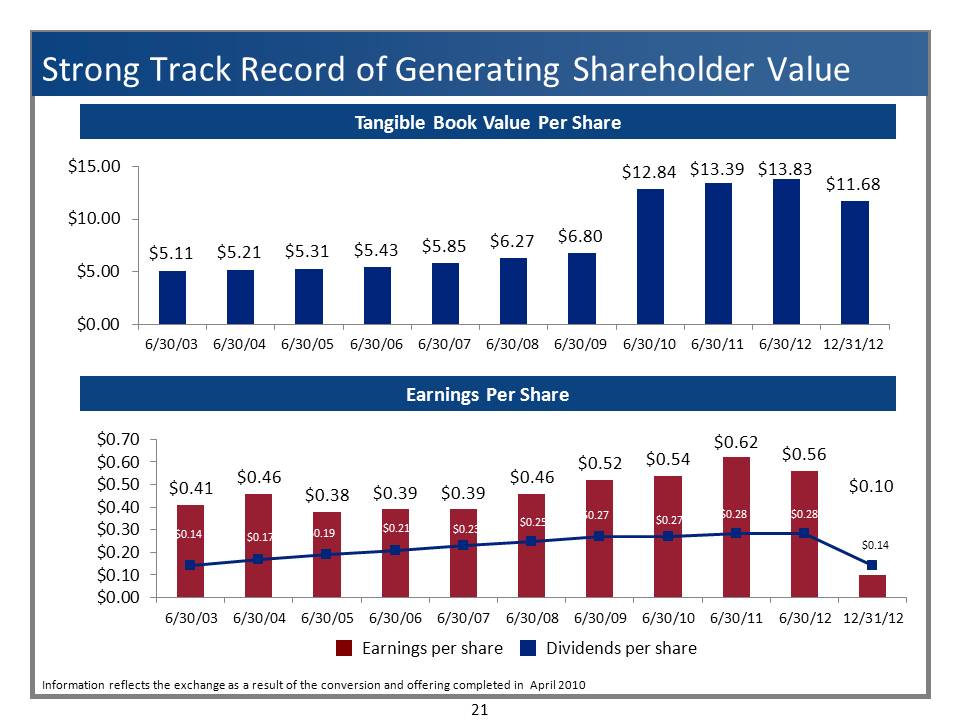
Strong Track Record of Generating Shareholder Value Tangible Book Value Per Share $15.00 $10.00 $5.00 $0.00 6/30/03 6/30/04 6/30/05 6/30/06 6/30/07 6/30/08 6/30/09 6/30/10 6/30/11 6/30/12 12/31/12 $5.11 $5.21 $5.31 $5.43 $5.85 $6.27 $6.80 $12.84 $13.39 $13.83 $11.68 Earnings Per Share $0.70 $0.60 $0.50 $0.40 $0.30 $0.20 $0.10 $0.00 6/30/03 6/30/04 6/30/05 6/30/06 6/30/07 6/30/08 6/30/09 6/30/10 6/30/11 6/30/12 12/31/12 $0.41 $0.14 $0.46 $0.17 $0.38 $0.19 $0.39 $0.21 $0.39 $0.23 $0.46 $0.25 $0.52 $0.27 $0.62 $0.28 $0.56 $0.28 $0.10 $0.14 Earnings per share Dividends per share Information reflects the exchange as a result of the conversion and offering completed in April 2012

EAGLE BANCORP MONTANA Questions?